Sample Category Title
Commodities Year Ahead 2023: Gold and Oil Outlook Tied to Fed and Ukraine
The entire commodities spectrum rallied in the first half of 2022 as the war in Ukraine sparked major supply concerns for energy and agricultural commodities. But heading into 2023, it is demand concerns that have taken over and are clouding the outlook. Gold and oil have lost their shine amid worries that the Fed and other central banks may overtighten, and that China is not doing enough to boost its economy after a year of jumping in and out of lockdowns. Will there be a turning point in 2023 or are even deeper losses in store?
Will gold shine more in 2023?
Historically, gold was considered a safe-haven asset, but that narrative changed this year. Yes, it hit a record high in August 2020 as investors sought shelter in precious metal due to the outbreak of the coronavirus pandemic and came just shy of retesting that record in early March following Russia’s invasion of Ukraine. That said, it was all downhill thenceforth, even as concerns about the performance of the global economy remained elevated.
With inflation getting out of hand due to the supply shortages caused by the pandemic and the war in Ukraine, central banks around the globe are prioritizing the fight against inflation rather than restoring economic activity. Ergo, as interest rates around the globe rose at a fast pace this year, at least up until a couple of months ago, the non-yielding gold lost its allure. The title of the ultimate safe haven was passed to the US dollar as with the Fed raising rates more aggressively than other major central banks, it became the only safe-haven currency that also offered high yields. Gold has therefore developed a positive relationship with equities, while reinforcing its negative one with the dollar.
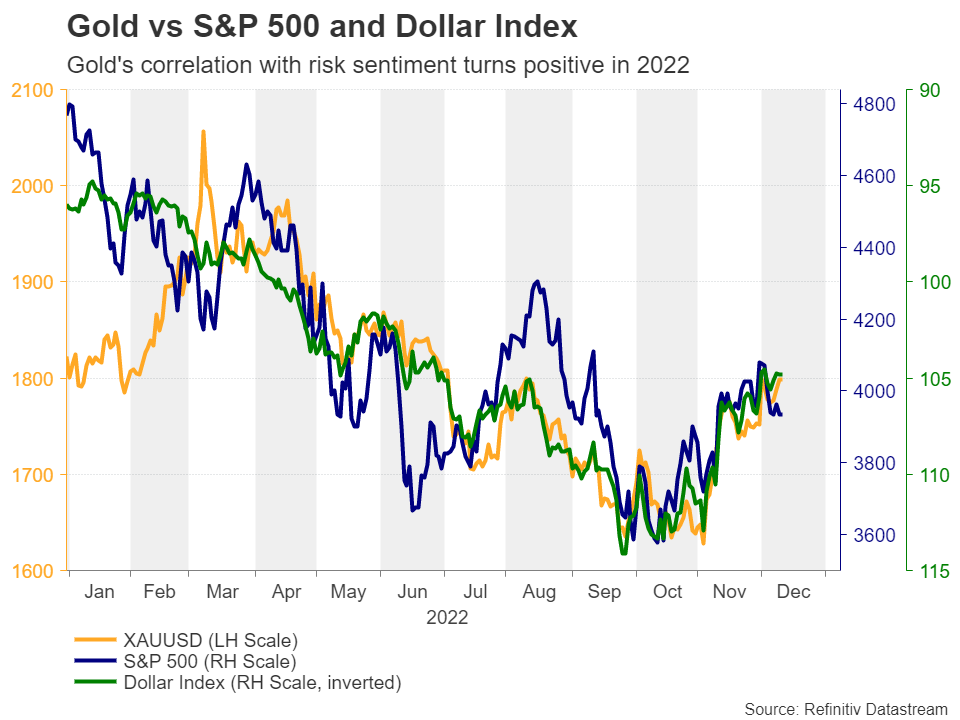
That relationship is also the reason why the precious metal has staged such a comeback in November. With inflation in the US coming down faster than previously anticipated, investors have significantly lowered their expectations with regards to the Fed’s future course of action.
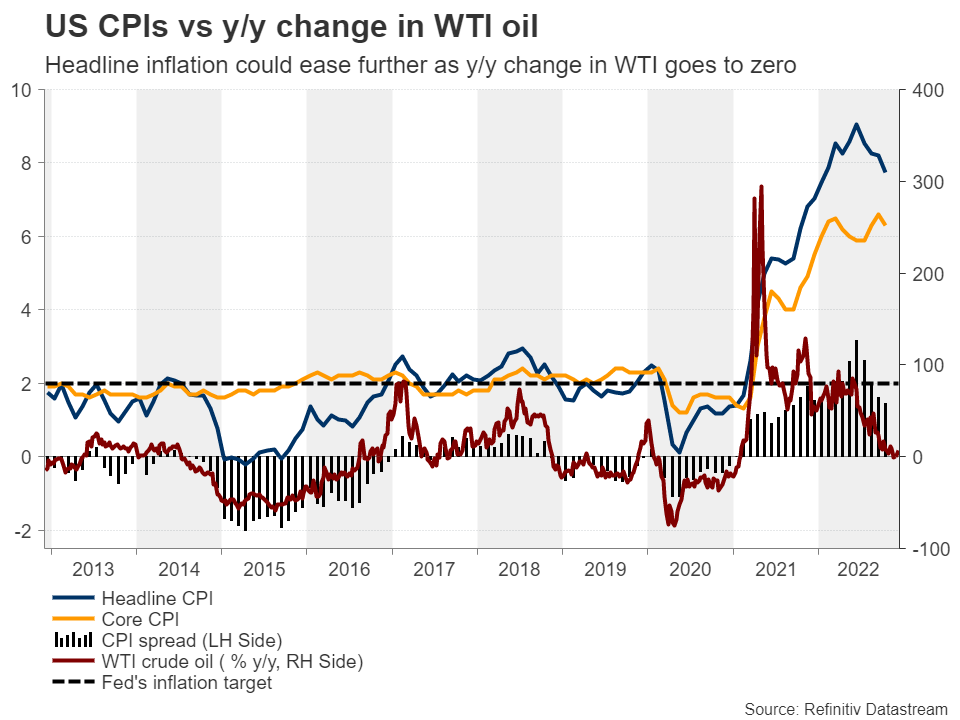
A worsening of the global outlook in the coming months as the effect of higher interest rates continue to be reflected in the data could well weigh on equities, while the dollar could attract some safe-haven flows, resulting in another leg south in gold. However, with the base effect of the rally in oil prices expected to drop out from the year-on-year consumer-price calculations in coming months, headline inflation may continue to come down in 2023. This would add credence to investors’ assessment of a potential Fed pivot sooner rather than later and may limit any losses in the yellow metal.
Combined with deeper economic wounds, expectations of lower interest rates during the second half of 2023 could even allow bullion to reclaim its safe-haven status in an environment where yielding assets are not as attractive anymore. Therefore, even if gold pulls back at the start of 2023, it could very well shine again thereafter, perhaps during the second quarter or second half of the year.
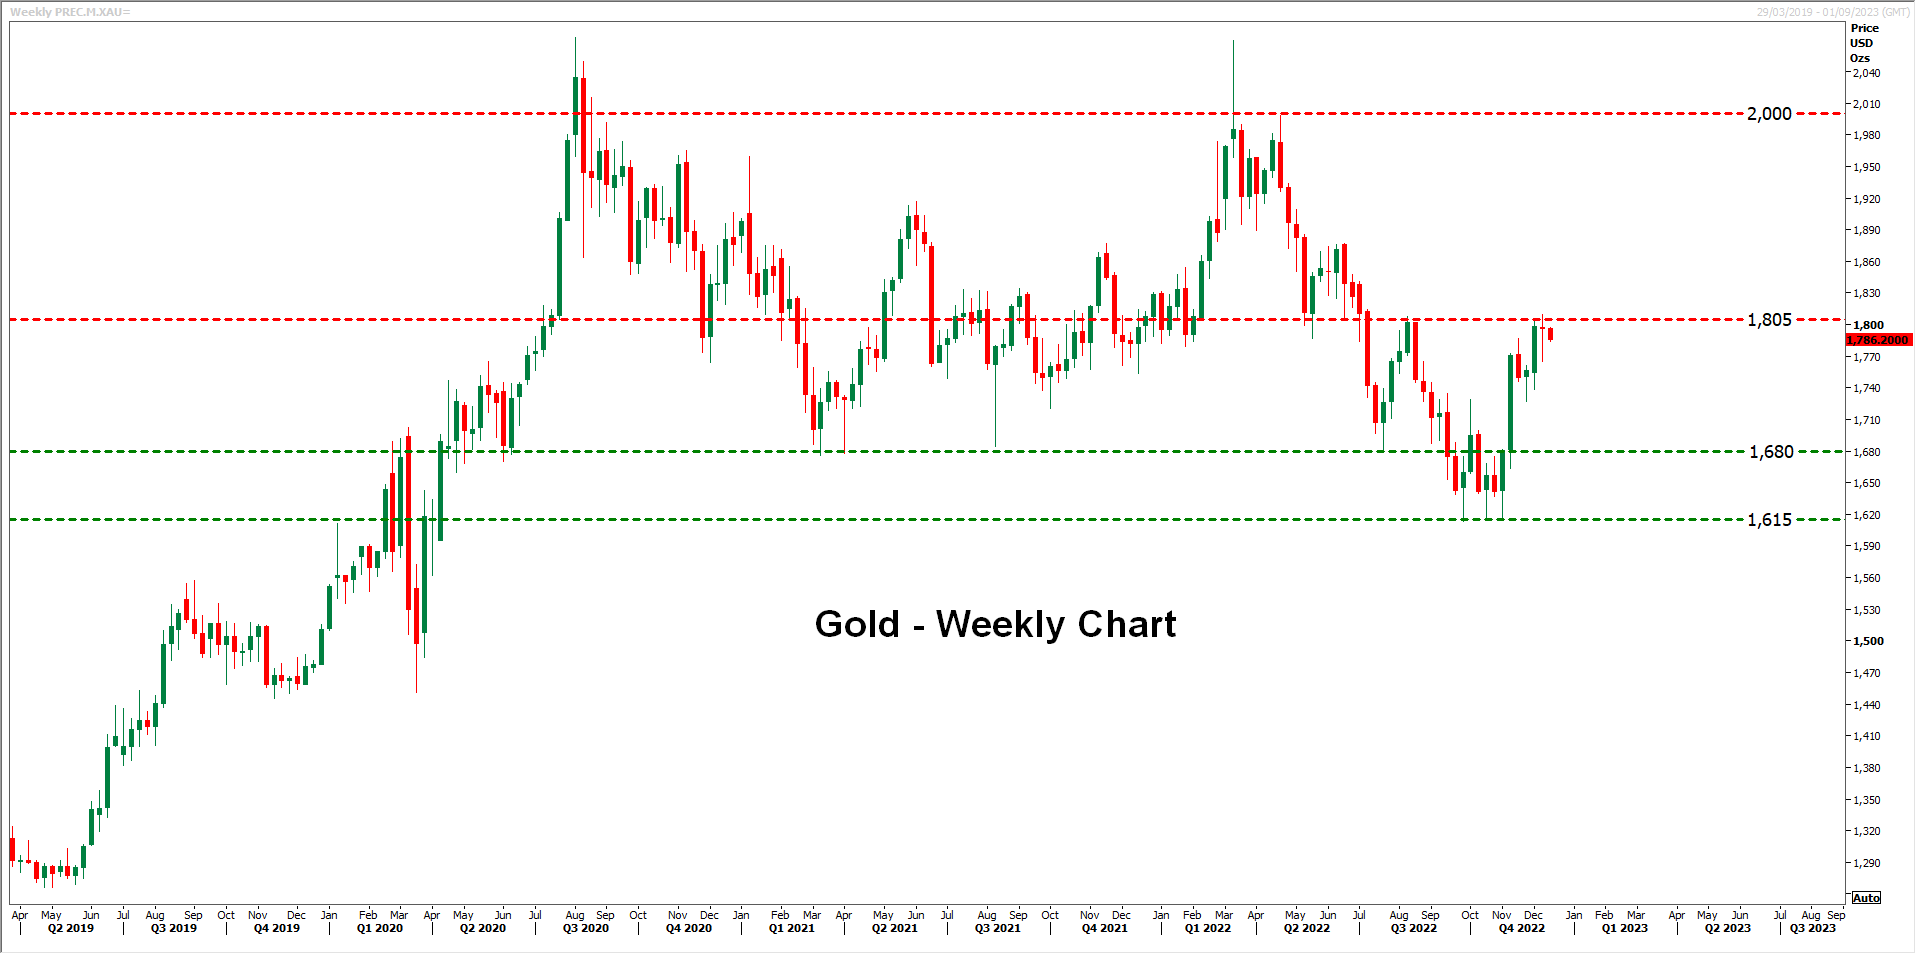
A potential retreat in gold could encourage some buyers to enter the game from near the $1,680 zone which acted as a floor between April 2020 and July 2022. If the rebound is strong enough to take the metal above the $1,805 zone, the rally could extend towards the high of April 18, near the psychological round number of $2,000. For the picture to turn bearish again, a break below the temporary floor of $1,615 may be needed, as this will confirm a lower low on the weekly and monthly charts.
Copper and iron ore traders keep gaze locked on China
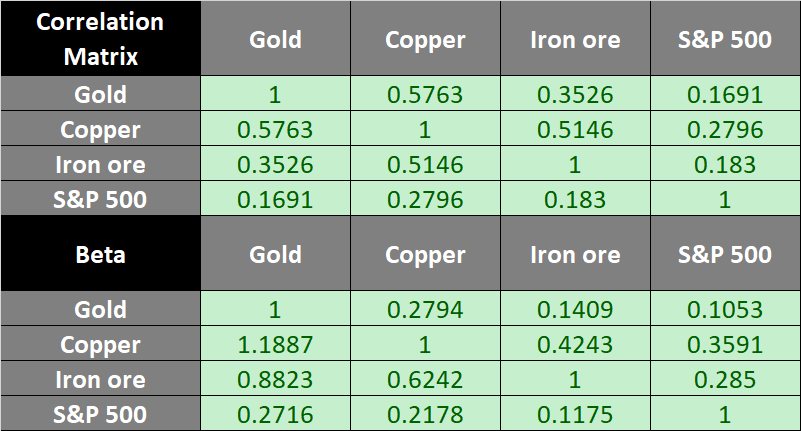
Industrial metals, like copper and iron ore traded in a more volatile manner during 2022, suggesting a stronger link to changes in risk sentiment. Indeed, the correlation coefficients as well as the betas of both copper and iron ore with the S&P 500 have been higher than those of gold, with copper holding first place and confirming its “global economic bellwether” status due to every major sector of the global economy using copper. That said, both metals may have an extra sensitivity to developments surrounding China, as the world’s second largest economy is the number one importer of both copper and iron ore, while it holds the third place in terms of production.
Thus, further weakening of global manufacturing activity and a further slowdown of China’s economy due to the COVID related restrictions and the battered property sector may keep weighing on industrial metals for a while longer. However, hopes of more loosening of restrictions, albeit at a slow pace, and an eventual reopening could keep any setback limited and even lead to a rebound.
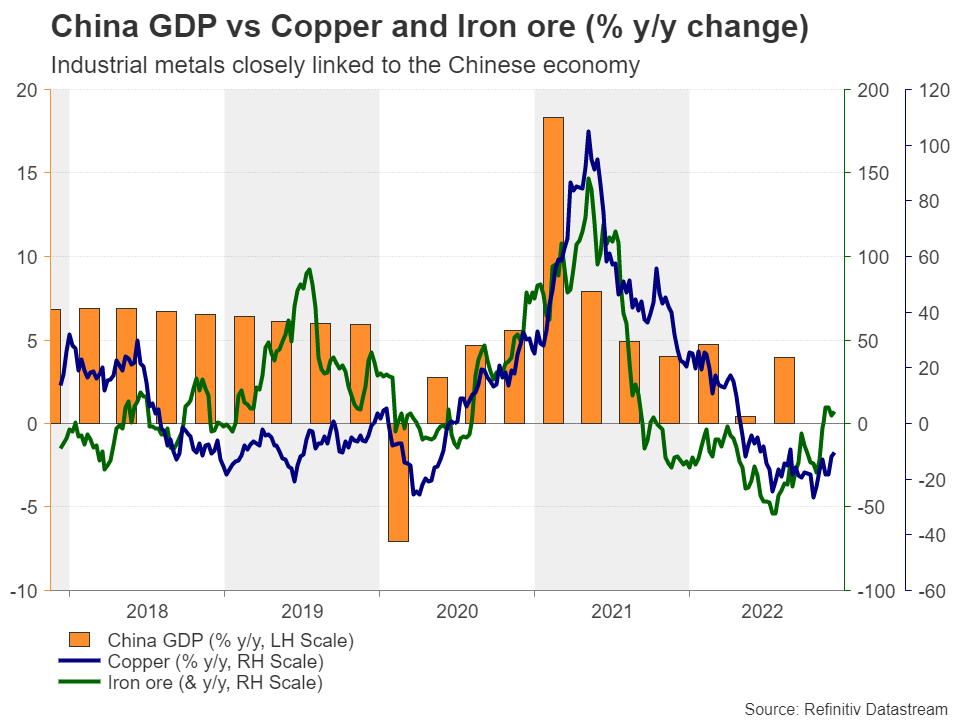
With the global outlook expected to be gloomier though in the next few months, those industrial metals may rebound at a later stage than gold, as gold could enjoy some safe-haven flows at a time when the others are still feeling the heat of the deteriorating global economic activity.
As crude oil languishes, a comeback cannot be ruled in 2023
It is no exaggeration to say that it’s been one big rollercoaster year for crude oil. Having started 2022 at $75 a barrel, oil prices skyrocketed soon after, spiking above $130, as the terrible events unfolded in Ukraine. But with 2022 almost over, oil prices have wiped out all those gains amid growing pessimism about the demand outlook.
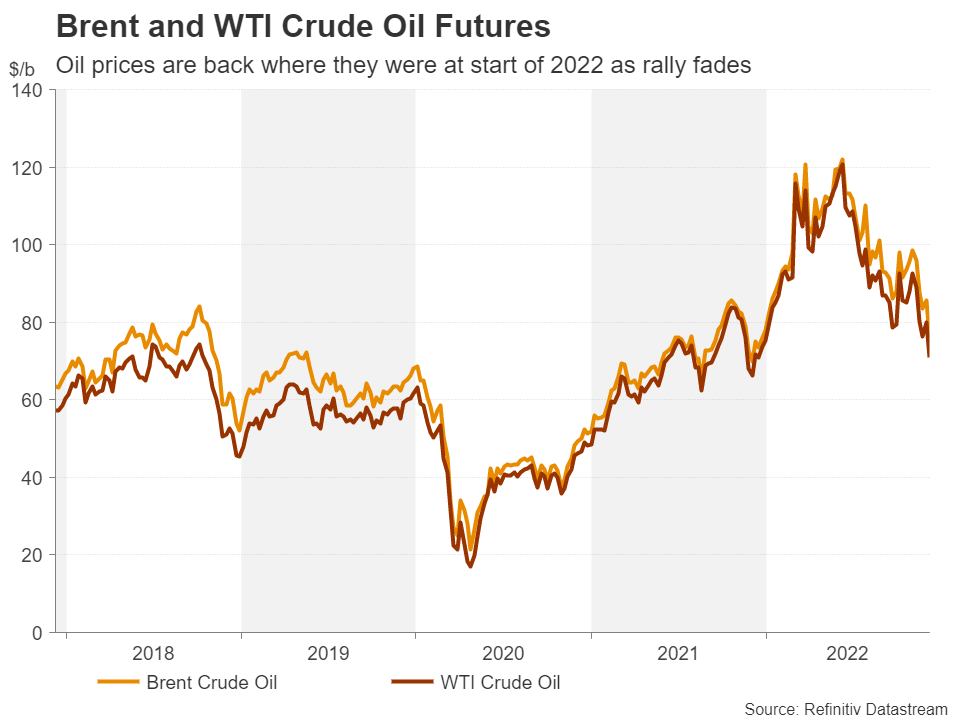
The concerns primarily centre on the expectations that the major economies are headed for recession, with some likely already in one, even as it becomes increasingly difficult for Russia – the world’s second largest oil producer – to tap into the oil market. Russia’s war on Ukraine prompted several countries to restrict Russian energy imports, amongst a host of other products. But those sanctions have just gotten a lot tougher.
The G7, along with the European Union and Australia, have agreed to implement a price cap on seaborne Russian oil. The way the price cap works is complicated and there are question marks about how successful it will be. The Americans and Europeans effectively want to prevent Russia from selling oil at a price higher than $60/barrel with the intention of slashing Moscow’s oil revenue. But there is a cost, as they would further cut off Russian oil from the market at a time when energy prices remain relatively high.
The threat of supply tightening significantly over the course of the year is the biggest upside risk for the commodity in 2023, something that could be accentuated if demand from China continues to stabilize or even start to increase soon. But that’s not all.
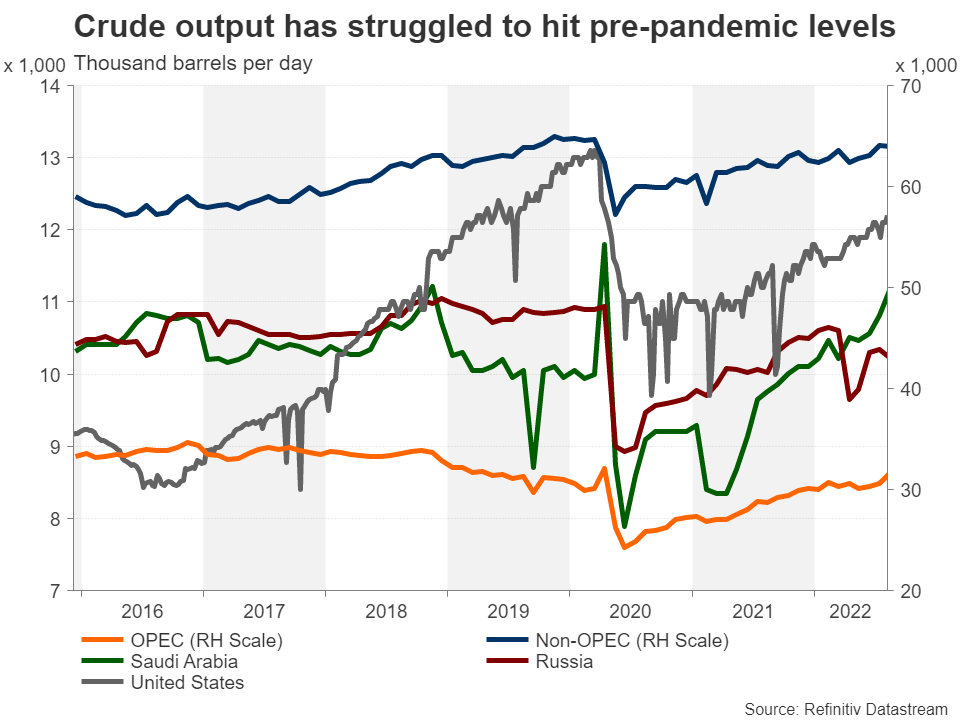
Looking further afield to next winter, there is a danger of another positive shock for oil and other energy prices. A mild autumn in 2022, the ability of European nations to stock up on oil and gas before the sanctions fully kicked in, and demand destruction caused by the price surge from earlier this year have all contributed to energy prices sharply coming off their March and June peaks.
Unless there is additional demand destruction, which would be extremely difficult without a steep global recession and even more so if China reopens its economy, oil supply could tighten substantially further, pushing prices higher again in the second half of 2023.
But this isn’t the only uncertainty that hangs over the outlook. It is yet unclear to what extent the oil price cap will impede the flow of Russian oil and whether OPEC would attempt to offset those losses with a production increase. Moscow has said it will not agree to the price cap, although it is already being forced to sell at a heavy discount from the market price amid the ban from many countries.
If Russian oil continues to make its way into the market, and let’s not forget, it was never the West’s intention to completely block all exports as that’s not desirable for neither side, there may be more downside for oil futures in 2023, at least in the first half.
European gas crisis: the worst may be over
The outlook for natural gas is similarly cloudy. Dutch Natural Gas Futures (TTF) have fallen about 60% from their August peak when the price hit 345 euros/MWh, as efforts by European governments to reduce consumption as well as to find alternative sources of natural gas other than Russia appear to have gone some way in easing the shortages.
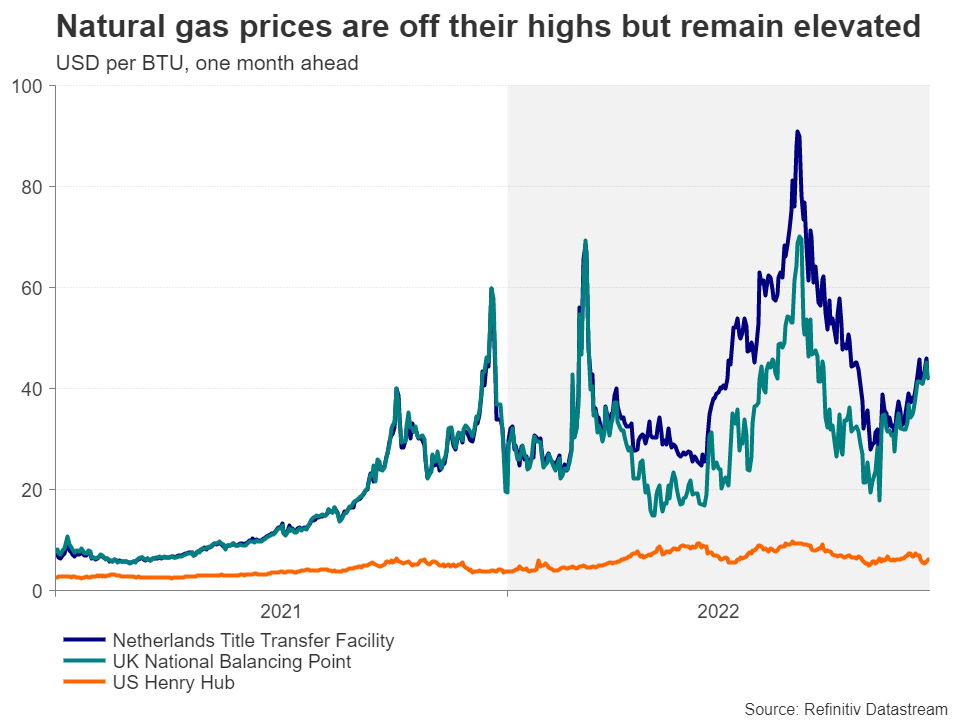
However, going forward, much will depend on how quickly European countries are able to replace Russian gas with either renewable energy or secure long-term supplies from elsewhere, such as liquified natural gas (LNG) exports from the United States. Both would require heavy investment of new infrastructure to become viable alternatives – something that could take years.
The only problem here is that unlike oil exports where it’s the Europeans that don’t want to buy Russian oil, it is Russia that does not want to sell gas to the Europeans. Gas flows across the continent have dwindled, and with the crucial Nord Stream pipeline now damaged and no longer operational, it would be impossible for Russian supplies to return to pre-crisis levels even if the war were to end.
This means that in spite of the recent pullback and the likelihood of some further declines, as well as barring any surprises from the Russia-Ukraine conflict or a prolonged cold snap this winter, gas prices are set to stay at historically elevated levels for the foreseeable future.
US CPI Could Shake Up FOMC Decision
Usually, we have all the key data points ahead of an FOMC decision to make a better evaluation of what could happen. But this time, the most important data for the Fed will be released during the first day of their meeting, later today. Then tomorrow the FOMC releases its decision.
Depending on what the data says, there might be a significant reevaluation of what the Fed will do tomorrow, and what it might signal for the start of the new year. Both factors are expected to be determinate for the market's reaction, as it prices in expectations for where the rates will be in the coming months.
Another CPI surprise?
We should remember that last time around, the US CPI (for October) came in well below expectations. A look at the components showed that economists hadn't considered just how much the price of housing had fallen that month. Since then, there hasn't been a recovery in this item. Even the largest element to drive inflation, energy costs, has been sliding downward in the meantime, as crude prices come down over fears of a recession.
But, no one can say what the future will hold. Inflation coming in lower than expected is unlikely to change what the markets are expecting of the Fed. Even if there were a major miss on expectations (similar to last time), inflation would still be way above target.
What kind of surprises?
On the other hand, if inflation were to come in hotter than expected, but below the prior level, then the downward trend would still be intact. The Fed would still need to hike, because inflation is still too high, but slowing down the pace is understandable.
Where things could get interesting is if inflation were to come in above the prior level. The headline number doesn't matter so much as the core figure. That would imply another break in the downward trajectory, and could lead to a reevaluation of Fed expectations. Both in terms of what the Fed could decide tomorrow, and what could come after that.
What to expect
Annualized headline inflation is expected to keep falling to 7.3% from 7.7% prior, aided by growth of 0.3% in monthly inflation. The key core inflation rate is expected to fall to 6.1% from 6.3% prior, and a beat by 3 decimals here could be what shakes up expectations.
75% of economists think the Fed will raise rates by 50bps at the next meeting. The remainder are betting on 75bps. But, Powell pretty much foreshadowed that it would be the smaller number - unless there is surprise in the data.
The key issue for the markets is where the Fed sees the "terminal rate" going. That is the maximum rate they will raise to during this cycle. Currently the market is expecting it to reach 5.0% sometime early next year. If the Fed implies the rate will be higher than that, it could lead to the dollar getting stronger.
Germany ZEW rose to -23.3, significant improvement in economic outlook
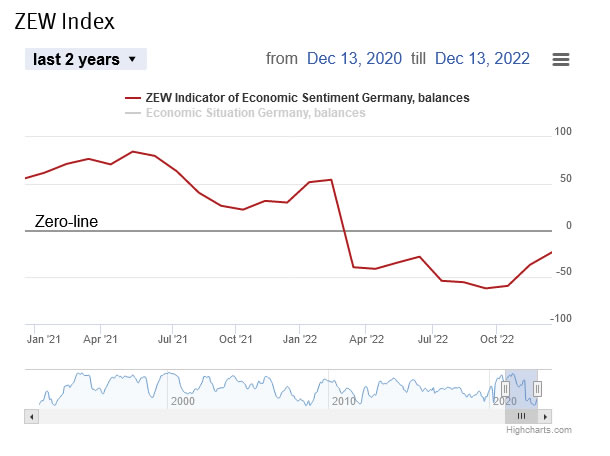
Germany ZEW Economic Sentiment rose from -36.7 to -23.3 in December, above expectation of -26.3. Current Situation Index rose from -64.5 to -61.4, below expectation of -57.0.
Eurozone ZEW Economic Sentiment rose from-38.7 to -23.6, above expectation of -25.3. Current Situation Index rose 7.7 pts to -57.4. Inflation expectation s for Eurozone fell very sharply by -27.1 pts to -79.3.
"The ZEW Indicator of Economic Sentiment rises again significantly in December. The vast majority of financial market experts expect the inflation rate to decline in the coming months. Together with the temporary stabilisation on the energy markets, this leads to a significant improvement in the economic outlook," comments ZEW President Professor Achim Wambach on current expectations.
GBPUSD Remains Muted Ahead of CPI Reports
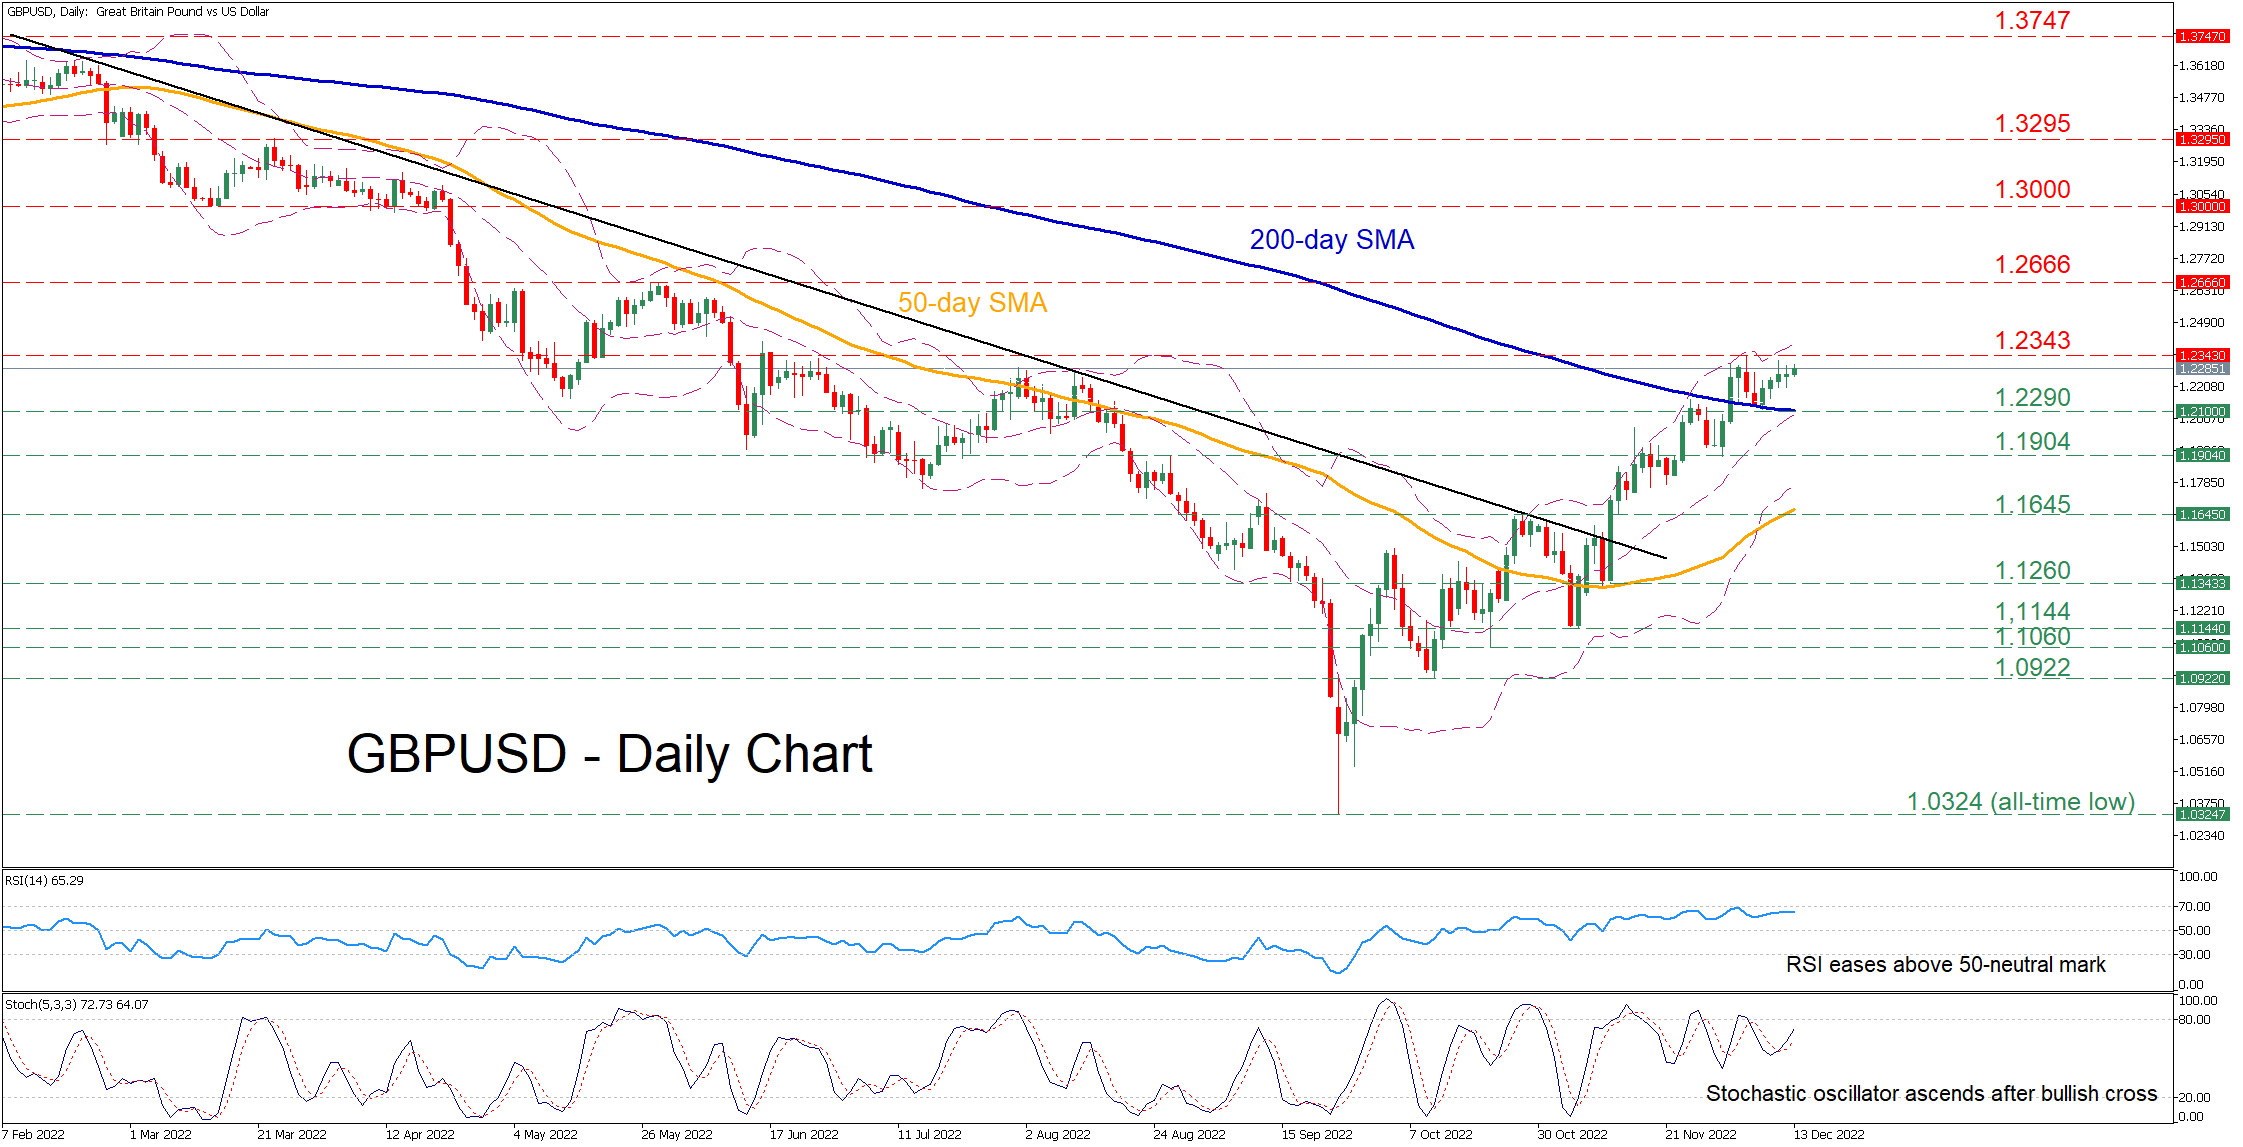
GBPUSD has been attempting a strong rebound after finding its feet at the all-time low of 1.0324 in late September. Even though the pair managed to cross above the crucial 200-day simple moving average (SMA), its advance has come to a halt ahead of the crucial US and UK inflation prints later this week.
The short-term oscillators are currently indicating a bullish near-term tone. Specifically, the RSI is hovering above its 50-neutral mark, while the stochastic oscillator is ascending after posting a bullish cross.
To the upside, bullish actions could propel the price towards the recent resistance of 1.2343. Piercing through this region, the pair could challenge the May peak of 1.2666. Even higher, the 1.3000 psychological mark, which has previously acted as support, could prove to be a tough resistance region.
Alternatively, should the positive momentum fade and the price reverse downwards, initial support could be met at 1.2290, which overlaps with the 200-day SMA. Sliding beneath that floor, the bears might target 1.1904 before the spotlight turns to the October resistance of 1.1645. A violation of the latter could open the door for the 1.1260 hurdle.
Overall, GBPUSD currently appears to be in a consolidation mode ahead of the crucial CPI reports that could provide fresh directional impetus. Therefore, a break above the 1.2343 ceiling would most likely signal the continuation of the pair's recovery, while a dive beneath the 200-day SMA may trigger a downside correction.
GBP/USD: Bulls Hold Under Strong Barriers, Awaiting Signals from Key Events This Week
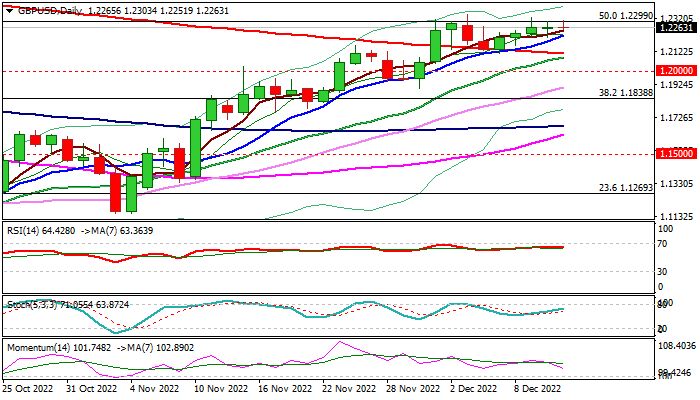
Cable keeps positive tone and continues to pressure key barriers at 1.2300 zone (former top of Aug 1 / 50% retracement of larger 1.4249/1.0348 downtrend), where bulls face strong headwinds for the third consecutive week.
Sustained break through 1.2300 zone barriers and new multi-month high at 1.2344 (Dec 5) would signal continuation of the uptrend from 1.0348 (2022 low, posted on Sep 26) and expose targets at 1.2452 (55WMA) and 1.2666 (May 22 high).
Bullish daily studies support the action but conflict with negative signals on weekly chart (overbought conditions / fading bullish momentum) in addition to last week’s Doji candle which warns that larger bulls might be running of steam.
Rising 10DMA, which tracks the action for one month, offers initial support at 1.2214), with converging 200 and 20DMA’s (1.2111/1.2084 respectively) on track to form bull-cross, expected to contain and keep larger bulls intact.
Traders focus on key events this week, US inflation (today); UK inflation / Fed rate decision (Wednesday); BoE and ECB rate decision (Thursday) which are expected to provide stronger direction signals.
Res: 1.2344; 1.2392; 1.2452; 1.2520.
Sup: 1.2214; 1.2154; 1.2111; 1.2084.
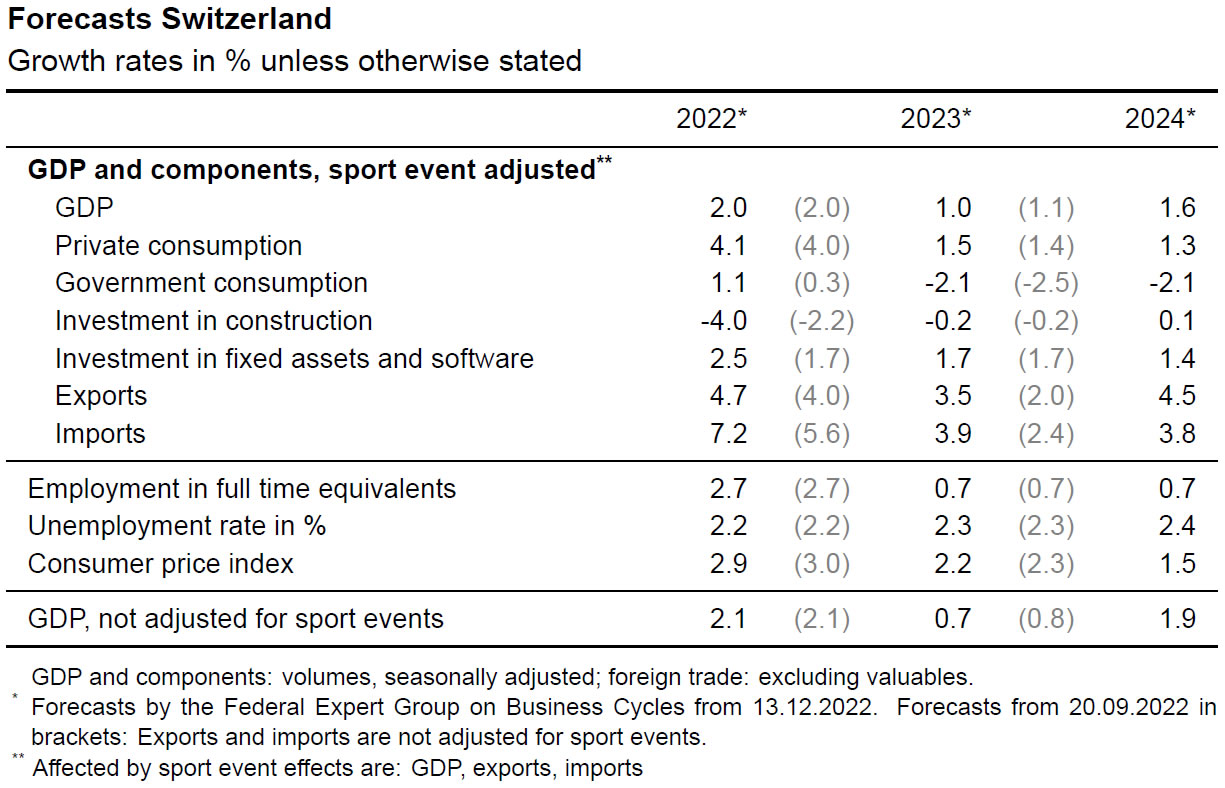
Swiss SECO downgrades 2022 and 2023 inflation forecasts
Swiss State Secretariat for Economic Affairs SECO revised down inflation forecasts for 2022 and 2023. For 2022, CPI is projected to be at 2.9% (comparing with September forecast of 3.0%). 2023 CPI is estimated to be 2.2%, (down from 2.3%.
2022 GDP growth forecast was left unchanged at 2.0%. 2023 GDP growth forecast was downgraded slightly from 1.1% to 1.0%. SECO said, "this would point to sluggish growth for the Swiss economy, but not a severe recession".
SECO added, "Europe's energy situation is projected to gradually normalize after a tense 2023/24 winter. At the same time, inflation rates will likely ease worldwide and the global economy should gradually gain momentum". That would trigger a recovery in Switzerland, with 1.6% GDP growth in 2024, and inflation back below average at 1.5%.
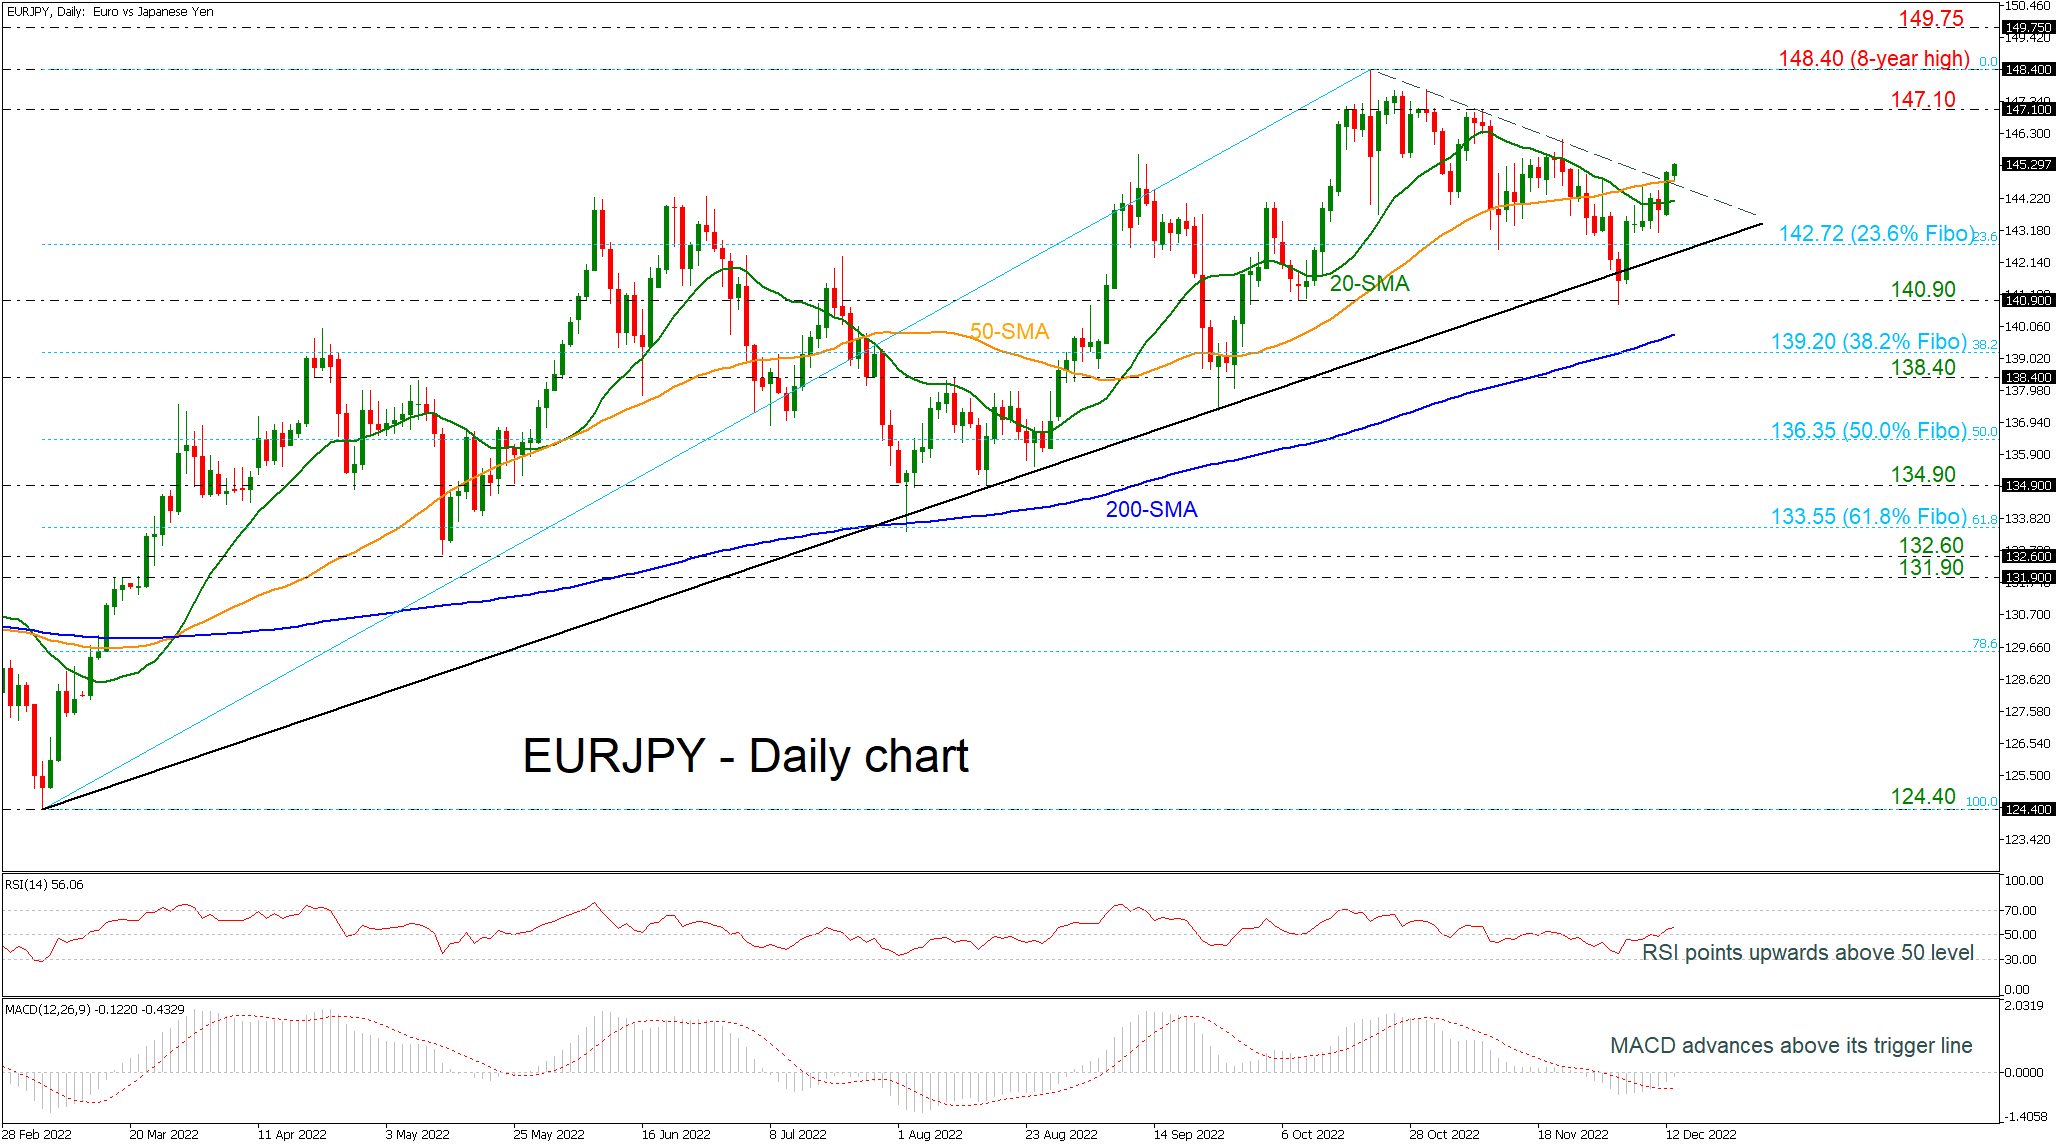
EURJPY Poised for More Recovery Above Near-Term Uptrend Line
EURJPY is surging above the short-term simple moving averages (SMAs) after the strong rebound off the 140.90 support level and the long-term ascending trend line. The pair is currently penetrating the near-term downtrend line to the upside, suggesting that the broader bullish outlook will continue again.
The technical oscillators are mirroring this upside move as the RSI is pointing north above the neutral threshold of 50, while the MACD is surpassing its trigger line, but it is still beneath the zero level.
To the upside, emanating pressure over the last couple of months has denied upside moves. If buyers manage to remain above the falling trend line, a revisit of the 147.10 resistance level could unfold. Overcoming these constrictions could see resistance develop at the eight-year high of 148.40. Another leg up could tackle the peak from December 2014 at 149.75.
Otherwise, if sellers drive the pair below short-term diagonal line again, then the 50- and the 20-day SMAs at 144.80 and 144.17 could interrupt the pair ahead of the 23.6% Fibonacci retracement level of the up leg from 124.40 to 148.40 at 142.72. In the event selling interest persists, the key support region of 140.90 barrier could halt the decline before battling with the 200-day SMA at 139.80. Should it fail to do so, the 38.2% Fibo of 139.20 could challenge the bears, shifting the outlook to negative.
Summarizing, the long-term picture remains positive, while the short-term view is currently switching to bullish as well.
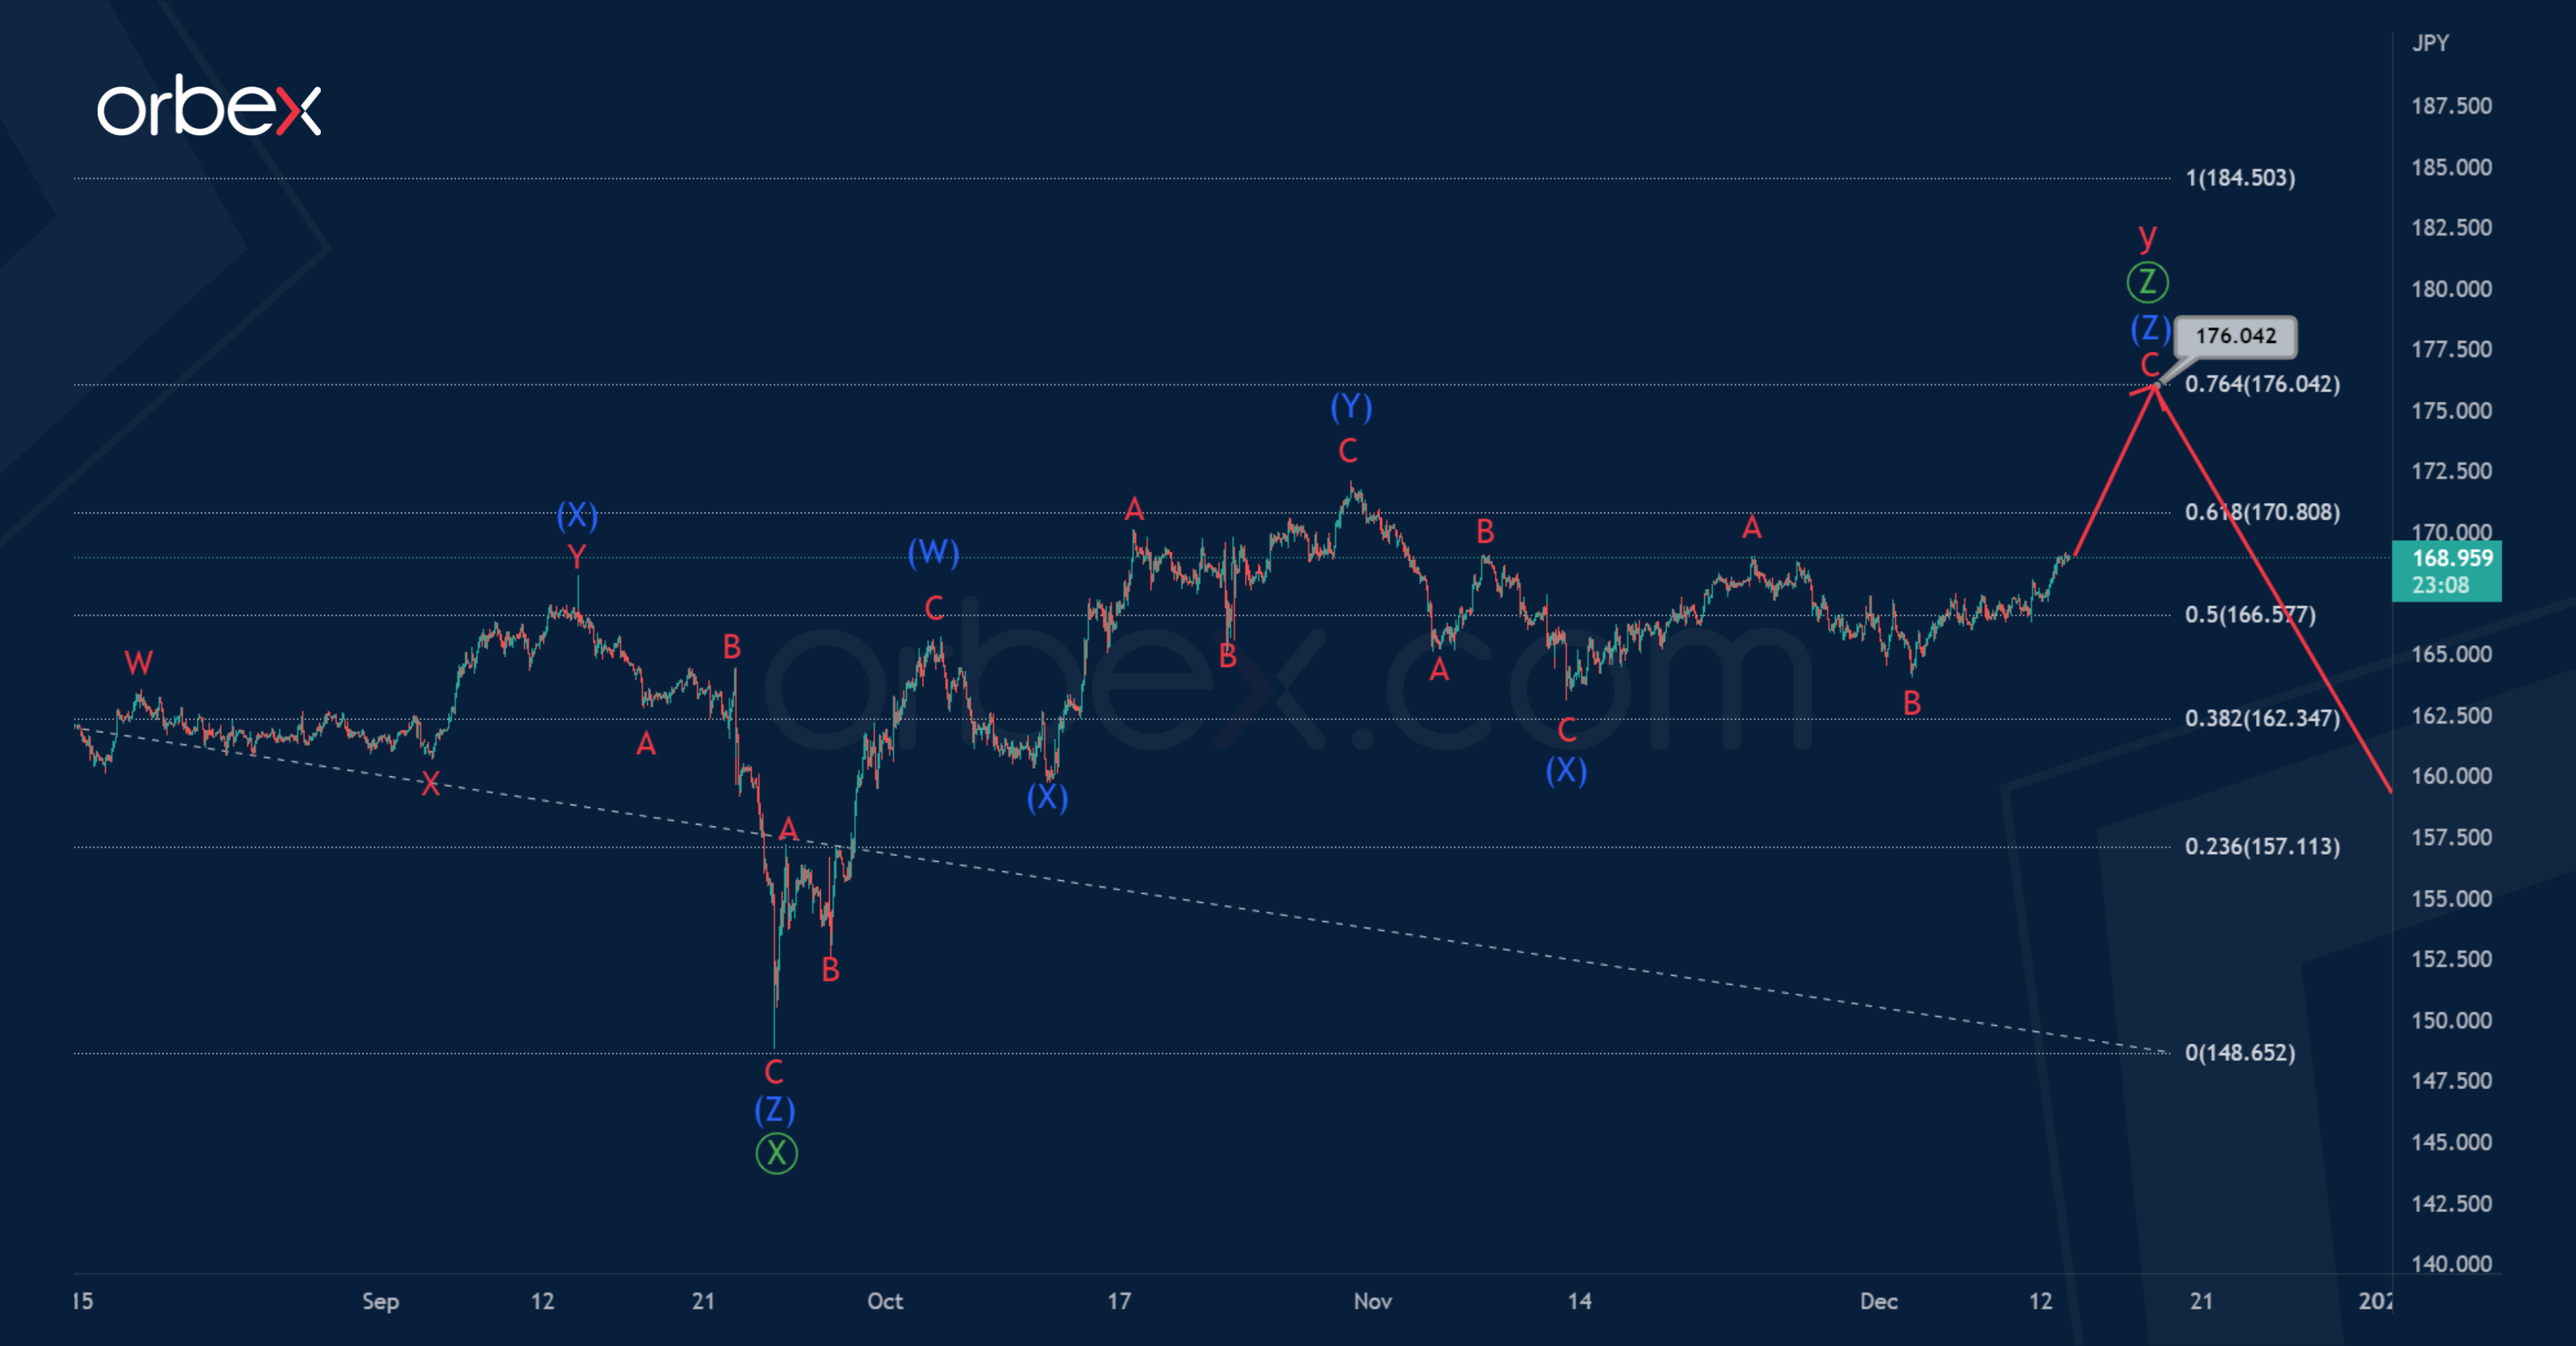
GBP/JPY: Correction Pattern Completion Coming Up
In the long term, GBPJPY seems to be forming a global corrective trend that takes the form of a double zigzag. On the 1H timeframe, the final part of this trend is visible - the actionary wave y of the cycle degree.
It seems that the wave y takes the form of a triple zigzag of the primary degree, which may soon be fully completed. After the end of the second intervening wave, which took the form of a triple combination, the price began to move up.
Most likely, the wave takes the form of a triple zigzag, in which four parts look finished. In the near future, growth is expected within the final intermediate wave (Z). The completion of the entire wave is possible near 176.04. At that level, wave will be at 76.4% of wave.
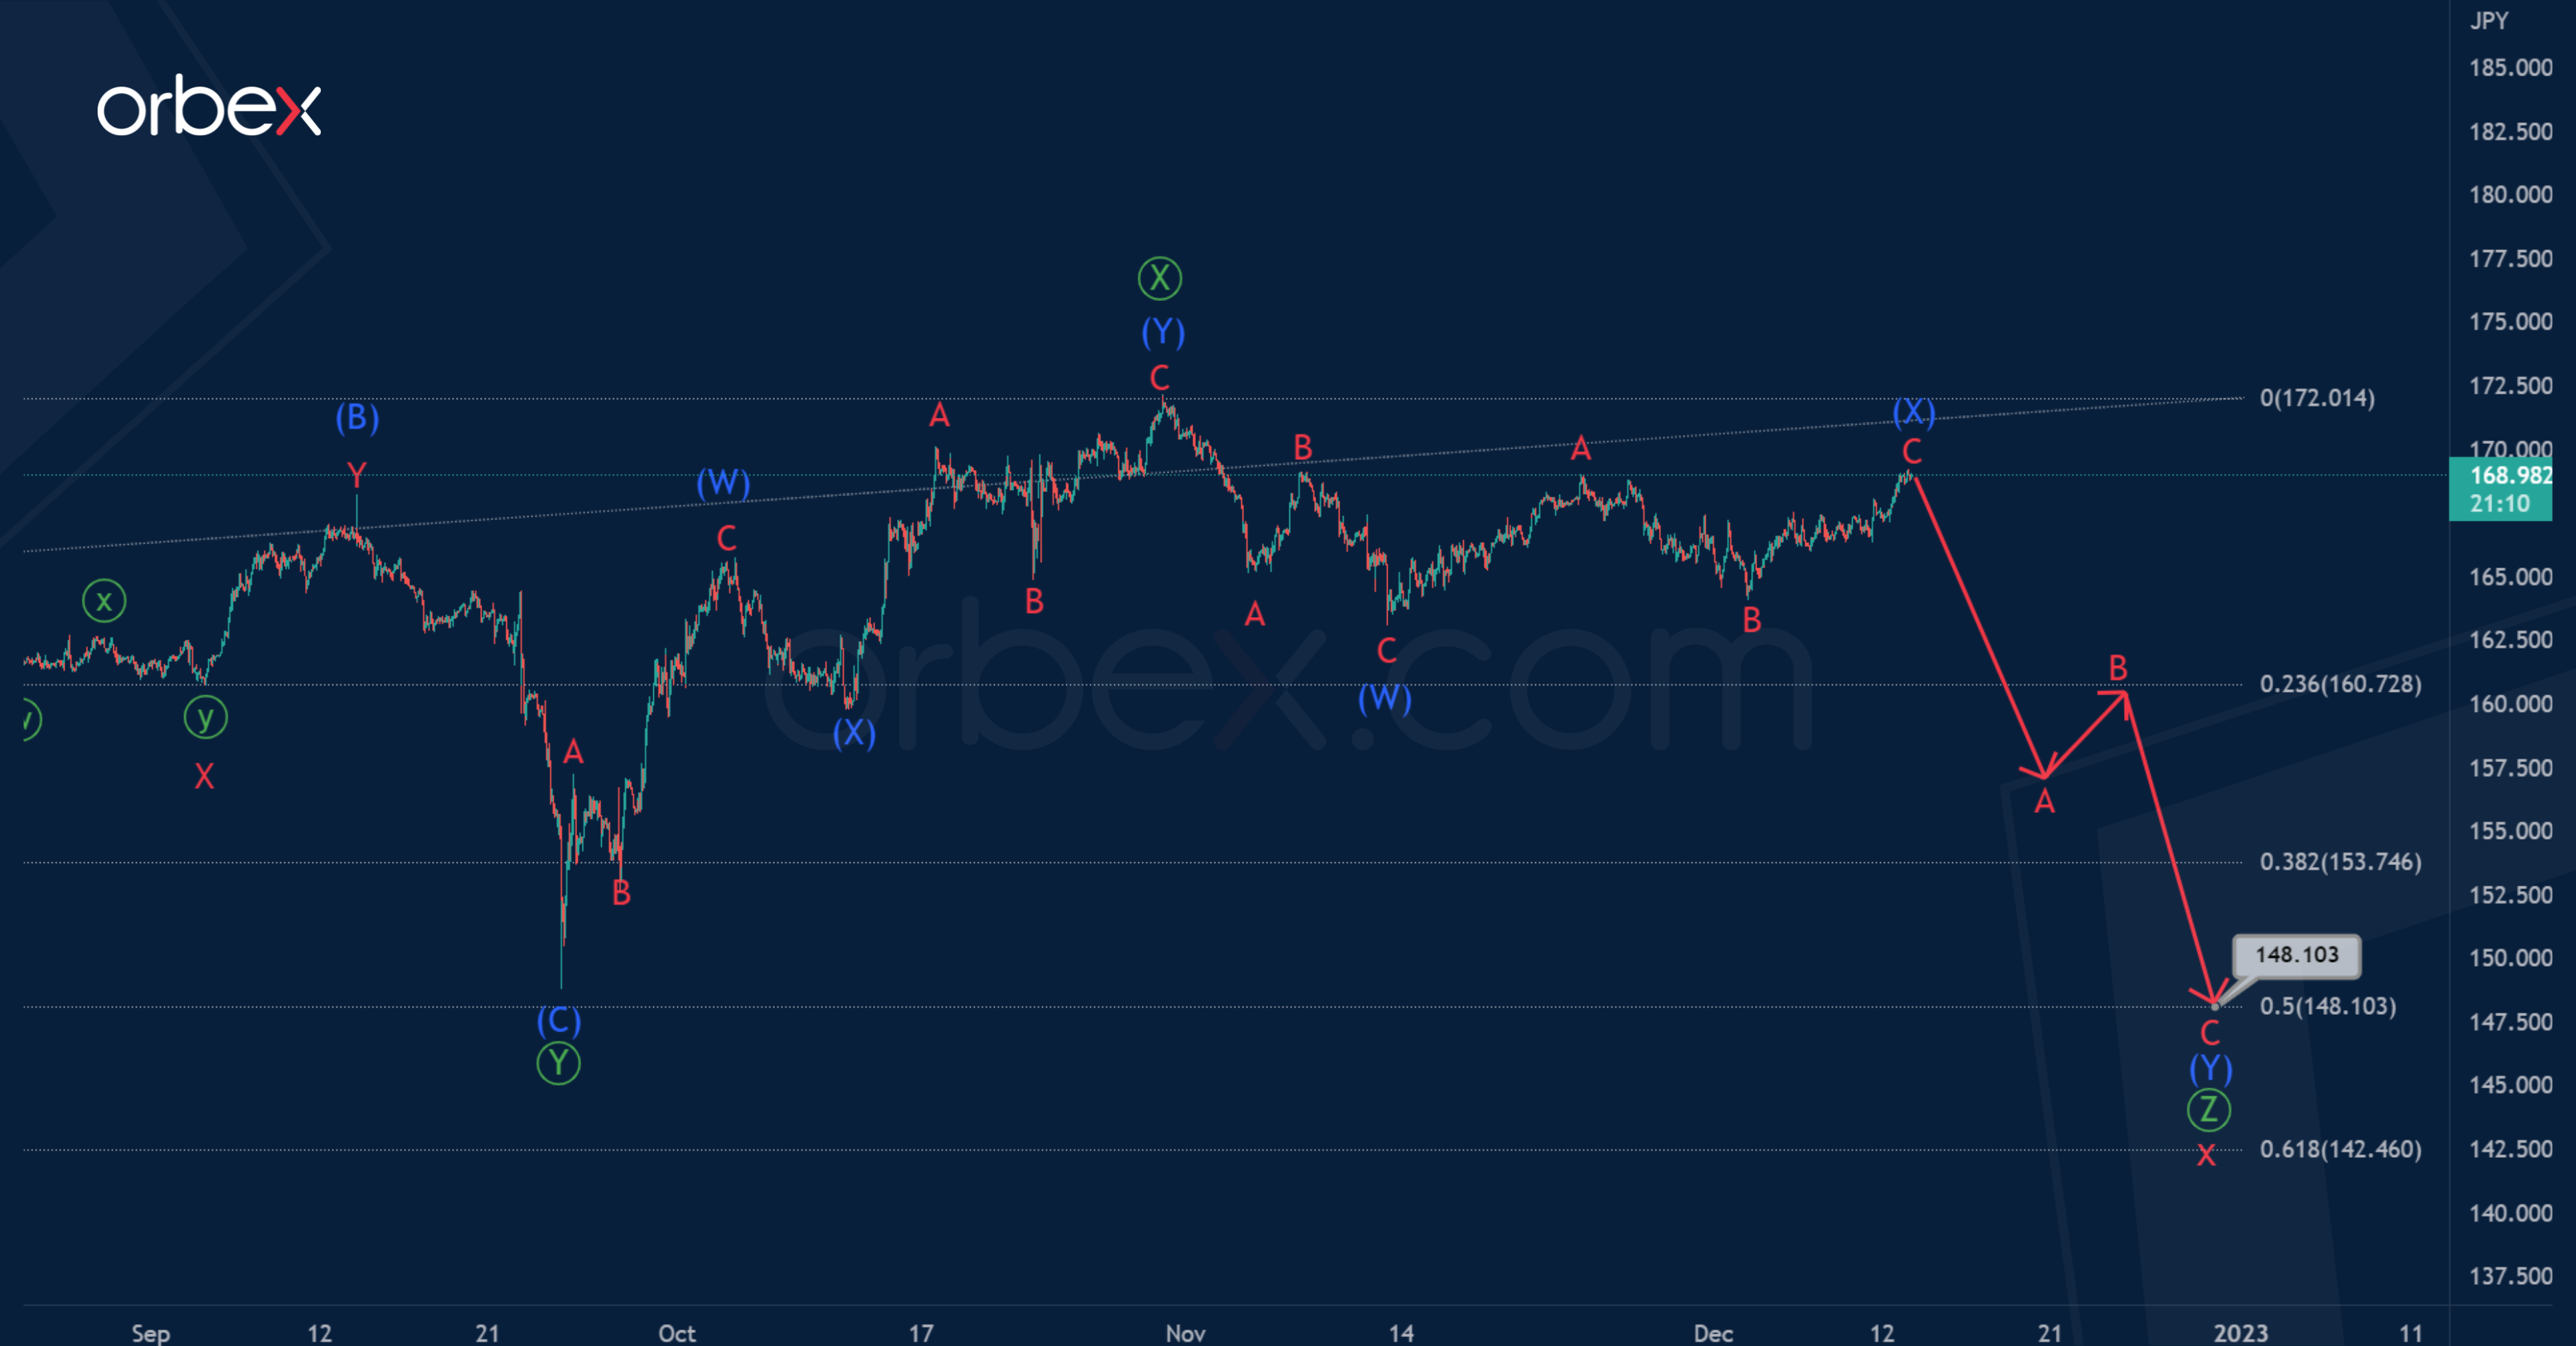
In an alternative scenario, the market builds not a double, but a triple zigzag w-x-y-x-z of the cycle degree. And now its fourth part is being formed, that is, the intervening wave x, which may take the form of a triple zigzag.
It is assumed that the first four parts of the primary correction pattern are fully completed.
Perhaps in the near future, the market will fall in the last wave to 148.10. At that level, cycle wave x will be at 50% along the Fibonacci lines of actionary wave y.
An approximate scheme of possible future movement is shown on the chart.
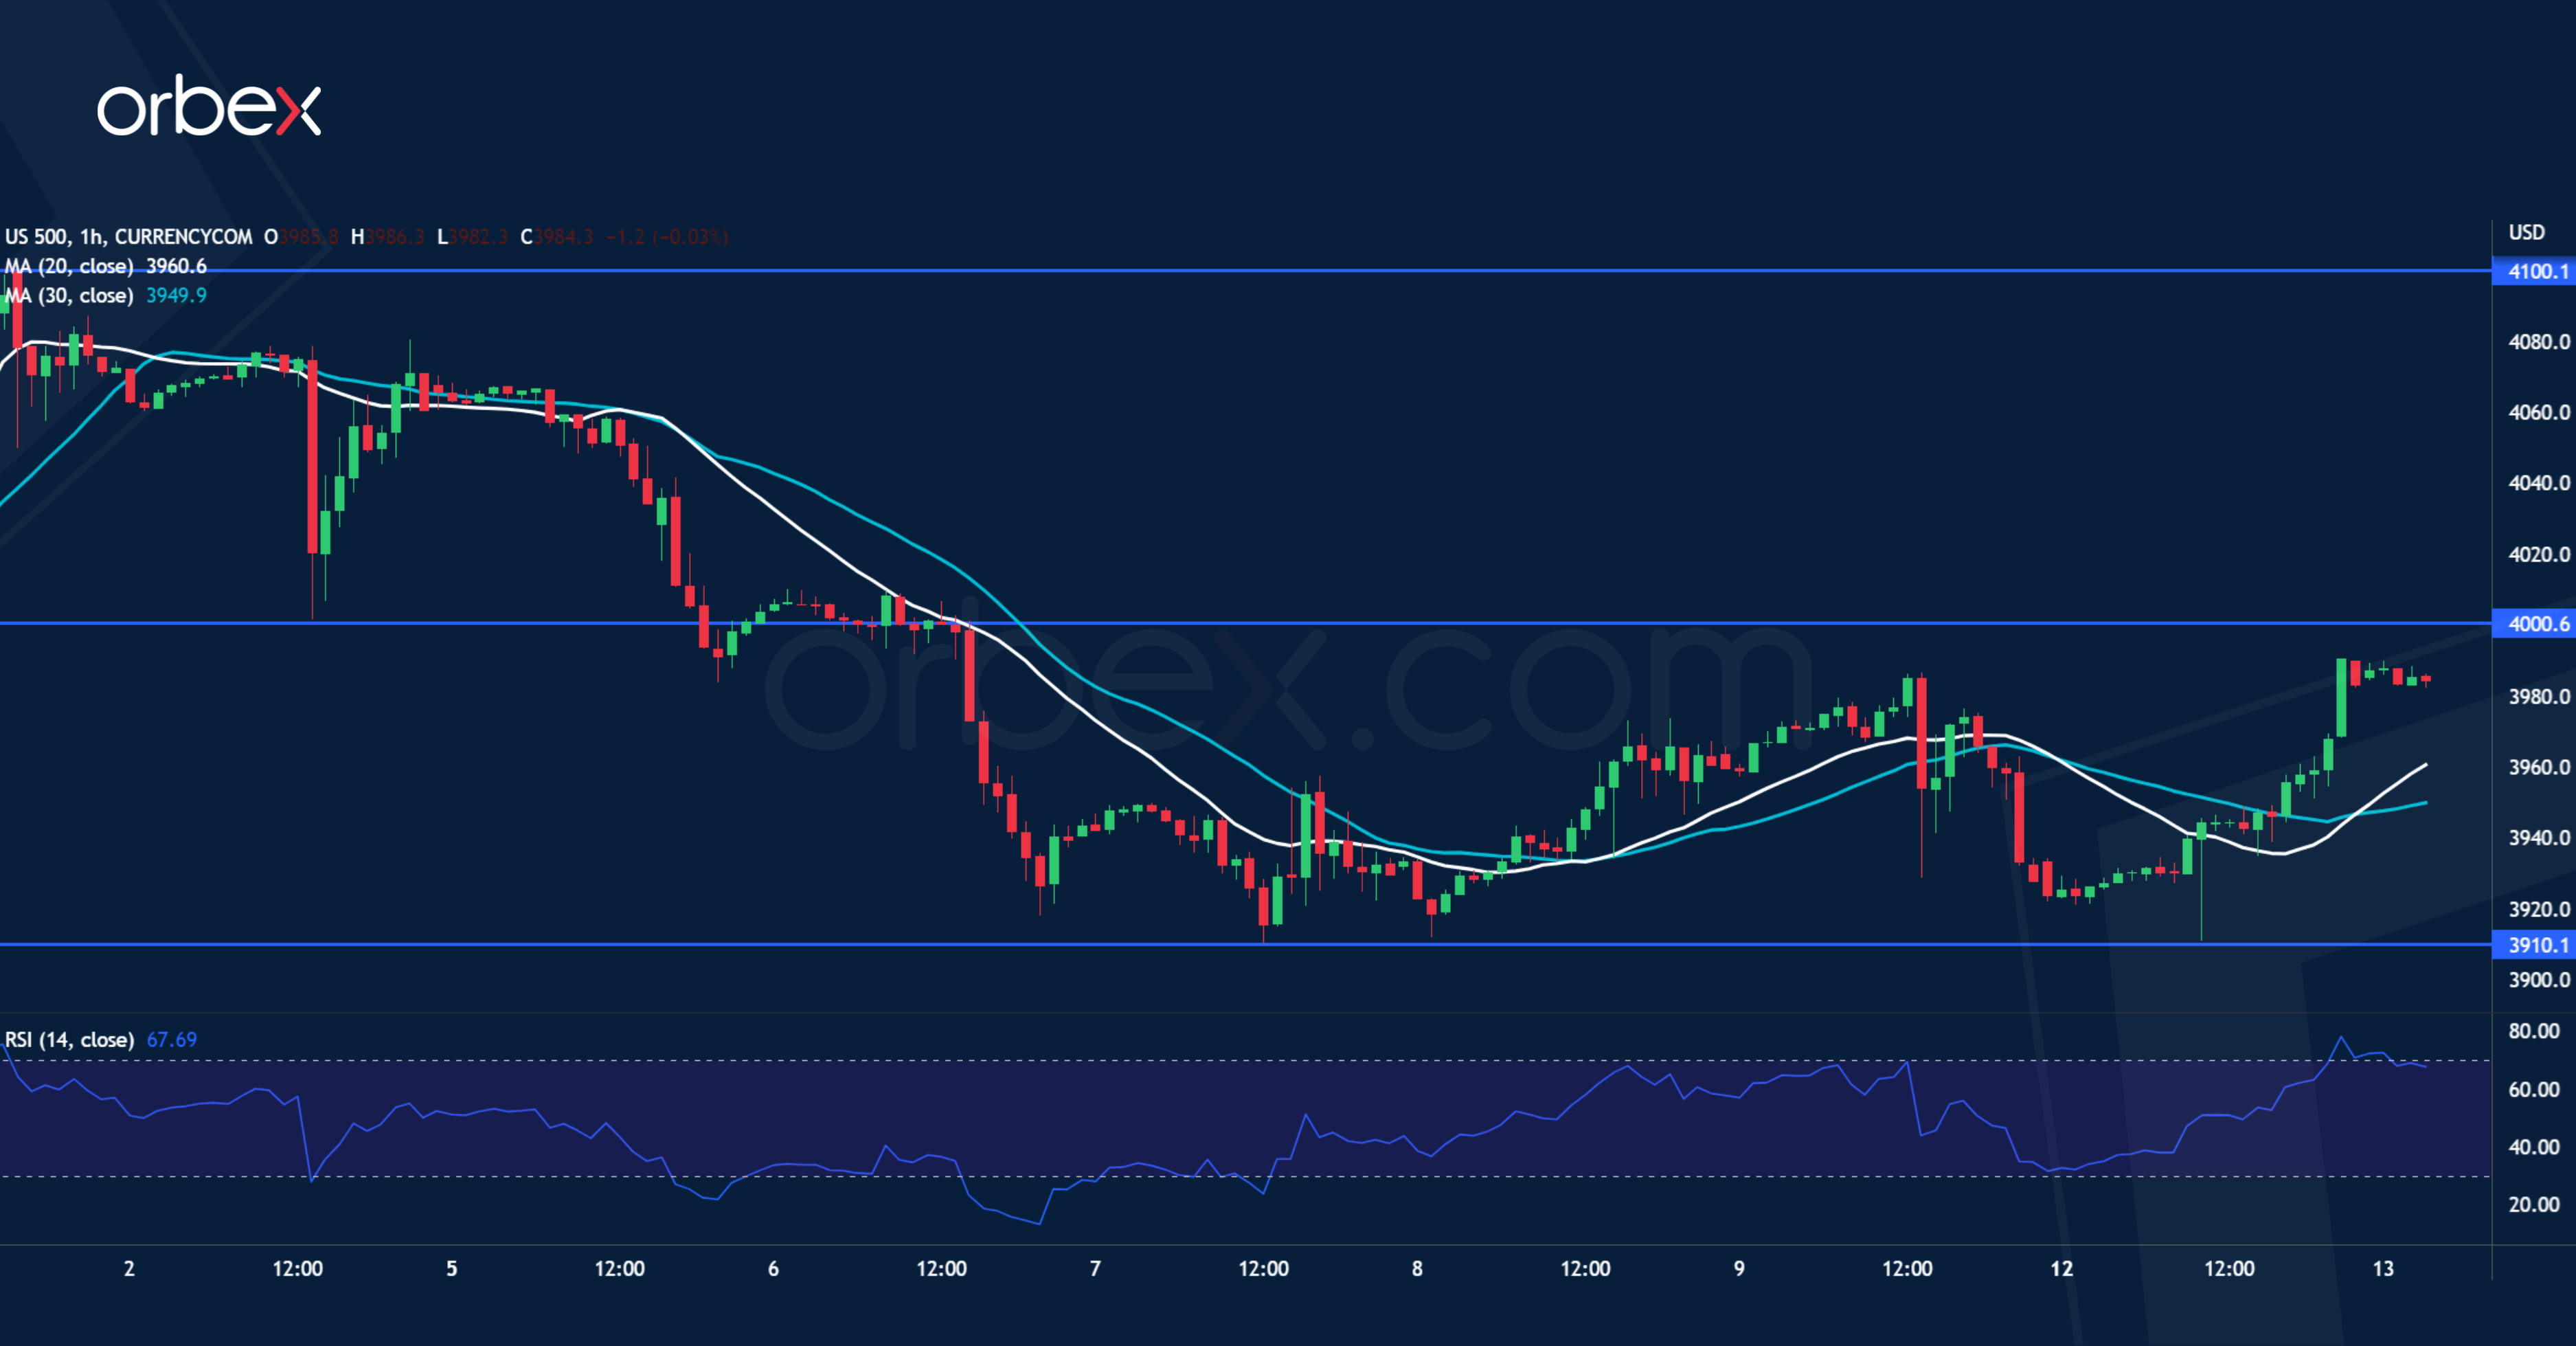
SPX 500 Grinds Key Support
The S&P 500 consolidates as investors await US inflation data later today. After turning south at 4100 near September’s high, the index has struggled to find follow-up bids. A fall through the base of the previous bullish momentum prompted buyers to exit and reassess the mixed mood. The latest rebound to the psychological level of 4000 is an important test and a breakout would open the path to the recent peak at 4100. 3910 is a key level to keep the index afloat as its breach could trigger a liquidation towards 3820.
EUR/GBP Struggles for Support
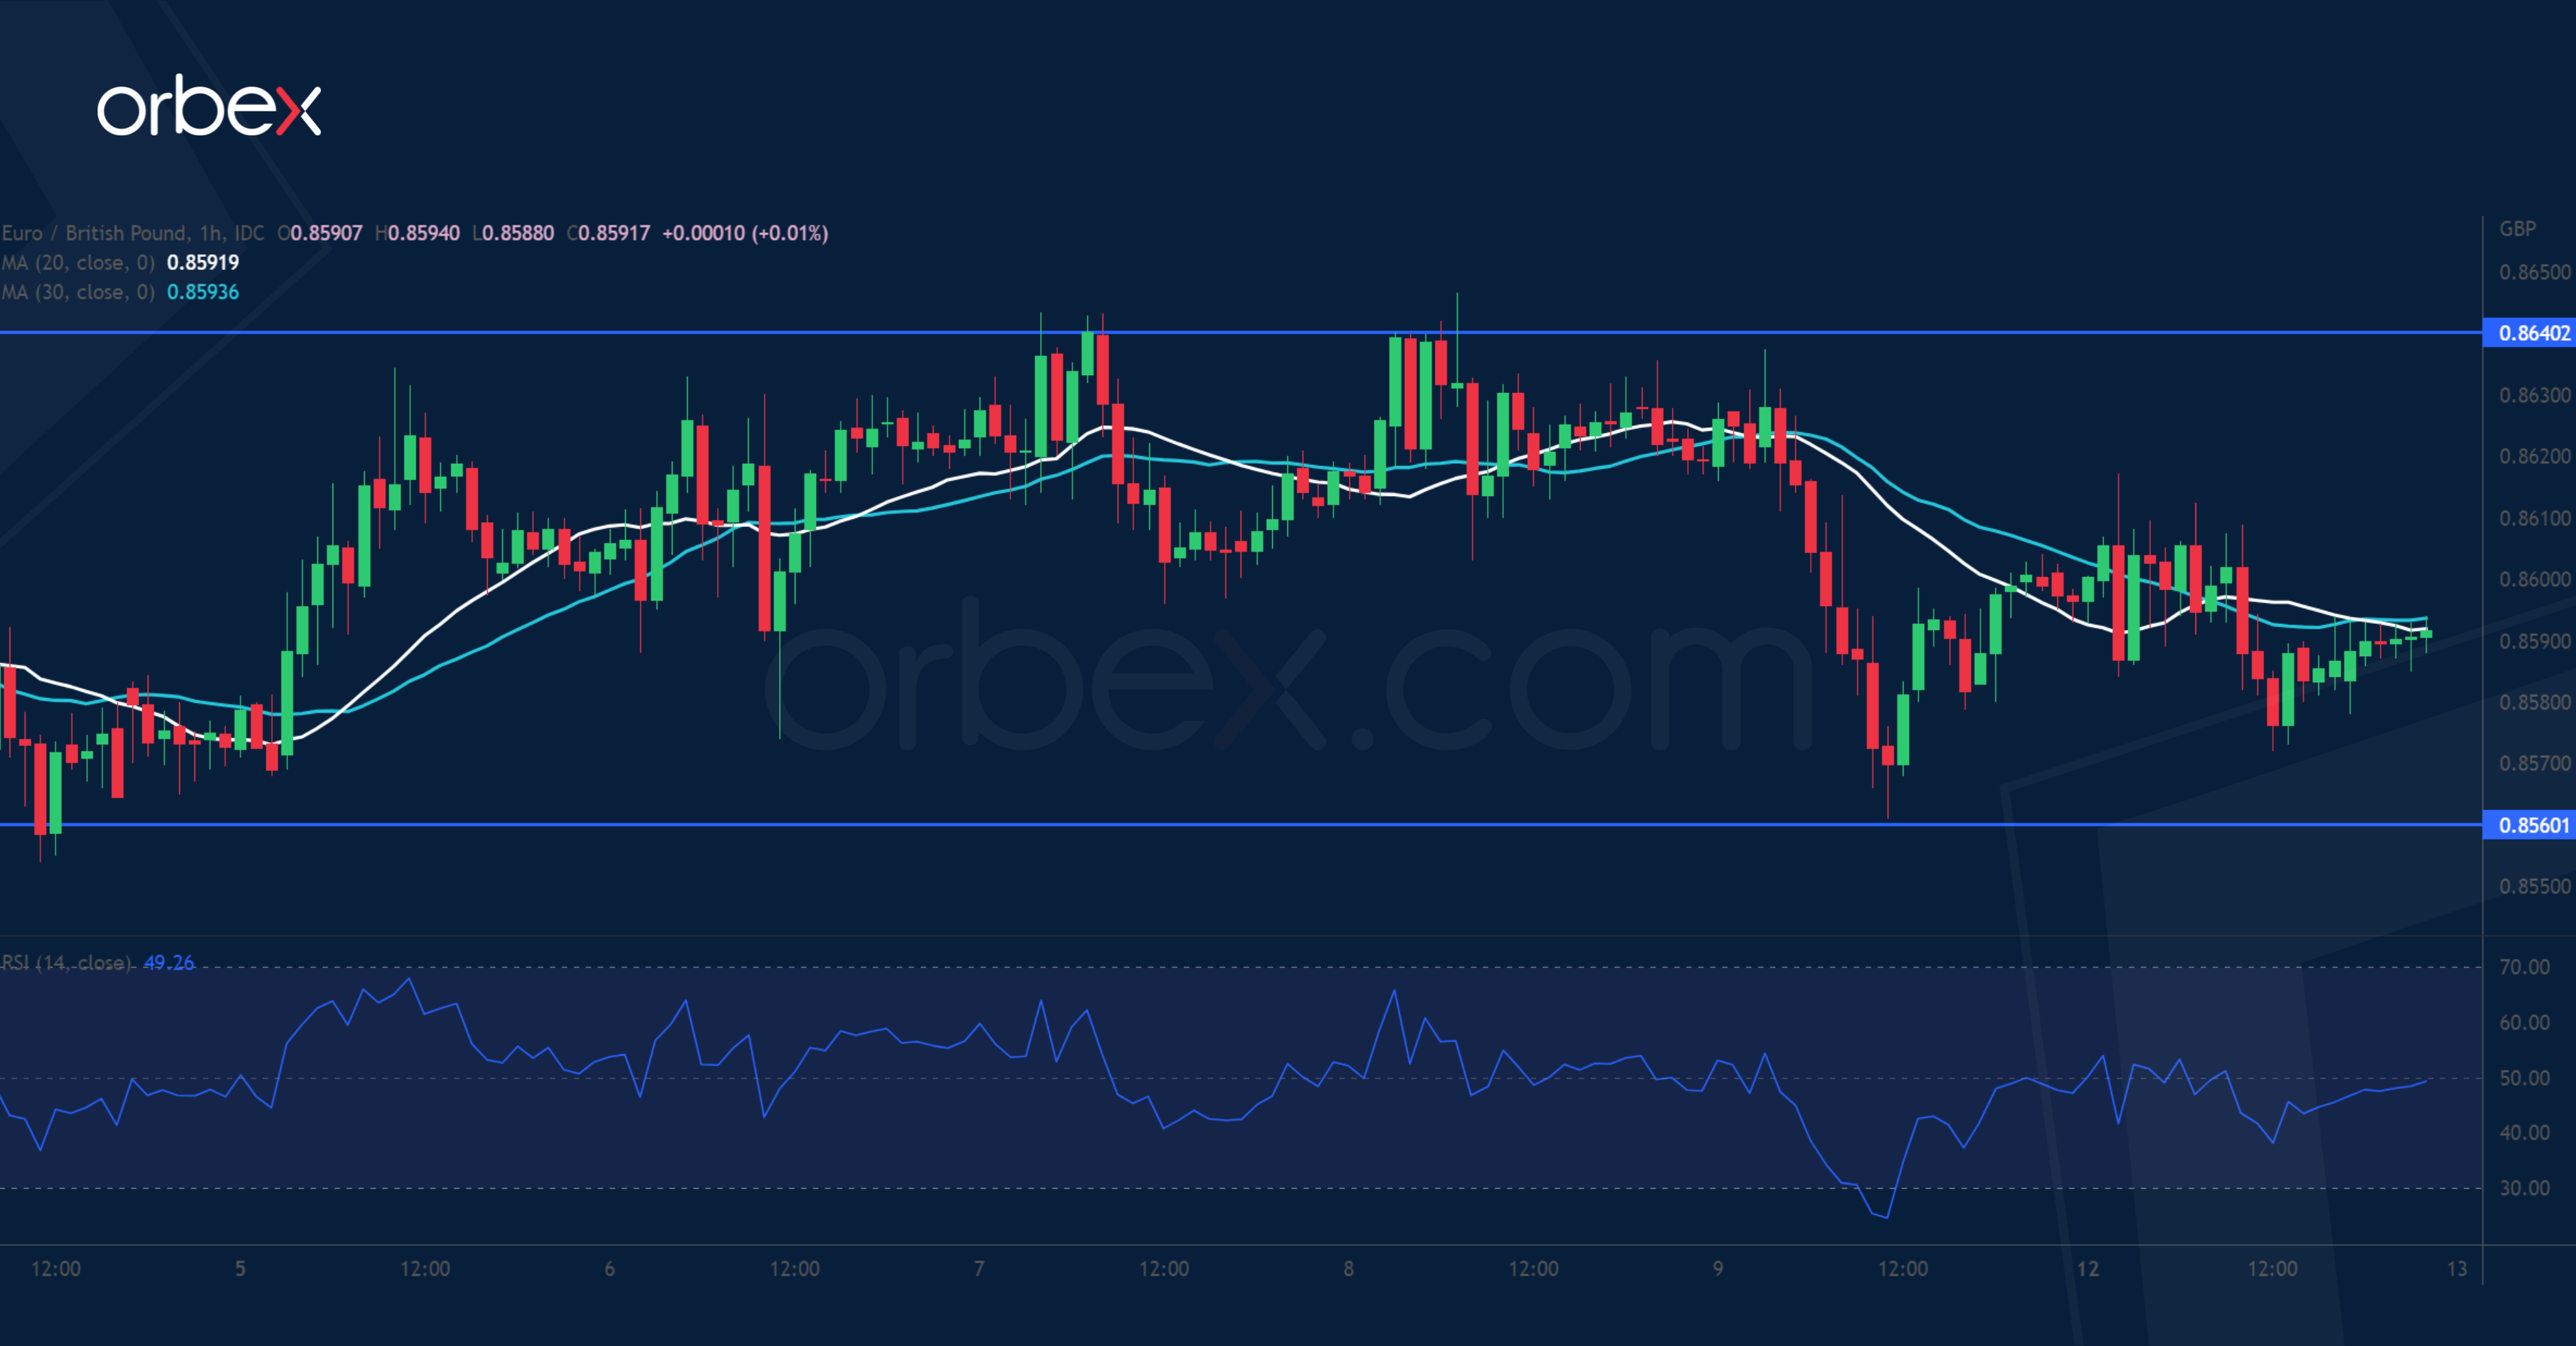
The pound strengthened after the UK’s GDP beat expectations in October. The pair has failed to build a support base after it dropped below the major bottom (0.8570) that has been valid since last September. The RSI’s oversold condition led to a limited bounce but might not be enough to save the day as more traders may have switched to the short side. Only a close above 0.8640 would keep the euro bulls in play. Otherwise, a fall below 0.8560 would attract momentum sellers and send the exchange rate to 0.8500.