Sample Category Title
EUR/USD: Bullish Correction Close to Completion
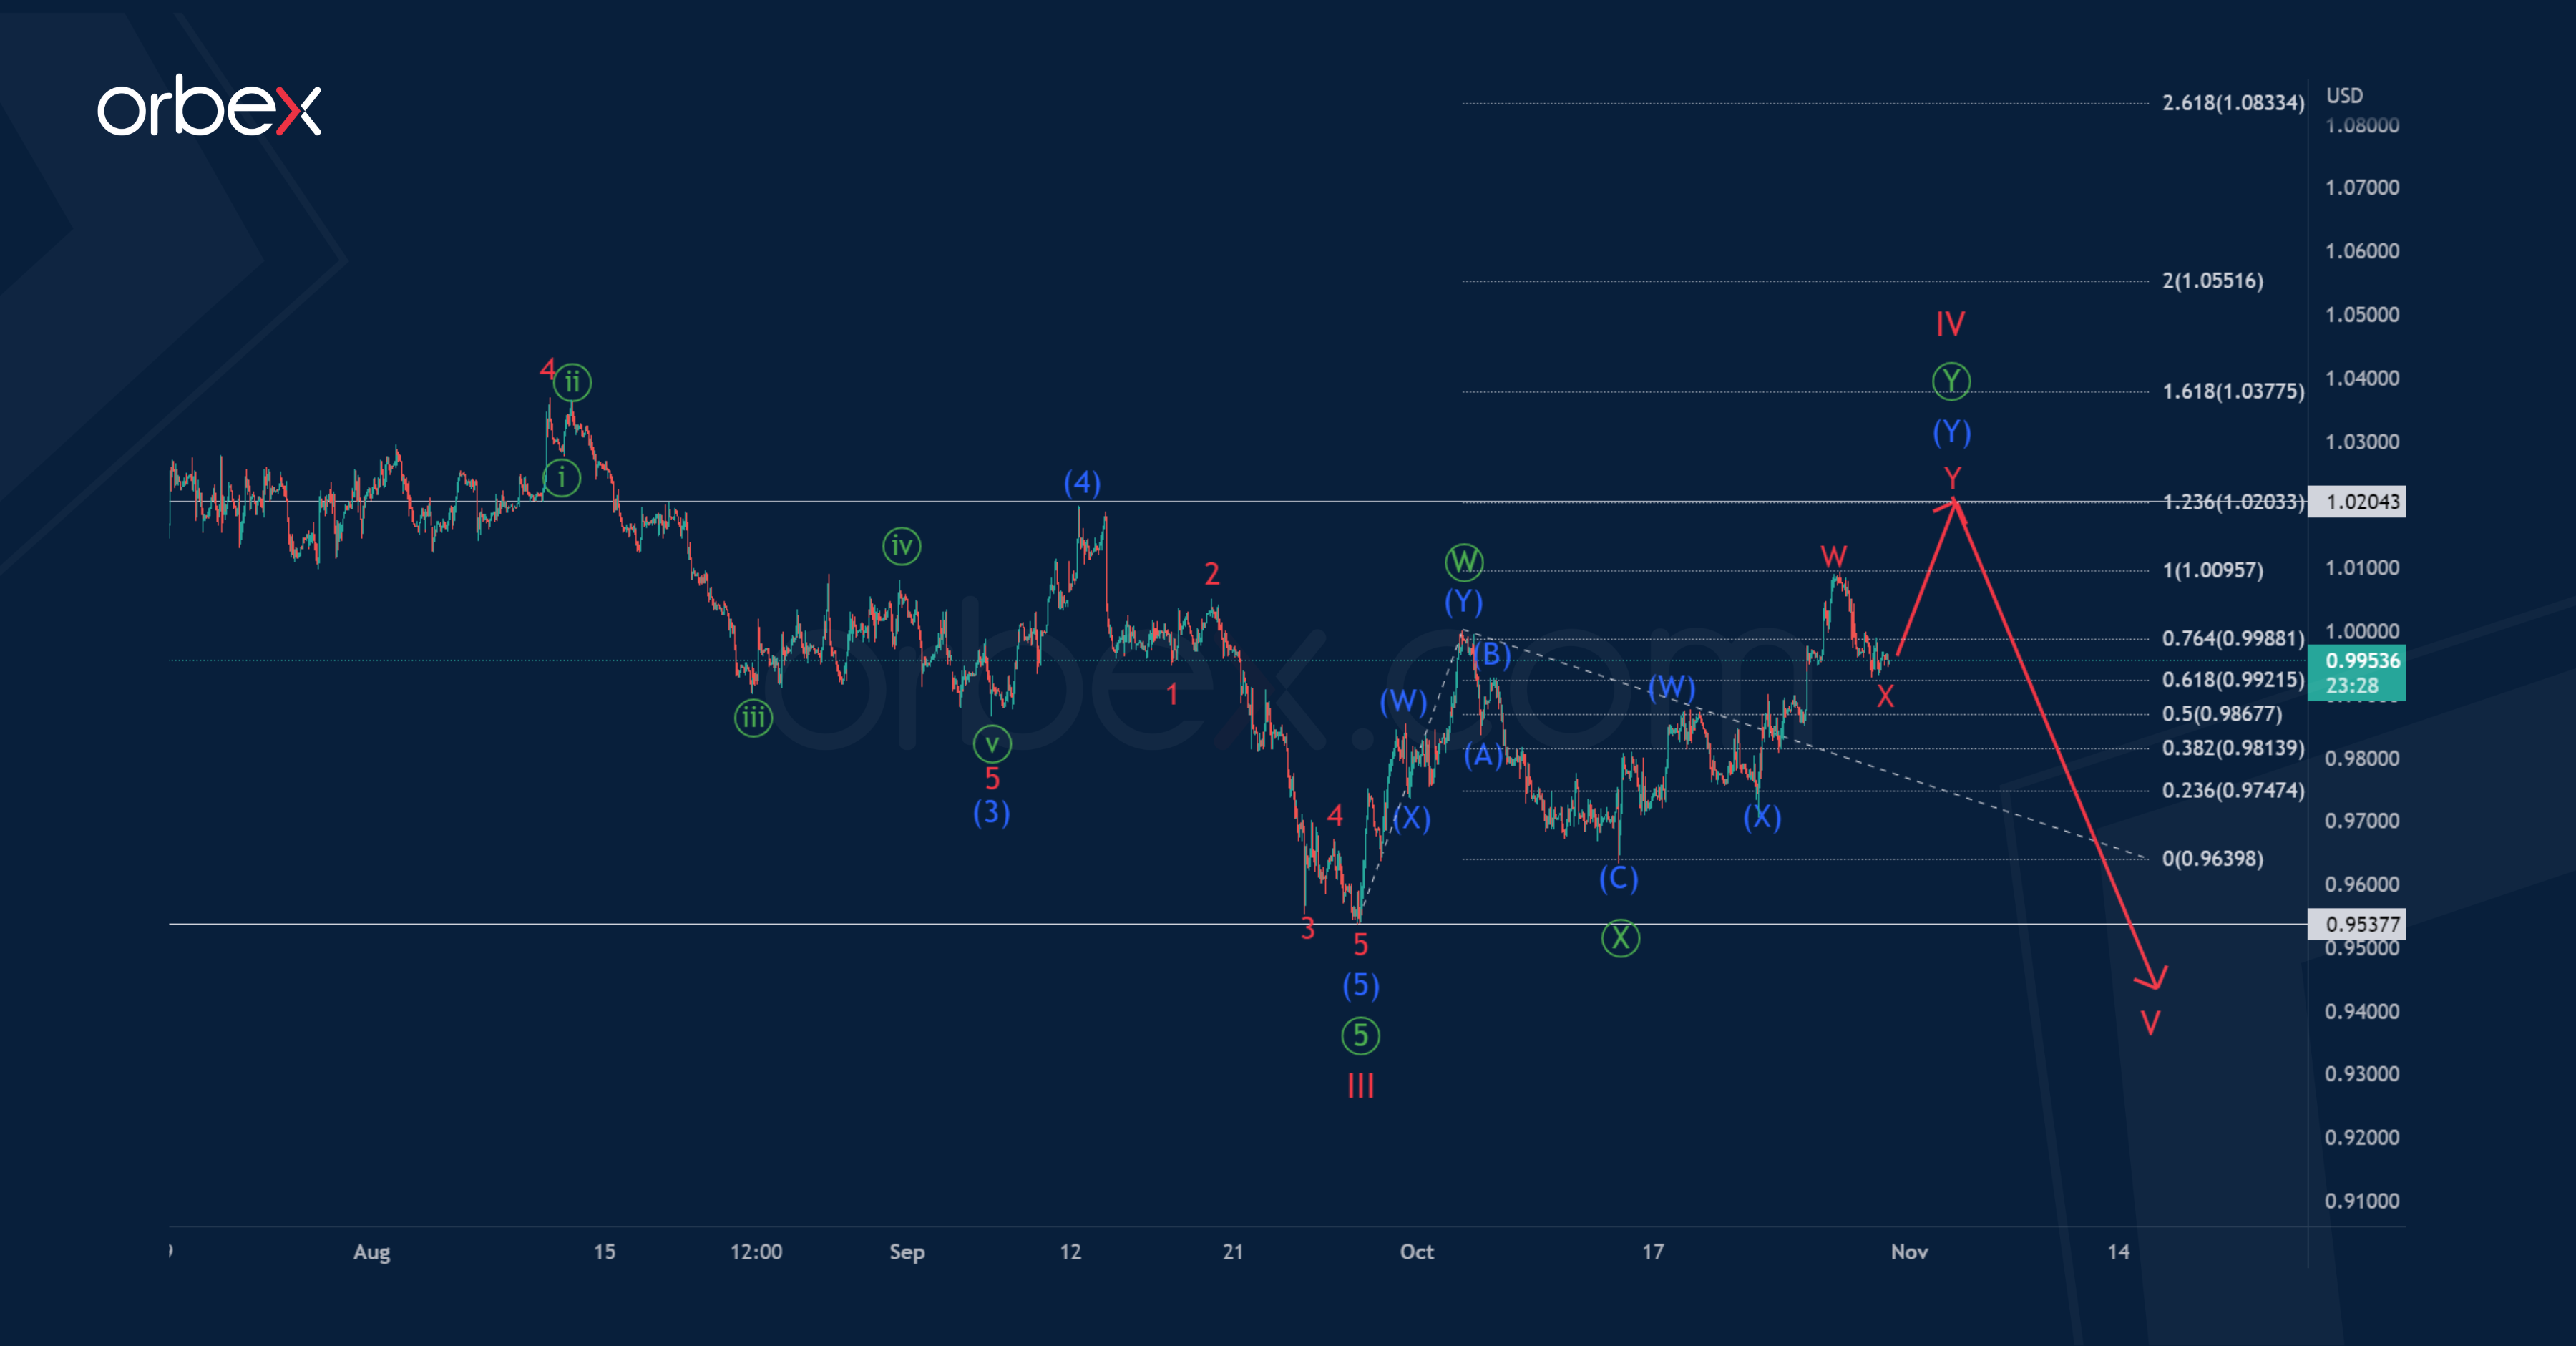
In the long term, EURUSD seems to be forming a bearish cycle impulse, which consists of five main sub-waves I-II-III-IV-V.
Most likely, the cycle impulse sub-wave III was fully completed, after which the formation of a bullish correction IV began. This correction is similar to a double zigzag consisting of primary sub- waves..
The primary sub-waves and look complete. The development of the last sub-wave. is expected in the near future. It may form a double zigzag pattern W-X-Y near 1.0204. At that level, wave will be at 123.6% of first actionary wave.
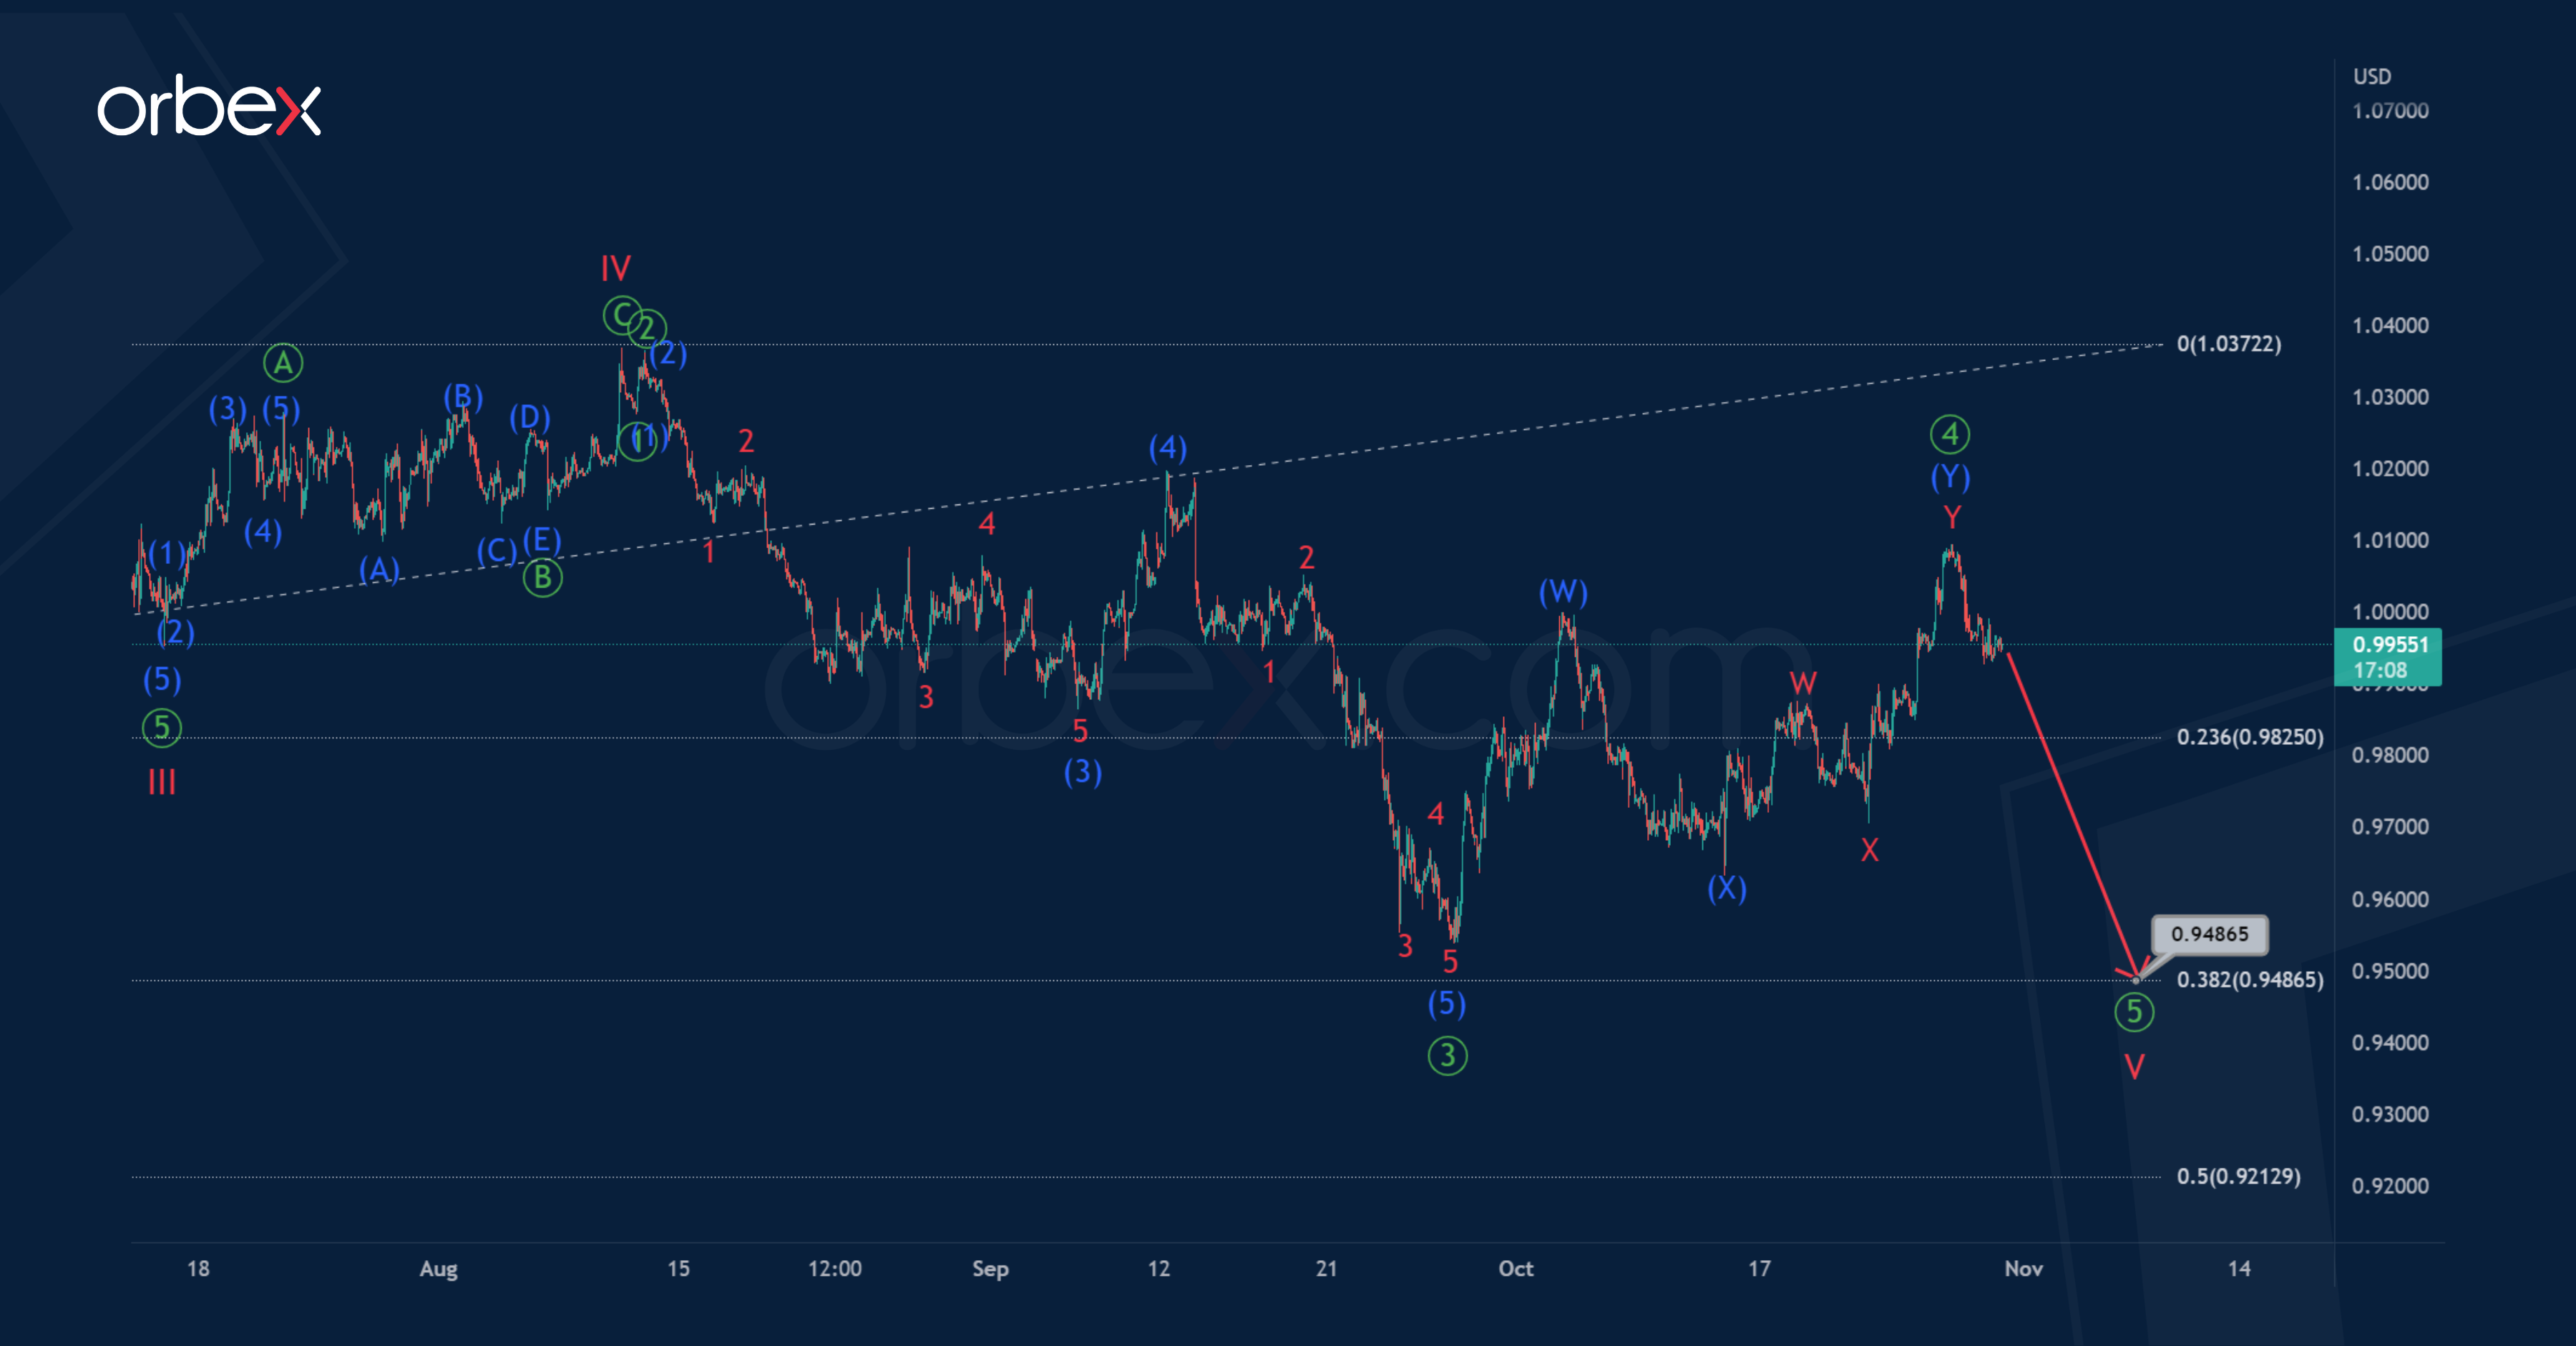
According to the alternative, the cycle correction IV has been fully completed and it is a standard zigzag.
In the last section of the chart, we can notice the development of the last leg of the cycle wave V, which takes the form of a primary impulse ①-②-③-④-⑤.
At the specified impulse, the first four parts look finished, and the last sub-wave ⑤ is under development.
In the near future, the currency is expected to decline to 0.948. At that level, cycle wave V will be at 38.2% of wave III.
EURUSD Drops Below Parity But Remains Above Descending Trendline
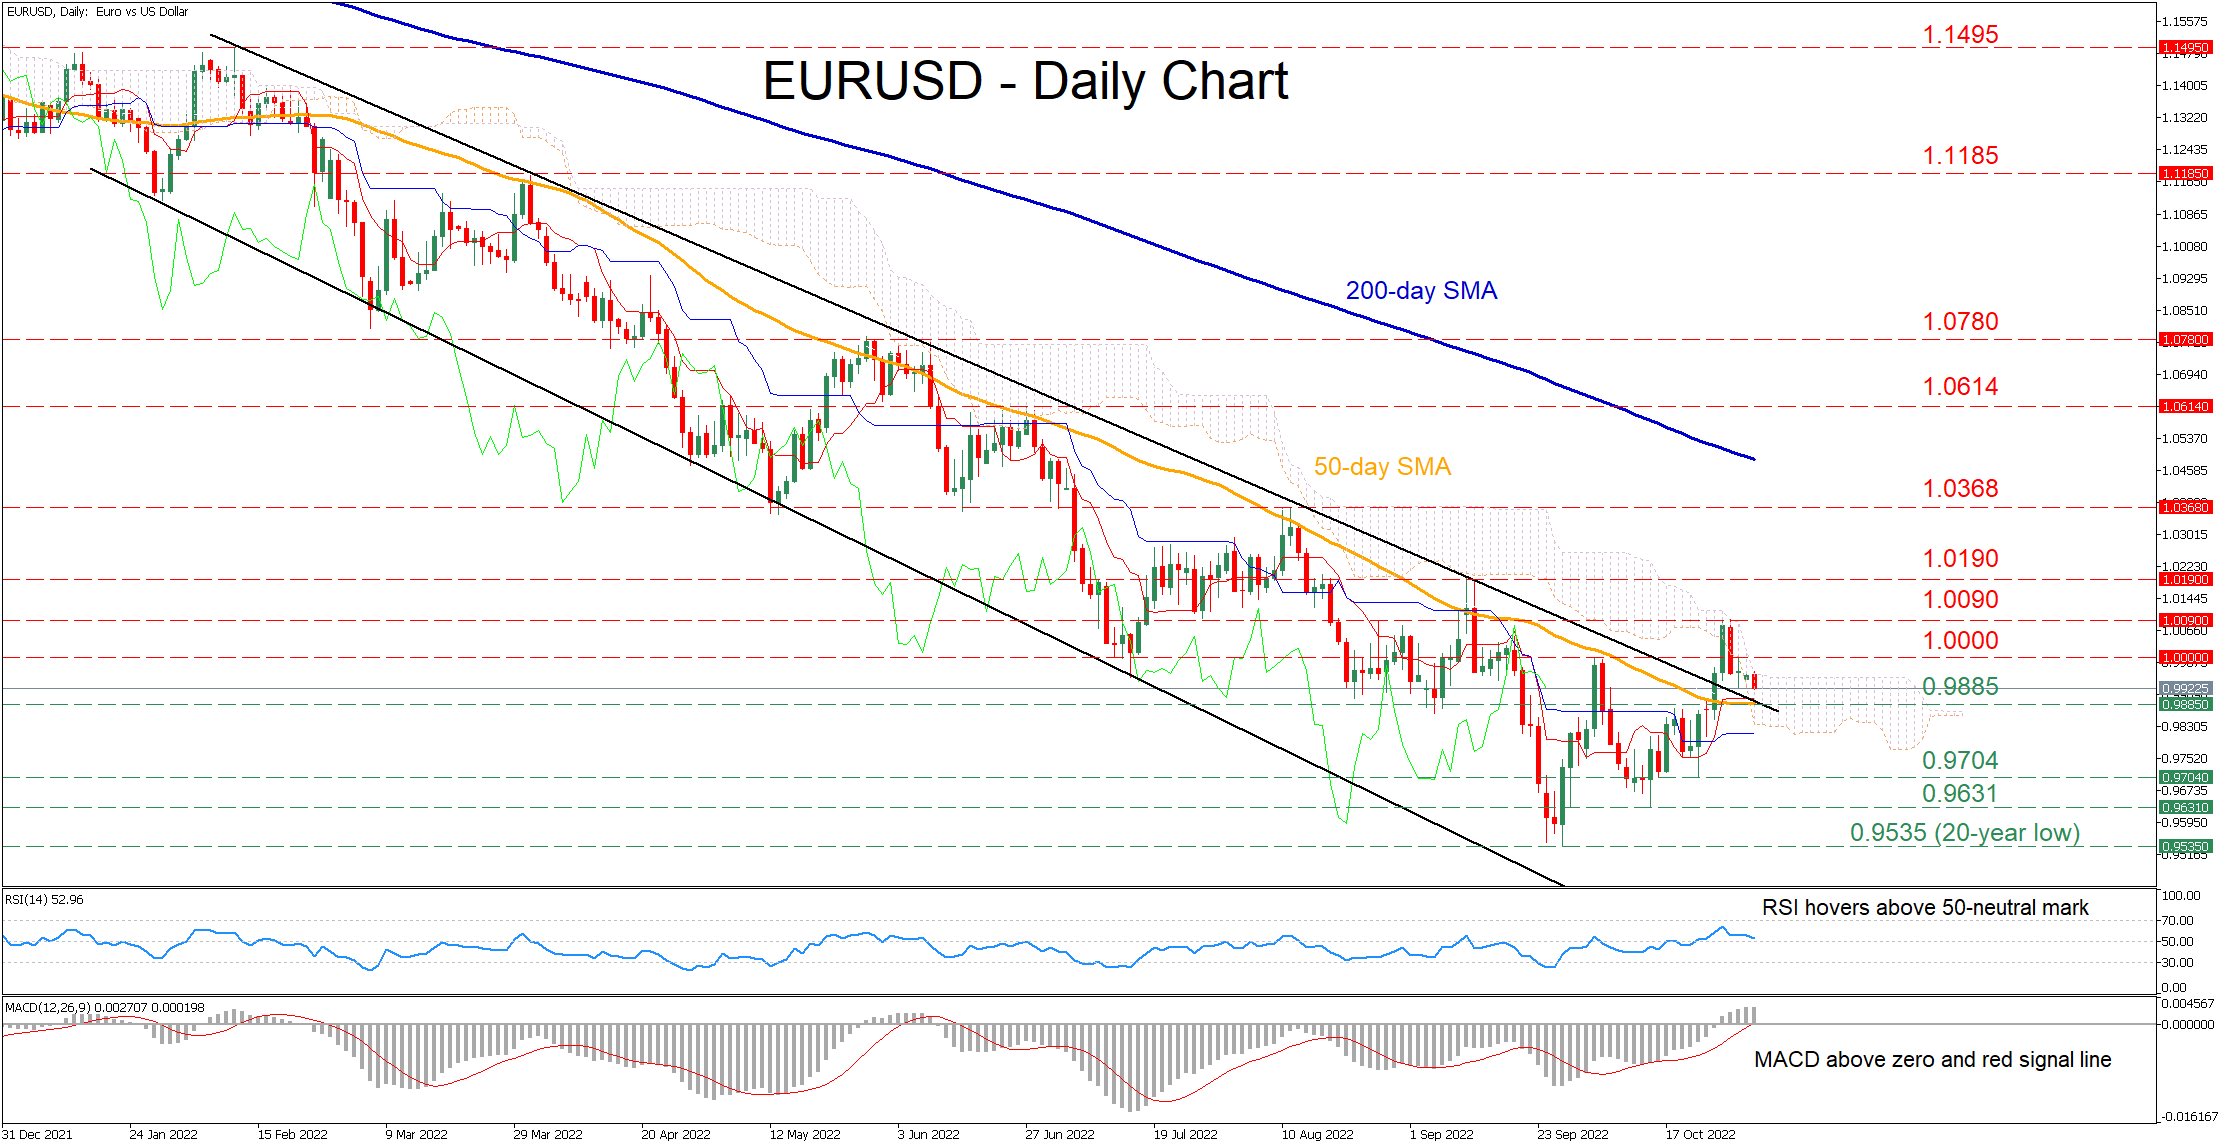
EURUSD has been losing ground since the beginning of the year, creating a clear structure of lower highs and lower lows. Although the pair managed to cross above both its descending channel and the 50-day simple moving average (SMA), it quickly retraced lower slightly below parity.
The momentum indicators currently suggest that bullish forces are subsiding but still hold the upper hand. Specifically, the RSI is pointing downwards above its 50-neutral mark, while the MACD histogram is softening above both zero and its red signal line.
Should buying pressures intensify, initial resistance could be encountered at parity, which is considered a crucial psychological mark by markets. Jumping above the latter, the price could challenge the recent rejection point of 1.0090 before the spotlight turns to the September peak of 1.0190.
To the downside, bearish actions could meet immediate support at the 0.9885 congested region, which includes the 50-day SMA and the restrictive trendline taken from the pair’s recent highs. Sliding beneath that floor, the pair could descend towards 0.9704 before it challenges the October low of 0.9631. A violation of the latter could open the door for the 20-year low of 0.9535.
Overall, despite its recent upside breakout, EURUSD appears to be losing momentum. Hence, for the pair to resume its recovery, the descending trendline must curb any potential declines.
AUD/USD Pair is Correcting Losses from the 0.6450 Low
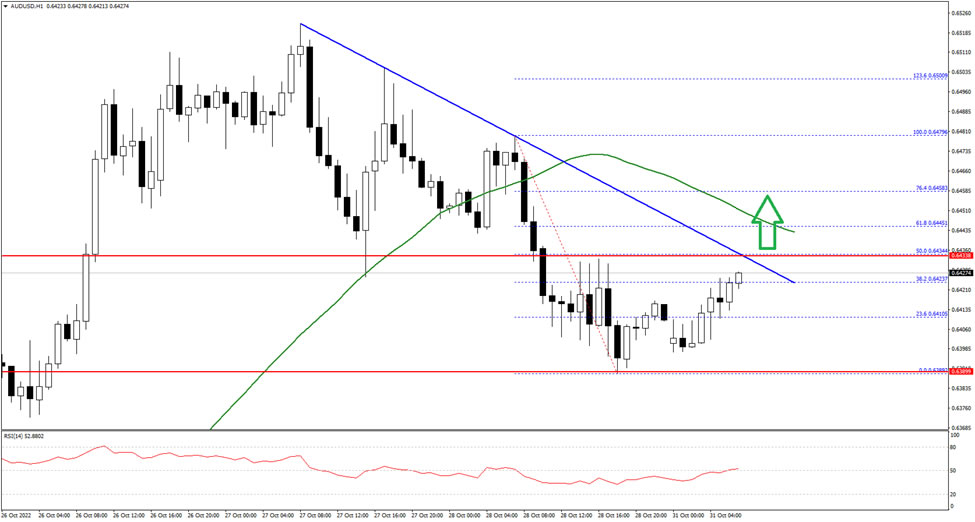
The Aussie Dollar started a fresh decline from the 0.6520 resistance zone against the US Dollar. The AUD/USD pair declined below the 0.6450 level to move into a bearish zone.
There was a clear move below the 0.6420 zone and the 50 hourly simple moving average. The pair traded as low as 0.6389 and is currently correcting losses. An immediate resistance on the upside is near the 0.6435 level and a connecting bearish trend line on the hourly chart.
If there is an upside break above the 0.6435 zone, the pair could rise steadily towards the 0.6480 level in the near term. The main resistance now sits near the 0.6520 level.
An immediate support is near 0.6400 on FXOpen. The next key support is near the 0.6380 level. A downside break below the 0.6380 support could lead the pair towards the 0.6320 support.
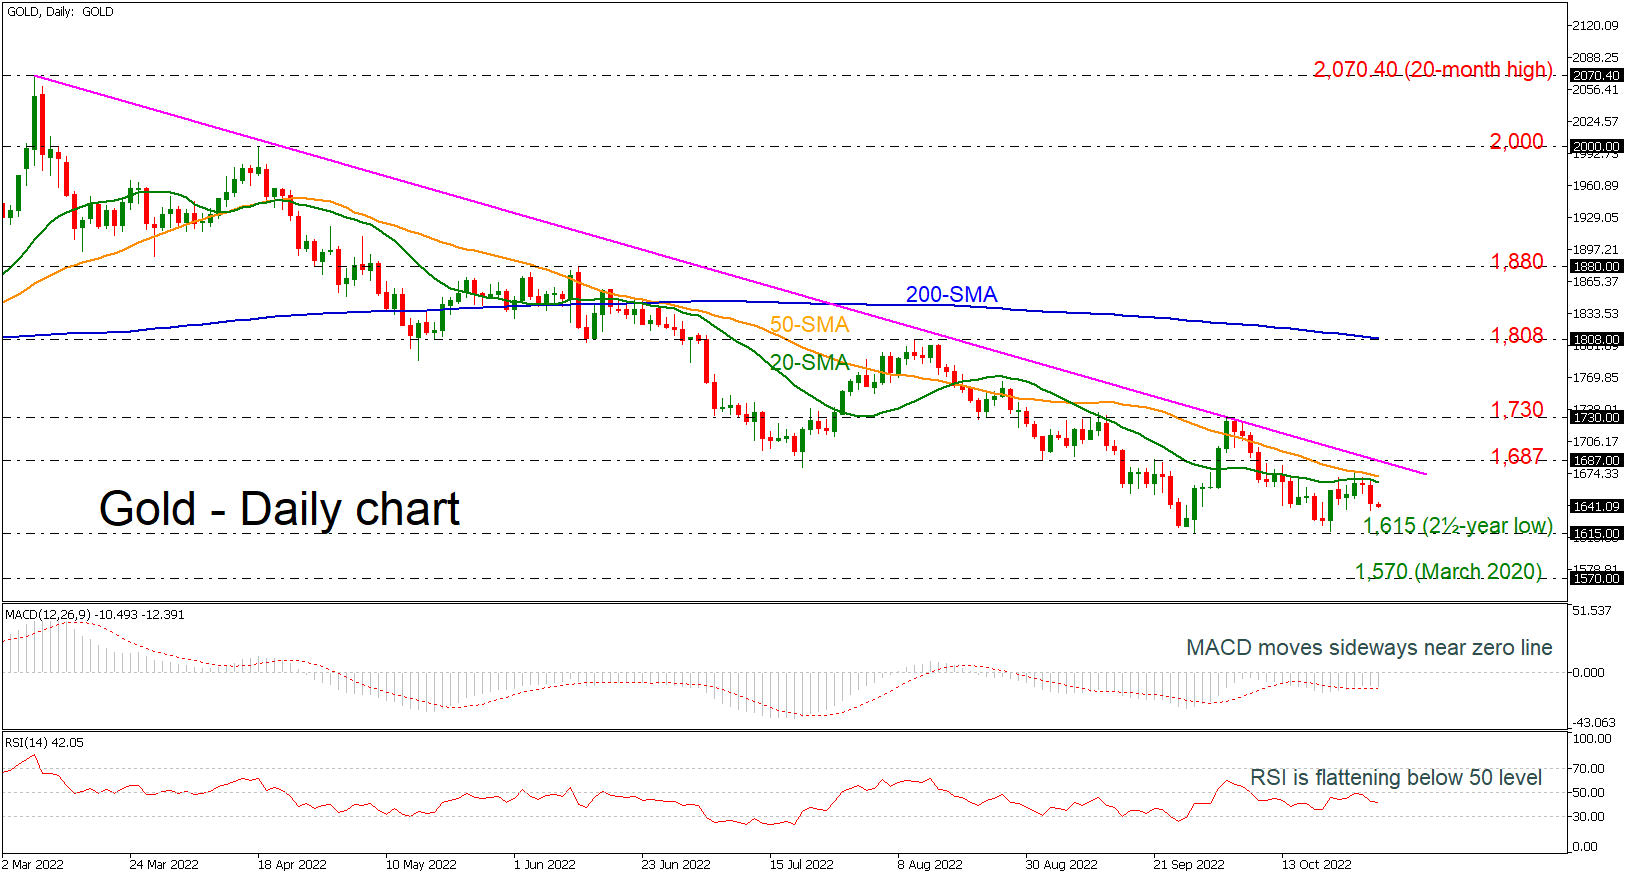
Gold Moves Down from Short-term SMAs
Gold prices are moving lower after several failed attempts to jump above the short-term simple moving averages (SMAs). The price remains below the long-term descending trend line and the technical oscillators currently confirm the bearish structure. The MACD oscillator is moving sideways below the zero level, while the RSI is flattening in the negative region.
To the downside, immediate support could come from the two-and-half-year low of 1,615, which was tested two times over the last month. Moving lower, the troughs of March 2020 at 1,570 could be revisited ahead of the 1,450 bottom.
Otherwise, if buyers push above the moving averages, initial resistance could come from the 1,687 barrier, which overlaps with the downtrend line. Climbing higher, the 1,730 resistance could interrupt the test of a key region from the 200-day SMA and the 1,808 hurdle.
Summarizing, the very short-term bias has turned neutral but if the price shifts above the 1,687 barrier, the picture may turn positive.
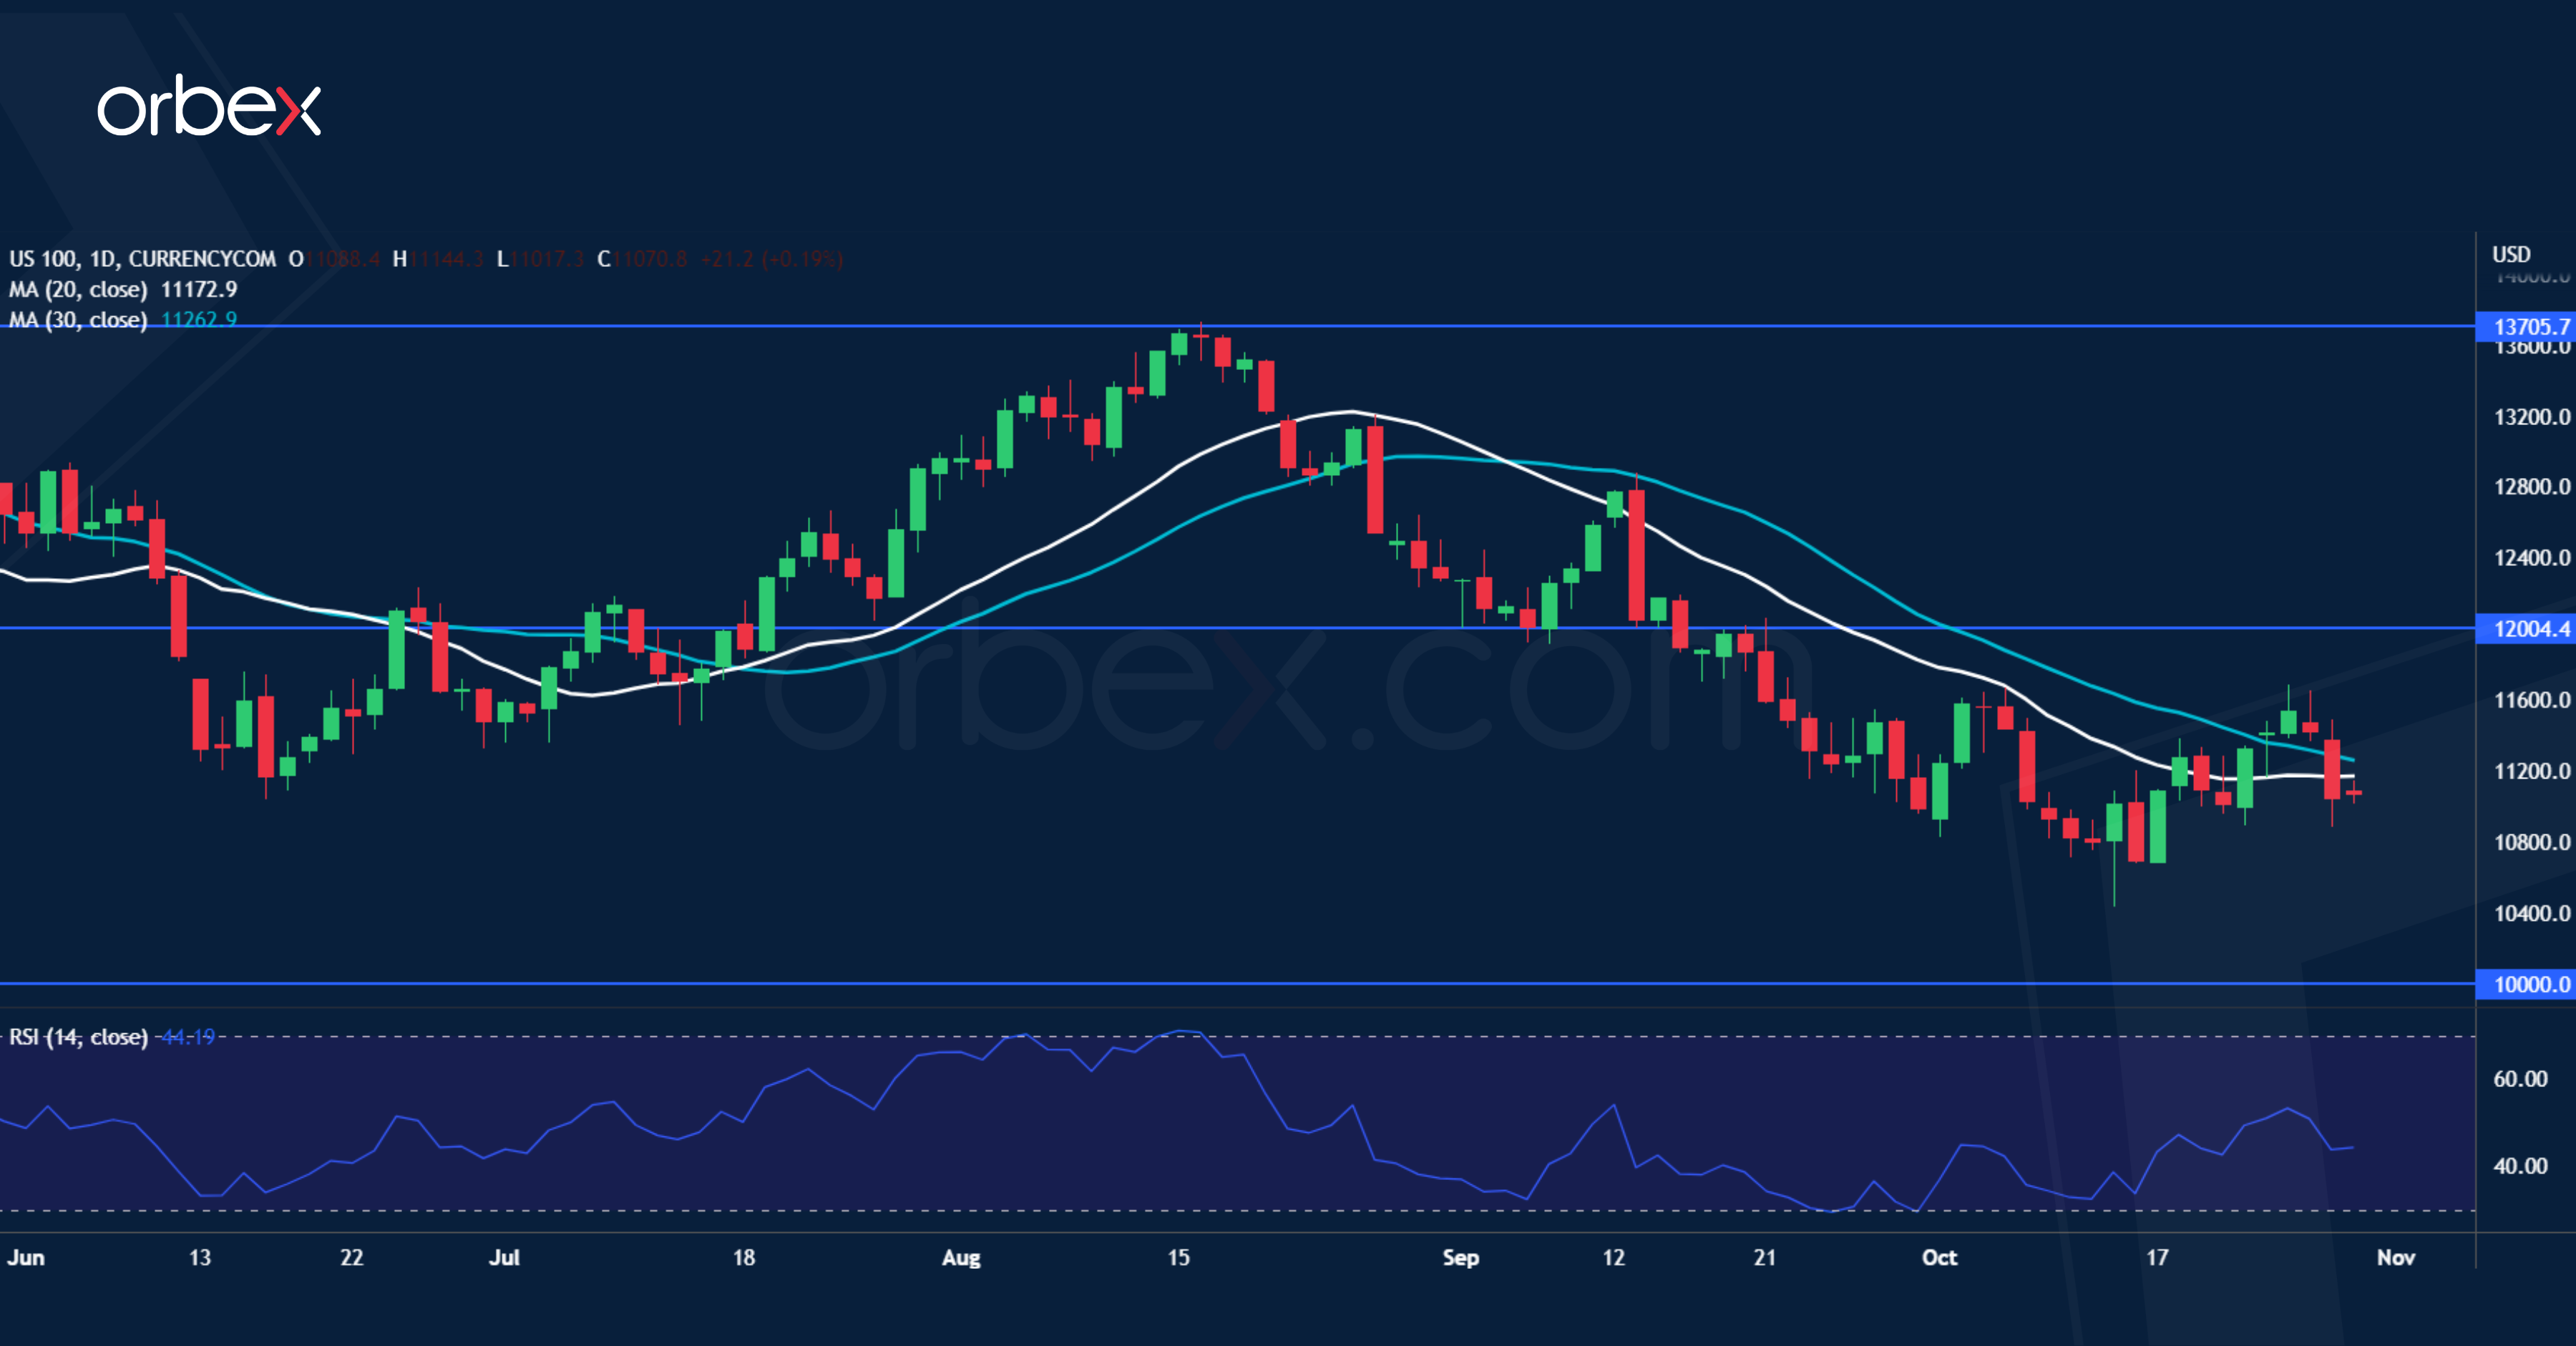
Nasdaq 100 Struggles as Risk Mood Ebbs
The Nasdaq recouped some losses in hope of a turnaround in the Fed’s tightening cycle. Bad news is good news these days. Signs of a slowdown in the world's largest economy would cool expectations of sustained rate hikes by the central bank. A dovish hike from the Bank of Canada may feed hopes that the Fed could be nearing the pivot point. A retreat in Treasury yields could divert more liquidity into riskier assets. Should investors’ risk mood make its way back, growth-sensitive tech names would be the first beneficiaries. Until then, 12000 is a key hurdle and caution could drive the index to the psychological level of 10000.
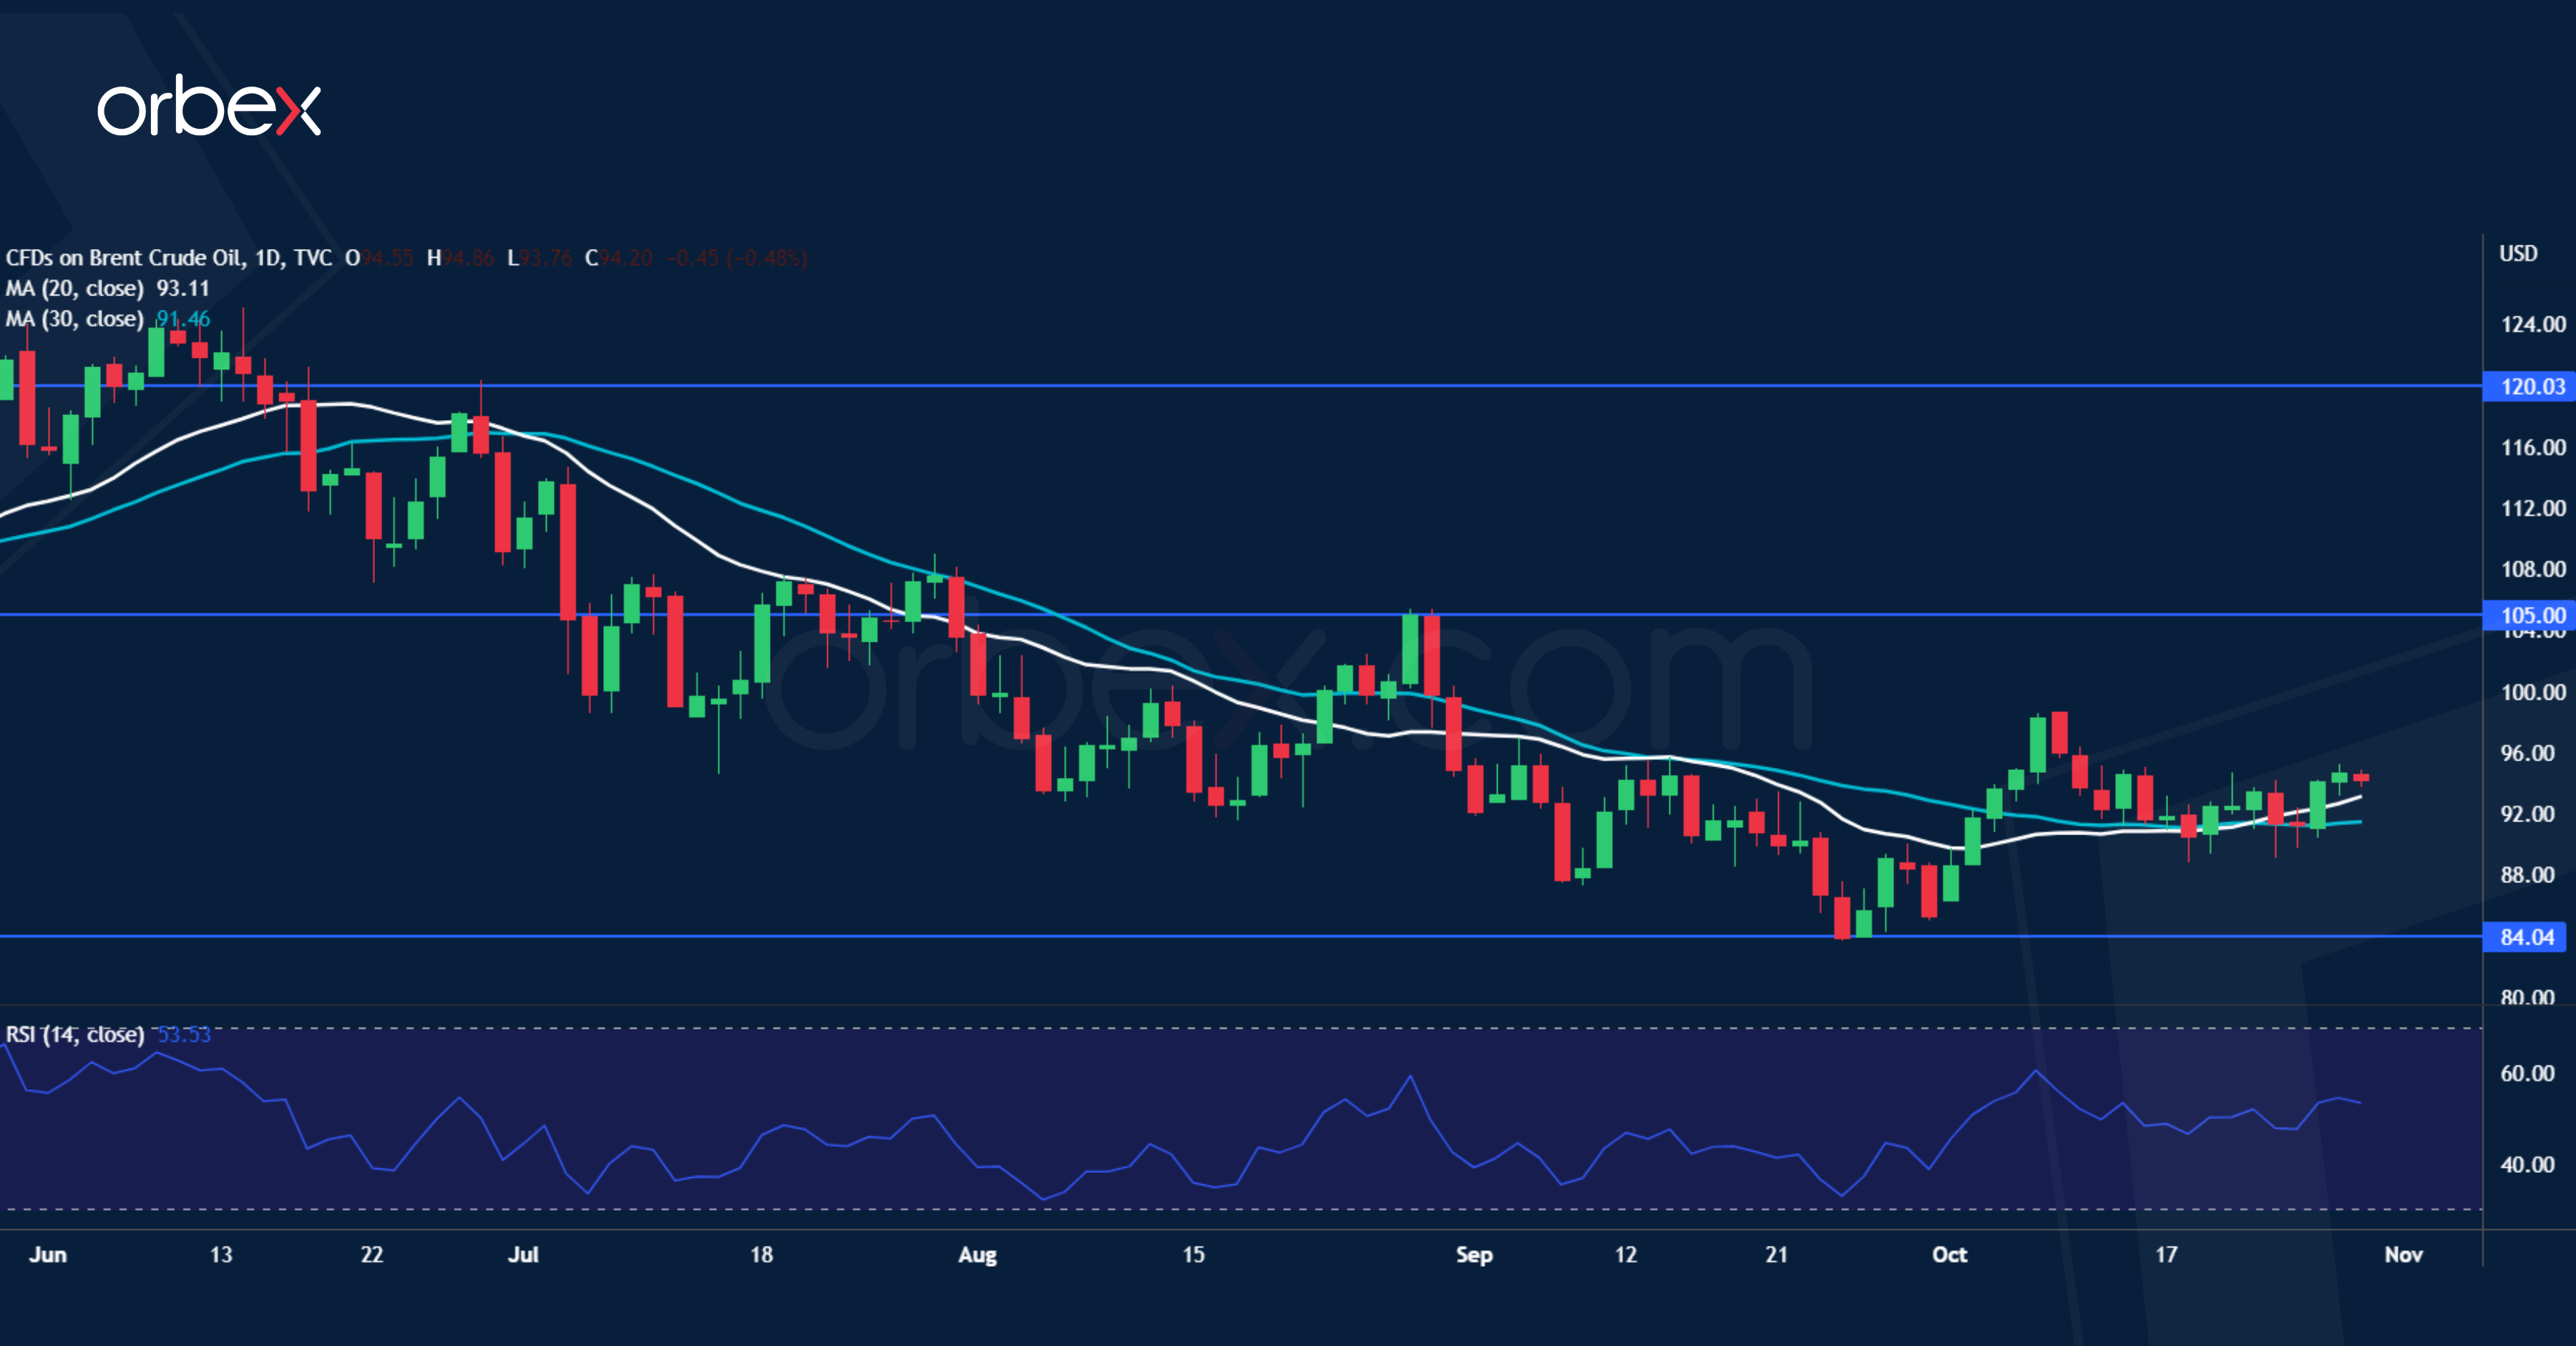
UK Oil Steadies on Solid Demand
Brent crude bounces higher as demand remains strong despite economic worries. There is definitely some optimism in the air. Recession concerns have abated with traders hoping for a less aggressive stance from the Fed amid weaker US data. Record US crude exports indicate that global demand has kept up. Meanwhile, Western allies’ price cap on Russian oil may have limited impact as it would be designed to keep the supply flowing. However, feeble growth in China, the world's biggest energy consumer, could be a major headwind in the medium-term. The price is consolidating between 84.00 and 105.00.
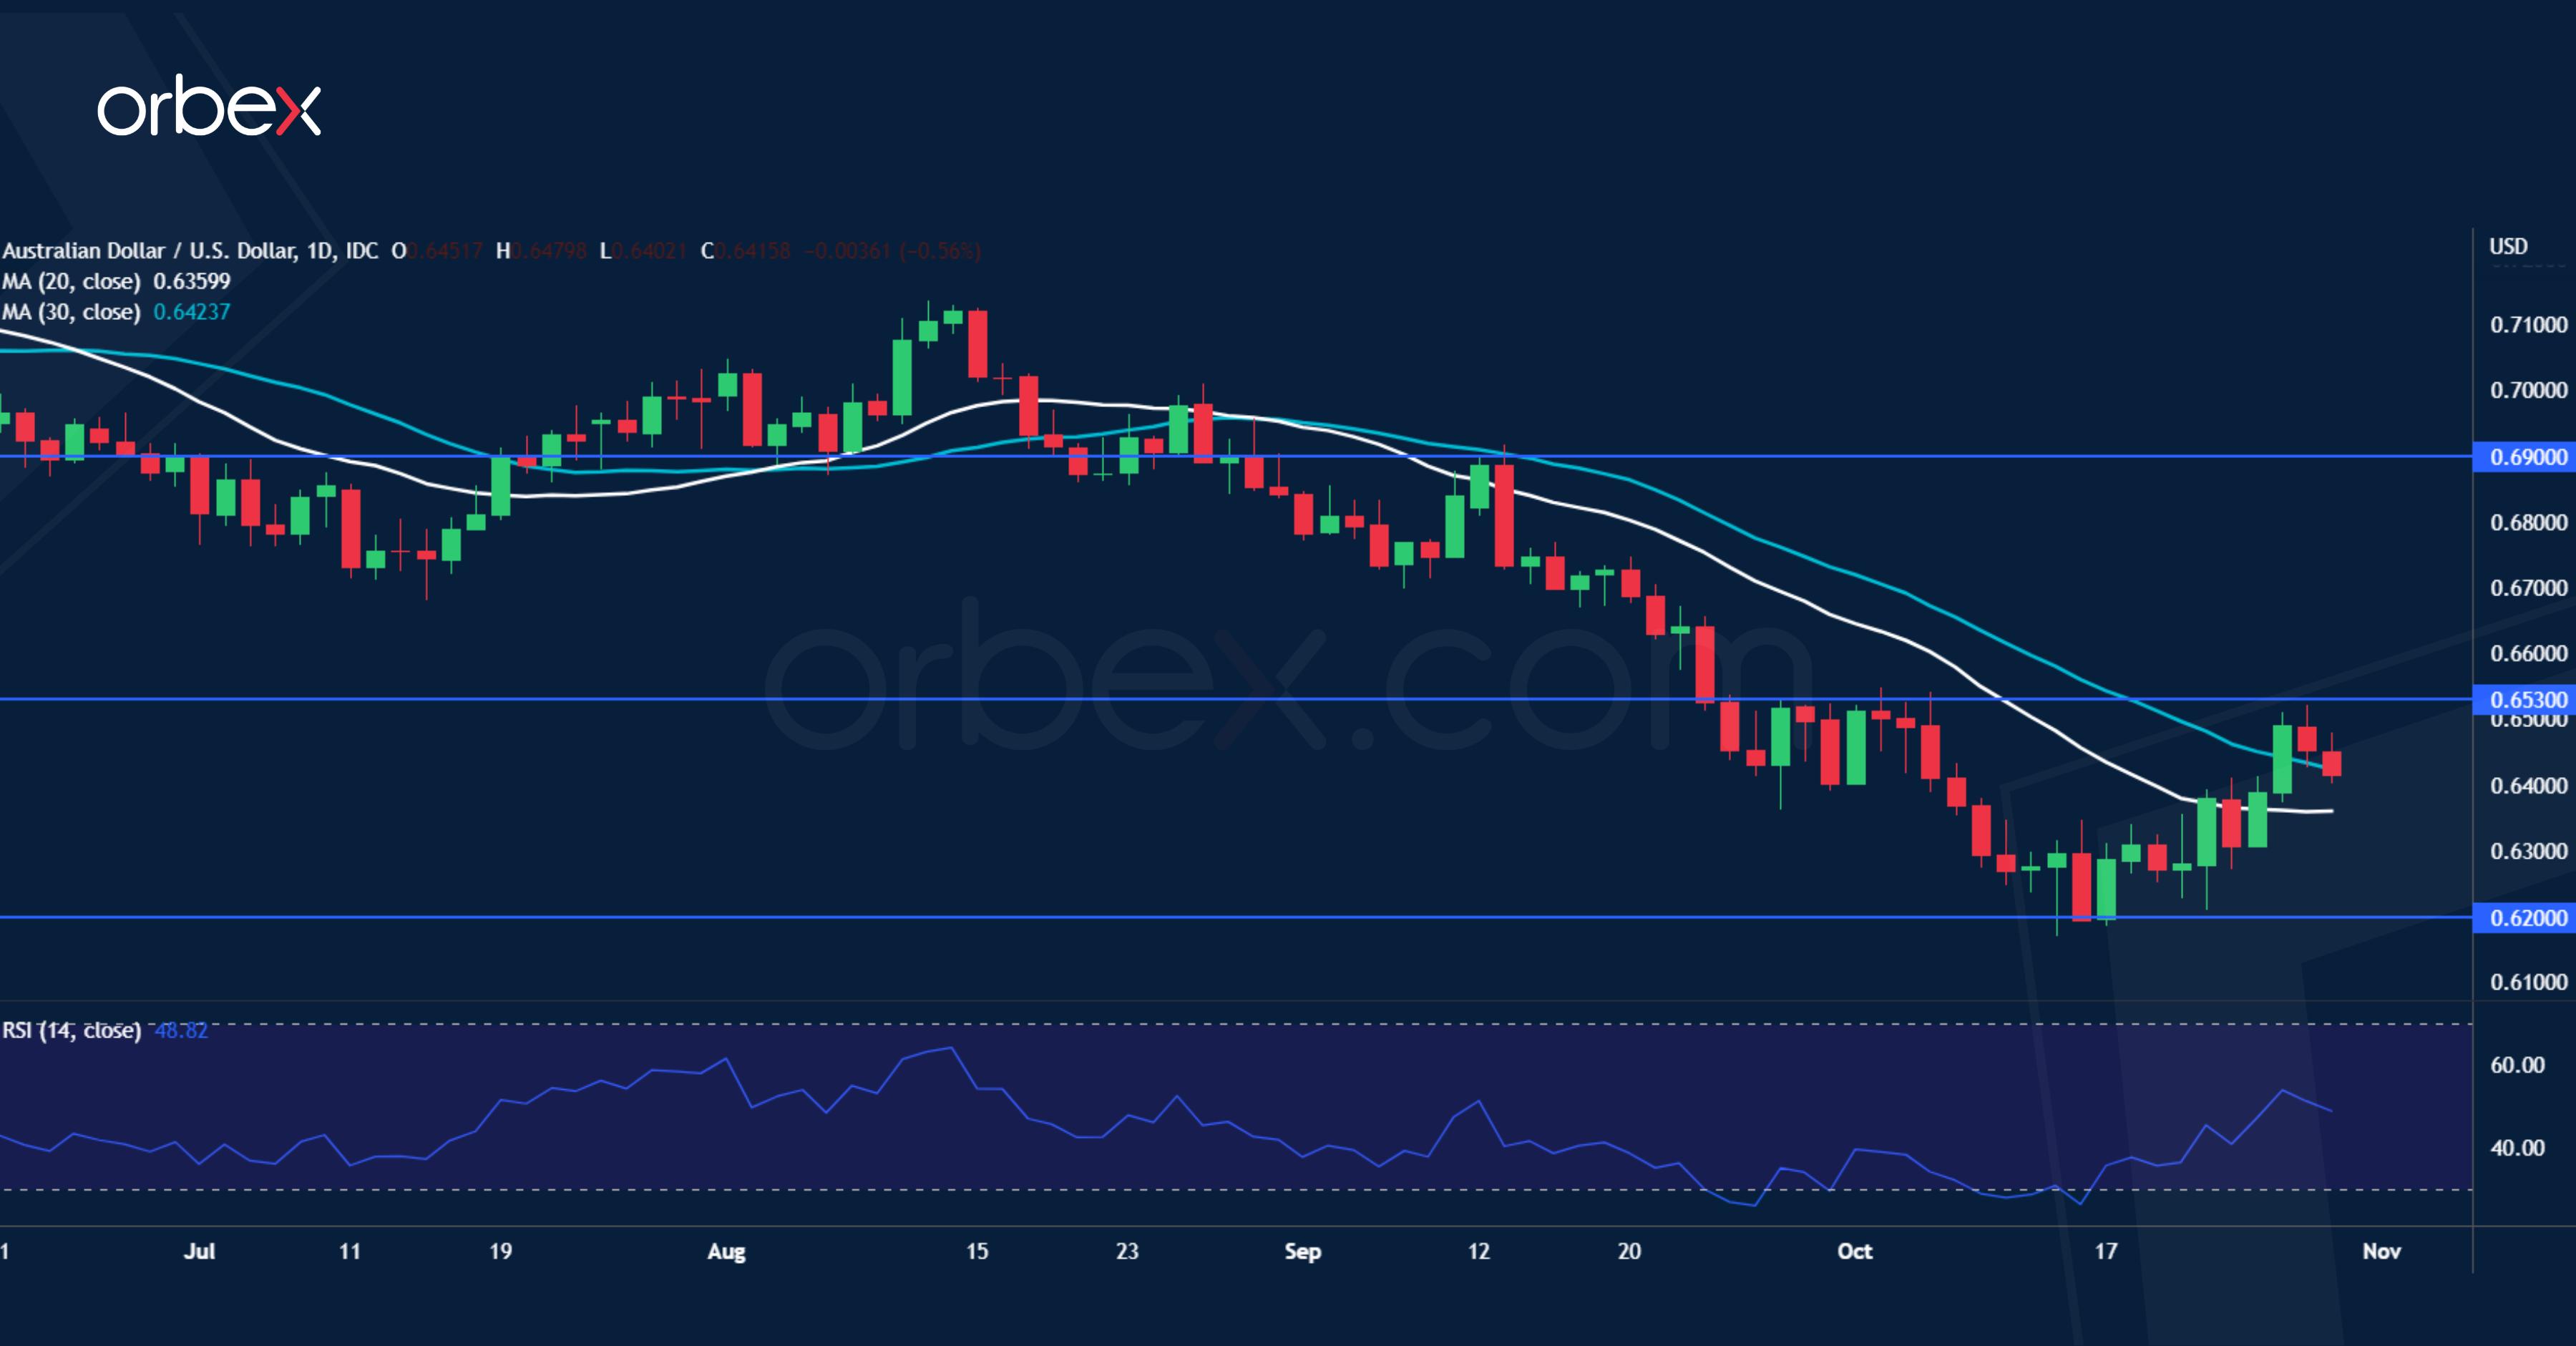
AUD/USD Weakens on Dovish RBA
The Australian dollar slips as the RBA may continue to reduce the pace of monetary normalisation. The recent bounce has more to do with a pullback in the US dollar rather than a shift in sentiment. The RBA is expected to lift its feet off the pedal with another 25 basis points hike this week. However, as inflation reaches a 32-year high, policymakers are under pressure to stay assertive. The upside risk would be a 50bp hike. Still, the contrast with the US Fed, which might deliver a fourth consecutive 75 bp rate hike in November, could keep the aussie subdued and under 0.6530. A fall below 0.6200 would lead to 0.6000.
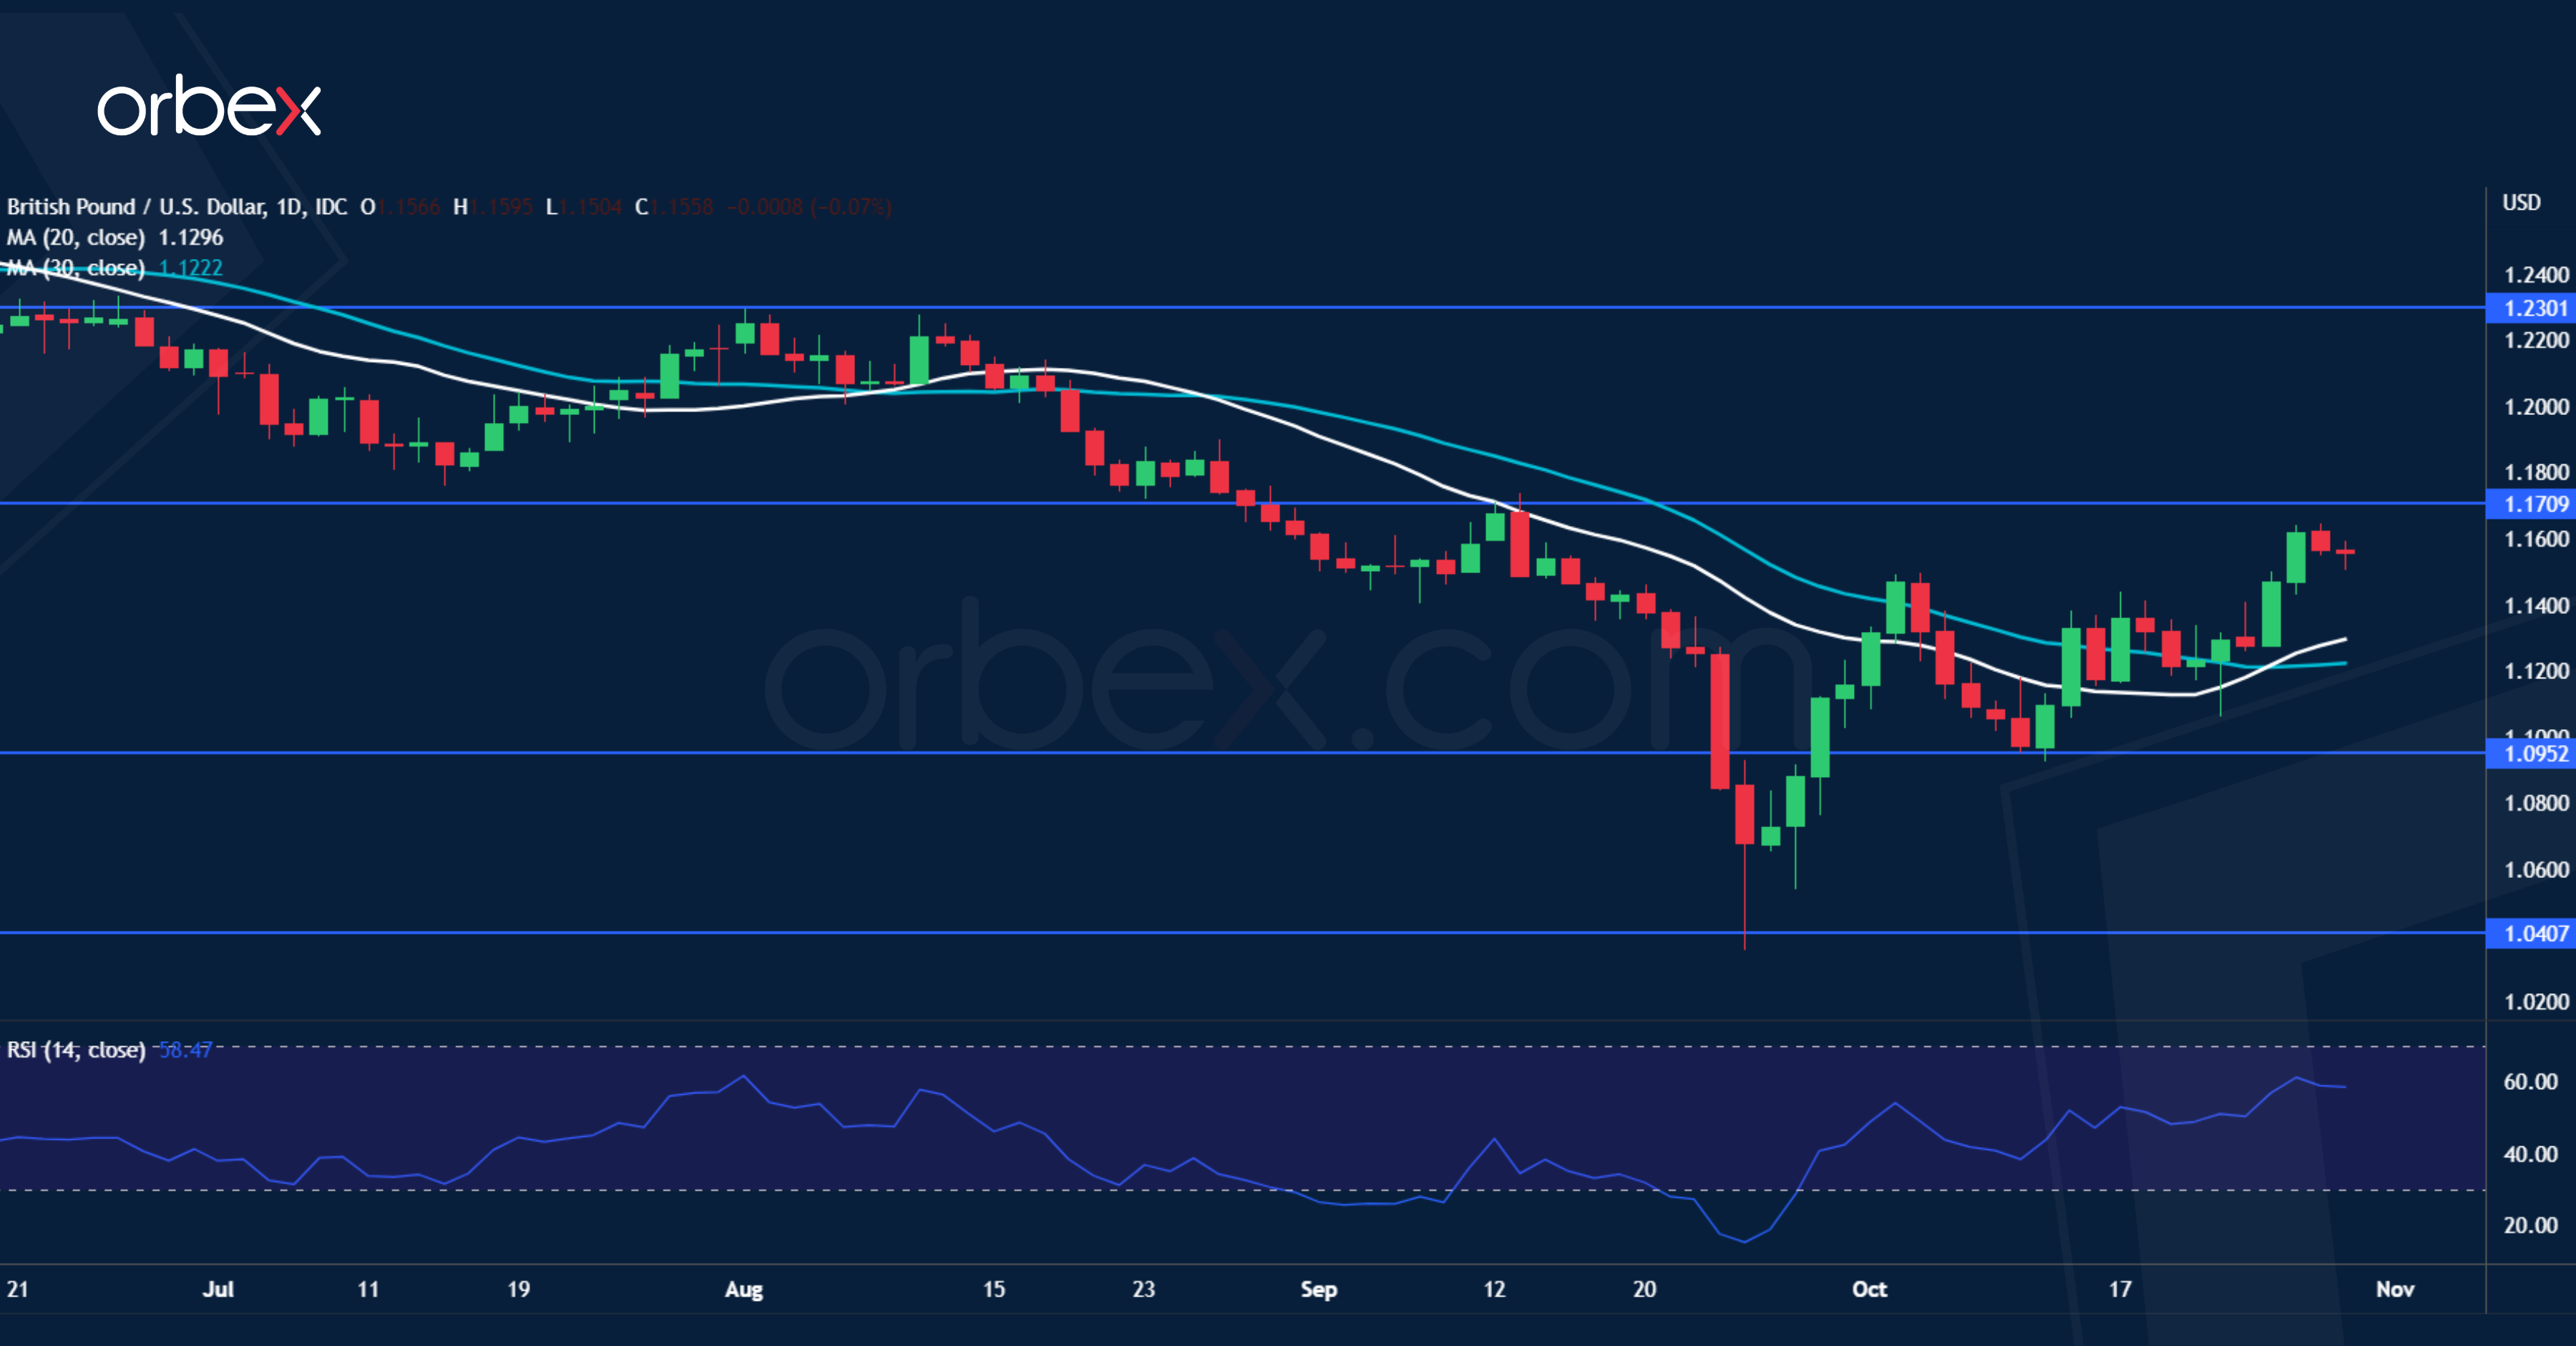
GBP/USD Rebounds as UK Budget Delayed
The pound bounces as the new premiership instils a sense of stability. Former Chancellor Sunak becomes Britain’s Prime Minister as Sterling recovers from the budget disaster. The new finance-relevant leadership gives investors hopes of better plans to tackle the mounting economic crisis. Volatility is likely to rise leading up to the new budget in mid-November. As for now, all eyes are on the BoE to deliver a 75bp hike which may add further stress to the economy. How far the rally may go would depend on how fiscal and monetary policies play out in these turbulent times. 1.1700 is the first resistance and 12000 a fresh support.
AUD/USD Daily Report
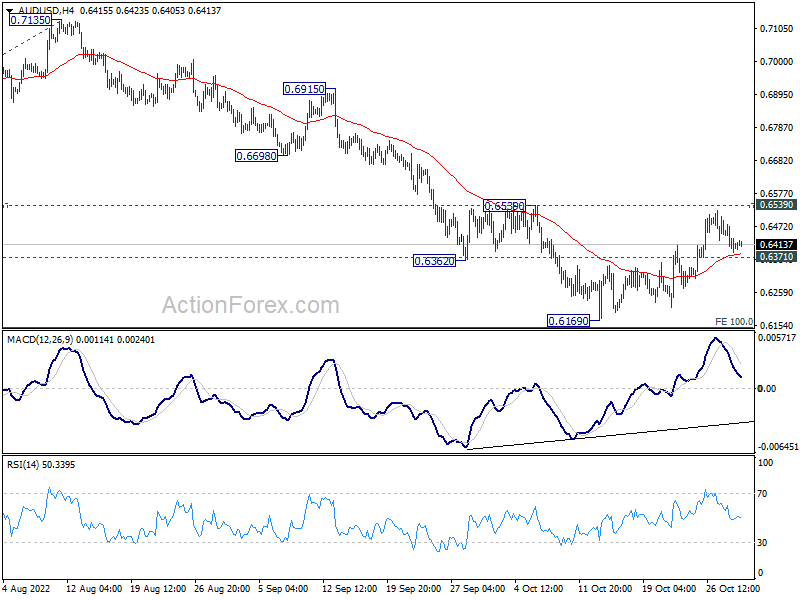
Daily Pivots: (S1) 0.6375; (P) 0.6427; (R1) 0.6466; More...
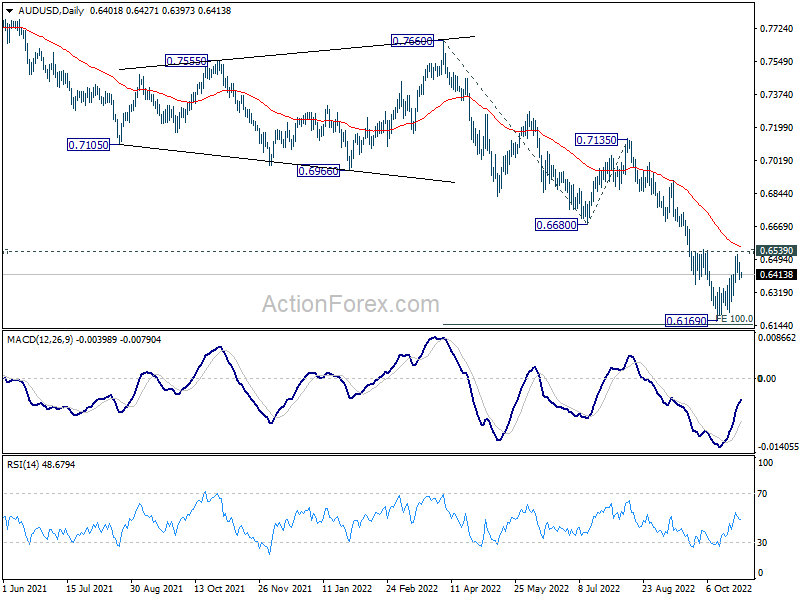
Intraday bias in AUD/USD remains neutral for the moment. On the upside, decisive break of 0.6535 resistance, and sustained trading above 55 day EMA (now at 0.6558), will raise the chance of medium term bottoming, and target 0.6680 support turned resistance next. On the downside, below 0.6371 minor support will turn bias back to the downside for retesting 0.6169 low instead.
In the bigger picture, down trend form 0.8006 (2021 high) is expected to continue as long as 0.6680 support turned resistance holds. Medium term momentum remains strong and retest of 0.5506 (2020 low) cannot be ruled out. But firm break of 0.6680 will be the first sign of reversal, and bring stronger rebound back to 0.7135 resistance.
USD/CAD Daily Outlook
Daily Pivots: (S1) 1.3544; (P) 1.3590; (R1) 1.3653; More....
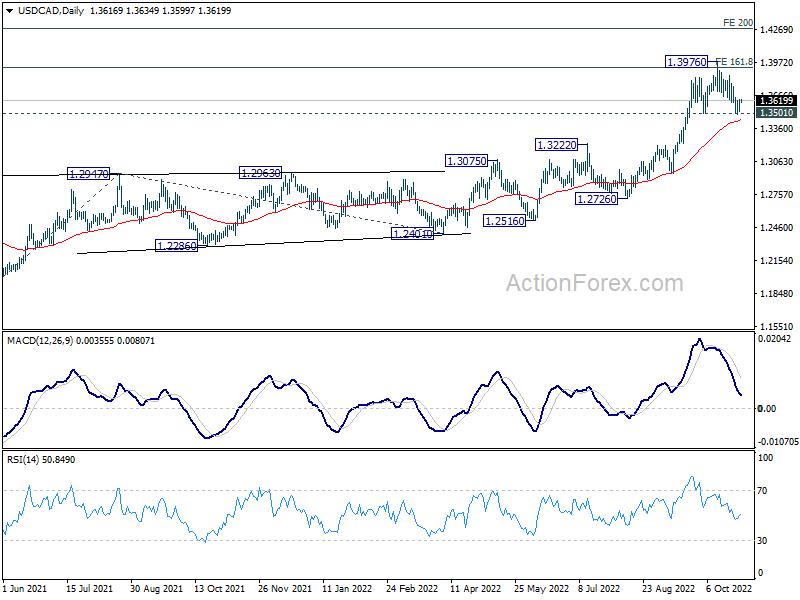
Intraday bias in USD/CAD remains neutral and further rise is still expected with 1.3501 support intact. On the upside, firm break of 1.3976 will target 200% projection of 1.2005 to 1.2947 from 1.2401 at 1.4285. However, firm break of 1.3501 will bring deeper correction to 55 day EMA (now at 1.3439) and possibly below.
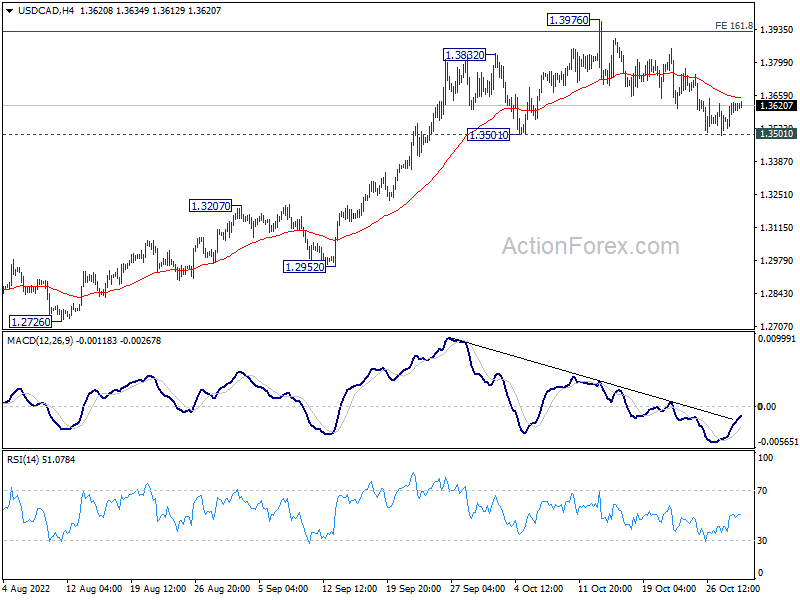
In the bigger picture, up trend from 1.2005 (2021 low) is still in progress. Based on current impulsive momentum, it could be resuming long term up trend from 0.9056 (2007 low). Whether it is or it isn't, retest of 1.4689 (2016 high) should be seen next. This will now remain the favored case as long as 1.3222 resistance turned support holds.