

Sample Category Title
AUD/USD Daily Report
Daily Pivots: (S1) 0.6368; (P) 0.6398; (R1) 0.6428; More...
AUD/USD recovered after drawing support from 0.6371, but stays below 0.6539 resistance. Intraday bias stays neutral first. On the upside, decisive break of 0.6535 resistance, and sustained trading above 55 day EMA (now at 0.6553), will raise the chance of medium term bottoming, and target 0.6680 support turned resistance next. On the downside, below 0.6371 minor support will turn bias back to the downside for retesting 0.6169 low instead.
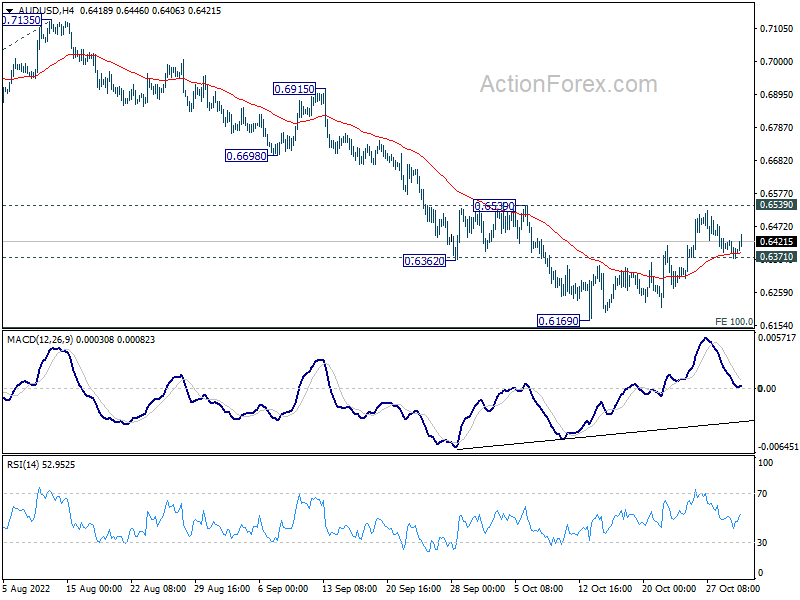
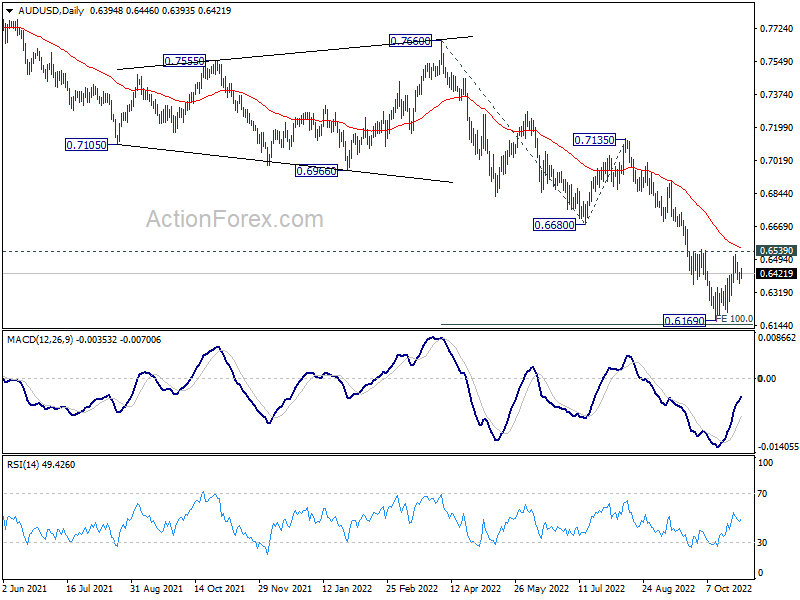
In the bigger picture, down trend form 0.8006 (2021 high) is expected to continue as long as 0.6680 support turned resistance holds. Medium term momentum remains strong and retest of 0.5506 (2020 low) cannot be ruled out. But firm break of 0.6680 will be the first sign of reversal, and bring stronger rebound back to 0.7135 resistance.
Aussie Higher after RBA Hike, Except Versus Kiwi
Australian Dollar trades higher today, following recovery in Asian stock markets. RBA hikes by 25 bps as widely expected and indicates more tightening to come ahead. There is little reaction as the message is well digested by the markets already. Nevertheless, Aussie is slightly outperformed by New Zealand Dollar for the moment. On the other hand, Dollar, Yen and Swiss France turned softer while European majors are mixed with Canadian.
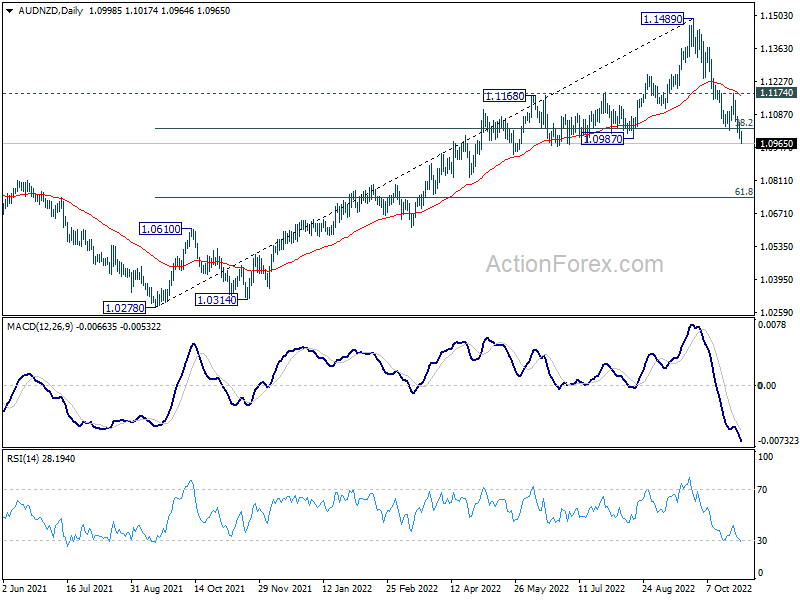
Technically, while Aussie is firmed elsewhere, it's extending recent decline against Kiwi. AUD/NZD's break of 1.0987 support suggests that deeper correction is underway. Near term outlook will stay bearish as long as 1.1174 resistance holds. Next target is 61.8% retracement of 1.0287 to 1.1489 at 1.0746. Such development would momentum of Aussie's rebound elsewhere.
In Asia, at the time of writing, Nikkei is up 0.11%. Hong Kong HSI is up 2.80%. China Shanghai SSE is up 1.03%. Singapore Strait Times is up 0.89%. Japan 10-year JGB yield is up 0.0101 at 0.255. Overnight, DOW dropped -0.39%. S&P 500 dropped -0.75%. NASDAQ dropped -1.03%. 10-year yield rose 0.0067 to 4.077.
RBA hikes 25bps, rates to rise further over the period ahead
RBA raises cash rate target by 25bps to 2.85% as widely expected. It maintains tightening bias and expects to "increase interest rates further over the period ahead". The size and timing of future rate hikes will be determined by incoming data and the outlook for inflation and labor market.
The central bank expects inflation to "further increase" over the months ahead and peak at around 8% this year. CPI inflation is forecast to be around 4.75% over 2023 and a little above 3% over 2024. GDP growth forecast was "revised down a little" to 3% this year, 1.50% in 2023 and 2024. Unemployment rate is forecast to rise gradually from current 3.5% to a little above 4% in 2024 as economic growth slow.
China Caixin PMI manufacturing recovered to 49.2, impact of Covid controls lingered
China Caixin PMI Manufacturing rose from 48.1 to 49.2 in October, above expectation of 49.0. Caixin noted that output and new orders fell again as COVID-19 containment measures continued. Selling prices fell for the sixth consecutive month. Business confidence edged up slightly.
Wang Zhe, Senior Economist at Caixin Insight Group said: "Overall, the negative impact of Covid controls on the economy lingered. In October, supply, domestic and overseas demand, and employment in the manufacturing sector all contracted, but the rates of contraction slowed from the previous month. Costs rose slightly, and cuts to output prices were still common. Logistics and transportation were still sluggish, and companies' purchases and inventories rose slightly. Market sentiment improved, but optimism remained limited from a long-term perspective.
Japan PMI manufacturing finalized at 50.7, but business remained optimistic
Japan PMI Manufacturing was finalized at 50.7 in October, slightly down from September's 50.8. That's the lowest level in 21 months. S&P Global noted that inflationary pressure remained severer. Business remained optimistic with sentiment at nine-month high.
Laura Denman, Economist at S&P Global Market Intelligence, said: "Sluggish markets and weaker demand conditions, on both a domestic and international level, became a recurring trend throughout the report and were seemingly the driving forces behind the slower sector performance... Meanwhile, inflationary pressures remained severe..
"Japanese manufacturing firms increased their selling prices more aggressively, as signalled by a near-record rate of output cost inflation.... Despite this, firms seem unfazed by the challenges that the sector is currently facing remaining optimistic towards their 12-month outlook on growth in October. In fact, the degree of confidence accelerated from September and reached a nine-month high."
Looking ahead
Germany import prices, Swiss SECO consumer climate and SVME PMI, UK PMI manufacturing final will be featured in European session. Later in the day, US ISM manufacturing will take center stage while Canada will release PMI manufacturing.
AUD/USD Daily Report
Daily Pivots: (S1) 0.6368; (P) 0.6398; (R1) 0.6428; More...
AUD/USD recovered after drawing support from 0.6371, but stays below 0.6539 resistance. Intraday bias stays neutral first. On the upside, decisive break of 0.6535 resistance, and sustained trading above 55 day EMA (now at 0.6553), will raise the chance of medium term bottoming, and target 0.6680 support turned resistance next. On the downside, below 0.6371 minor support will turn bias back to the downside for retesting 0.6169 low instead.
In the bigger picture, down trend form 0.8006 (2021 high) is expected to continue as long as 0.6680 support turned resistance holds. Medium term momentum remains strong and retest of 0.5506 (2020 low) cannot be ruled out. But firm break of 0.6680 will be the first sign of reversal, and bring stronger rebound back to 0.7135 resistance.
Economic Indicators Update
| GMT | Ccy | Events | Actual | Forecast | Previous | Revised |
|---|---|---|---|---|---|---|
| 21:45 | NZD | Building Permits M/M Sep | 3.80% | -1.60% | ||
| 00:30 | JPY | Manufacturing PMI Oct F | 50.7 | 50.7 | 50.7 | |
| 01:45 | CNY | Caixin Manufacturing PMI Oct | 49.2 | 49 | 48.1 | |
| 03:30 | AUD | RBA Interest Rate Decision | 2.85% | 2.85% | 2.60% | |
| 07:00 | EUR | Germany Import Price Index M/M Sep | 0.60% | 4.30% | ||
| 08:00 | CHF | SECO Consumer Climate Q4 | -43 | -42 | ||
| 08:30 | CHF | SVME PMI Oct | 56 | 57.1 | ||
| 09:30 | GBP | Manufacturing PMI Oct F | 45.8 | 45.8 | ||
| 13:30 | CAD | Manufacturing PMI Oct | 49.2 | 49.8 | ||
| 13:45 | USD | Manufacturing PMI Oct F | 49.9 | 49.9 | ||
| 14:00 | USD | ISM Manufacturing PMI Oct | 50 | 50.9 | ||
| 14:00 | USD | ISM Manufacturing Prices Paid Oct | 53 | 51.7 | ||
| 14:00 | USD | ISM Manufacturing Employment Index Oct | 48.7 | |||
| 14:00 | USD | Construction Spending M/M Sep | -0.50% | -0.70% |
Technical Outlook and Review
USD/JPY:
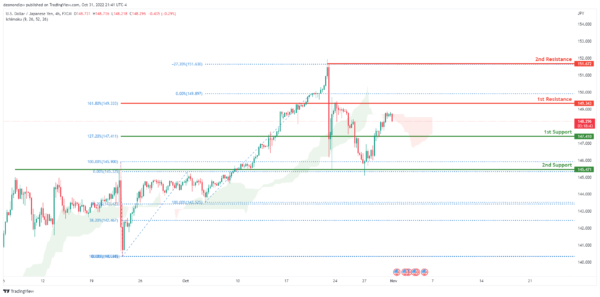
The current general bias for USDJPY on the H4 chart is bullish. Overnight, USDJPY had some bearish momentum downwards. Price is currently trading above the support at 147.710 at time of writing. If this bullish momentum continues, expect USDJPY to head upwards and retest the 1st resistance at 149.343 where the 161.8% Fibonacci extension line is located.
Areas of consideration:
- H4 time frame, 1st resistance at 149.343
- H4 time frame, 1st support at 147.410
DXY:
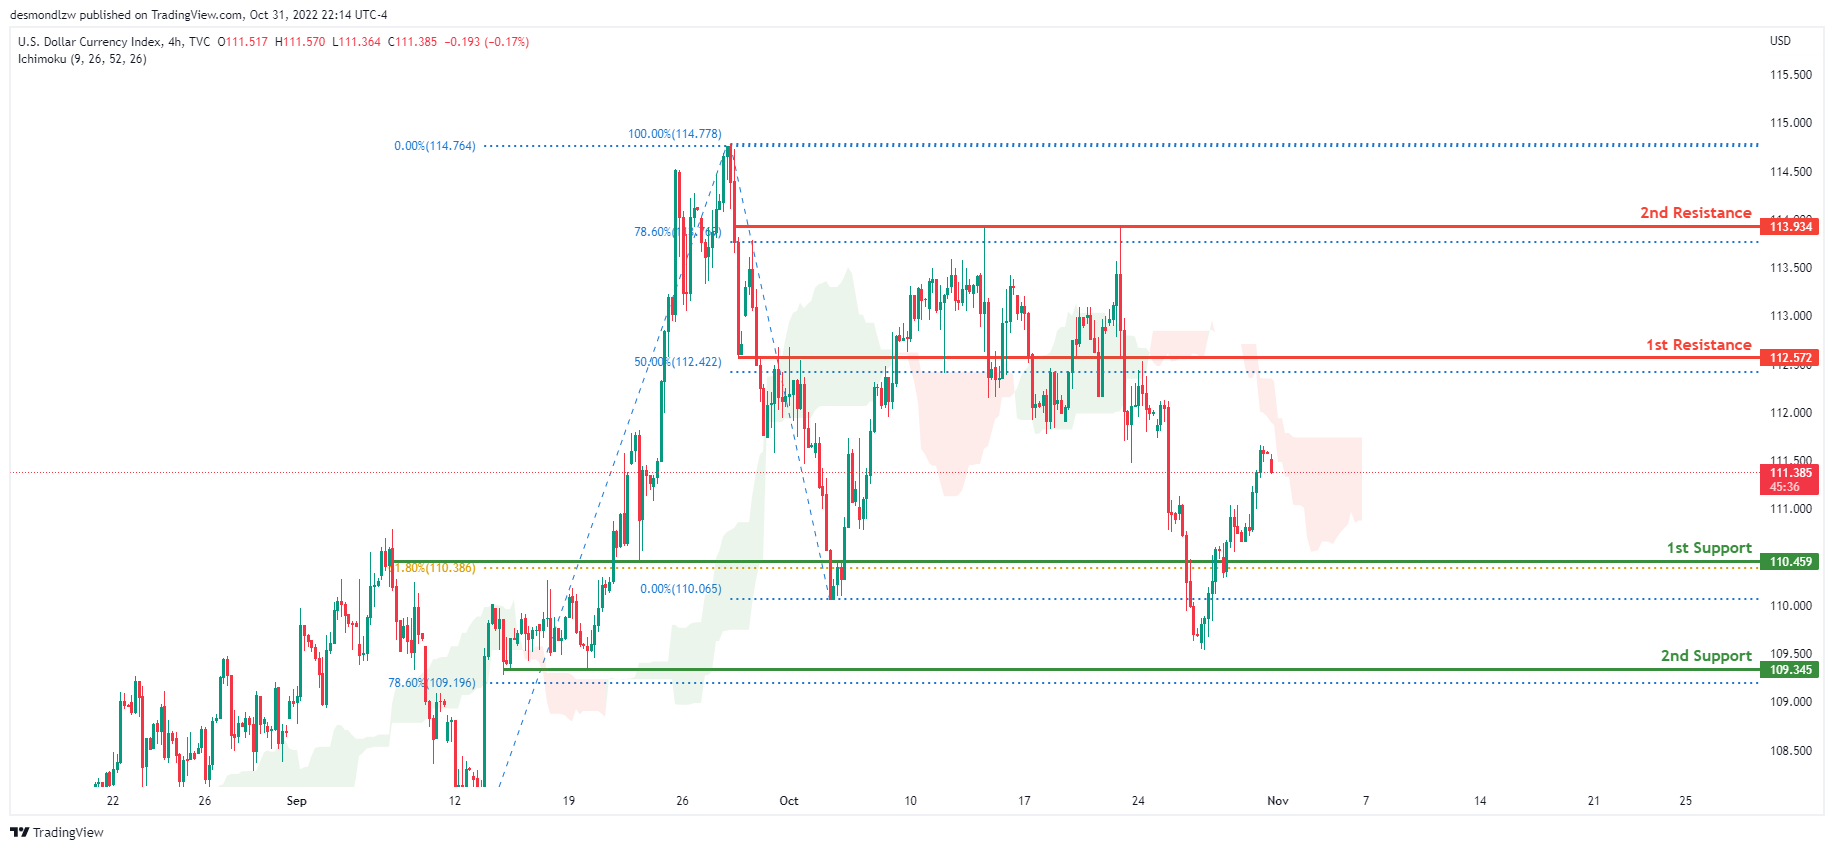
On the H4 chart, the overall bias for DXY is bearish. To add confluence to this, the price is below the Ichimoku cloud which indicates a bearish market. Overnight, DXY had bullish momentum upwards with the price currently trading at 111.377 at time of writing. If this bearish momentum continues, expect price to possibly head towards the 2nd support at 109.340, where the 78.6% Fibonacci line is located.
Areas of consideration:
- H4 time frame, 1st resistance at 112.572
- H4 time frame, 1st support at 110.459
EUR/USD:
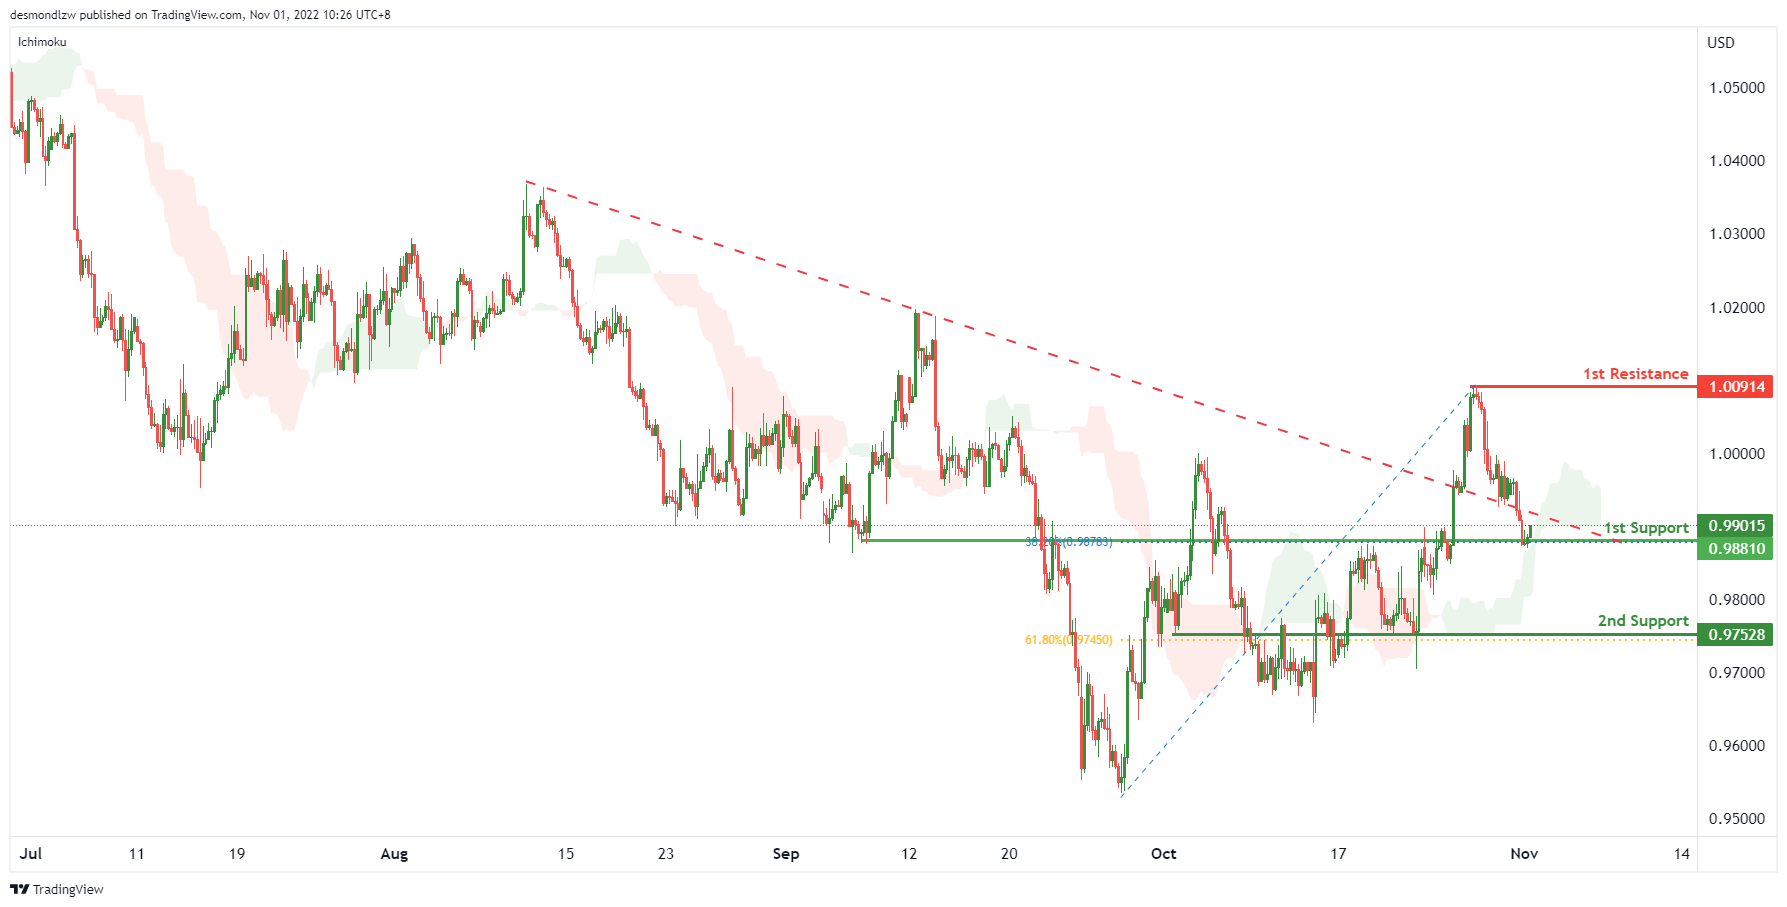
On the H4, with the price dropping back to the long term descending trendline, the price may break the 1st support at 0.98810, which is in line with the 38.2% fibonacci retracement and overlap support. If the 1st support is broken, the price may drop to the 2nd support at 0.97528, where the 61.8% fibonacci retracement and overlap support are. Alternatively, as the price is still above ichimoku cloud, we can expect the price bounce off from the 1st support and rise to the 1st resistance at 1.00914, which is in line with the previous swing high.
Areas of consideration :
- H4 1st support at 0.98810
- H4 2nd support at 0.97528
GBP/USD:
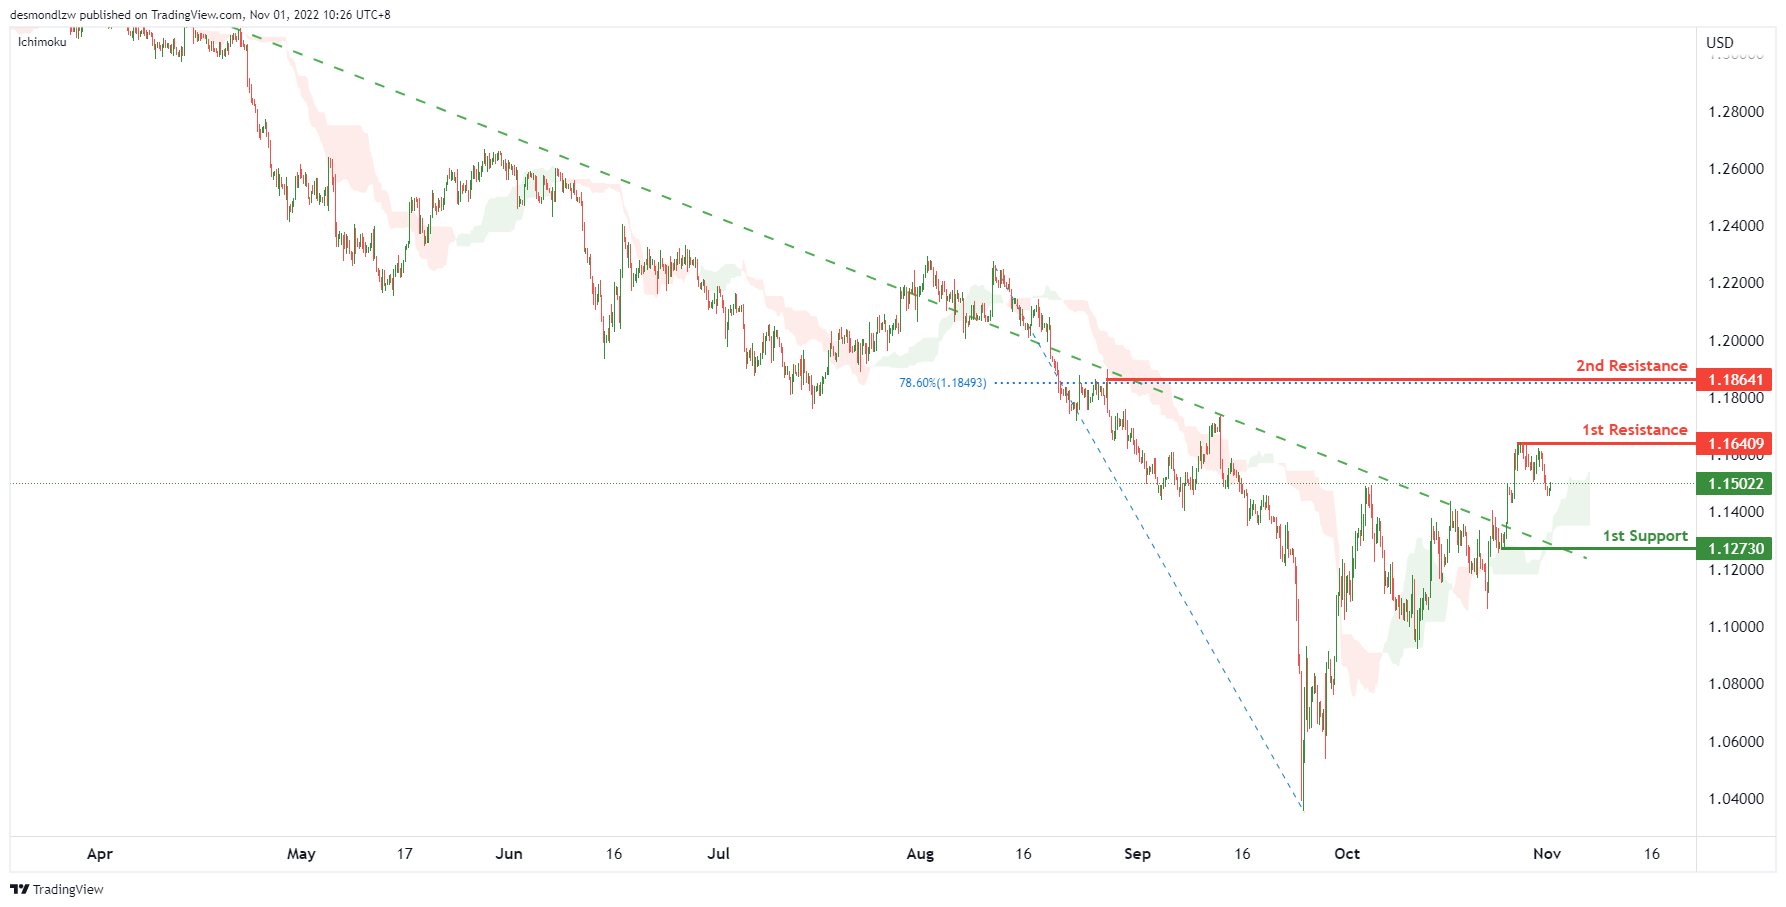
On the H4, price is above the ichimoku cloud and breaking the descending trendline, we have a bullish bias that the price may test the 1st resistance at 1.16409, which is in line with the previous swing high. If the 1st resistance is broken, the 2nd resistance is at 1.18641, where the 78.6% fibonacci retracement sits. Alternatively, the price may drop to the 1st support at 1.12730, where the swing low support is.
Areas of consideration:
- H4 current price
- H4 1st resistance at 1.16409
USD/CHF:
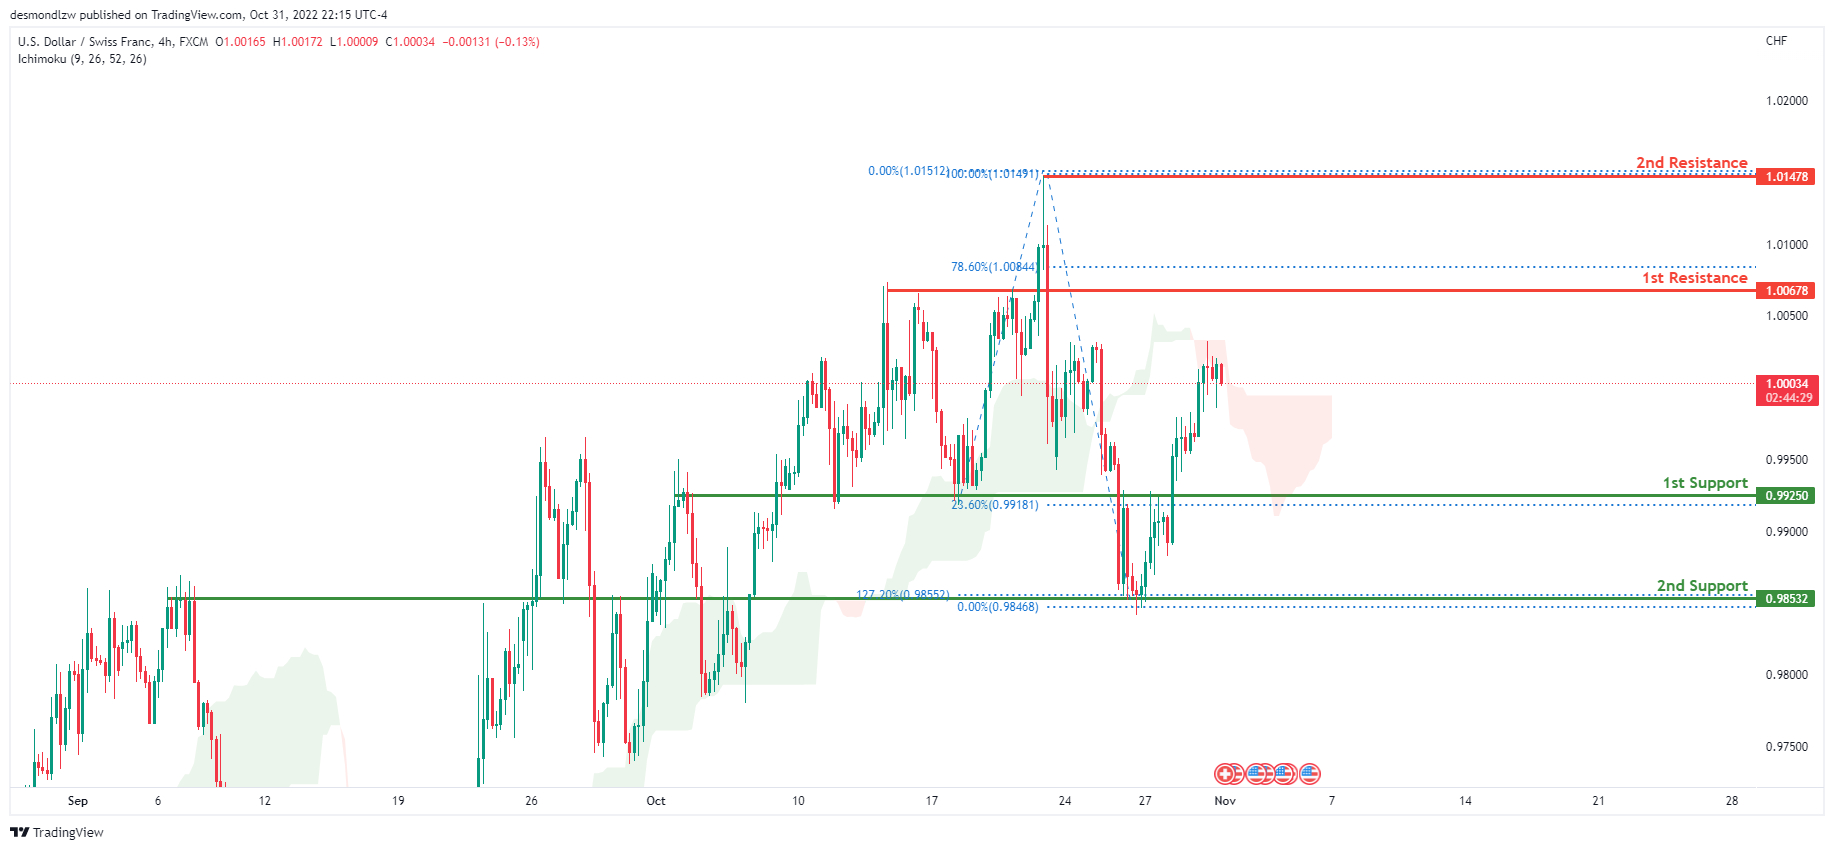
On the H4 chart, the overall bias for USDCHF is bearish. To add confluence to this, the price is below the Ichimoku cloud which indicates a bearish market. Overnight, USDCHF had some bullish momentum upwards with price currently trading at 1.00045 at time of writing. Expecting price to possibly head back up to retest the 1st resistance line at 1.00678 where the 78.6% Fibonacci line is located.
Areas of consideration
- H4 1st support at 0.99250
- H4 2nd support at 0.98532
- H4 1st resistance at 1.00678
XAU/USD (GOLD):
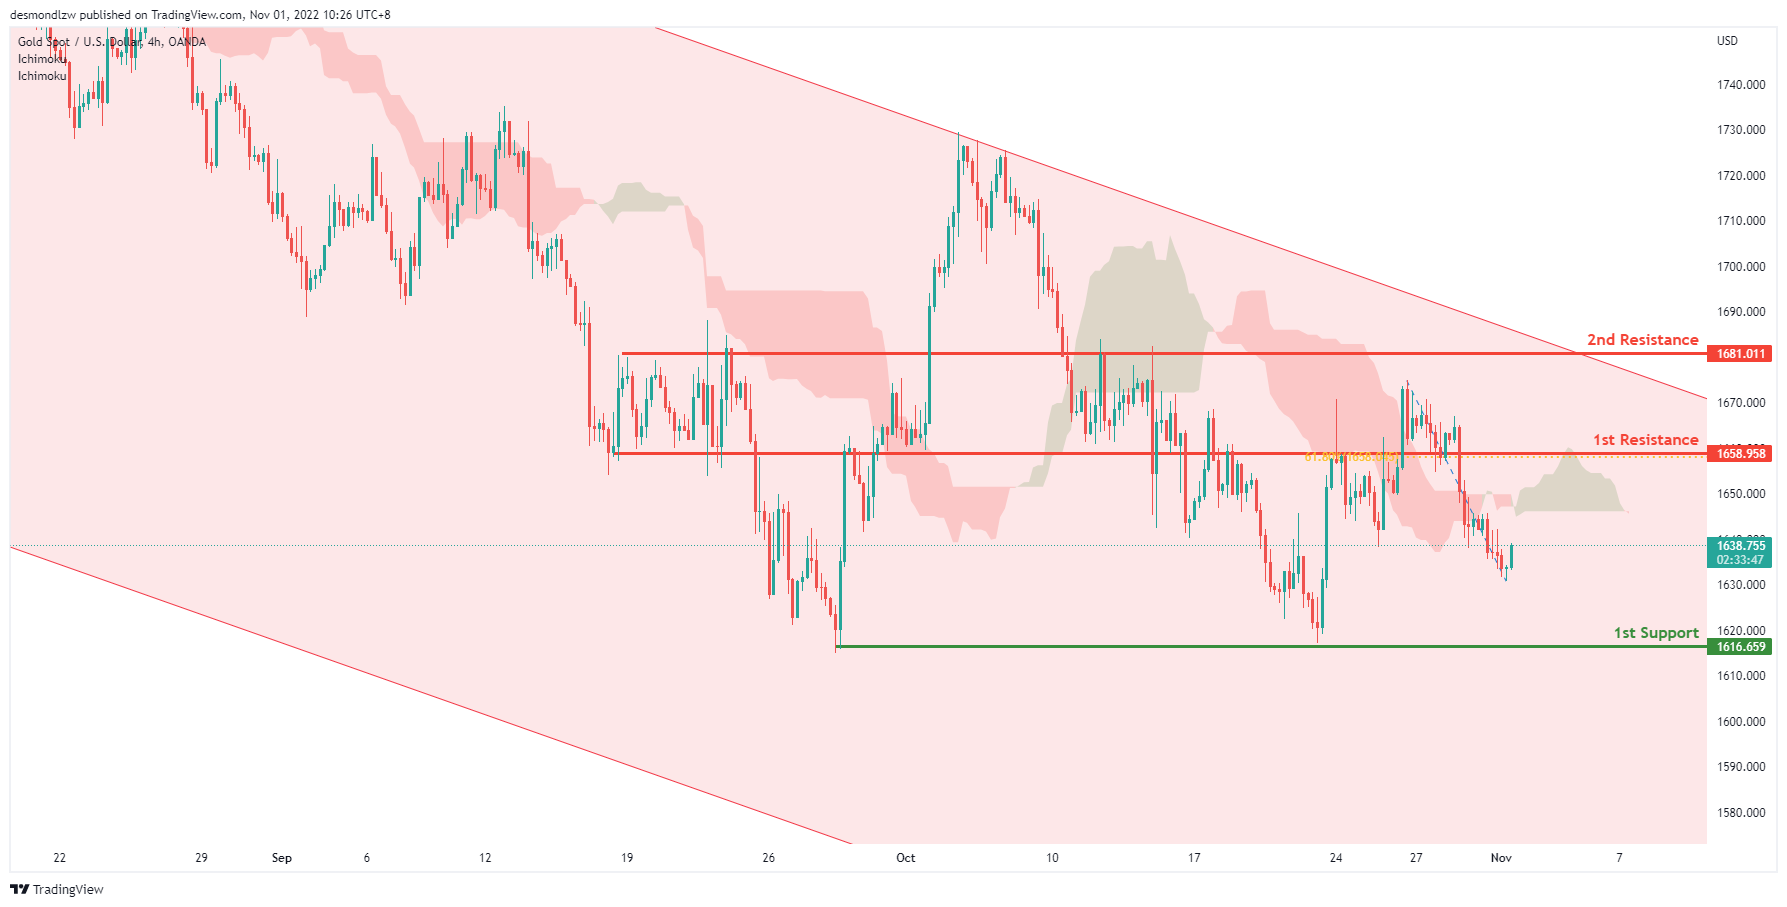
On H4, with the price within the descending channel and crossing ichimoku cloud, we have a bearish bias that the price may drop to the 1st support at 1616.659, where the previous swing lows are. Alternatively, the price may rise to retest the 1st resistance at 1658.958, which is in line with the 61.8% fibonacci retracement and overlap resistance. If the 1st resistance is broken, the 2nd resistance is at 1681.011, where the previous swing highs are
Areas of consideration:
- H4 time frame, 1st support at 1616.659
- H4 time frame, 1st resistance at 1658.958
AUD/USD:
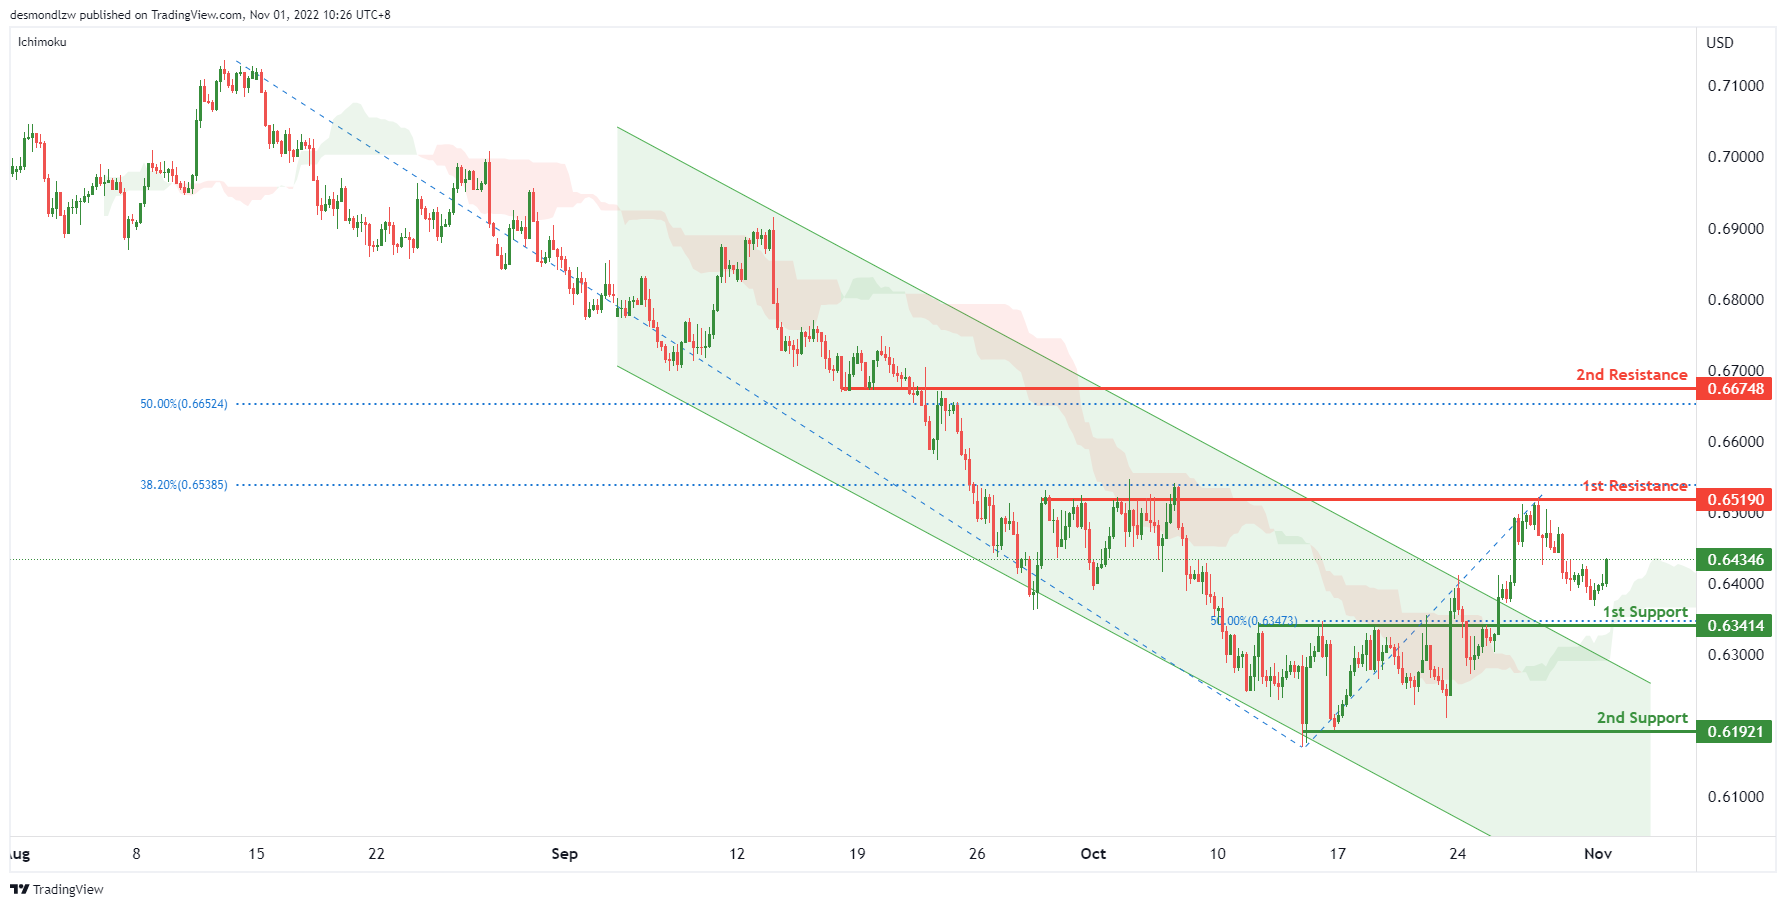
On the H4, with the price breaking the descending channel and above ichimoku cloud, we have a bullish bias that the price may retest the 1st resistance at 0.65190, which is in line with the overlap resistance, if the 1st resistance is broken, the 2nd resistance is at 0.66748, where the 50% fibonacci retracement is. Alternatively, the price may drop to the 1st support at 0.63414, which is in line with the 50% fibonacci retracement. If the 1st support is broken, the price may drop to the 2nd support at 0.61921, where the previous swing low is.
Areas of consideration
- H4, 1st resistance at 0.65190
- H4, 1st support at 0.63414
NZD/USD:
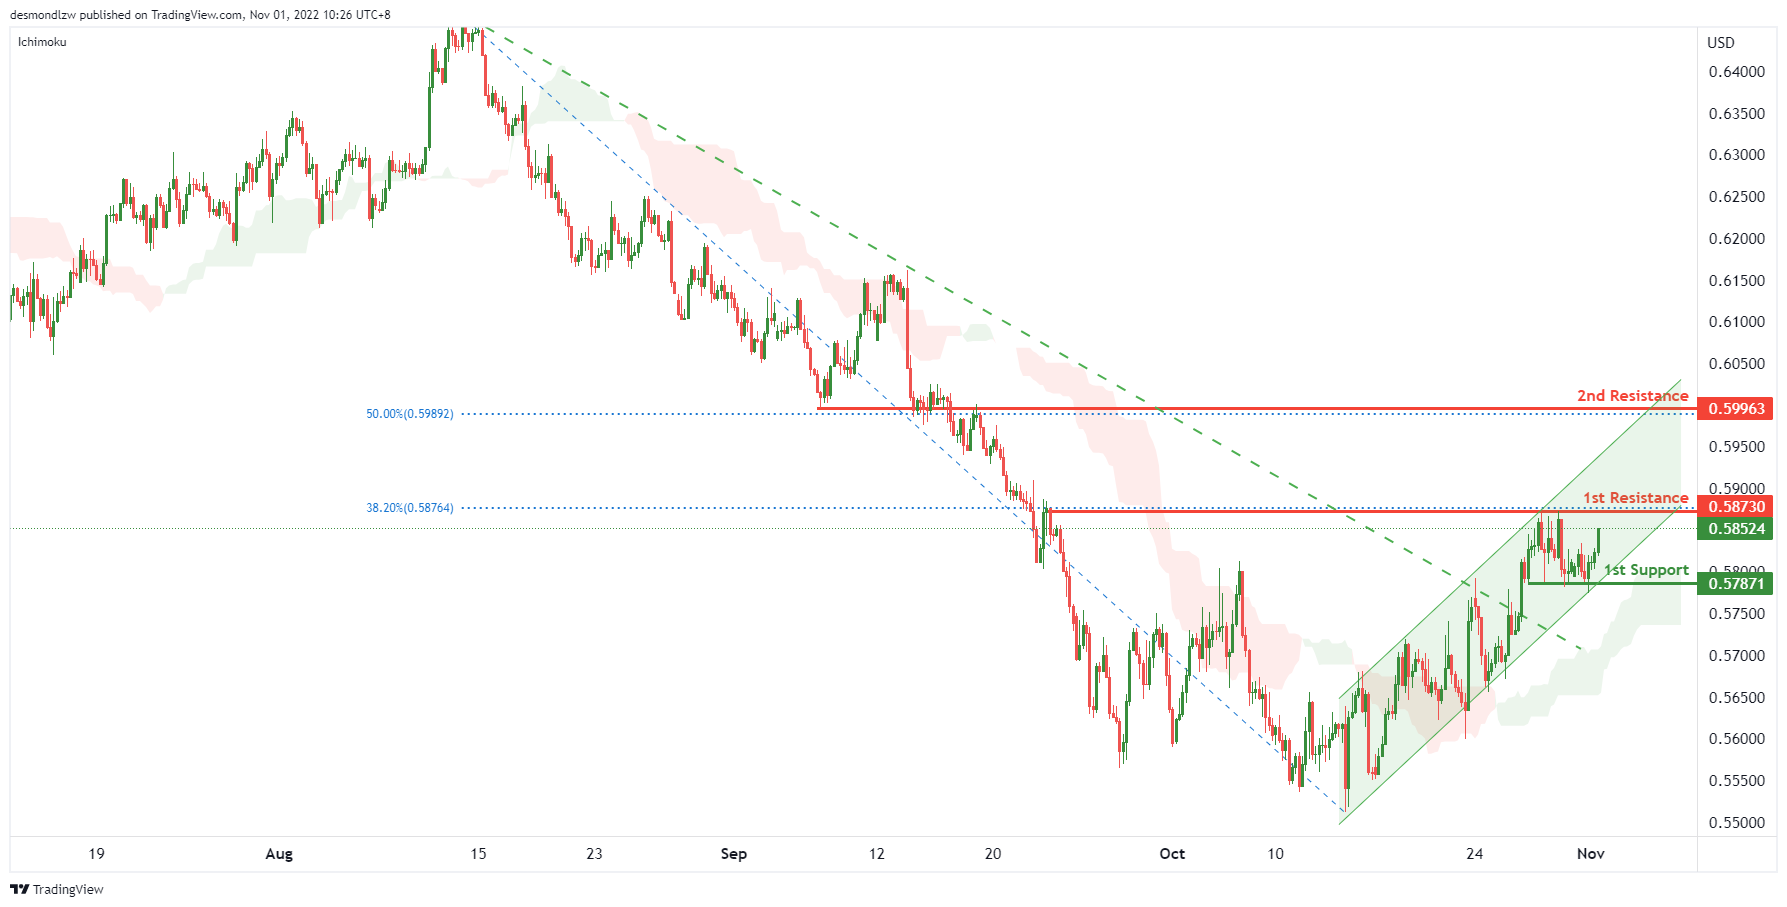
On the H4 chart, as the price is breaking the descending trendline, moving within the ascending channel and the price is above ichimoku cloud, we have a bullish bias that the price may rise to the 1st resistance at 0.58730, which is in line with the previous swing high and 38.2% fibonacci retracement. If the 1st resistance is broken, the 2nd resistance is at 0.59963, where the 50% fibonacci retracement is. Alternatively, the price may drop to the 1st support at 0.57871, where the previous swing lows and 50% fibonacci retracement are.
Areas of consideration:
- H4 time frame, 1st resistance at 0.58730
- H4 time frame, 2nd resistance at 0.59963
USD/CAD:
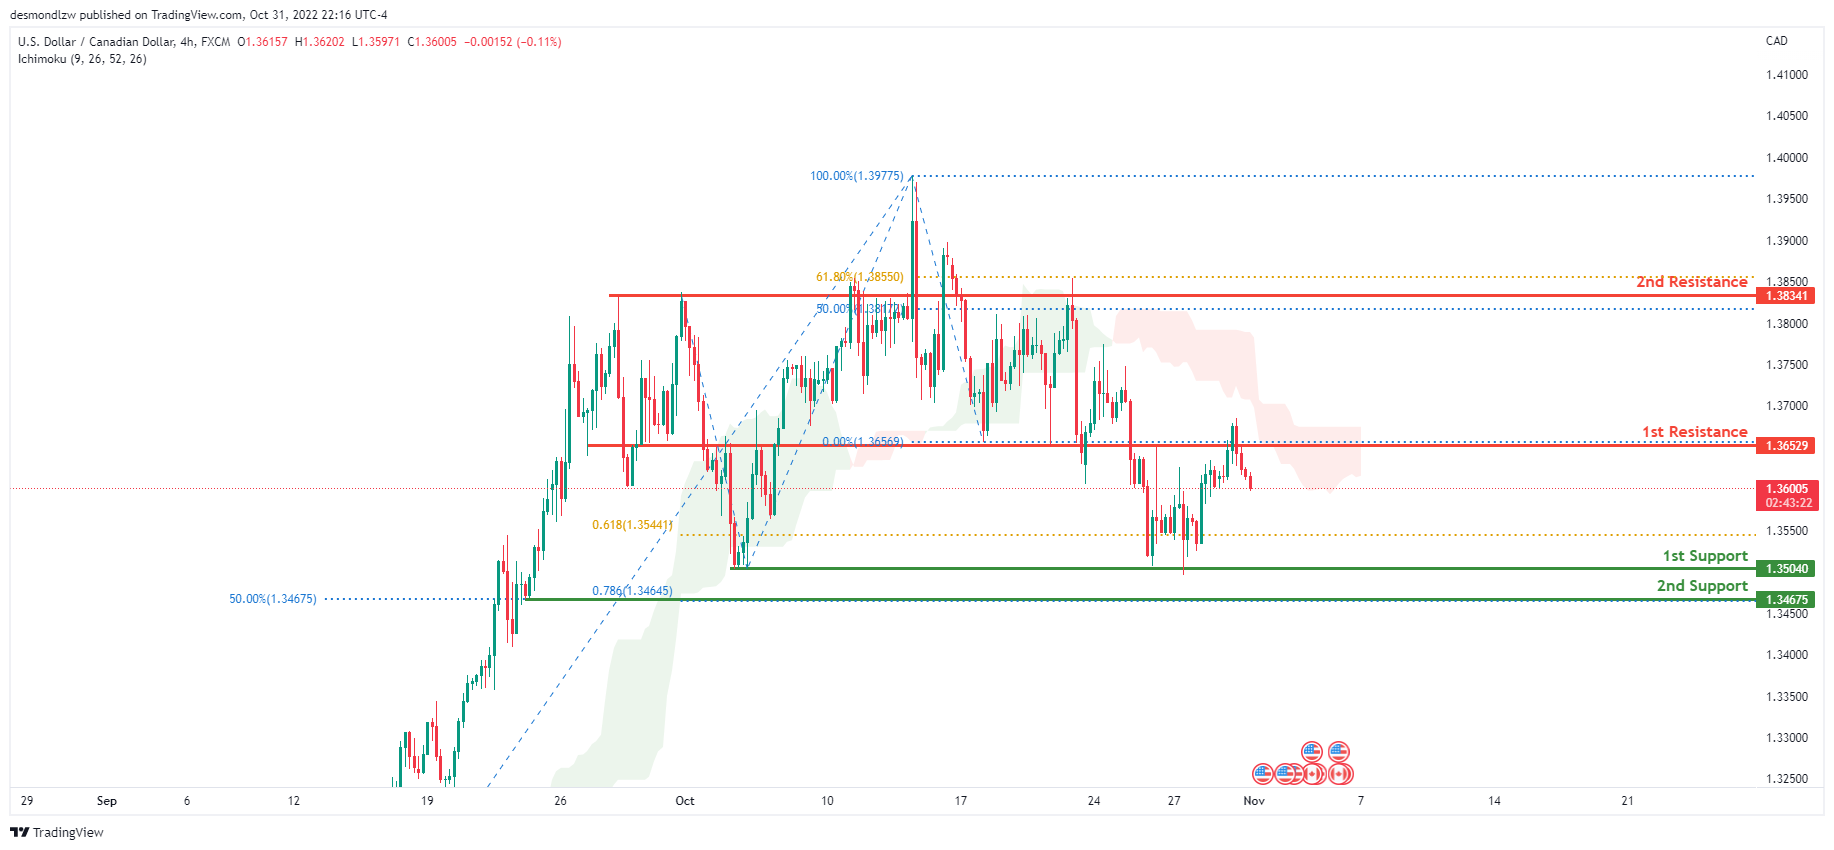
On the H4 chart, the overall bias for USDCAD is bearish. To add confluence to this, the price is below the Ichimoku cloud which indicates a bearish market. Overnight, price reflected off the 1st resistance at 1.36751 where the 0% fibonacci line is located. If this bearish momentum continues, the price to head towards the 1st support at 1.35040 where the previous swing low and 61.8% Fibonacci projection line is located.
Areas of consideration:
- H4 time frame, 1st resistance at 1.36751
- H4 time frame, 1st support at 1.35029
- H4 time frame, 2nd support at 1.34675
OIL:
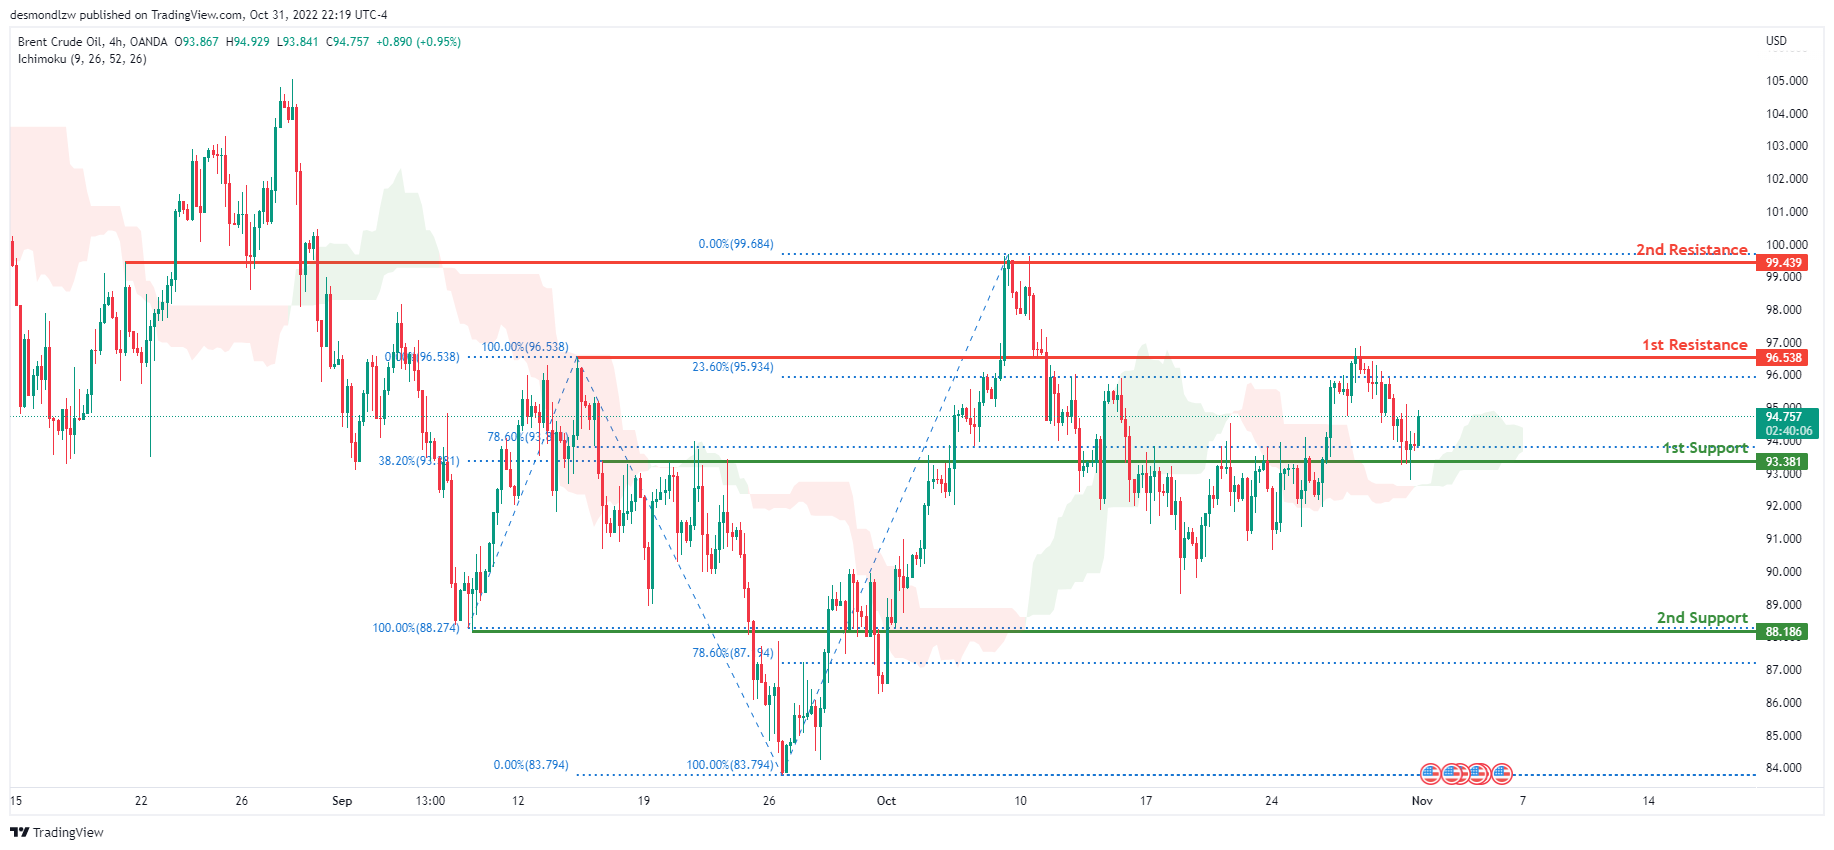
Looking at the H4 chart, the current overall bias for Oil is bullish. To add confluence to this, the price is above the Ichimoku cloud which indicates a bullish market. Overnight, price reflected off the 1st support line at 93.381 where the 78.6% and 38.2% Fibonacci lines are located. If this bullish momentum continues, expect price to possibly break above the 1st resistance at 96.538 where the 100% and 23.6% Fibonacci lines are and head towards the 2nd resistance at 99.439 where previous swing high and 0% Fibonacci line is located.
Areas of consideration:
- H4 time frame, 1st resistance at 93.381
- H4 time frame, 2nd resistance at 99.439
- H4 time frame, 1st support at 93.381
Dow Jones Industrial Average:
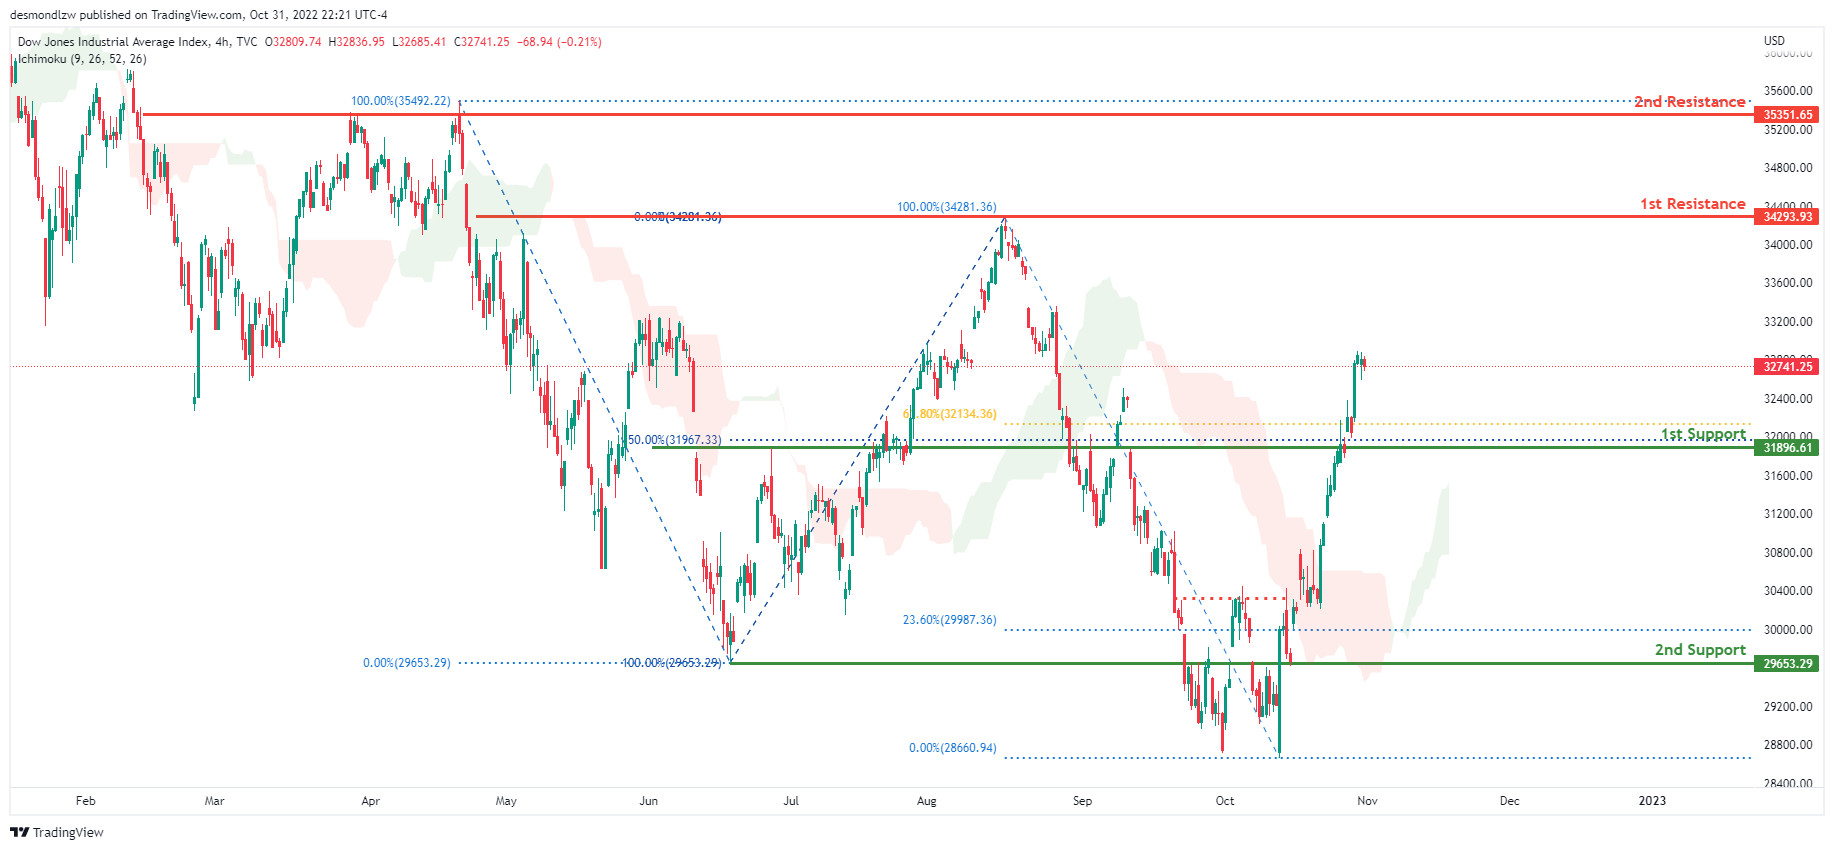
On the H4 chart, the overall bias for DJI is bullish. To add confluence to this, the price is above the Ichimoku cloud which indicates a bullish market. Overnight, DXY consolidated around the area of 32741.25. If this bullish momentum continues, expect the price to possibly head towards the 1st resistance at 34293.93 where the previous swing high and 100% Fibonacci line is located.
Areas of consideration:
- H4 time frame, 1st support at 31896.61
- H4 time frame, 1st Resistance at 34293.93
DAX:
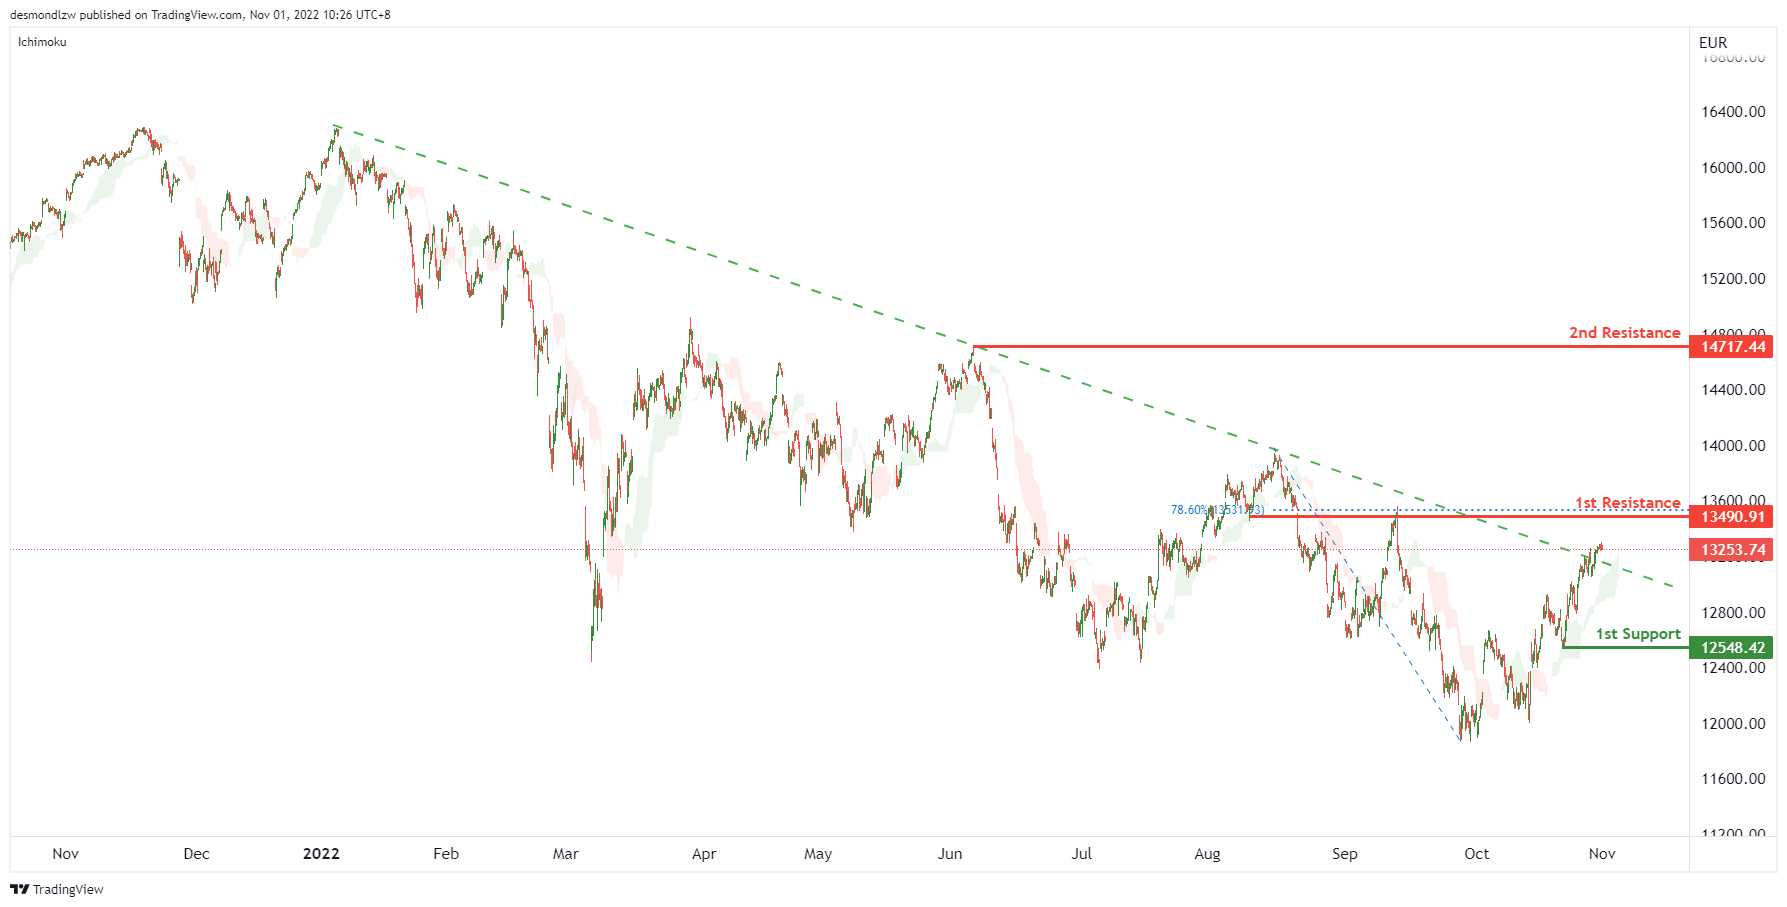
On the H4 chart, the price has now closed above the Ichimoku cloud which indicates a breakout of a descending trendline. Expecting price to possibly continue this bullish momentum and head towards the 1st resistance at 13490.91, where the 78.6% Fibonacci line is located. If the 1st resistance is broken, the 2nd resistance could be at 14717.44, which is in line with the previous swing high. Alternatively, the price may drop to the 1st support at 12548.42, which is in line with the swing low.
Areas of consideration:
- H4 time frame, 1st resistance at 13490.91
- H4 time frame, 2nd resistance at 14717.44
ETHUSD:
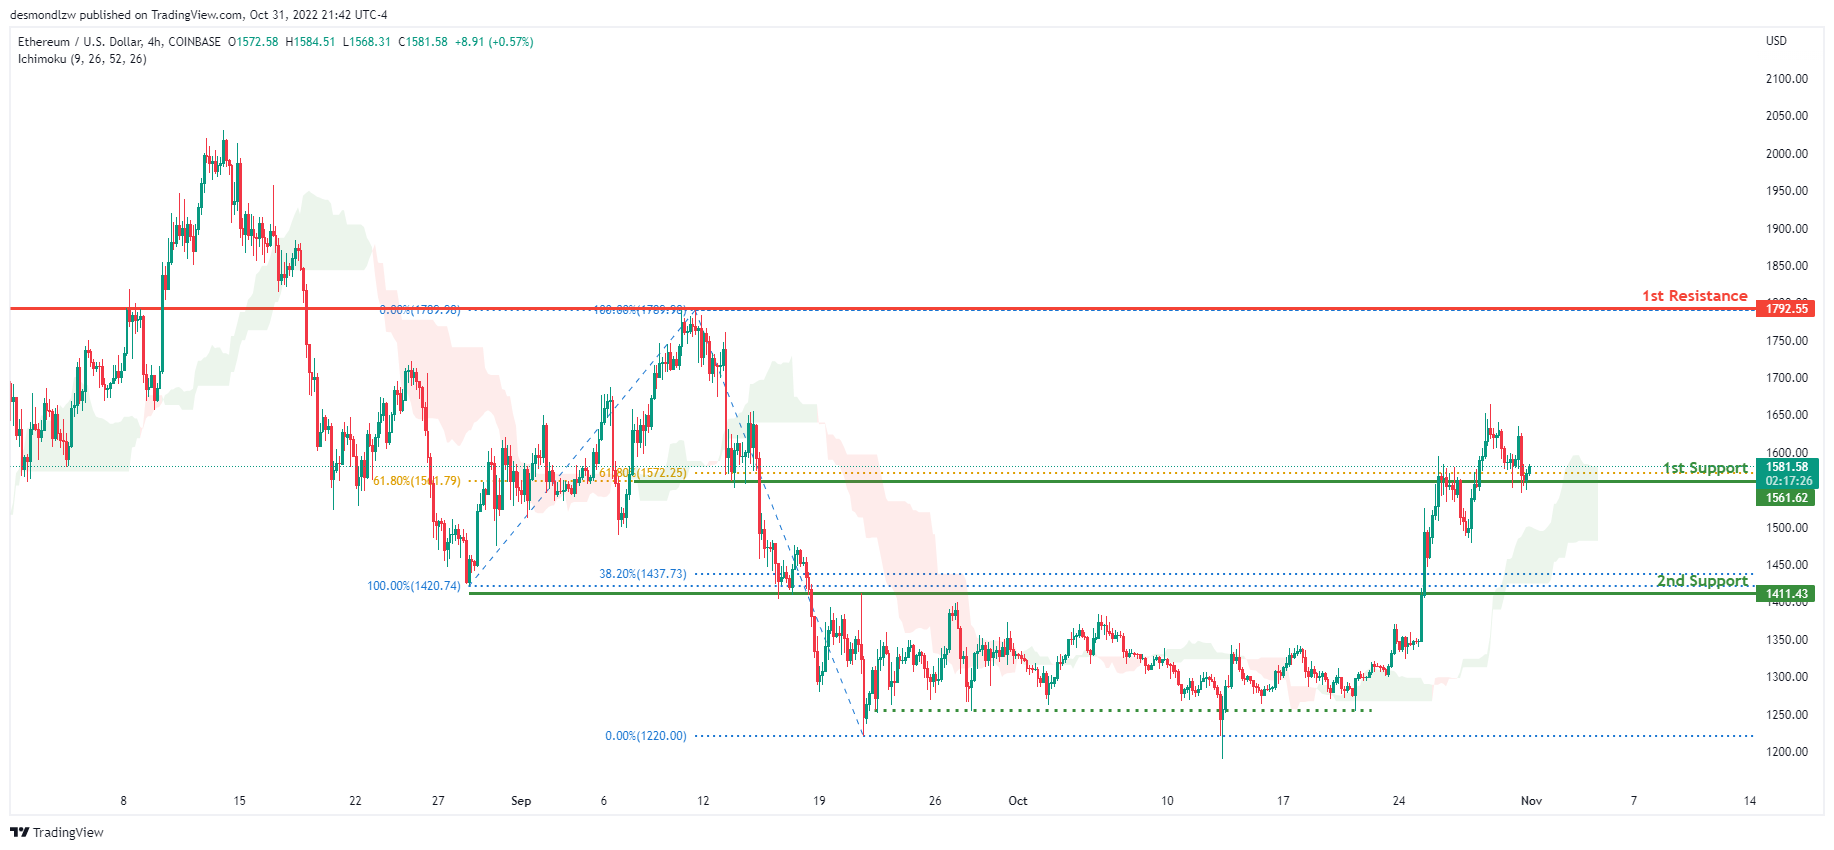
Looking at the H4 chart, the current overall bias for ETHUSD is bullish. To add confluence to this, the price is above the Ichimoku cloud which indicates a bullish market. Overnight, price had bearish momentum downwards with the price currently resting on the 1st support level at 1561.62 where 2 of the 61.8% Fibonacci lines are located. If this bullish momentum continues, expect the price to head towards the 1st resistance at 1792.55 where the previous swing high and 100% Fibonacci line is located.
Areas of consideration:
- H4 time frame, 1st resistance of 1792.55
- H4 time frame, 1st support at 1561.62
BTCUSD:
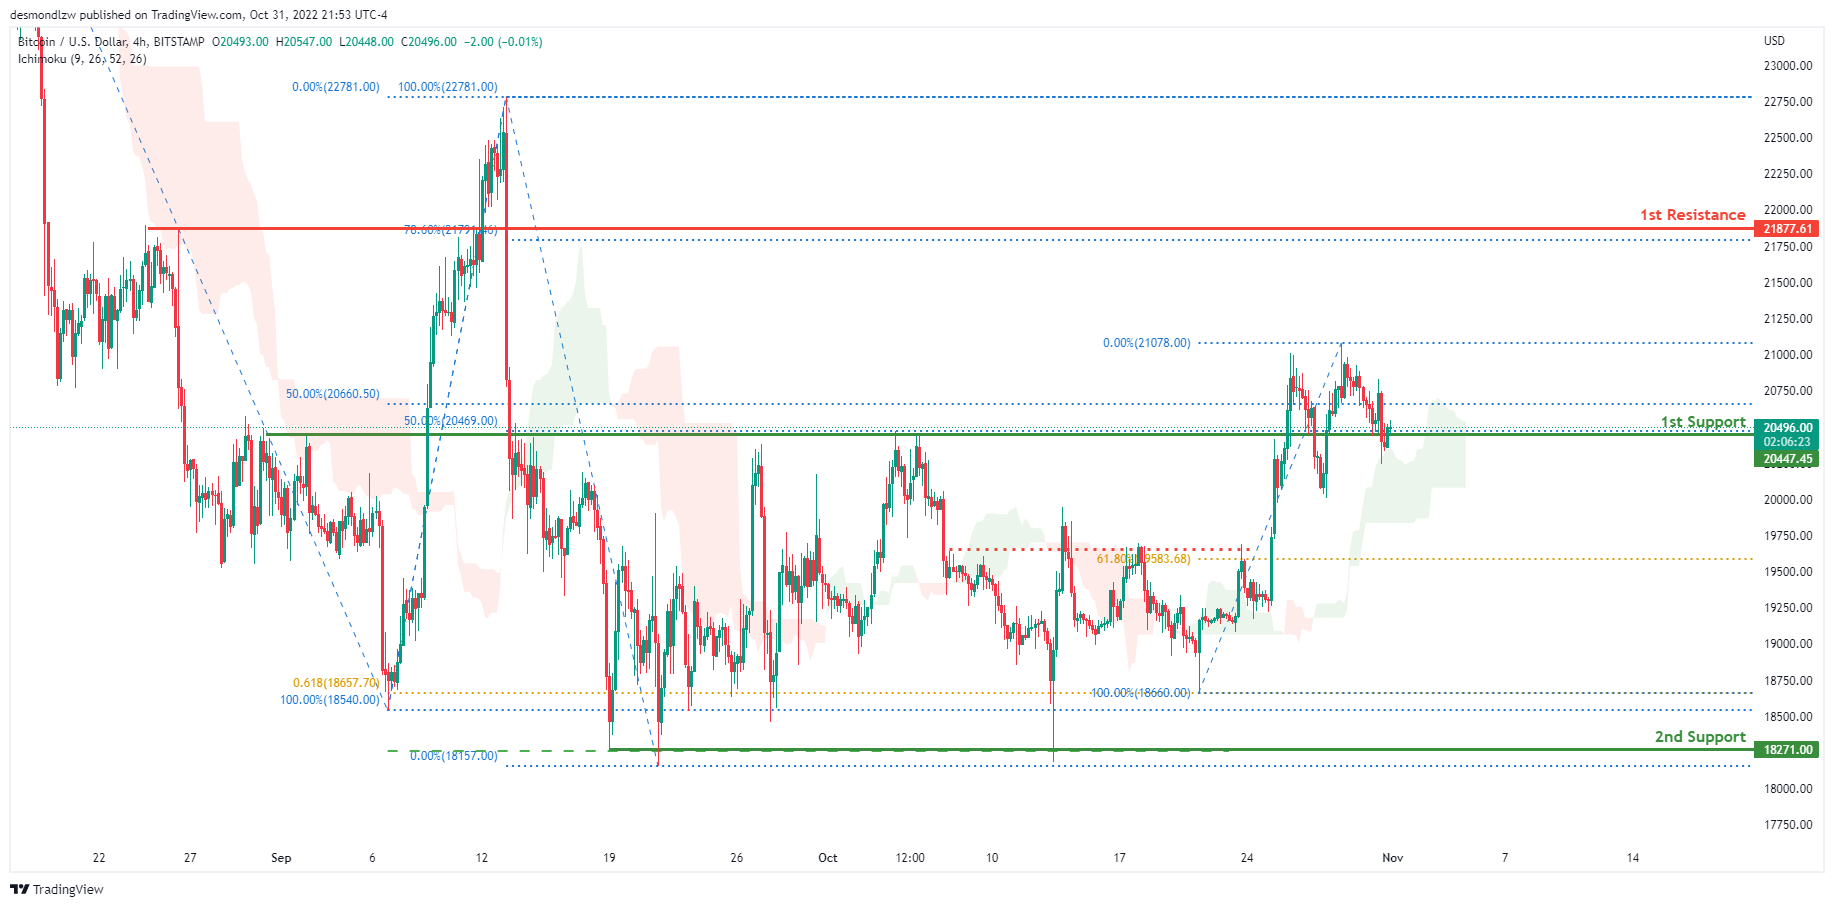
On the H4 chart, the overall bias for BTCUSD is bullish. To add confluence to this, the price is above the Ichimoku cloud which indicates a bullish market. Overnight, price retraced downwards and is currently resting on the 1st support at 20440.00 where the 2 of the 50% Fibonacci lines are located. If this bullish momentum continues, expect the price to head towards the 1st resistance at 21892.00, where the 78.6% Fibonacci line is located.
Areas of consideration:
- H4 time frame, 1st resistance 21892.00
- H4 time frame, 1st support at 20440.00
S&P 500:
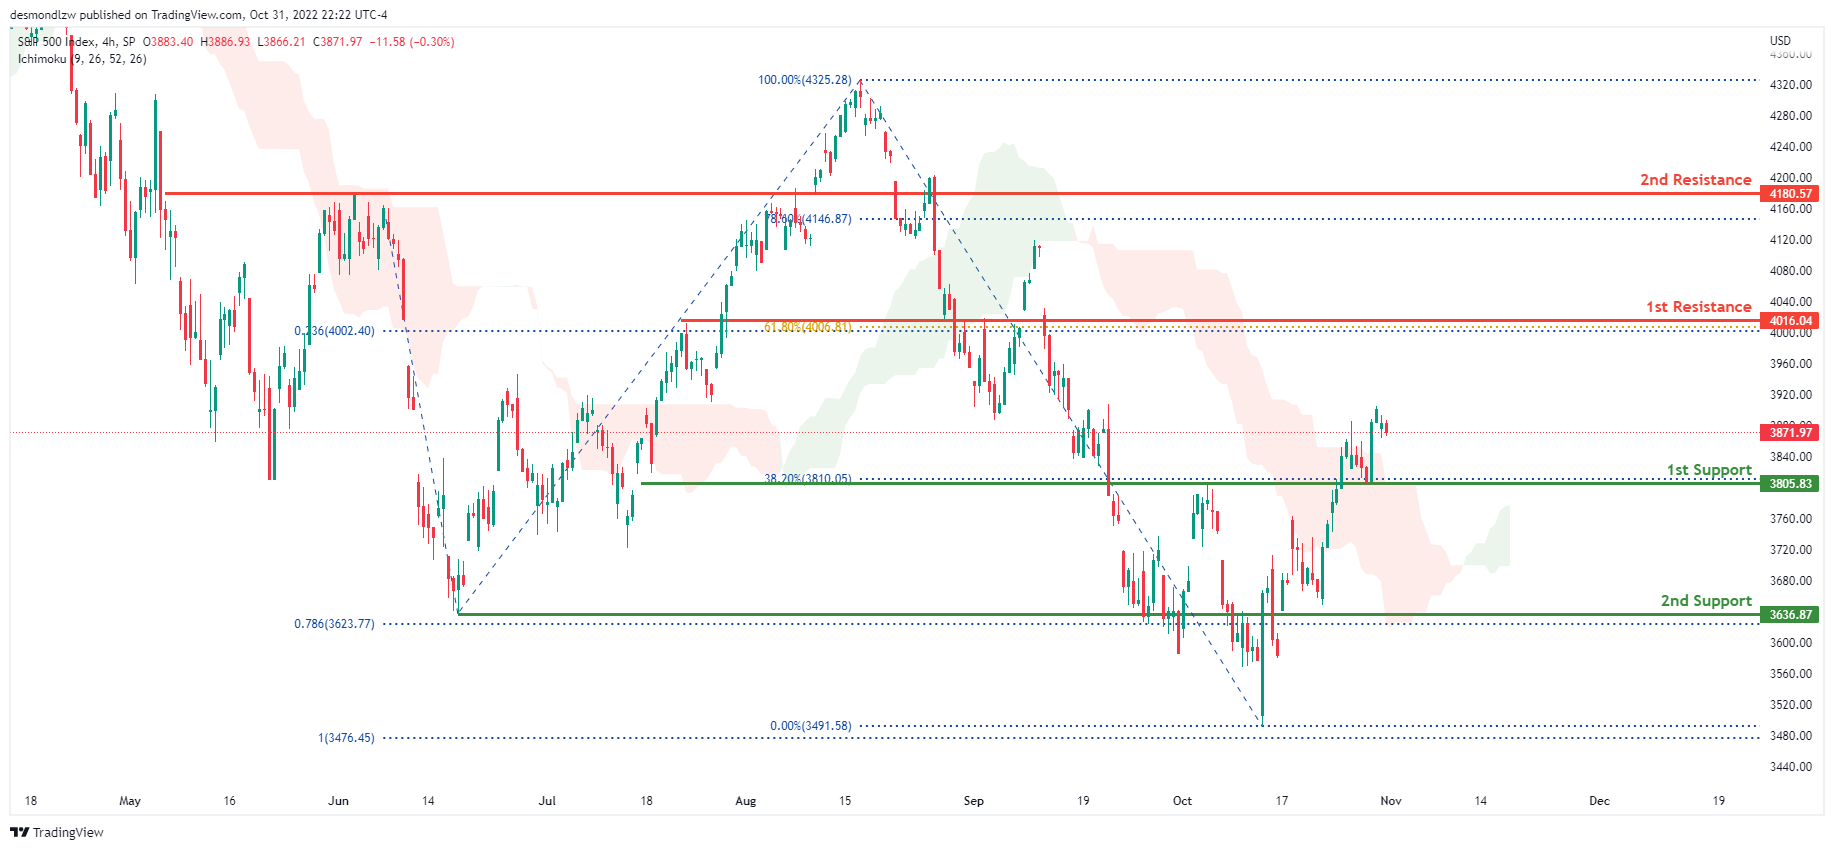
On the H4 chart, the overall bias for S&P500 is bullish. To add confluence to this, the price is above the Ichimoku cloud which indicates a bullish market. Overnight, price continued to consolidate with price currently trading at 3871.97 at time of writing. If this bullish momentum continues, expect price to possibly head towards the 1st resistance at 4016.04 where the 61.8% Fibonacci line and 23.6% Fibonacci projection line is located.
Areas of consideration:
- H4 time frame, 1st support at 3805.83
- H4 time frame, 1st resistance at 4016.04
China Caixin PMI manufacturing recovered to 49.2, impact of Covid controls lingered
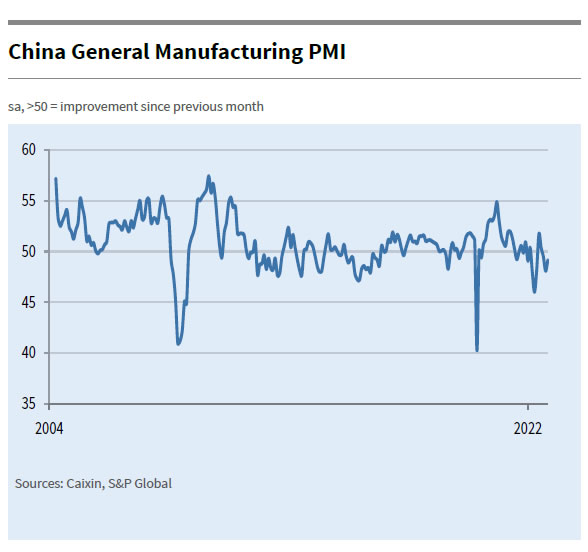
China Caixin PMI Manufacturing rose from 48.1 to 49.2 in October, above expectation of 49.0. Caixin noted that output and new orders fell again as COVID-19 containment measures continued. Selling prices fell for the sixth consecutive month. Business confidence edged up slightly.
Wang Zhe, Senior Economist at Caixin Insight Group said: "Overall, the negative impact of Covid controls on the economy lingered. In October, supply, domestic and overseas demand, and employment in the manufacturing sector all contracted, but the rates of contraction slowed from the previous month. Costs rose slightly, and cuts to output prices were still common. Logistics and transportation were still sluggish, and companies' purchases and inventories rose slightly. Market sentiment improved, but optimism remained limited from a long-term perspective.
Japan PMI manufacturing finalized at 50.7, but business remained optimistic
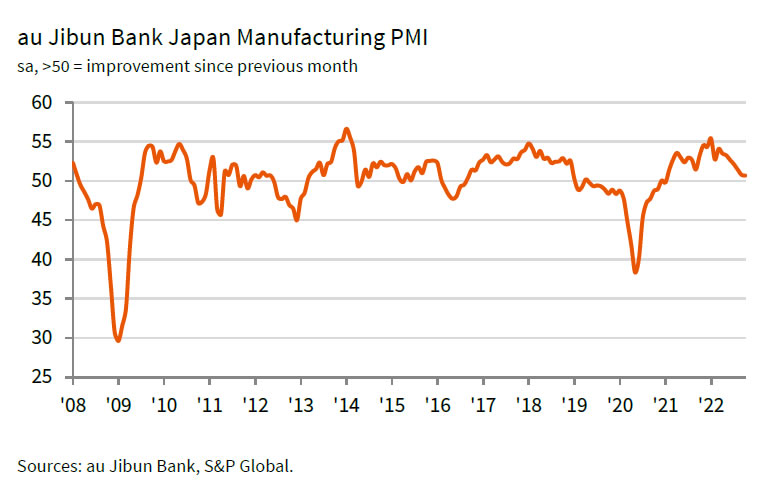
Japan PMI Manufacturing was finalized at 50.7 in October, slightly down from September's 50.8. That's the lowest level in 21 months. S&P Global noted that inflationary pressure remained severer. Business remained optimistic with sentiment at nine-month high.
Laura Denman, Economist at S&P Global Market Intelligence, said:
"The latest survey data signalled that Japan's manufacturing sector lost further momentum in October. Sluggish markets and weaker demand conditions, on both a domestic and international level, became a recurring trend throughout the report and were seemingly the driving forces behind the slower sector performance. Anecdotal evidence suggested that worsening conditions in China and South Korea were specifically detrimental to Japan's exports this month.
"Meanwhile, inflationary pressures remained severe in October. Japanese manufacturing firms increased their selling prices more aggressively, as signalled by a near-record rate of output cost inflation. Given the current conditions in some of Japan's key export markets, and with inflationary pressures displaying limited signs of easing, demand is likely to remain subdued in the coming months.
"Despite this, firms seem unfazed by the challenges that the sector is currently facing remaining optimistic towards their 12-month outlook on growth in October. In fact, the degree of confidence accelerated from September and reached a nine-month high."
GBP/USD Consolidates Gains, Why The Bulls Remain In Control
Key Highlights
- GBP/USD gained pace and tested the 1.1650 zone.
- It broke a major bearish trend line with resistance near 1.1400 on the 4-hours chart.
- EUR/USD corrected gains from 1.0090 and might find bids near 0.9820.
- The US ISM Manufacturing Index could decline from 50.9 to 50.0 in Oct 2022.
GBP/USD Technical Analysis
The British Pound gains pace after it broke the 1.1400 resistance against the US Dollar. GBP/USD even cleared the 1.1500 zone to move into a positive zone.
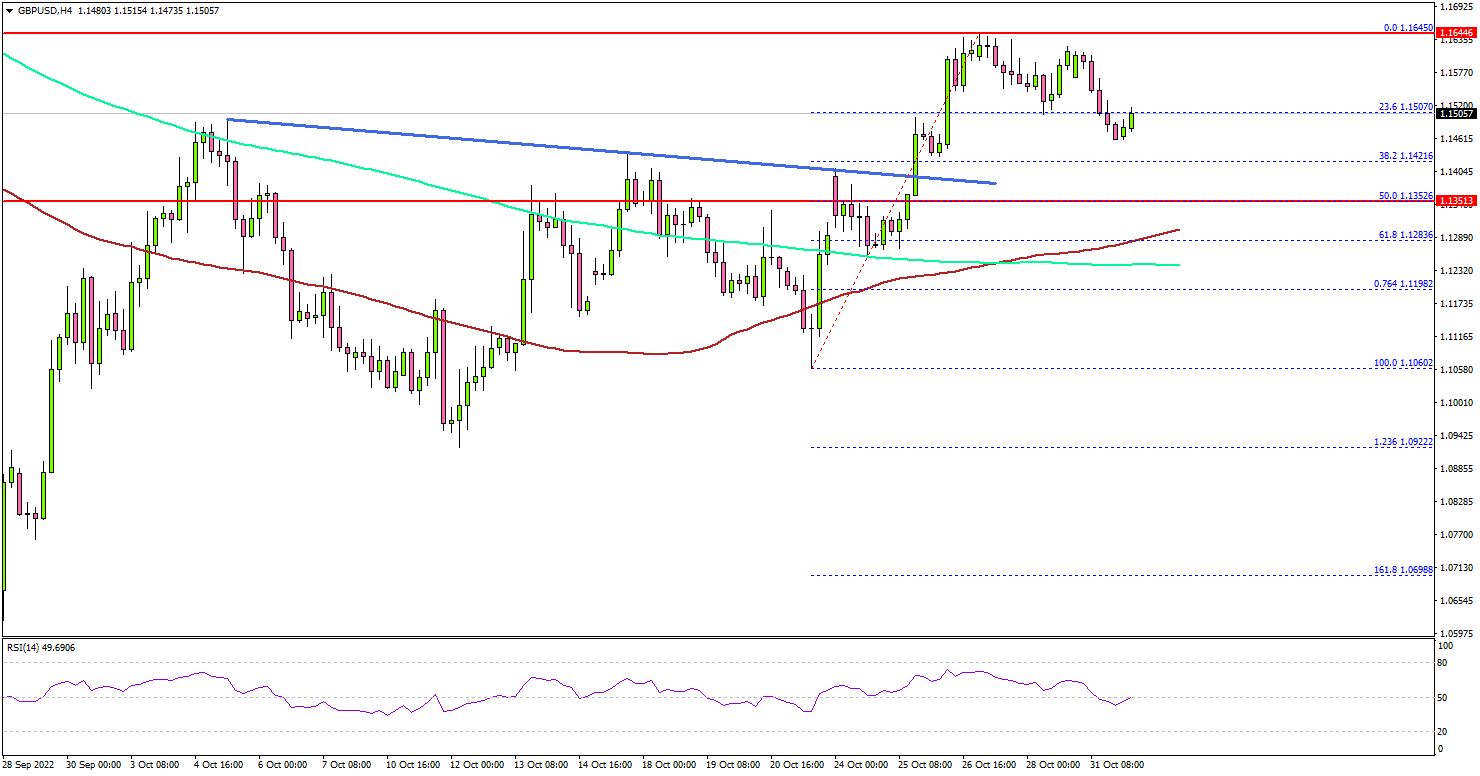
Looking at the 4-hours chart, the pair climbed above the 1.1550 level. There was also a close above the 100 simple moving average (red, 4-hours) plus the 200 simple moving average (green, 4-hours).
A high was formed near 1.1645 before there was a downside correction. The pair declined below the 1.1600 and 1.1585 support levels. The bears pushed the pair below the 23.6% Fib retracement level of the upward move from the 1.1060 swing low to 1.1645 high.
An initial support is near the 1.1425 level. The next major support is near the 1.1350 zone. It is near the 50% Fib retracement level of the upward move from the 1.1060 swing low to 1.1645 high.
The main support sits at 1.1280 and the 100 simple moving average (red, 4-hours). A downside break below the 1.1380 zone could push the pair into a bearish zone. In the stated case, it could decline towards the 1.1200 support.
On the upside, GBP/USD is facing a major resistance near the 1.1600 zone. The next major resistance may perhaps be near 1.1650. Any more gains could set the pace for a move towards the 1.1800 level, above which it could even test 1.2000.
Looking at EUR/USD, the pair topped near the 1.0093 level and recently started a downside correction below the 1.0000 level.
Economic Releases
- US ISM Manufacturing Index for Oct 2022 – Forecast 50.0, versus 50.9 previous.
Platinum Wave Analysis
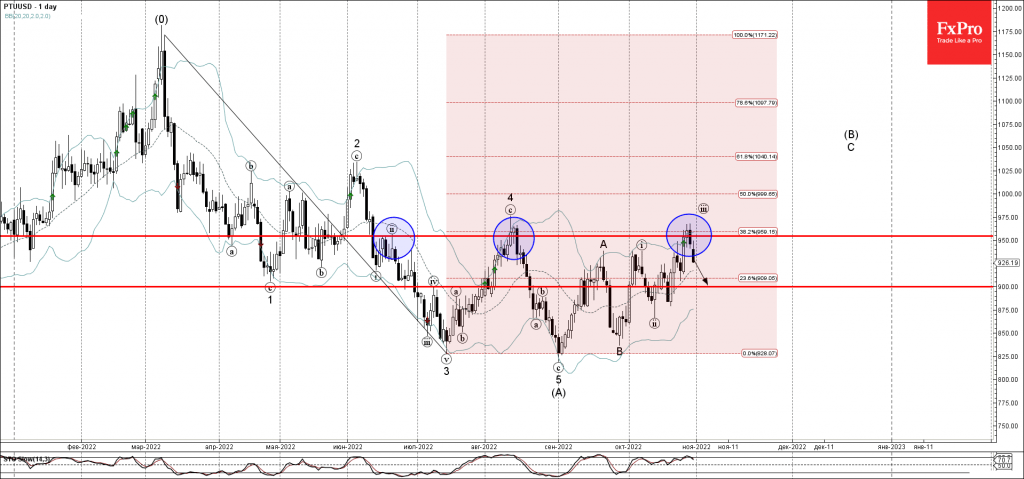
- Platinum reversed from resistance level 955.00
- Likely to fall to support level 900.00
Platinum recently reversed down from the pivotal resistance level 955.00 (which has been reversing the price from June), standing near the upper daily Bollinger Band and the 38.2% Fibonacci correction of the downward impulse from March.
The downward reversal from the resistance level 955.00 stopped the earlier impulse waves (iii) and C.
Given the bearish sentiment across the precious markets today, Platinum can be expected to fall further toward the next round support level 900.00.
EURGBP Wave Analysis
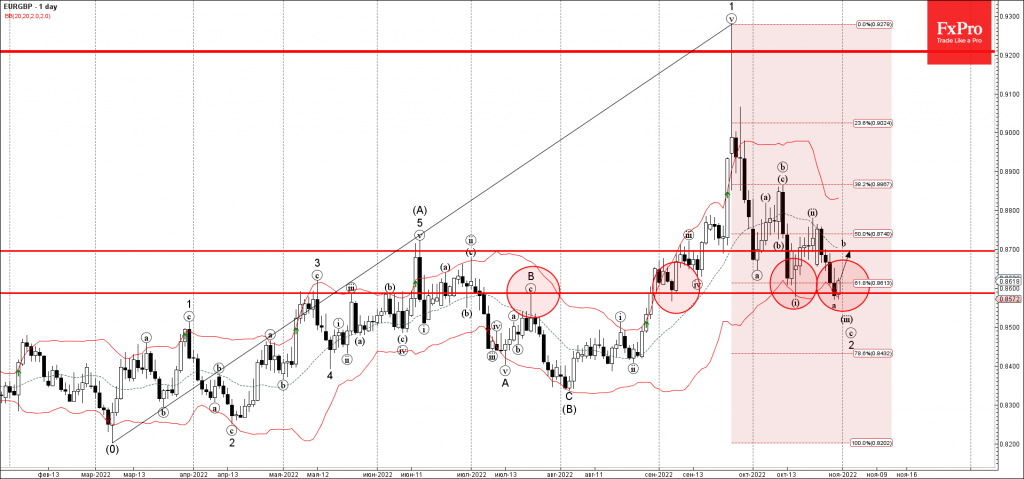
- EURGBP reversed from support level 0.8590
- Likely to rise to resistance level 0.8700
EURGBP currency pair recently reversed up from the key support level 0.8590 (former resistance from July), standing near the lower daily Bollinger Band and the 61.8% Fibonacci correction of the upward impulse from March.
The upward reversal from the support level 0.8590 started the active short-term correction b.
EURGBP can be expected to rise further toward the next resistance level 0.8700 (target price for the completion of the active wave b).
RBA hikes 25bps, rates to rise further over the period ahead
RBA raises cash rate target by 25bps to 2.85% as widely expected. It maintains tightening bias and expects to "increase interest rates further over the period ahead". The size and timing of future rate hikes will be determined by incoming data and the outlook for inflation and labor market.
The central bank expects inflation to "further increase" over the months ahead and peak at around 8% this year. CPI inflation is forecast to be around 4.75% over 2023 and a little above 3% over 2024. GDP growth forecast was "revised down a little" to 3% this year, 1.50% in 2023 and 2024. Unemployment rate is forecast to rise gradually from current 3.5% to a little above 4% in 2024 as economic growth slow.
(RBA) Statement by Philip Lowe, Governor: Monetary Policy Decision
At its meeting today, the Board decided to increase the cash rate target by 25 basis points to 2.85 per cent. It also increased the interest rate on Exchange Settlement balances by 25 basis points to 2.75 per cent.
As is the case in most countries, inflation in Australia is too high. Over the year to September, the CPI inflation rate was 7.3 per cent, the highest it has been in more than three decades. Global factors explain much of this high inflation, but strong domestic demand relative to the ability of the economy to meet that demand is also playing a role. Returning inflation to target requires a more sustainable balance between demand and supply.
A further increase in inflation is expected over the months ahead, with inflation now forecast to peak at around 8 per cent later this year. Inflation is then expected to decline next year due to the ongoing resolution of global supply-side problems, recent declines in some commodity prices and slower growth in demand. Medium-term inflation expectations remain well anchored, and it is important that this remains the case. The Bank's central forecast is for CPI inflation to be around 4¾ per cent over 2023 and a little above 3 per cent over 2024.
The Australian economy is continuing to grow solidly and national income is being boosted by a record level of the terms of trade. Economic growth is expected to moderate over the year ahead as the global economy slows, the bounce-back in spending on services runs its course, and growth in household consumption slows due to tighter financial conditions. The Bank's central forecast for GDP growth has been revised down a little, with growth of around 3 per cent expected this year and 1½ per cent in 2023 and 2024.
The labour market remains very tight, with many firms having difficulty hiring workers. The unemployment rate was steady at 3.5 per cent in September, around the lowest rate in almost 50 years. Job vacancies and job ads are both at very high levels, although employment growth has slowed over recent months as spare capacity in the labour market has been absorbed. The central forecast is for the unemployment rate to remain around its current level over the months ahead, but to increase gradually to a little above 4 per cent in 2024 as economic growth slows.
Wages growth is continuing to pick up from the low rates of recent years, although it remains lower than in many other advanced economies. A further pick-up is expected due to the tight labour market and higher inflation. Given the importance of avoiding a prices-wages spiral, the Board will continue to pay close attention to both the evolution of labour costs and the price-setting behaviour of firms in the period ahead.
Price stability is a prerequisite for a strong economy and a sustained period of full employment. Given this, the Board's priority is to return inflation to the 2–3 per cent range over time. It is seeking to do this while keeping the economy on an even keel. The path to achieving this balance remains a narrow one and it is clouded in uncertainty.
One source of uncertainty is the outlook for the global economy, which has deteriorated over recent months. Another is how household spending in Australia responds to the tighter financial conditions. The Board recognises that monetary policy operates with a lag and that the full effect of the increase in interest rates is yet to be felt in mortgage payments. Higher interest rates and higher inflation are putting pressure on the budgets of many households. Consumer confidence has also fallen and housing prices have been declining following the earlier large increases. Working in the other direction, people are finding jobs, gaining more hours of work and receiving higher wages. Many households have also built up large financial buffers and the saving rate remains higher than it was before the pandemic.
The Board has increased interest rates materially since May. This has been necessary to establish a more sustainable balance of demand and supply in the Australian economy to help return inflation to target. The Board expects to increase interest rates further over the period ahead. It is closely monitoring the global economy, household spending and wage and price-setting behaviour. The size and timing of future interest rate increases will continue to be determined by the incoming data and the Board's assessment of the outlook for inflation and the labour market. The Board remains resolute in its determination to return inflation to target and will do what is necessary to achieve that.