Sample Category Title
Swiss SECO consumer confidence fell to fresh record low at -47
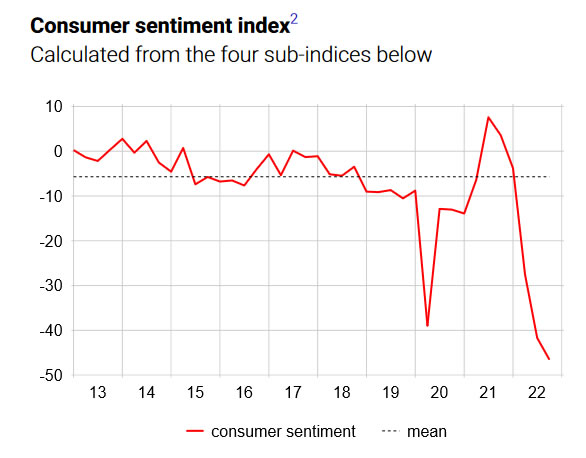
Swiss SECO Consumer Confidence fell further from -42 to -47 in Q4, below expectation of -43. That's the record low level since the survey began in 1972.
Looking at some details, expected economic development dropped from -53.5 to -57.2, far below long-term average of -9. Past financial situation dropped from -35.1 to -39.7, a historic low. Expected financial situation dropped sharply from -34.8 to -46.9, also a new low. Major purchases improved slightly from -43.3 to -42.4.
EURJPY Pauses Near 8-Year High; Neutral Bias in Near Term
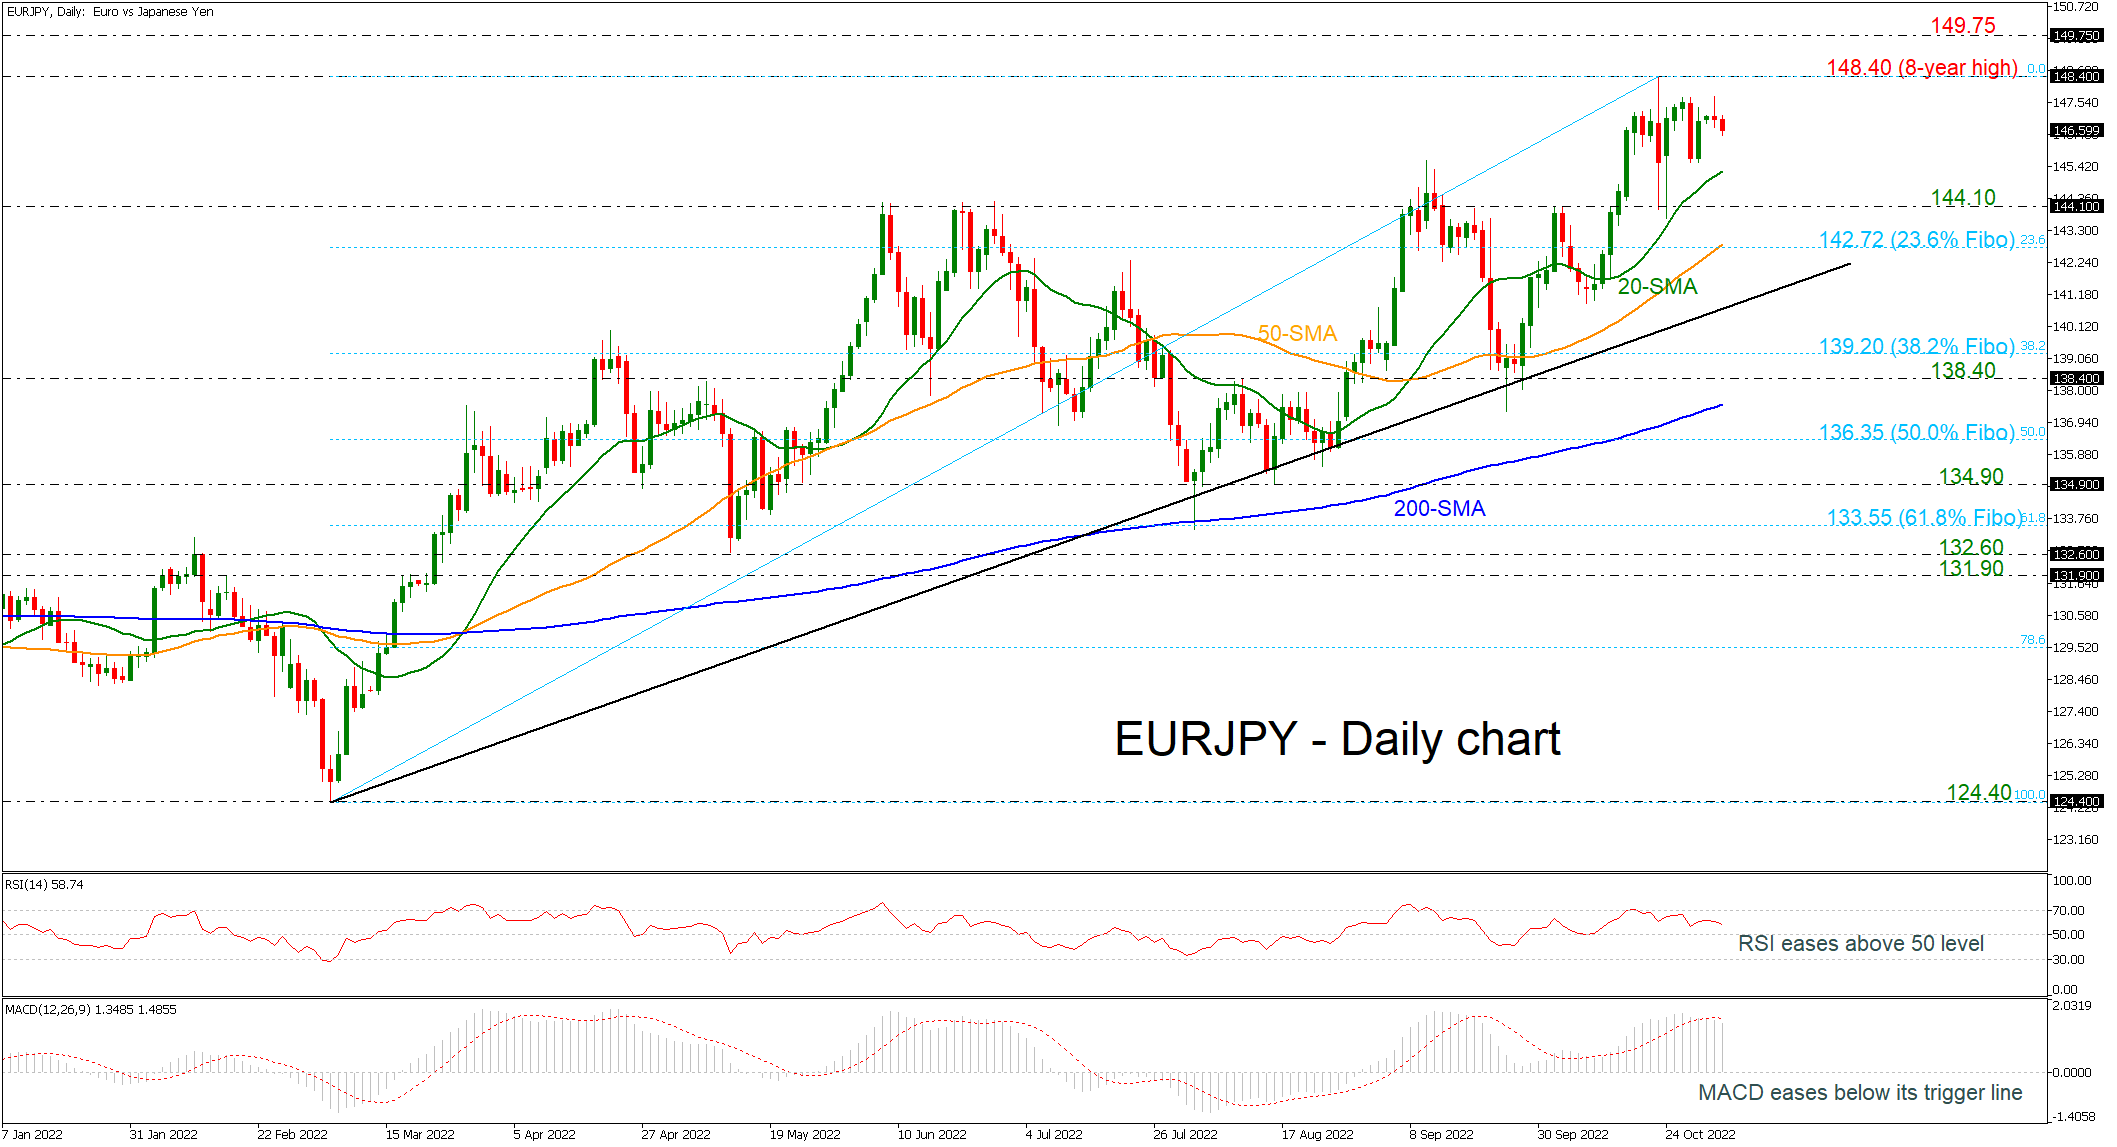
EURJPY is moving sideways after the jump to the eight-year high of 148.40, failing to endorse the bullish outlook in the long-term. The RSI indicator is moving lower in the positive region, while the MACD oscillator dived beneath its trigger line above the zero level. The 20- and 40-day simple moving averages (SMAs) are still moving north and are acting as strong support lines.
Should selling forces strengthen, the 20-day SMA at 145.25 will come under the spotlight ahead of the 144.10 support. Moving lower, the 23.6% Fibonacci retracement level of the upward wave from 124.40 to 148.40 at 142.75 could next add some footing, overlapping with the 50-day SMA. A break lower could open the way for the long-term uptrend line near 141.10 and would put the recent upside tendency under examination.
Alternatively, a close above the multi-year high of 148.40 will brighten the broader outlook, pushing the price towards the 149.75 barrier registered in December 2014. Beyond that, the rally may gear up to the inside swing low from March 2008 at 151.70
In brief, EURJPY is facing a weaking bullish bias, where a drop below the ascending trend line around 141.40 is expected to enhance selling interest.
GBP/USD: Bearish Trend Likely to Complete Near 1.030
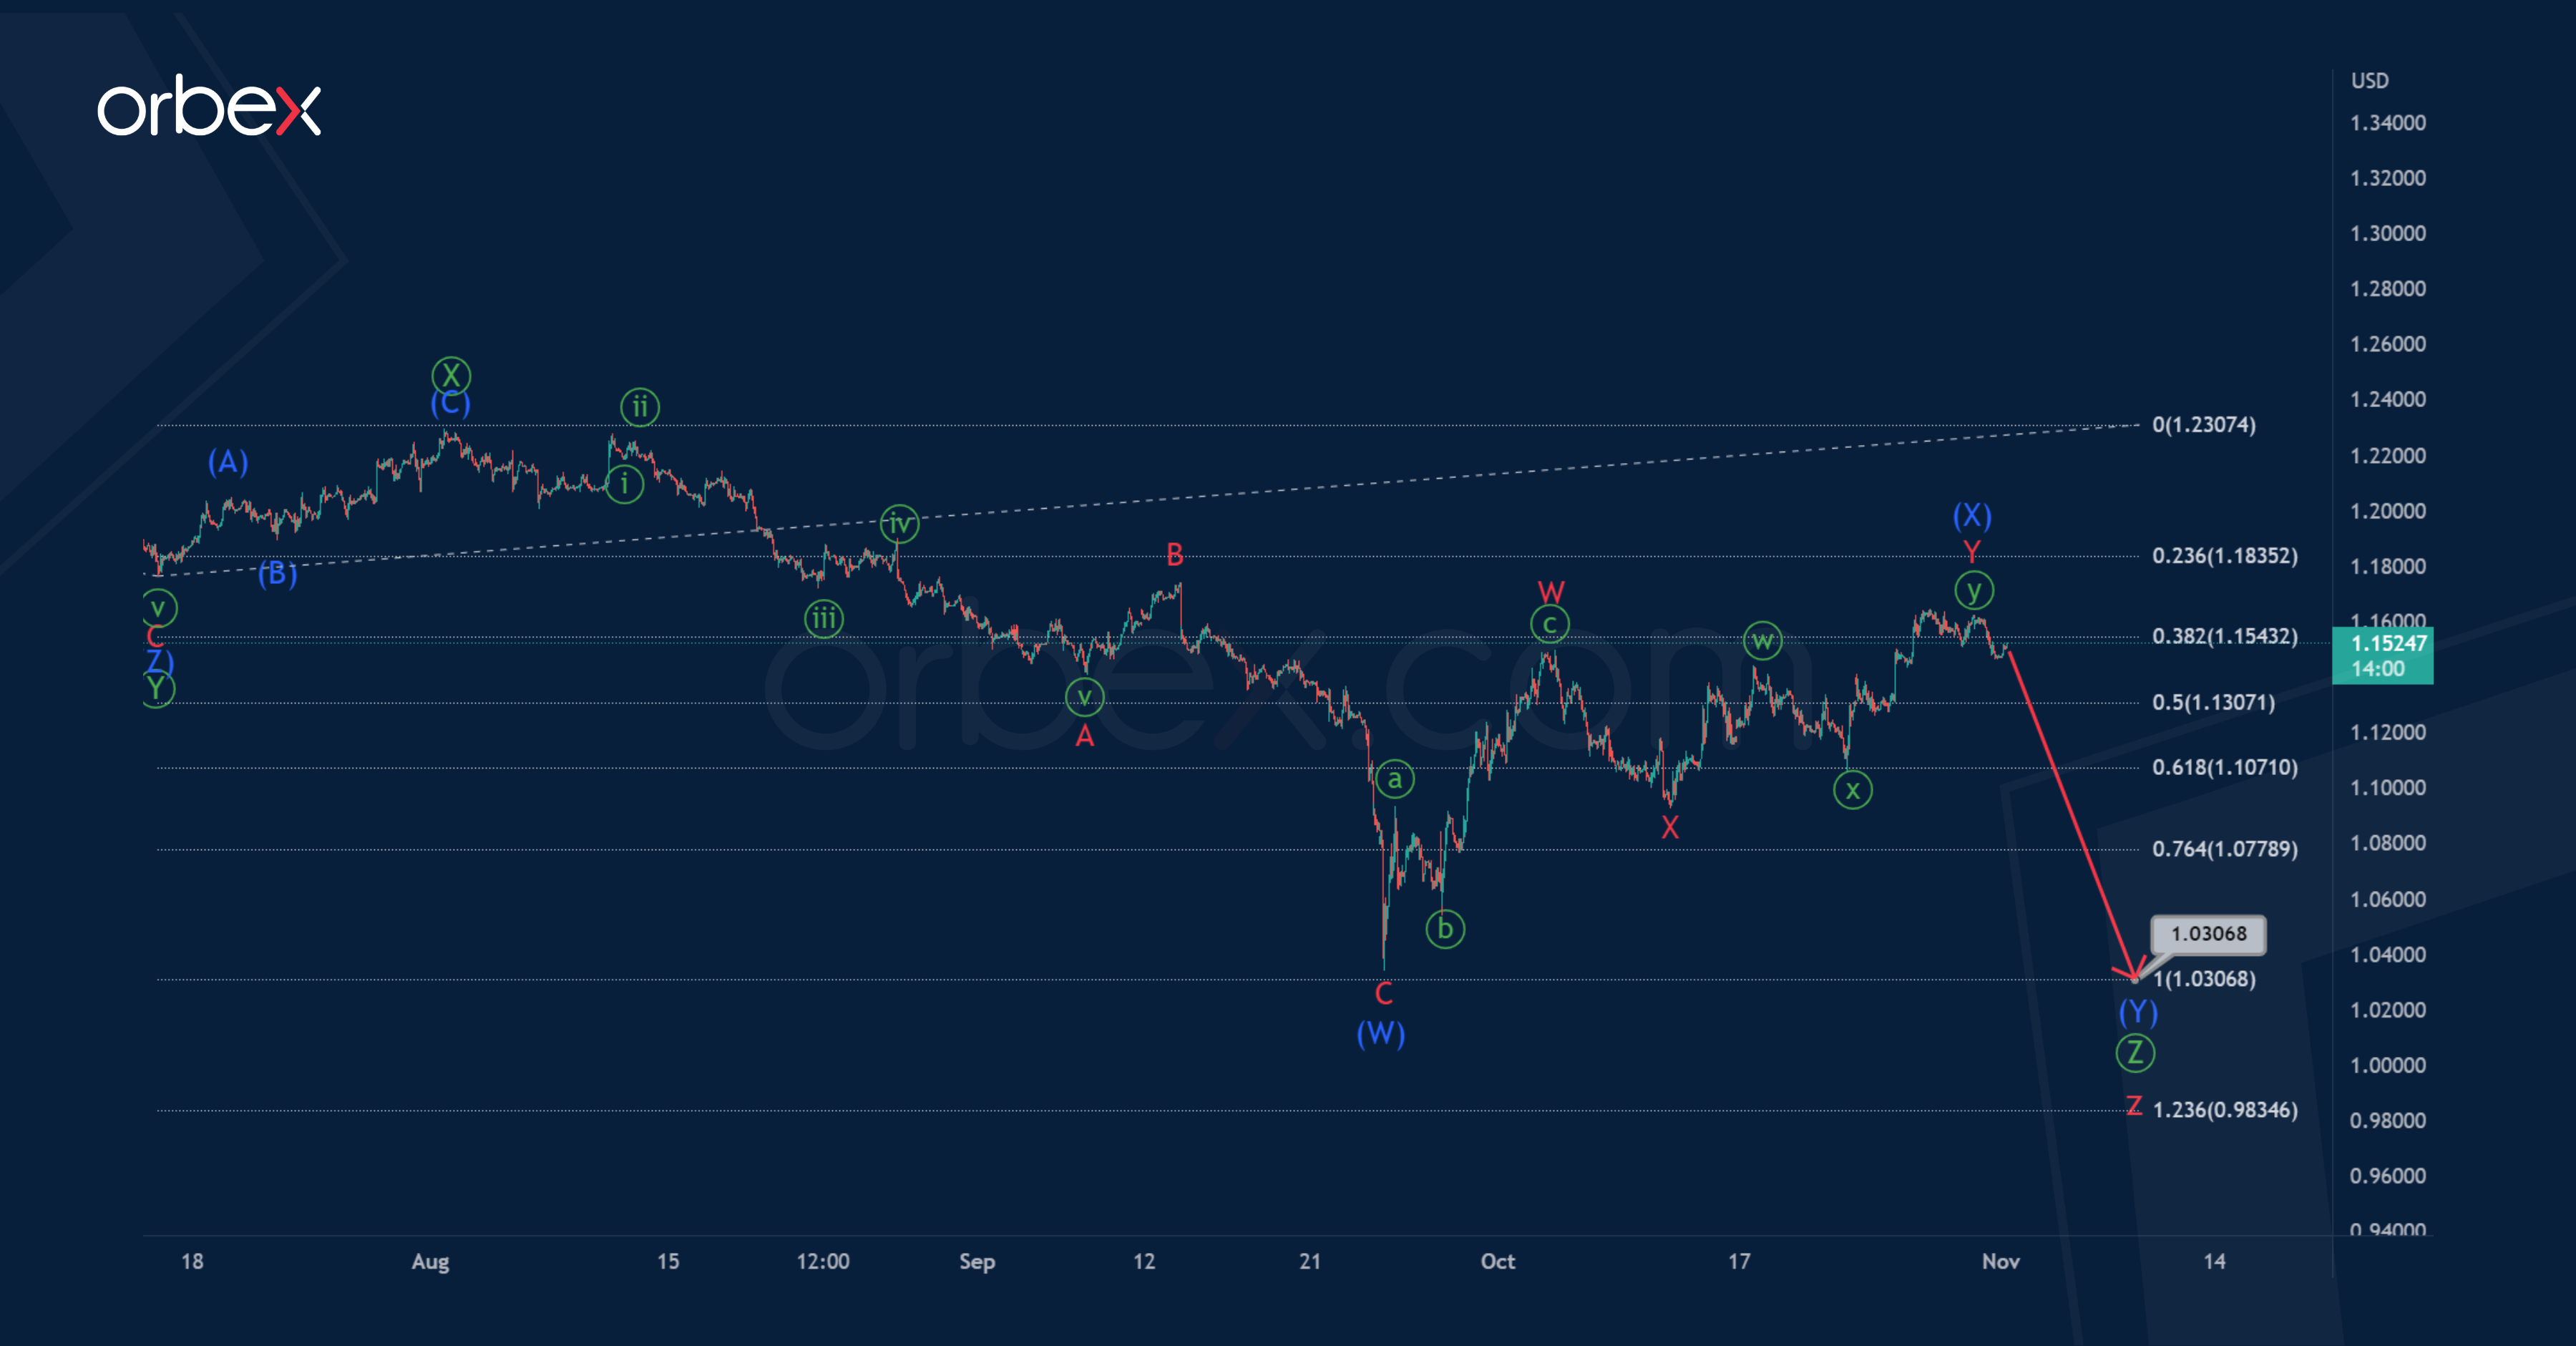
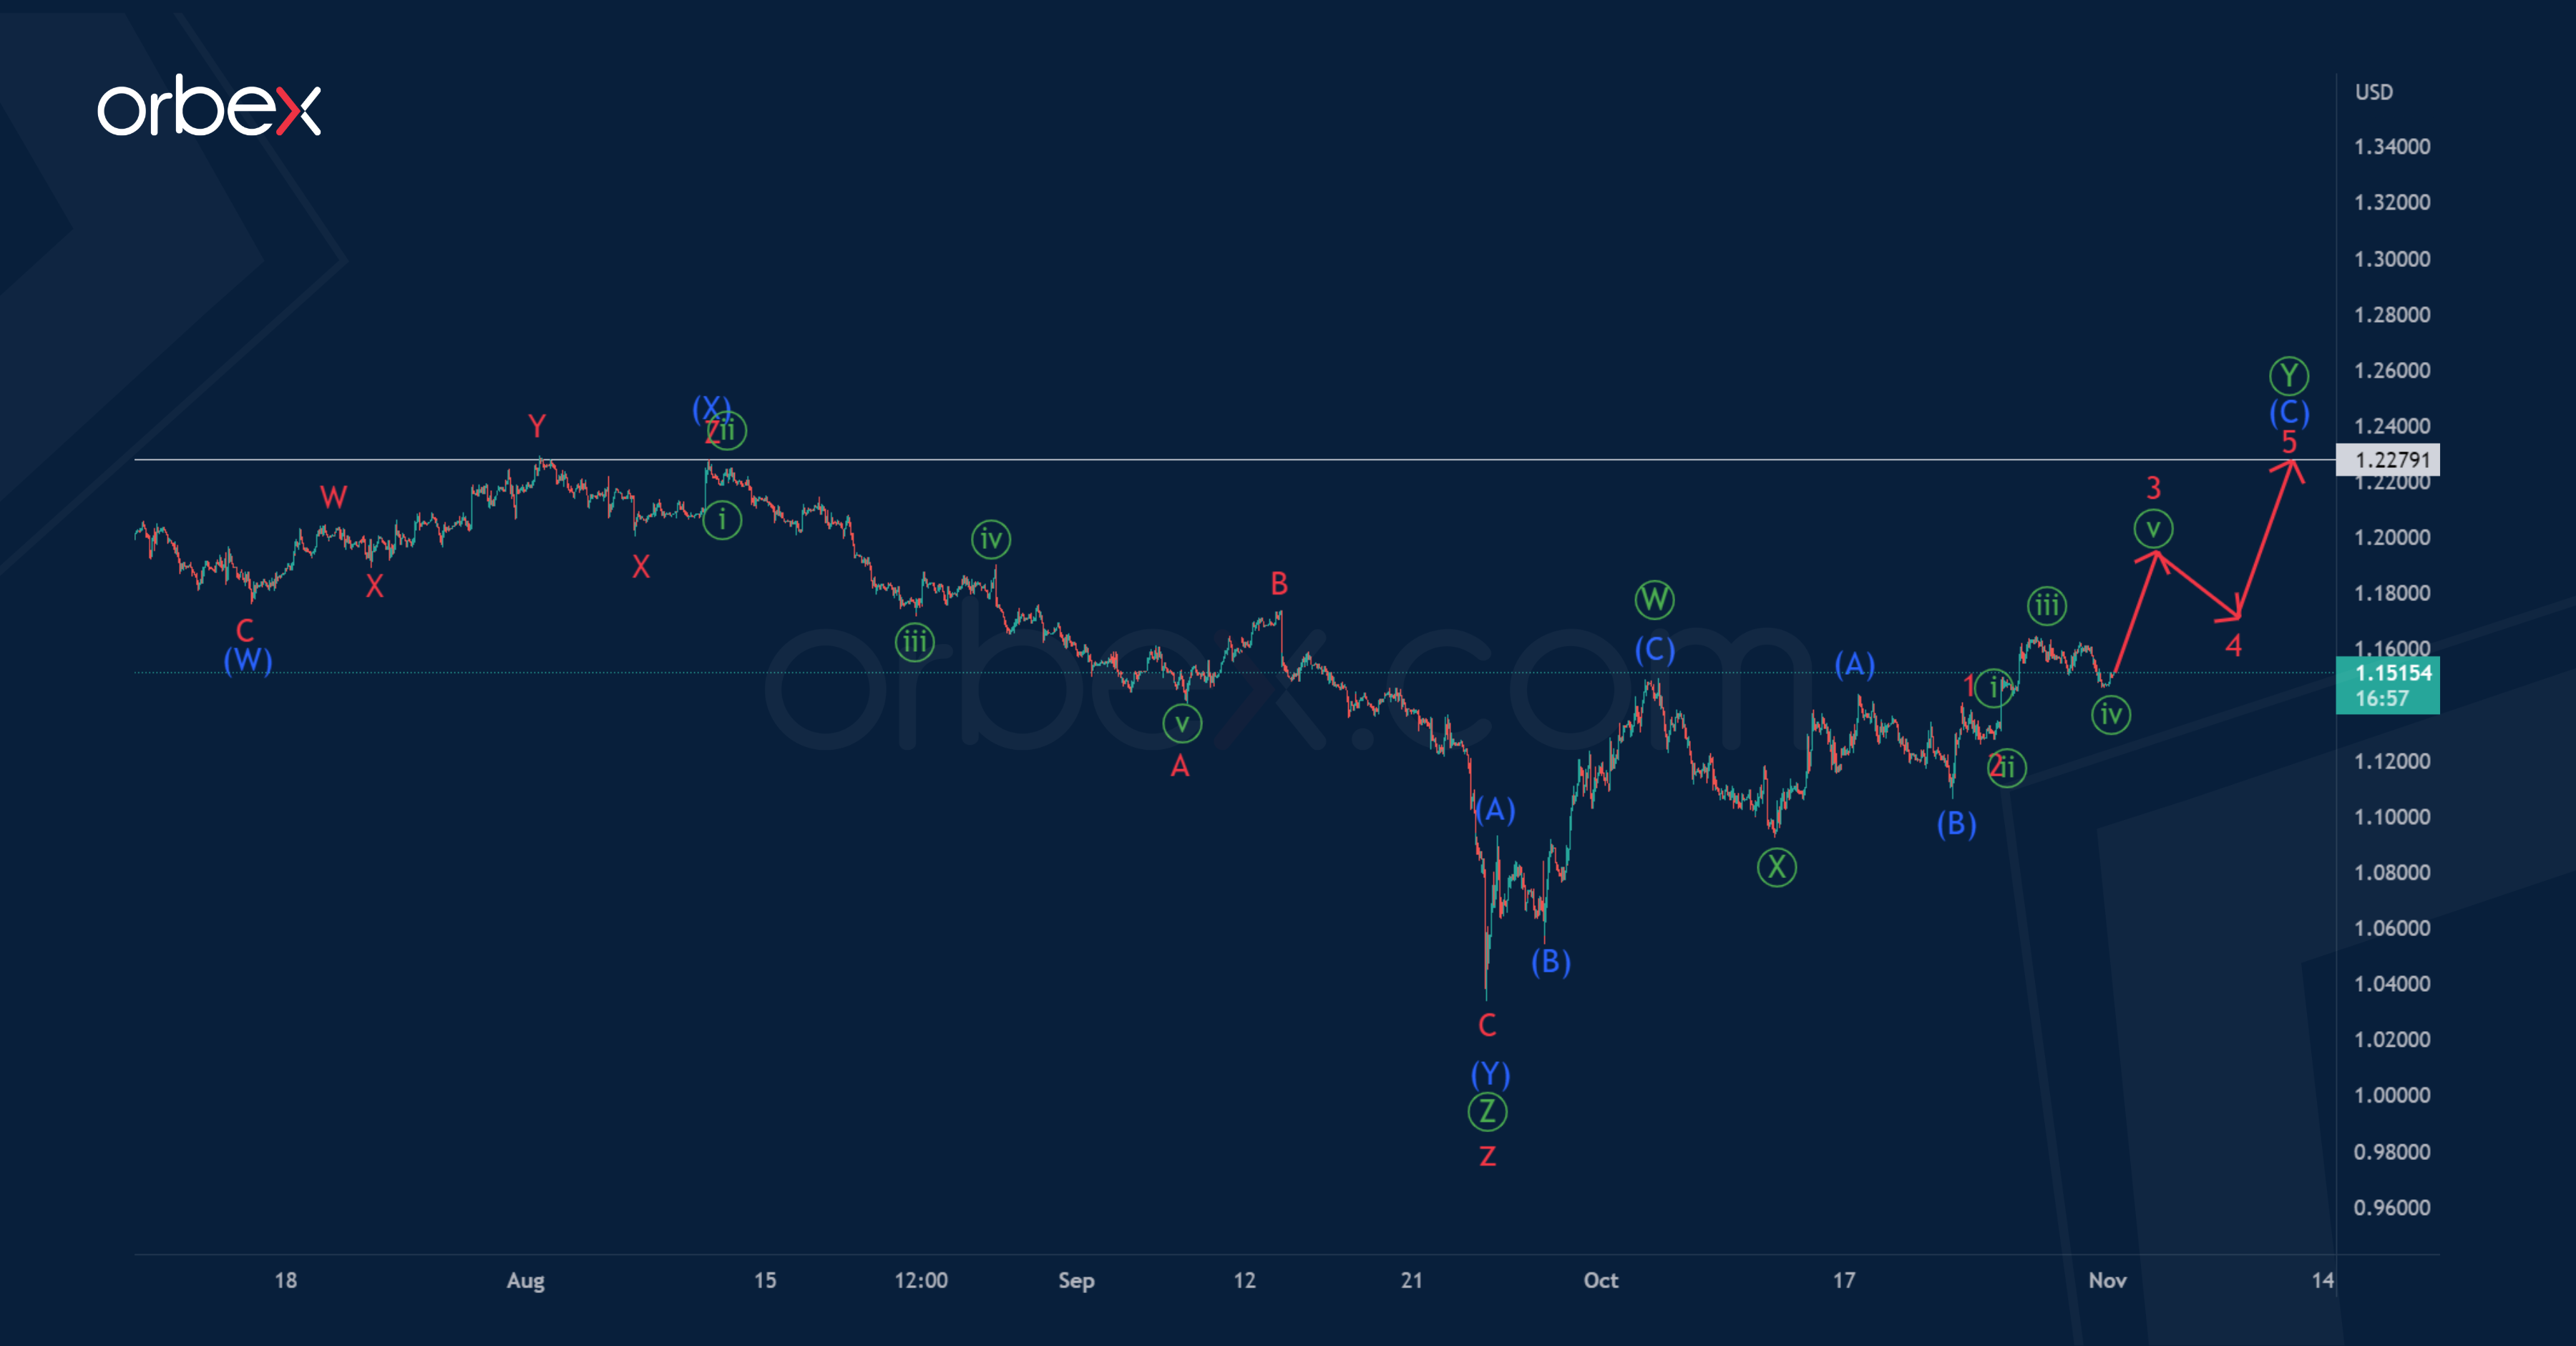
The structure of the GBPUSD currency suggests the formation of a global corrective trend – a triple zigzag w-x-y-x-z. On the 1H timeframe, we see the final actionary wave z of the cycle degree.
The wave z most likely takes the form of a primary triple zigzag Ⓦ-Ⓧ-Ⓨ-Ⓧ-Ⓩ. Perhaps at the beginning of August of this year, the bullish price movement ended within the small primary intervening wave Ⓧ, it took the form of an intermediate zigzag (A)-(B)-(C).
After that, the bearish trend continued to develop in the primary wave Ⓩ, which can complete its intermediate double zigzag pattern (W)-(X)-(Y) near 1.030.
At that level, wave Ⓩ will be at the 100% Fibonacci extension of previous actionary wave Ⓨ.
In the second variant, it is assumed that the cycle wave z could be fully completed, it has the form of a primary triple zigzag, as assumed above.
Thus, in the last section of the chart, we see that the bulls have started to move the price into a new trend.
Perhaps the formation of the primary double zigzag Ⓦ-Ⓧ-Ⓨ occurs, where the first two parts have already been formed. The last zigzag wave Ⓨ, consisting of intermediate sub-waves (A)-(B)-(C), is currently under development.
The end of the intermediate impulse wave (C) is possible near the maximum of 1.227, which was marked by the sub-wave (X).
Dow Jones 30 Tests Resistance
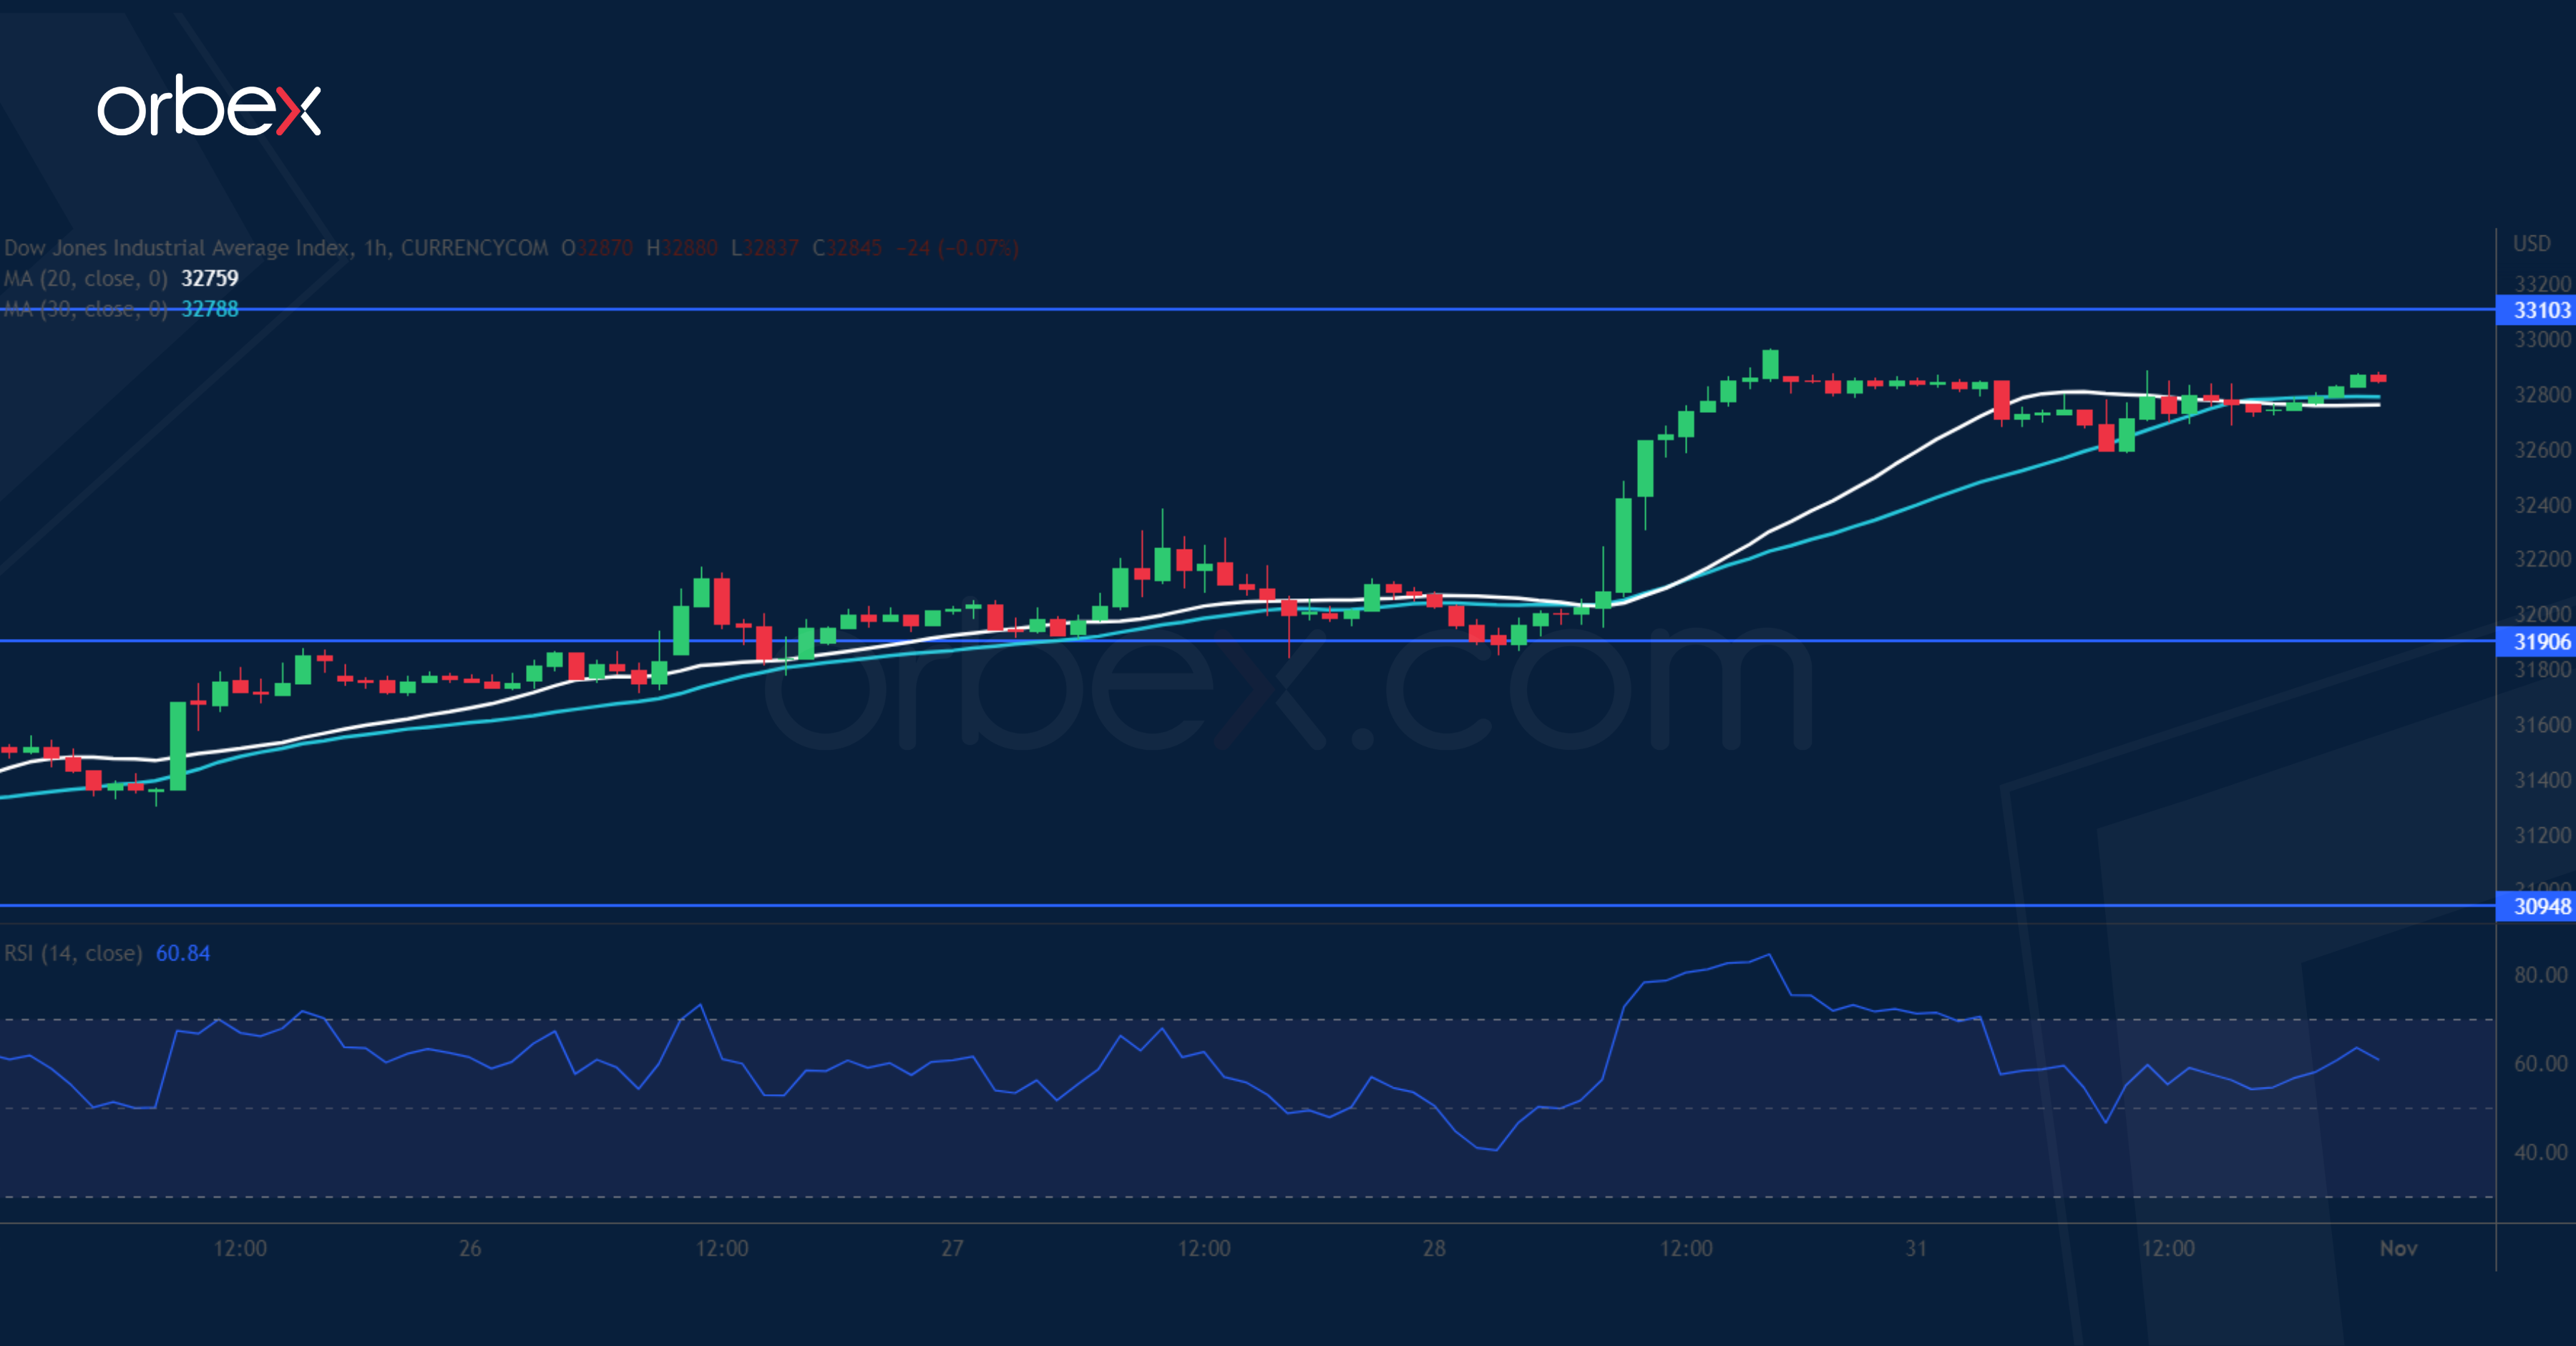
The Dow Jones 30 inches higher as investors await the Fed's policy meeting. A short squeeze above the September high at 32600 has put the bears on the defensive. Heightened volatility shows that wrong-footed traders were looking to bail out. As the index climbs back towards August’s high, 33100 at the origin of a previous sell-off is the next hurdle. The RSI’s overbought condition may trigger profit-taking and a pullback from this demand-turned-supply area. 31900 is the first level to gauge the strength of follow-up bids.
XAG/USD Grinds Support
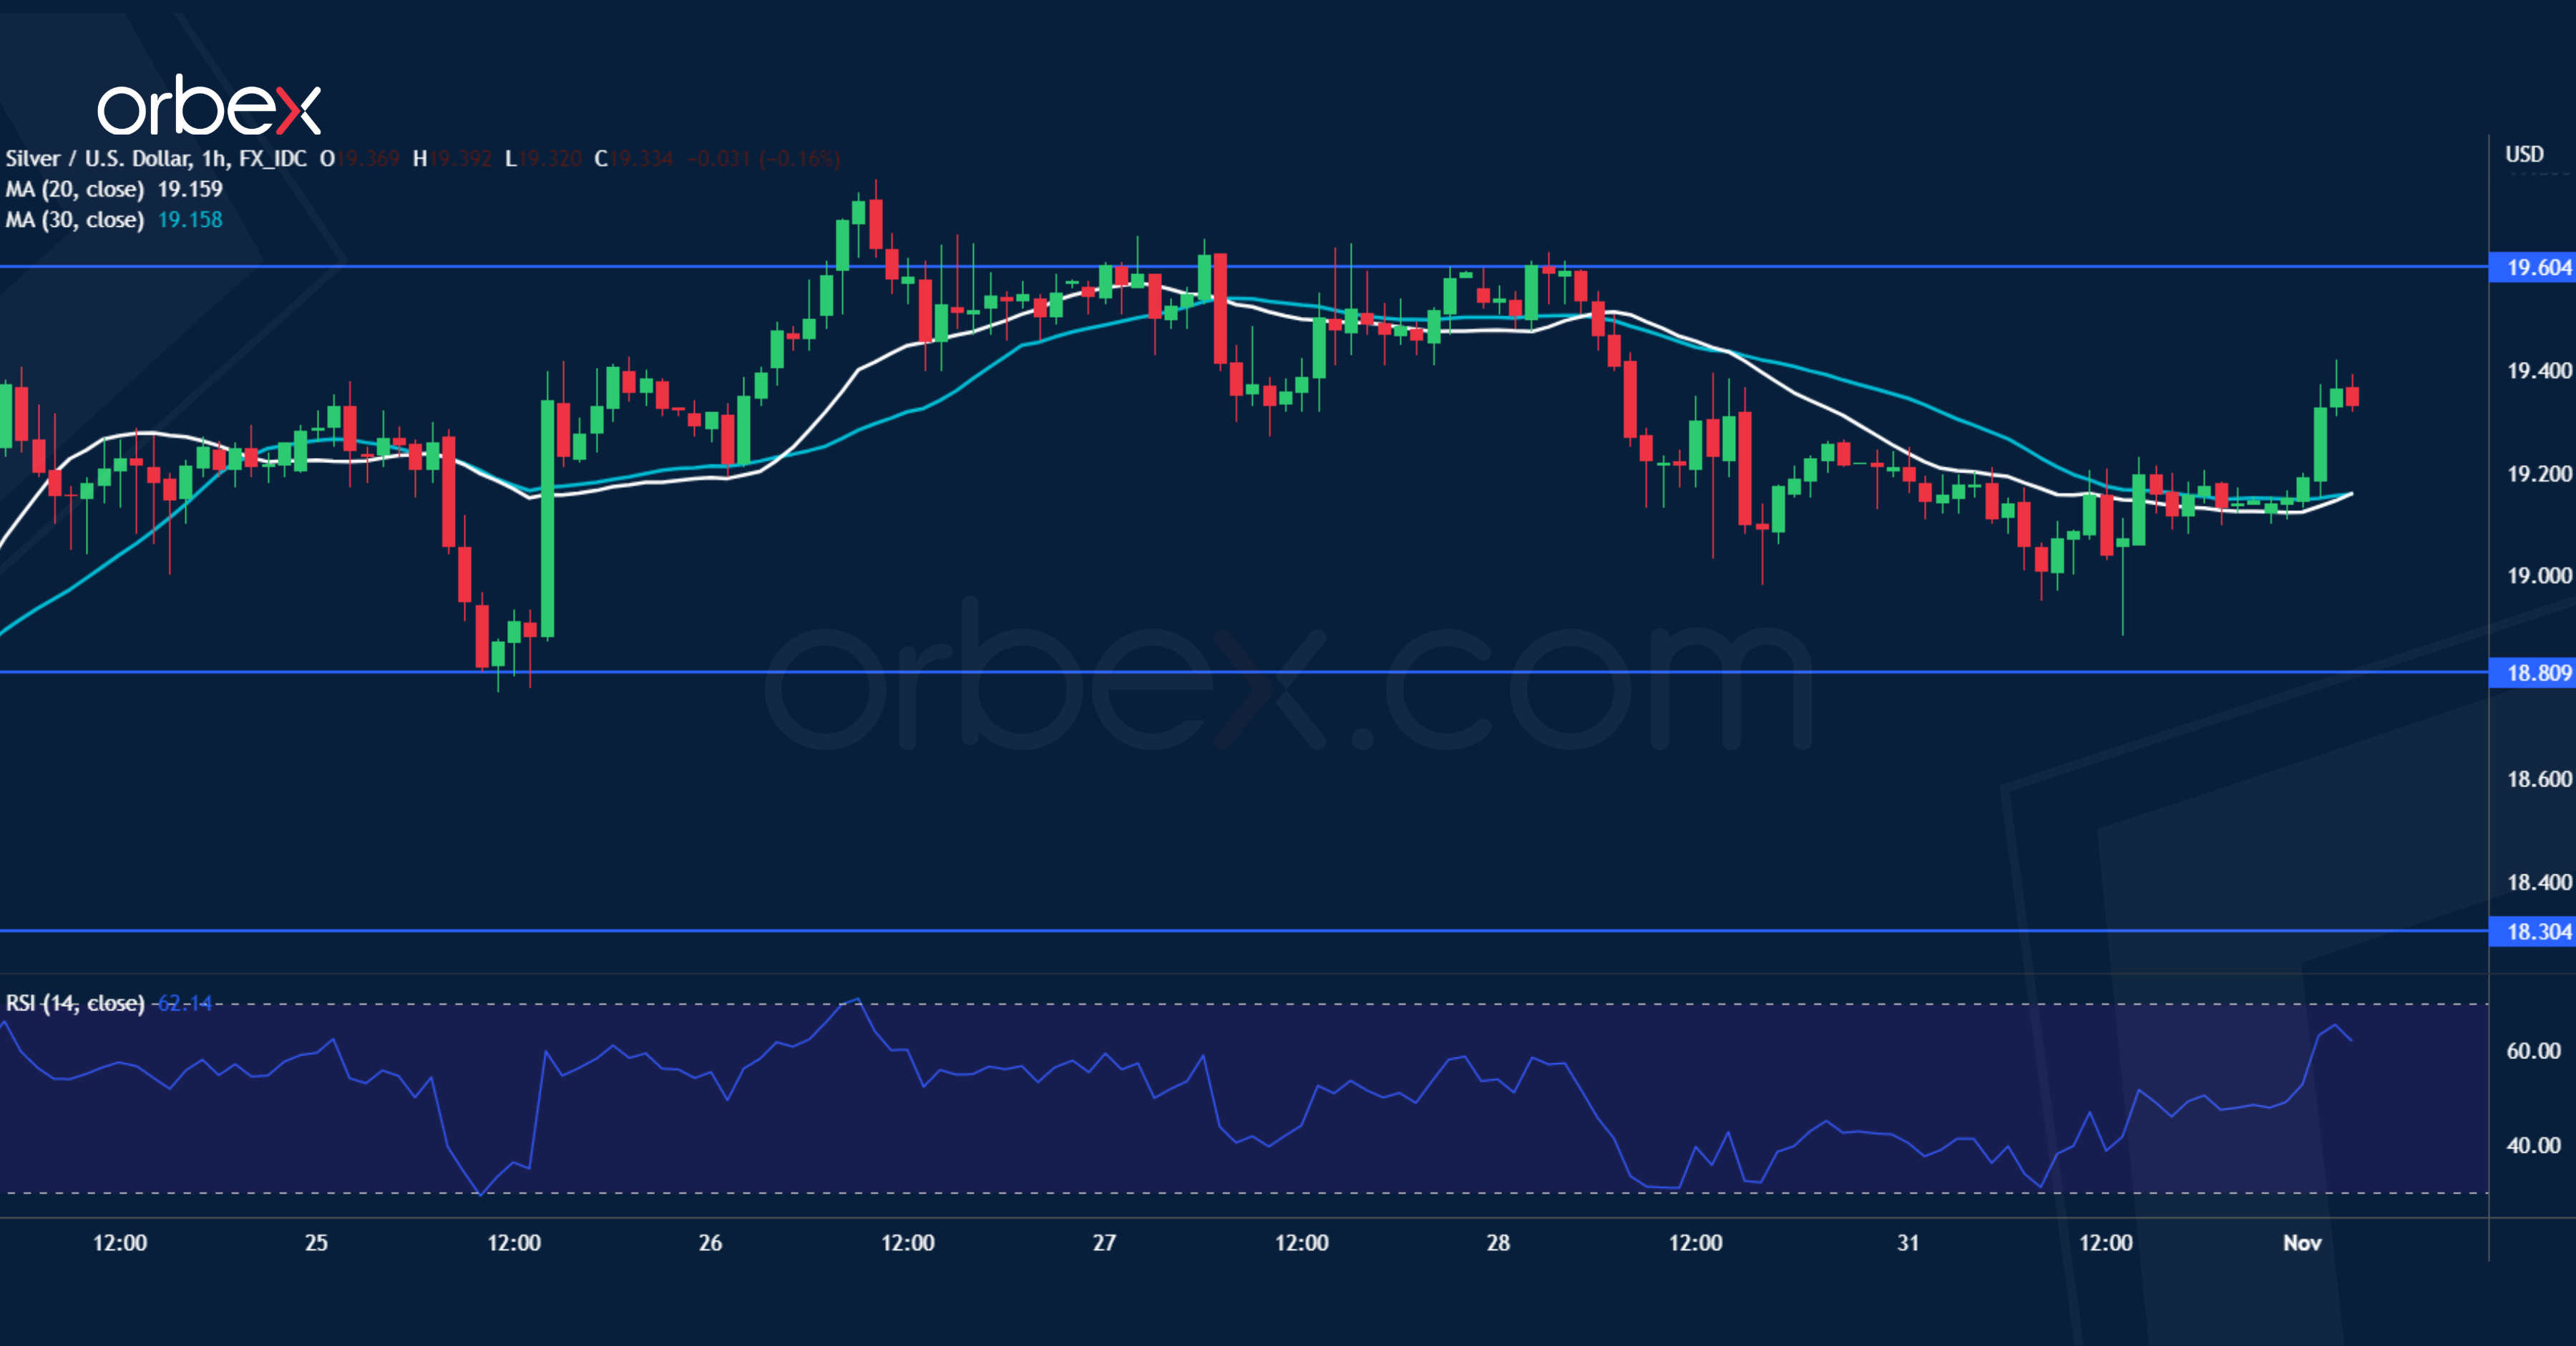
Silver slips as the dollar index recoups recent losses. The price has stabilised over the daily support and psychological level of 18.00. A series of higher highs led sellers to cover their positions. The market is in a post-swing consolidation until a breakout on either side lifts momentum once again. 19.60 is the immediate resistance and its breach could carry the precious metal to the previous peak around 20.80. 18.80 is a fresh support and the zone between 18.00 and 18.30 is a critical floor to keep the current rebound intact.
EUR/USD Falls Back
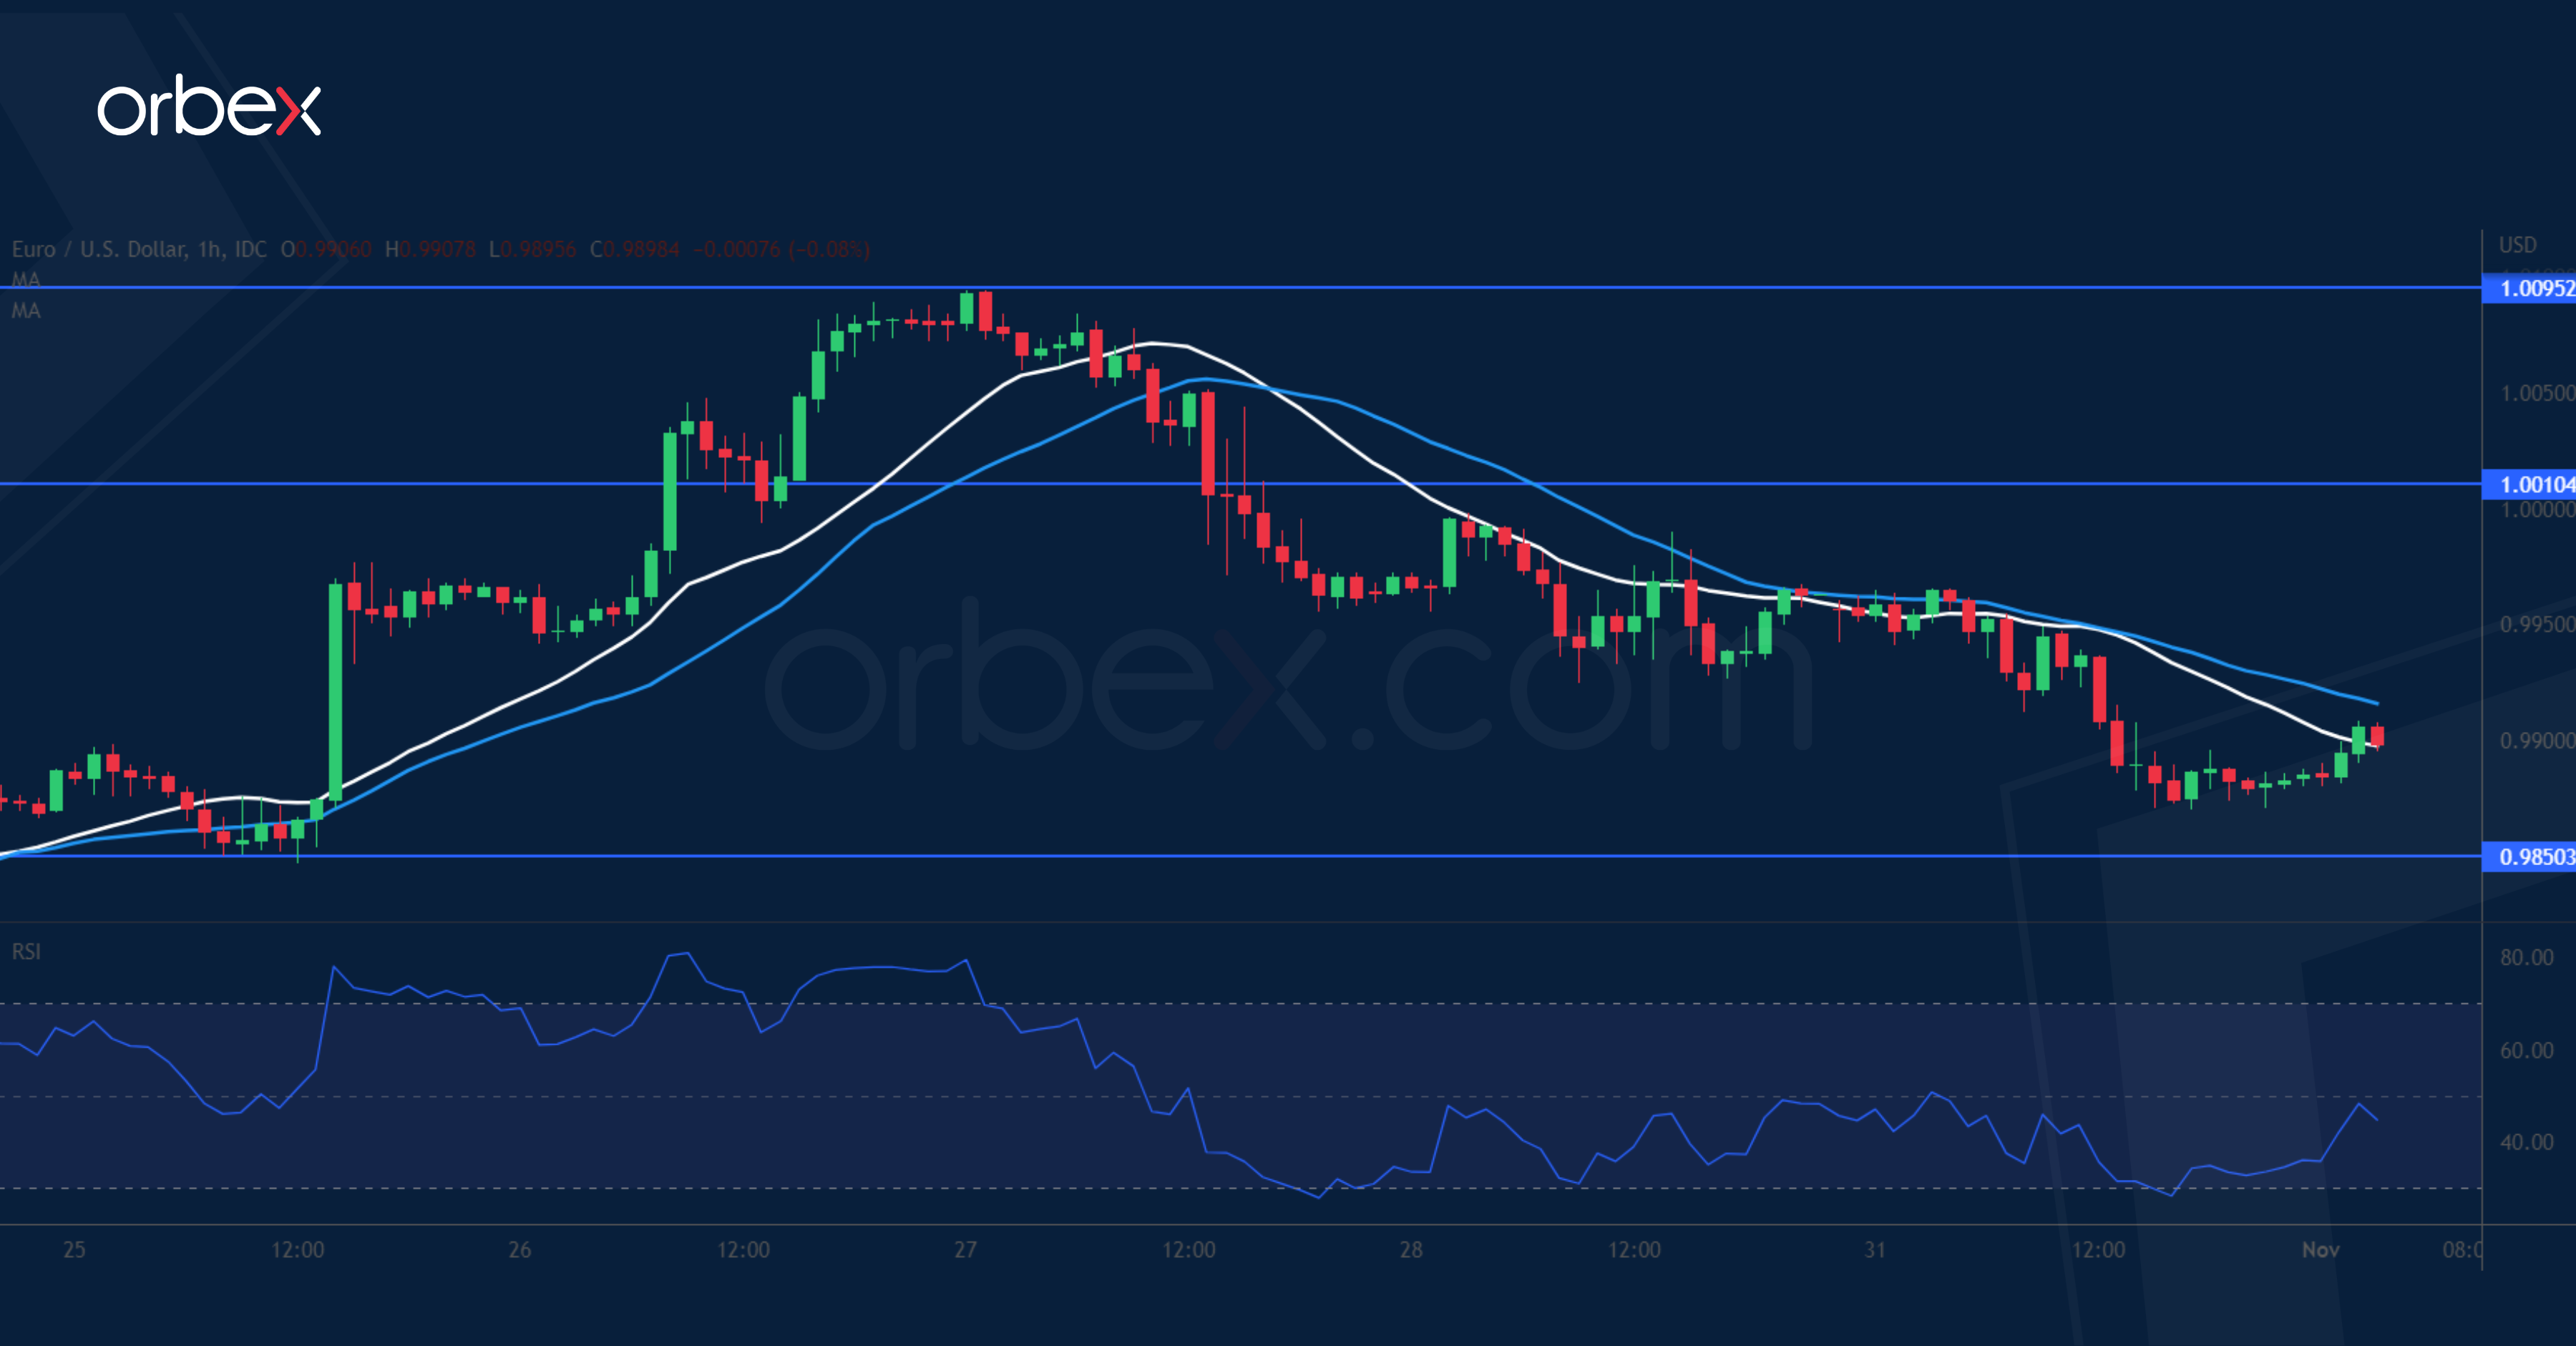
The euro retreats over muted GDP growth in the eurozone. The price action is hovering around parity in an attempt to hold onto its recent gains, a sign of the bulls’ strong attachment to this symbolic level. The selling pressure has waned after the pair closed above 0.9990, which could shift short-term bias to the upside. 0.9850 next to the MA cross on the daily chart is an area of congestion. A bounce above 1.0010 might resume the recovery towards September’s high at 1.0180. 0.9710 is the bulls’ second line of defence.
GBP/JPY Daily Outlook
Daily Pivots: (S1) 169.91; (P) 171.02; (R1) 171.70; More...
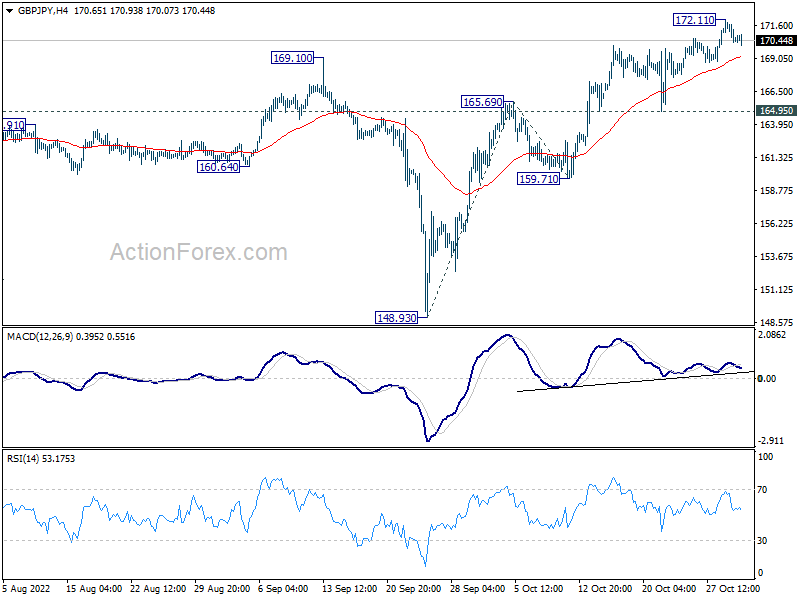
GBP/JPY retreated after hitting 172.11 and intraday bias is turned neutral first. Downside of retreat should be contained above 164.95 support to bring another rally. Break of 172.11 will resume larger up trend and target 100% projection of 148.93 to 165.69 from 159.71 at 176.47 next.
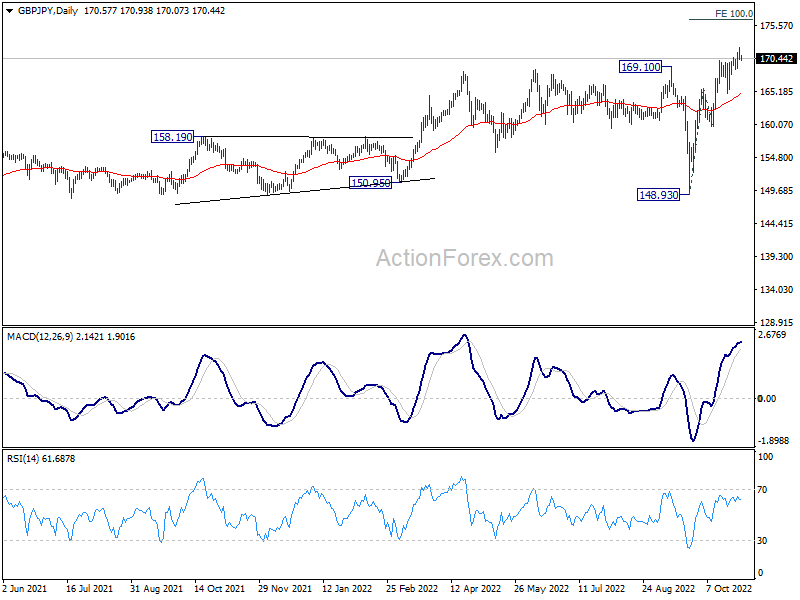
In the bigger picture, up trend from 123.94 (2020 low), as part of the trend from 122.75 (2016 low) is still in progress. Further rise would be seen to 161.8% projection of 122.75 to 156.59 (2018 high) from 123.94 at 178.69. This will now remain the favored case as long as 148.93 support holds.
EUR/JPY Daily Outlook
Daily Pivots: (S1) 146.55; (P) 147.16; (R1) 147.60; More....
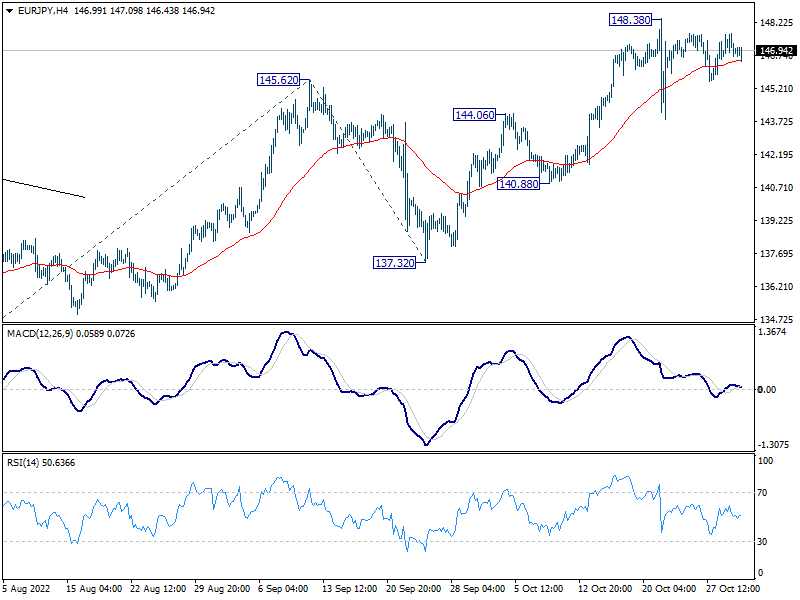
Intraday bias in EUR/JPY stays neutral as consolidation from 148.38 is extending. In case of another fall, downside should be contained 140.88/144.06 support zone to bring another rally. Break of 148.38 will resume larger up trend to 100% projection of 133.38 to 145.62 from 137.32 at 149.56, which is close to 149.76 long term resistance.
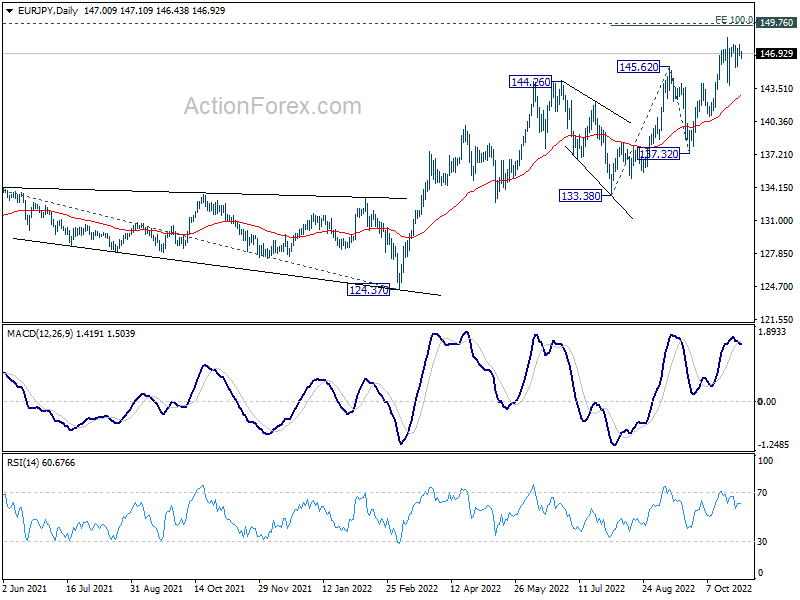
In the bigger picture, the up trend from 114.42 (2020 low) is still in progress for 149.76 (2014 high). Decisive break there will pave the way to 161.8% projection of 114.42 to 134.11 from 124.37 at 156.22. This will now remain the favored case as long as 137.32 support holds.
EUR/GBP Daily Outlook
Daily Pivots: (S1) 0.8585; (P) 0.8606; (R1) 0.8638; More...
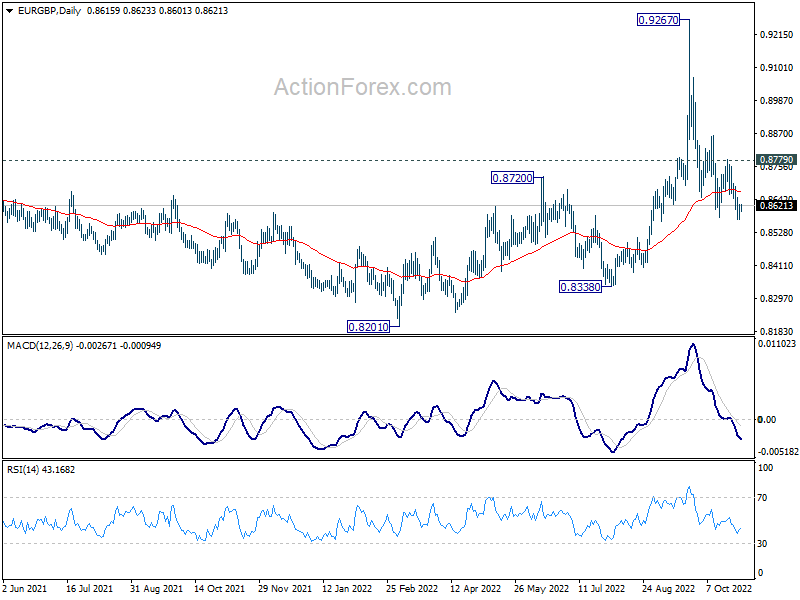
EUR/GBP is losing downside momentum but further decline is expected with 0.8779 resistance intact. Current decline from 0.9267 should target 0.8201/8388 support zone. However, break of 0.8770 will turn bias back to the upside for 0.8869 resistance and above.
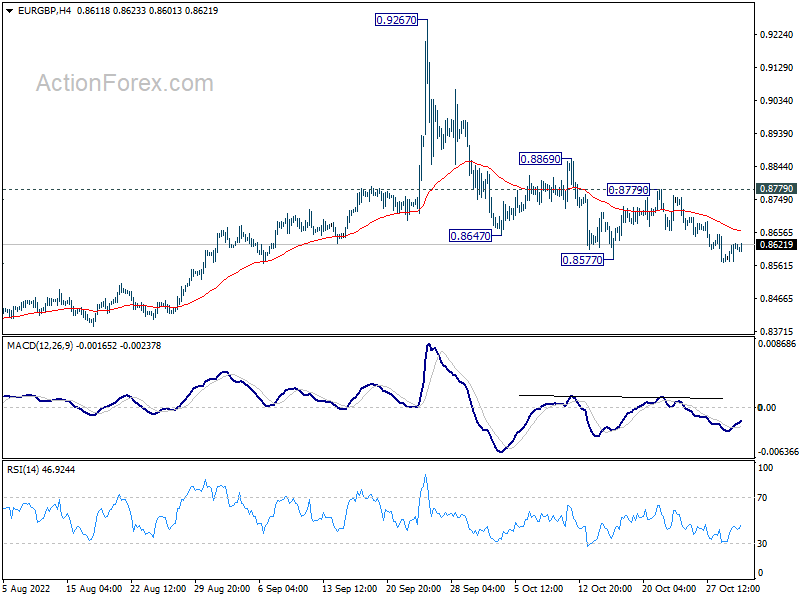
In the bigger picture, current development suggests that fall from 0.9267 is a down leg inside long term range pattern. Deeper fall could be seen towards 0.8201/8338 support zone. But strong support should be seen there to bring reversal.
EUR/AUD Daily Outlook
Daily Pivots: (S1) 1.5403; (P) 1.5485; (R1) 1.5529; More...
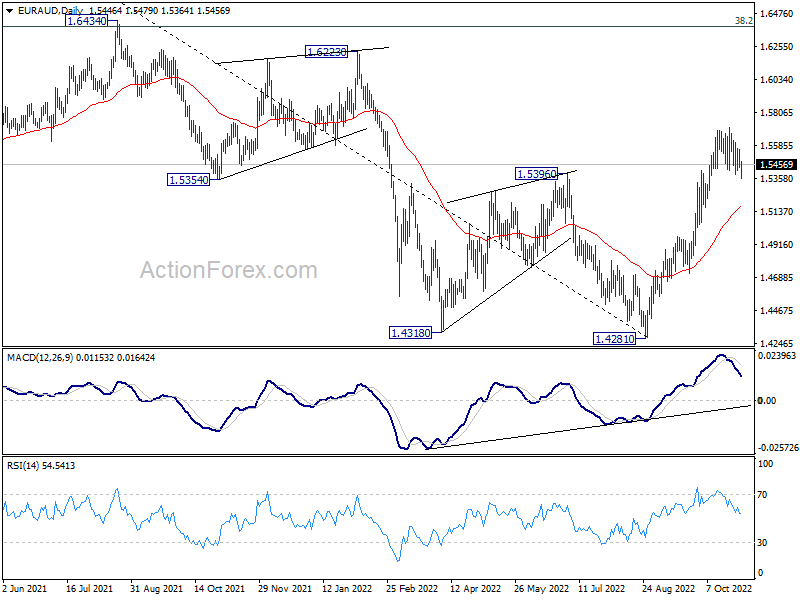
EUR/AUD is extending the consolidation from 1.5704 and intraday bias remains neutral. Deeper decline cannot be ruled out. But downside should be contained by 55 day EMA (now at 1.5172) to bring rebound. On the upside, break of 1.5704 will resume the rally from 1.4281.
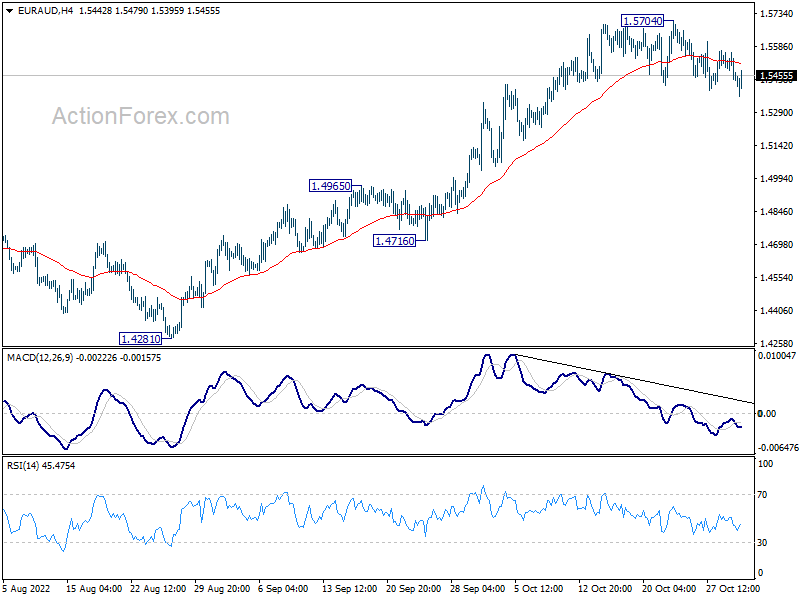
In the bigger picture, a medium term bottom should be in place at 1.4281, on bullish convergence condition in daily MACD. Further rise would be seen back to 1.6434 key resistance next. Break of 1.4965 resistance turned support is needed to indicate reversal. Otherwise, further rally will remain in favor.