Sample Category Title
Technical Outlook and Review
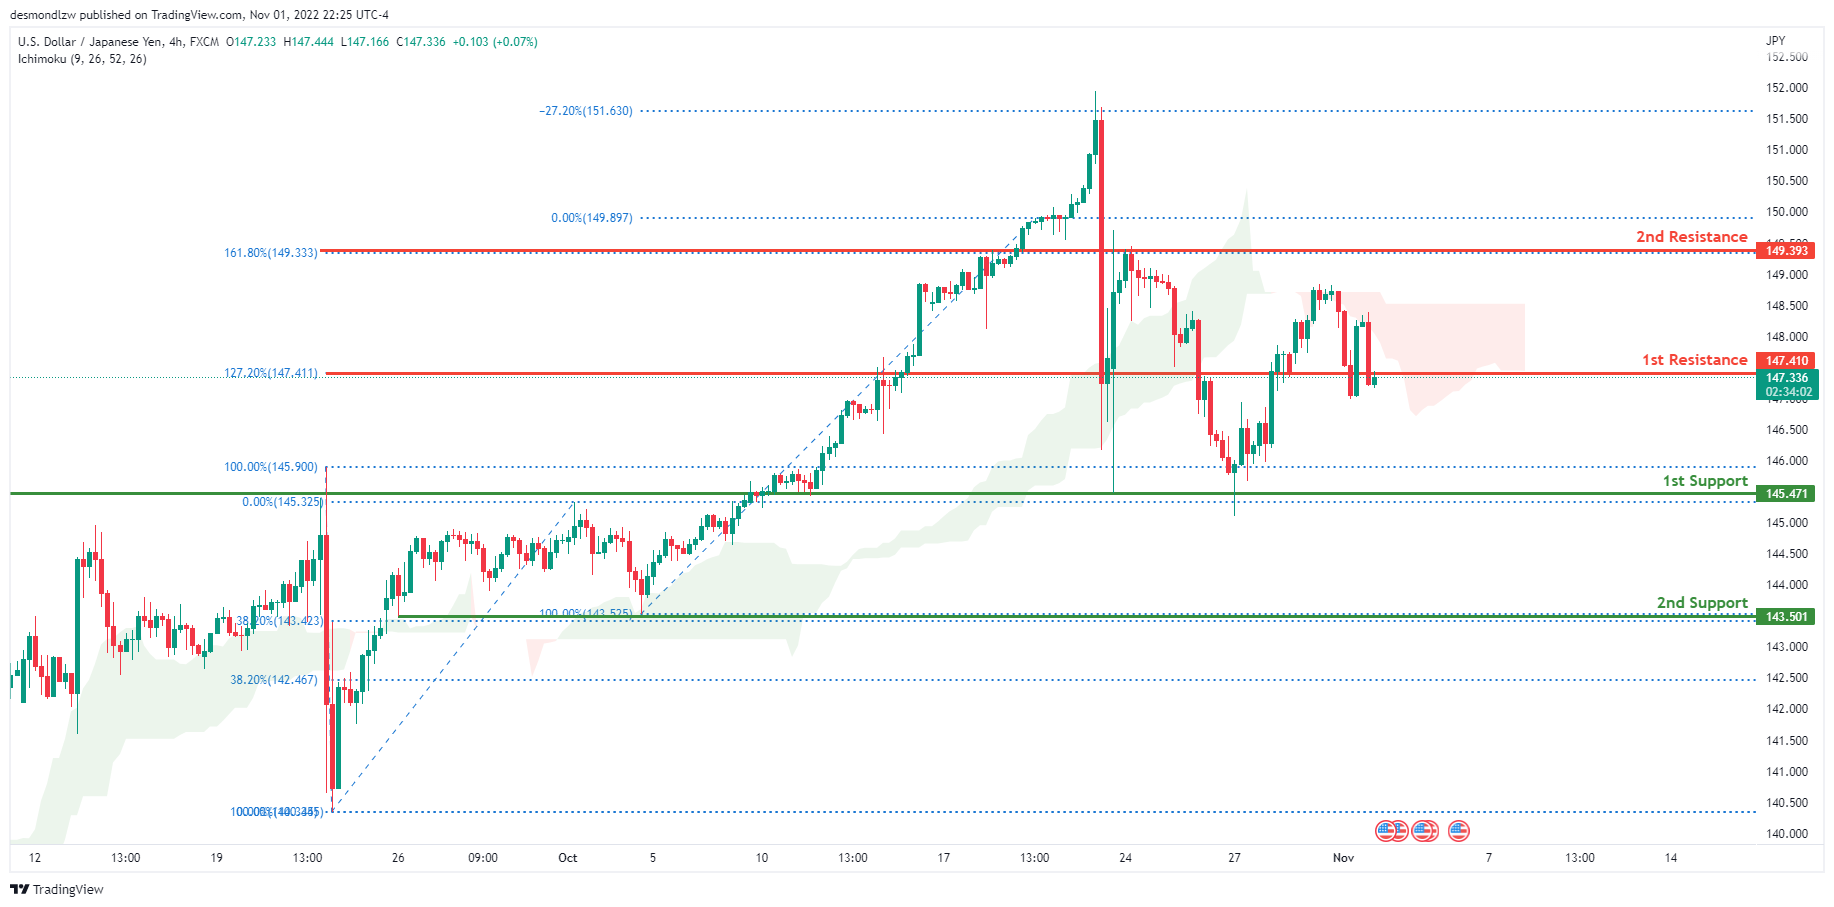
USD/JPY:
The current general bias for USDJPY on the H4 chart is bearish. To add confluence to this, the price is below the Ichimoku cloud which indicates a bearish market. Overnight, USDJPY had some bearish momentum downwards with the price closing under the 1st resistance line at 147.410 where the 127.2% Fibonacci extension line is located. Price is currently trading at 147.352 at time of writing. If this bearish momentum continues, expect USDJPY to possibly head downwards towards the 1st support at 145.751 where the 100% and 0% Fibonacci lines are located.
Areas of consideration:
- H4 time frame, 1st resistance at 147.410
- H4 time frame, 1st support at 145.751
DXY:
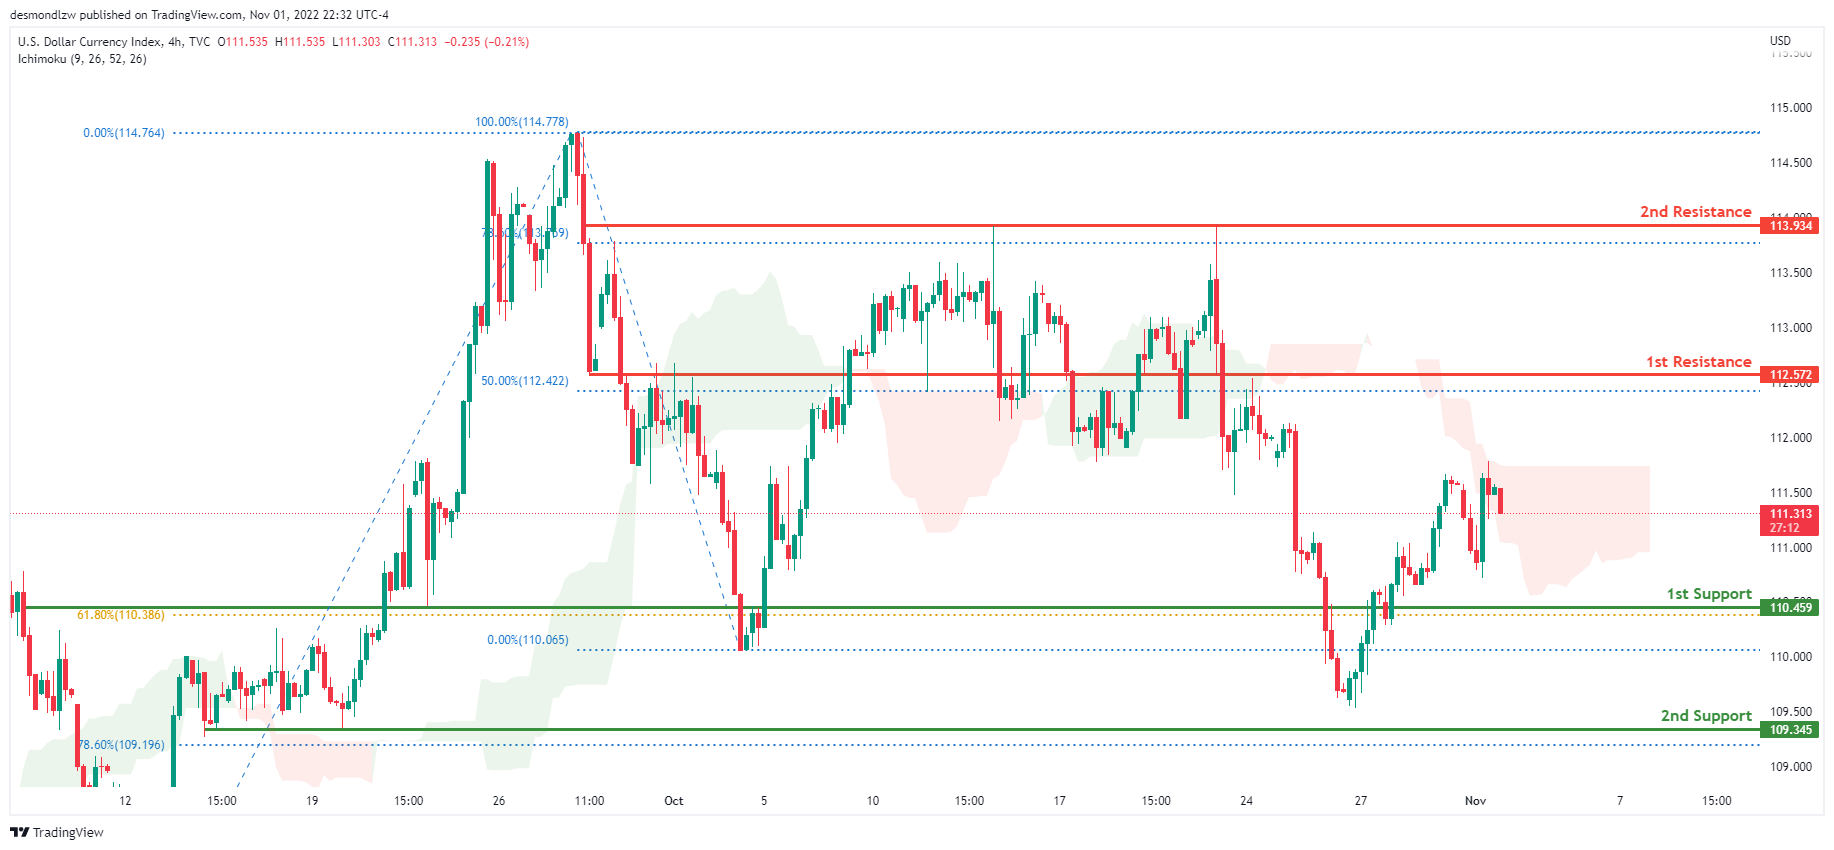
On the H4 chart, the overall bias for DXY is bearish. To add confluence to this, the price is below the Ichimoku cloud which indicates a bearish market. Overnight, DXY had bullish momentum upwards with the price currently trading at 111.310 at time of writing. If this bearish momentum continues, expect price to possibly head towards the 1st support at 110.459, where the 61.8% Fibonacci line is located.
Areas of consideration:
- H4 time frame, 1st resistance at 112.572
- H4 time frame, 1st support at 110.459
EUR/USD:
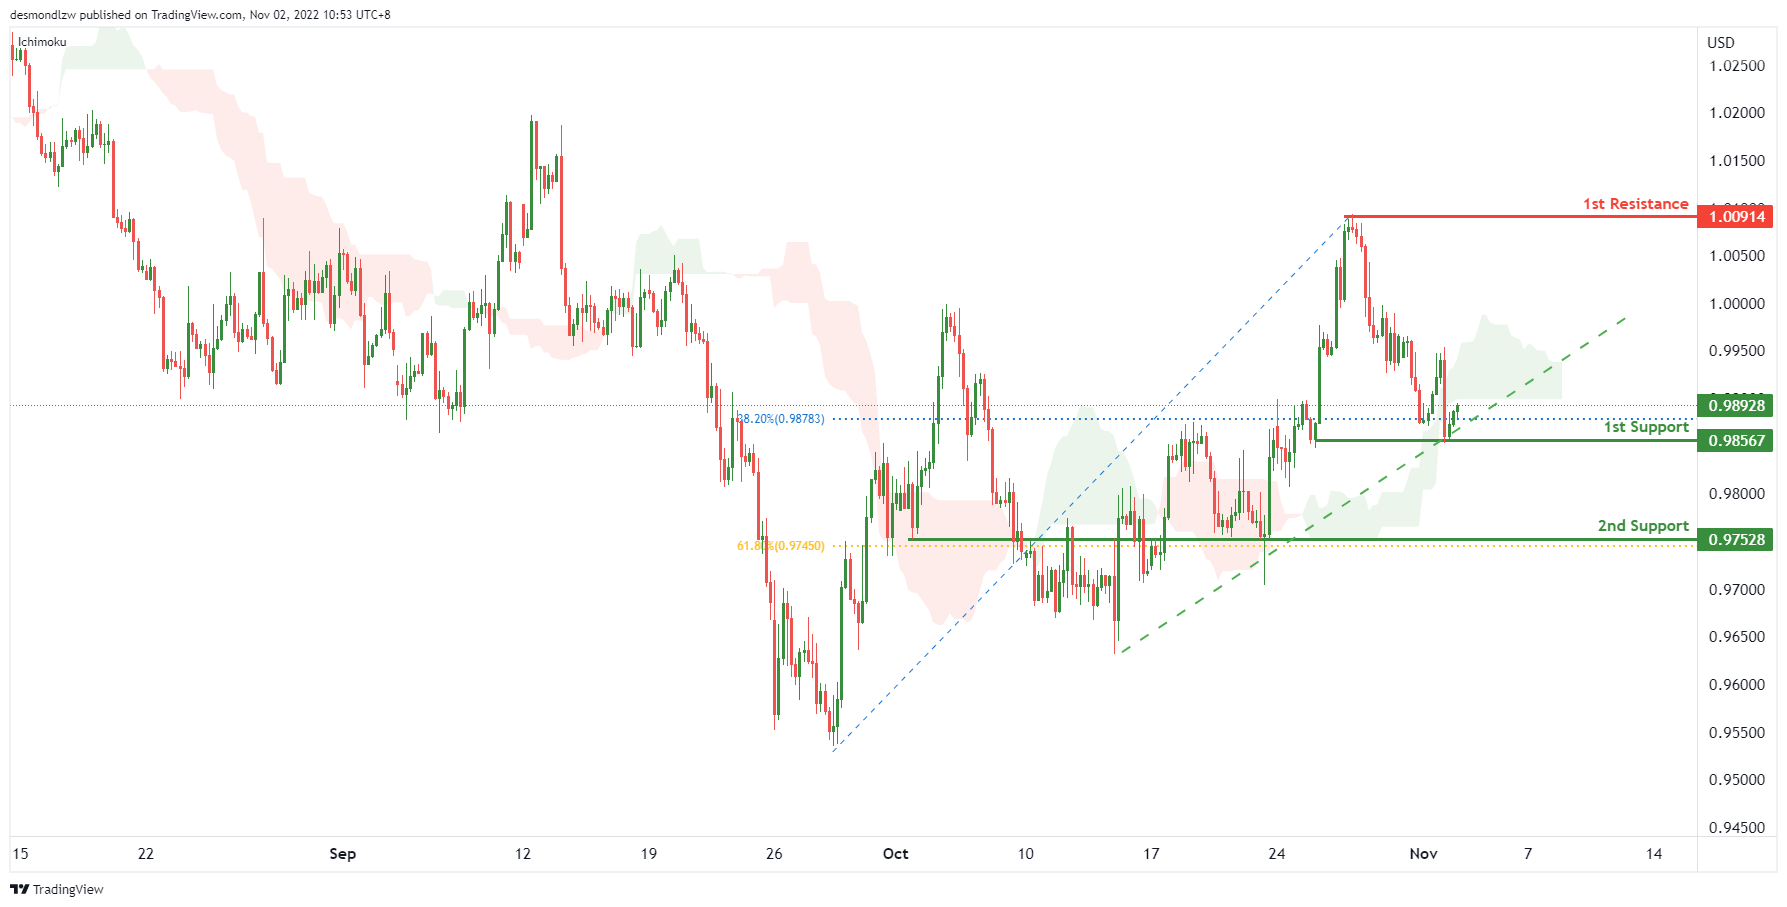
On the H4, with the price moving within the ascending trendline and above ichimoku cloud, we have a bullish bias that the price may rise from the 1st support at 0.98567, which is in line with the swing lows to the 1st resistance at 1.00914, where the swing high is. Alternatively, the price may drop to the 2nd support at 0.97528, where the overlap support and 61.8% fibonacci retracement are.
Areas of consideration :
- H4 1st support at 0.98567
- H4 1st resistance at 1.00914
GBP/USD:
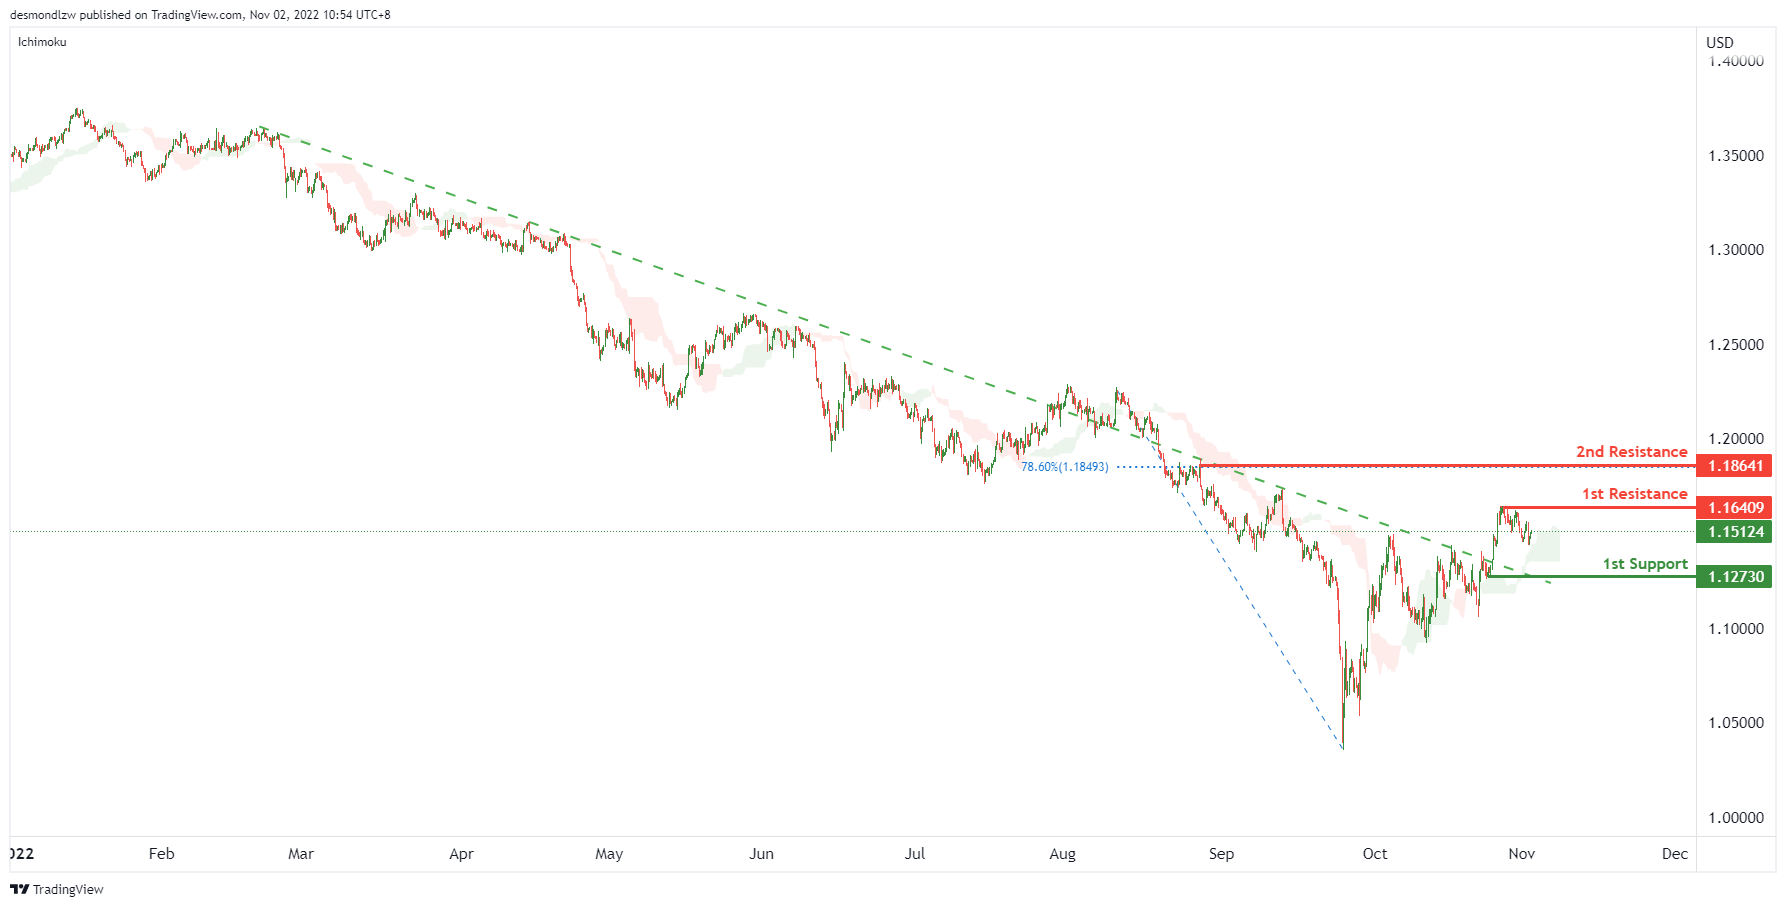
On the H4, price is above the ichimoku cloud and breaking the descending trendline, we have a bullish bias that the price may test the 1st resistance at 1.16409, which is in line with the previous swing high. If the 1st resistance is broken, the 2nd resistance is at 1.18641, where the 78.6% fibonacci retracement sits. Alternatively, the price may drop to the 1st support at 1.12730, where the swing low support is.
Areas of consideration:
- H4 current price
- H4 1st resistance at 1.16409
USD/CHF:
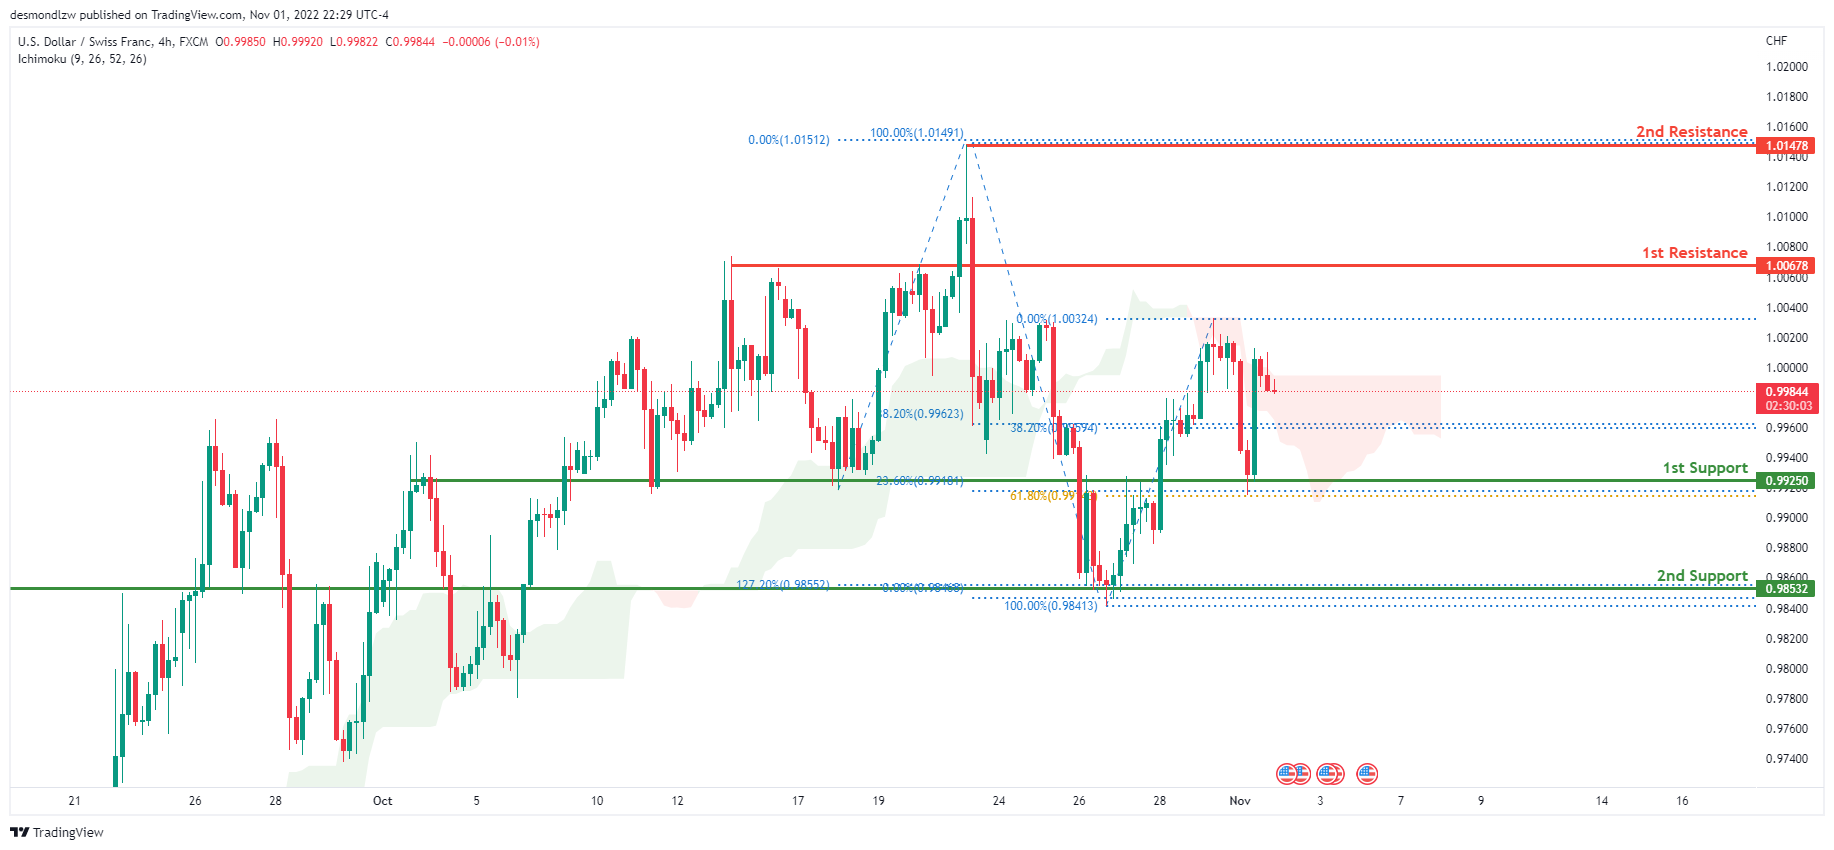
On the H4 chart, the overall bias for USDCHF is bearish. To add confluence to this, the price is below the Ichimoku cloud which indicates a bearish market. Overnight, USDCHF had some bullish momentum upwards with the price reflecting off the 1st support at 0.98532 where the 23.6% and 61.8% Fibonacci lines are located. Price is currently trading at 0.99830 at time of writing. Expecting price to possibly head back up to retest the 1st resistance line at 1.00678 where the 78.6% Fibonacci line is located.
Areas of consideration
- H4 1st support at 0.99250
- H4 2nd support at 0.98532
- H4 1st resistance at 1.00678
XAU/USD (GOLD):
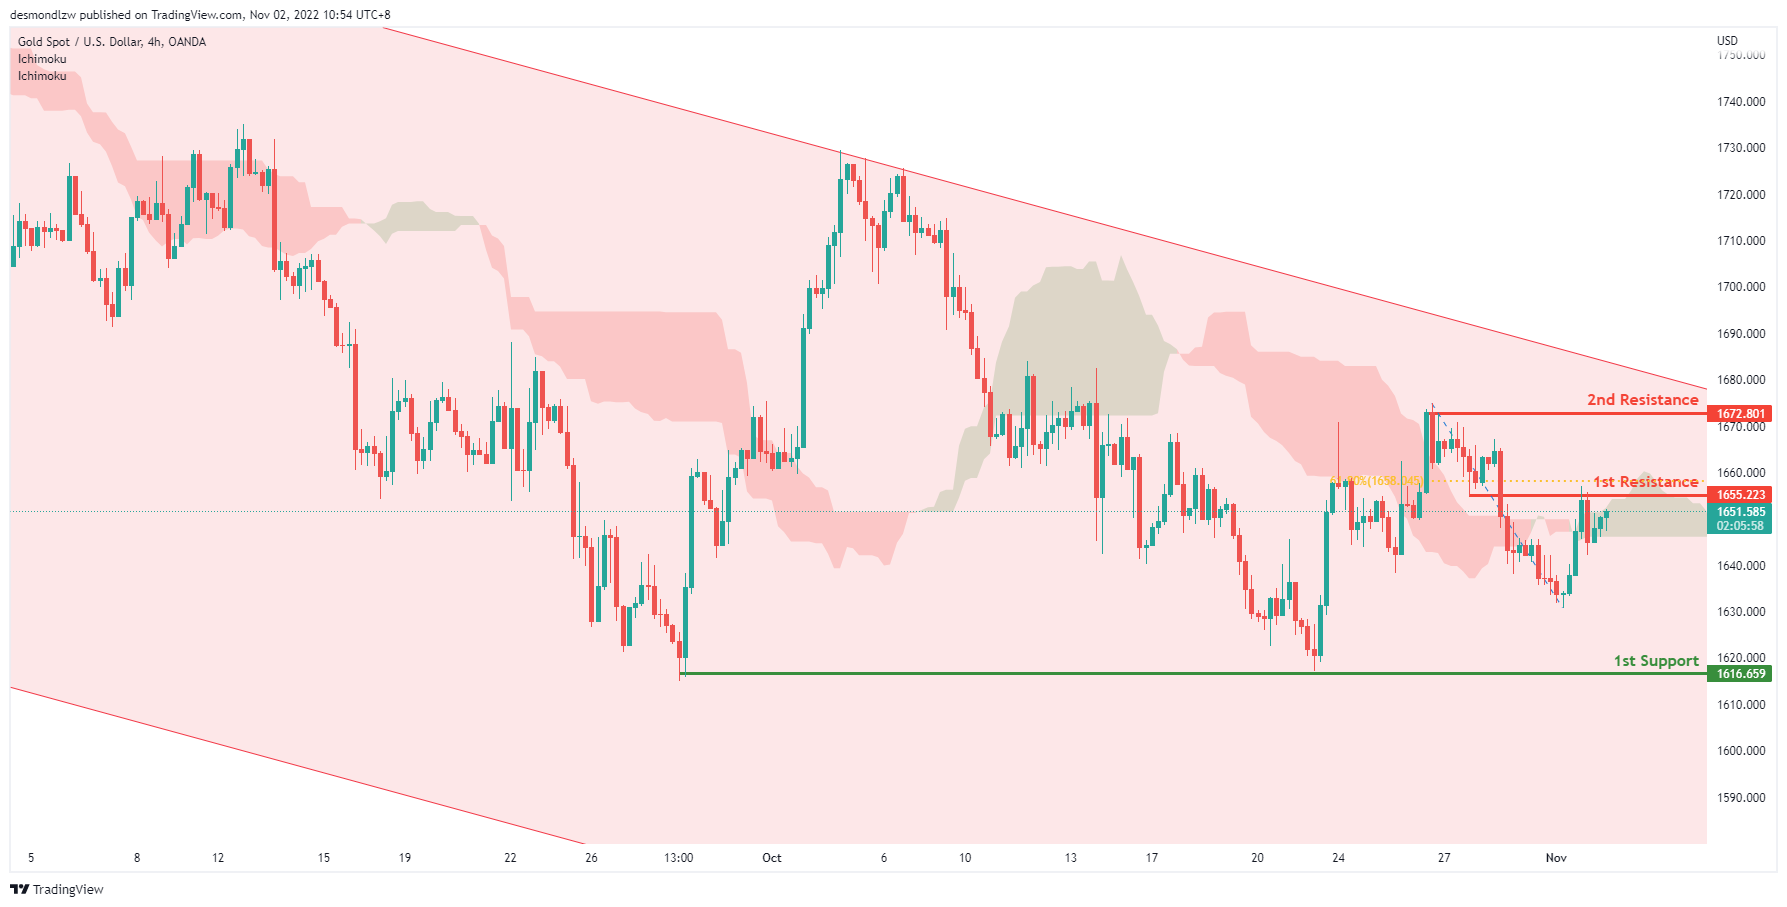
On H4, with the price within the descending channel and crossing ichimoku cloud, we have a bearish bias that the price may drop from the 1st resistance at 1655.223, which is in line with the overlap resistance and 61.8% fibonacci retracement to the 1st support at 1616.659, where the previous swing lows are. Alternatively, the price may rise to retest the 1st resistance and rise to the 2nd resistance is at 1672.801, where the previous swing high is.
Areas of consideration:
- H4 time frame, 1st resistance at 1655.223
- H4 time frame, 1st support at 1616.659
AUD/USD:
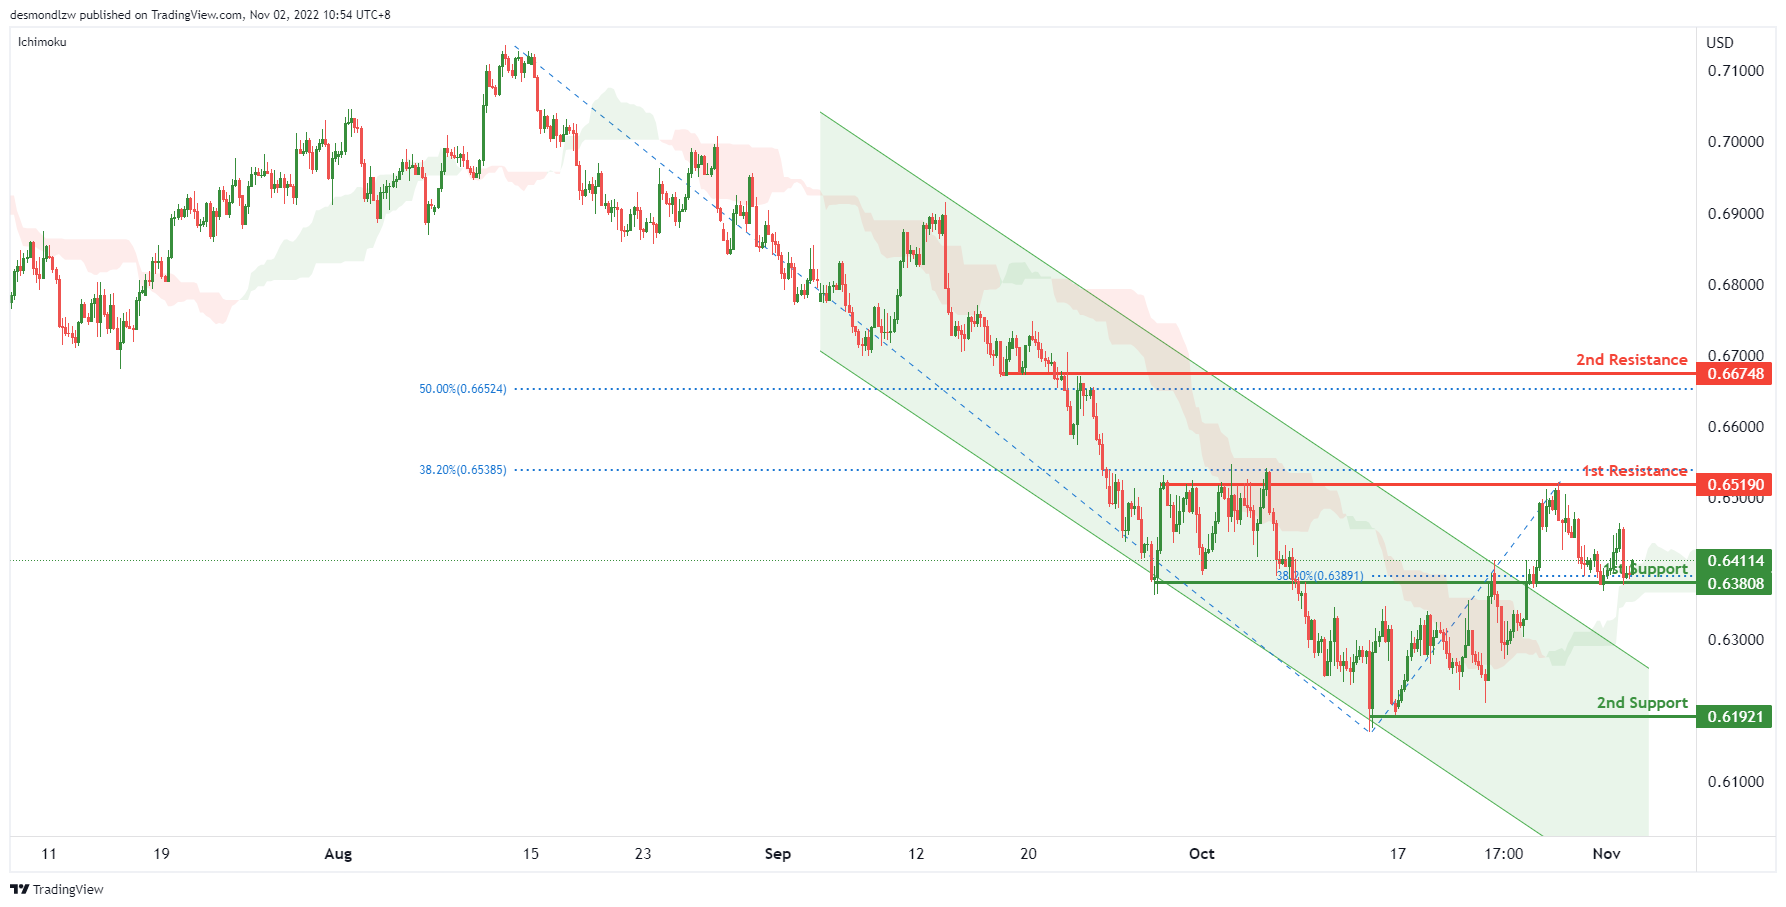
On the H4, with the price breaking the descending channel and above ichimoku cloud, we have a bullish bias that the price may rise from the 1st support at 0.63808, which is in line with the overlap support and 38.2% fibonacci retracement to the 1st resistance at 0.65190, which is in line with the overlap resistance and 38.2% fibonacci retracement. If the 1st resistance is broken, the 2nd resistance is at 0.66748, where the 50% fibonacci retracement is. Alternatively, the price may drop to the 2nd support at 0.61921, where the previous swing low is.
Areas of consideration
- H4, 1st support at 0.63808
- H4, 1st resistance at 0.65190
NZD/USD:
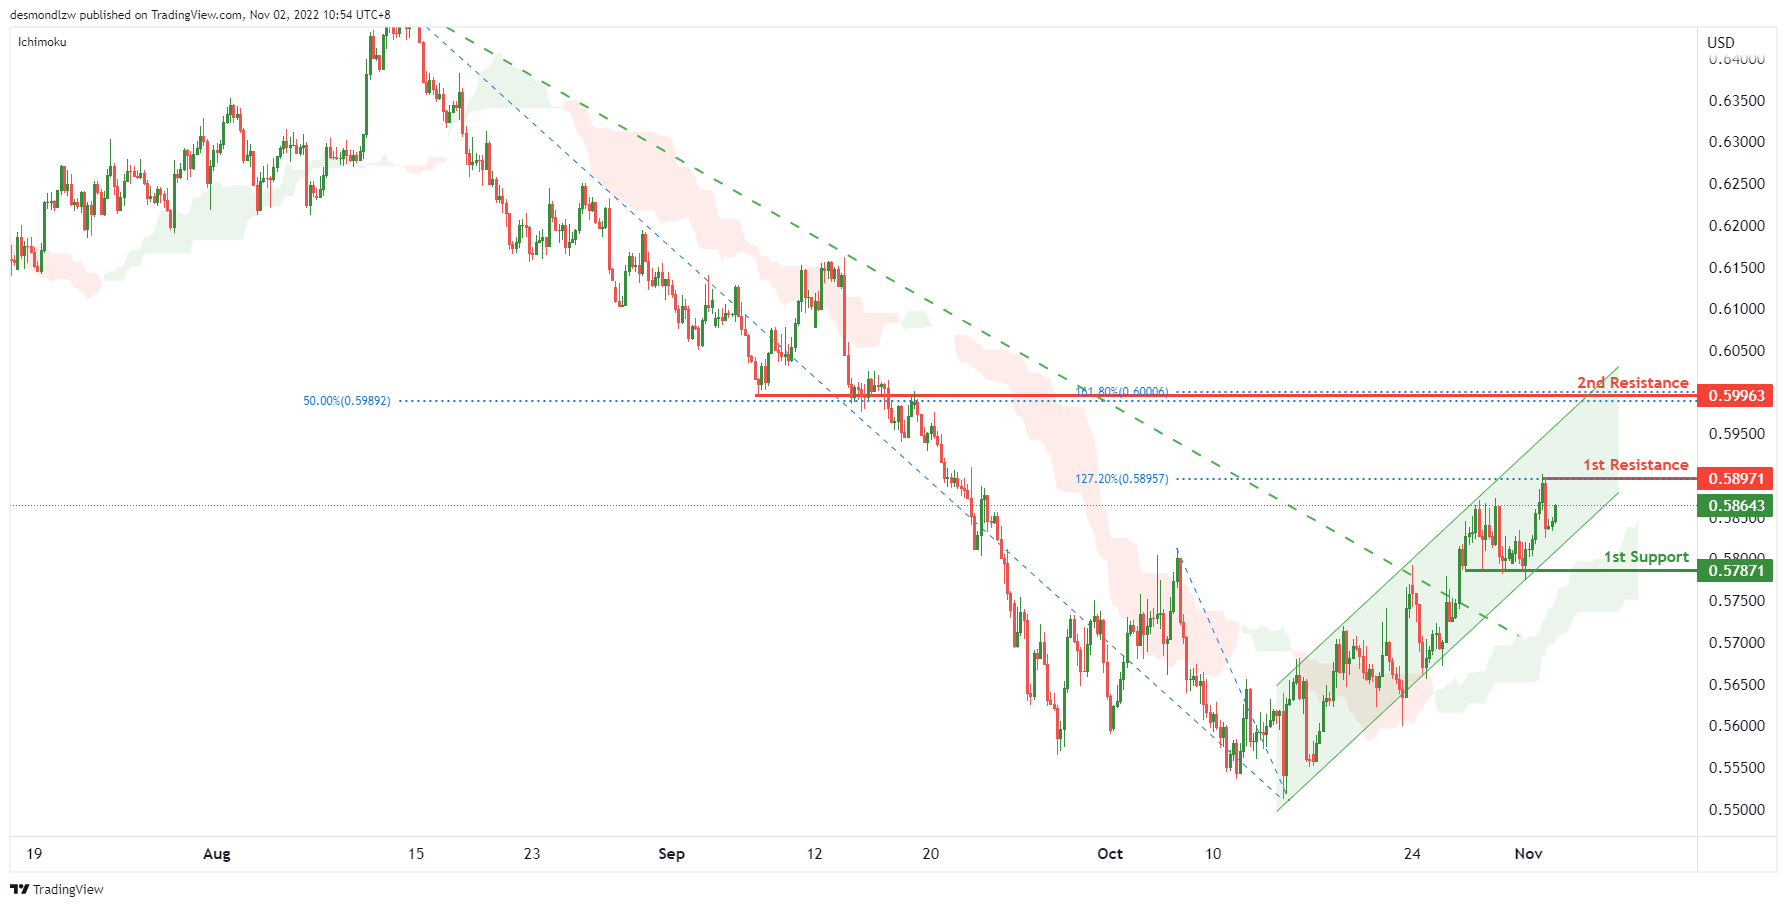
On the H4 chart, as the price is breaking the descending trendline, moving within the ascending channel and the price is above ichimoku cloud, we have a bullish bias that the price may rise to the 1st resistance at 0.58971, which is in line with the previous swing high and 127.2% fibonacci extension. If the 1st resistance is broken, the 2nd resistance is at 0.59963, where the 50% fibonacci retracement and 161.8% fibonacci extension are. Alternatively, the price may drop to the 1st support at 0.57871, where the previous swing lows are.
Areas of consideration:
- H4 time frame, 1st resistance at 0.58971
- H4 time frame, 2nd resistance at 0.59963
USD/CAD:
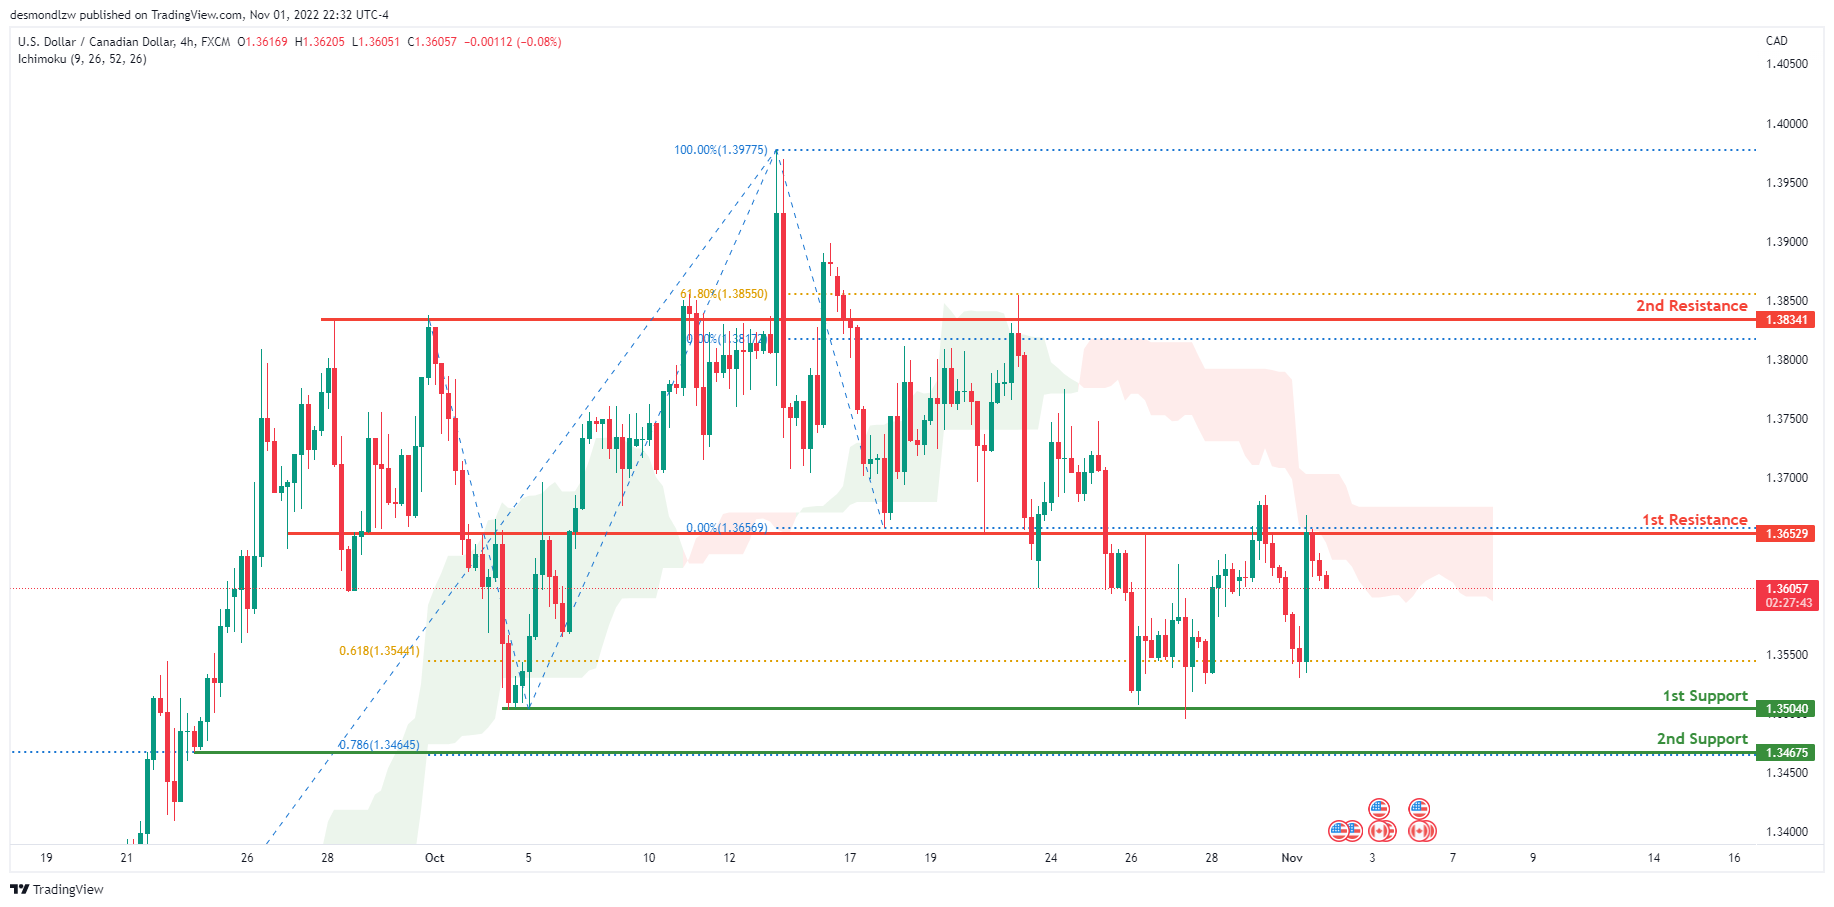
On the H4 chart, the overall bias for USDCAD is bearish. To add confluence to this, the price is below the Ichimoku cloud which indicates a bearish market. Overnight, price reflected off the 1st resistance at 1.36751 where the 0% fibonacci line is located. If this bearish momentum continues, the price will head towards the 1st support at 1.35040 where the previous swing low and 61.8% Fibonacci projection line is located.
Areas of consideration:
- H4 time frame, 1st resistance at 1.36751
- H4 time frame, 1st support at 1.35029
- H4 time frame, 2nd support at 1.34675
OIL:
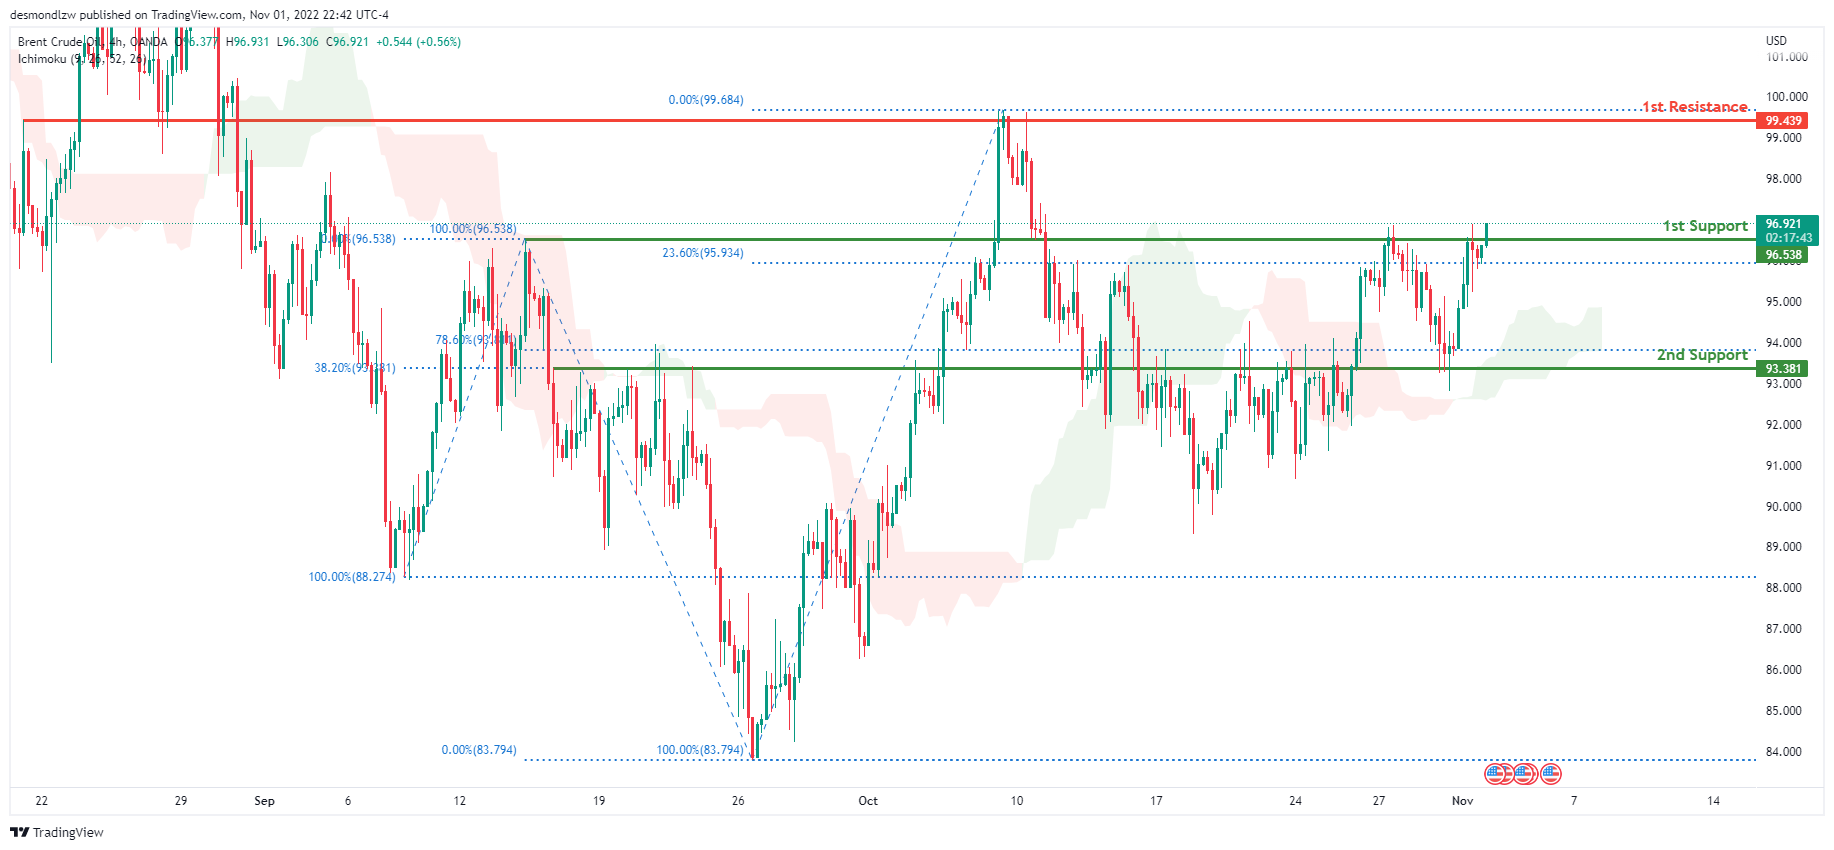
Looking at the H4 chart, the current overall bias for Oil is bullish. To add confluence to this, the price is above the Ichimoku cloud which indicates a bullish market. Overnight, price continued its bullish momentum upwards with price currently above the 1st support line at 96.538 where the 100% and 23.6% Fibonacci lines are located. If this bullish momentum continues, expect price to possibly head towards the 1st resistance at 99.439 where previous swing high and 0% Fibonacci line is located.
Areas of consideration:
- H4 time frame, 1st resistance at 99.439
- H4 time frame, 1st support at 96.538
Dow Jones Industrial Average:
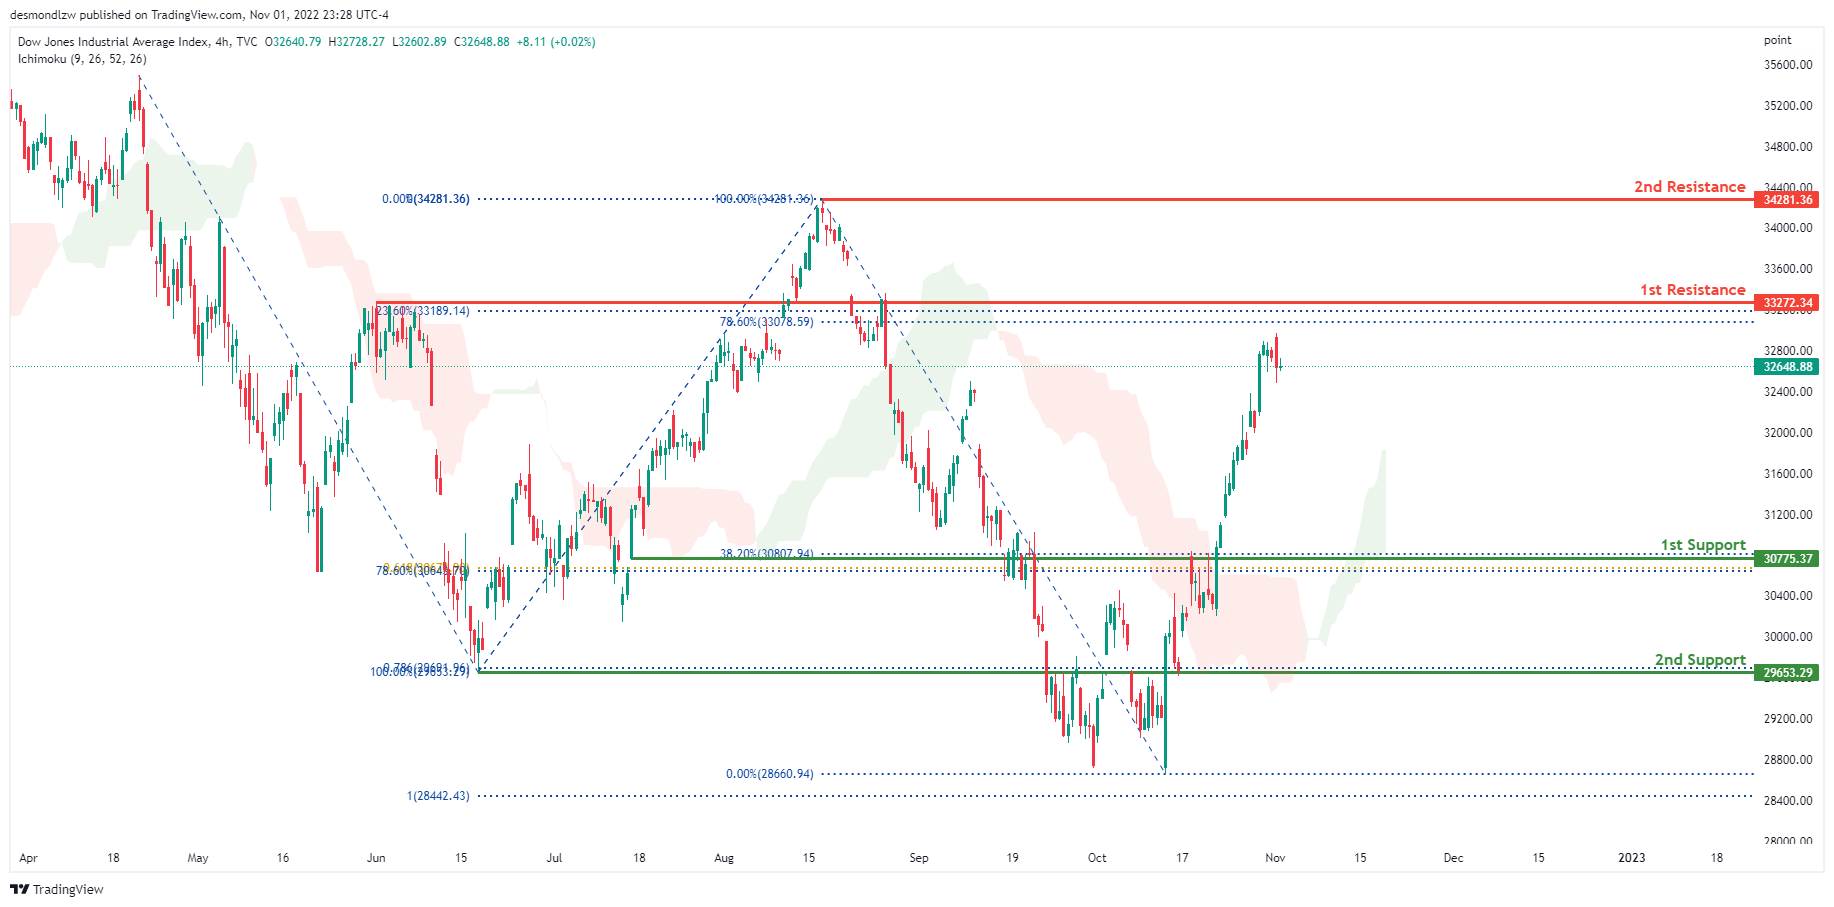
On the H4 chart, the overall bias for DJI is bullish. To add confluence to this, the price is above the Ichimoku cloud which indicates a bullish market. Overnight, DXY consolidated around the area of 32648.88. If this bullish momentum continues, expect the price to possibly head towards the 1st resistance at 33272.34 where the 23.6% and 78.6% Fibonacci lines are located.
Areas of consideration:
- H4 time frame, 1st support at 30775.37
- H4 time frame, 1st Resistance at 33272.34
DAX:
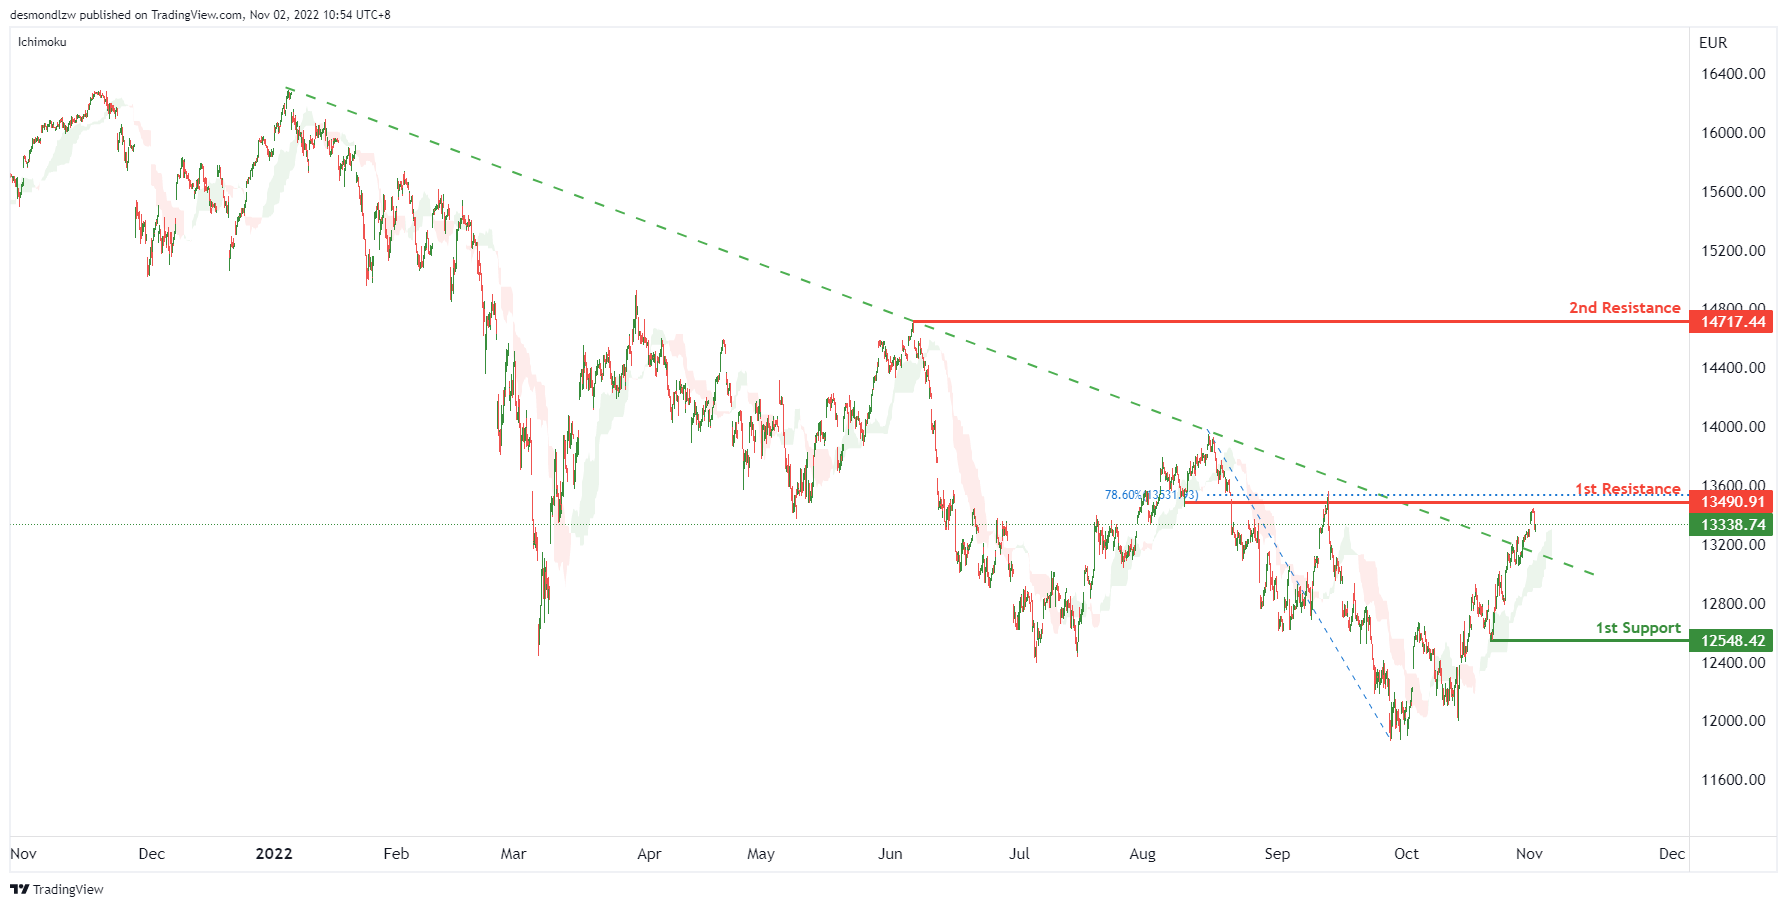
On the H4 chart, the price has now closed above the Ichimoku cloud which indicates a breakout of a descending trendline. Expecting price to possibly continue this bullish momentum and head towards the 1st resistance at 13490.91, where the 78.6% Fibonacci line is located. If the 1st resistance is broken, the 2nd resistance could be at 14717.44, which is in line with the previous swing high. Alternatively, the price may drop to the 1st support at 12548.42, which is in line with the swing low.
Areas of consideration:
- H4 time frame, 1st resistance at 13490.91
- H4 time frame, 2nd resistance at 14717.44
ETHUSD:
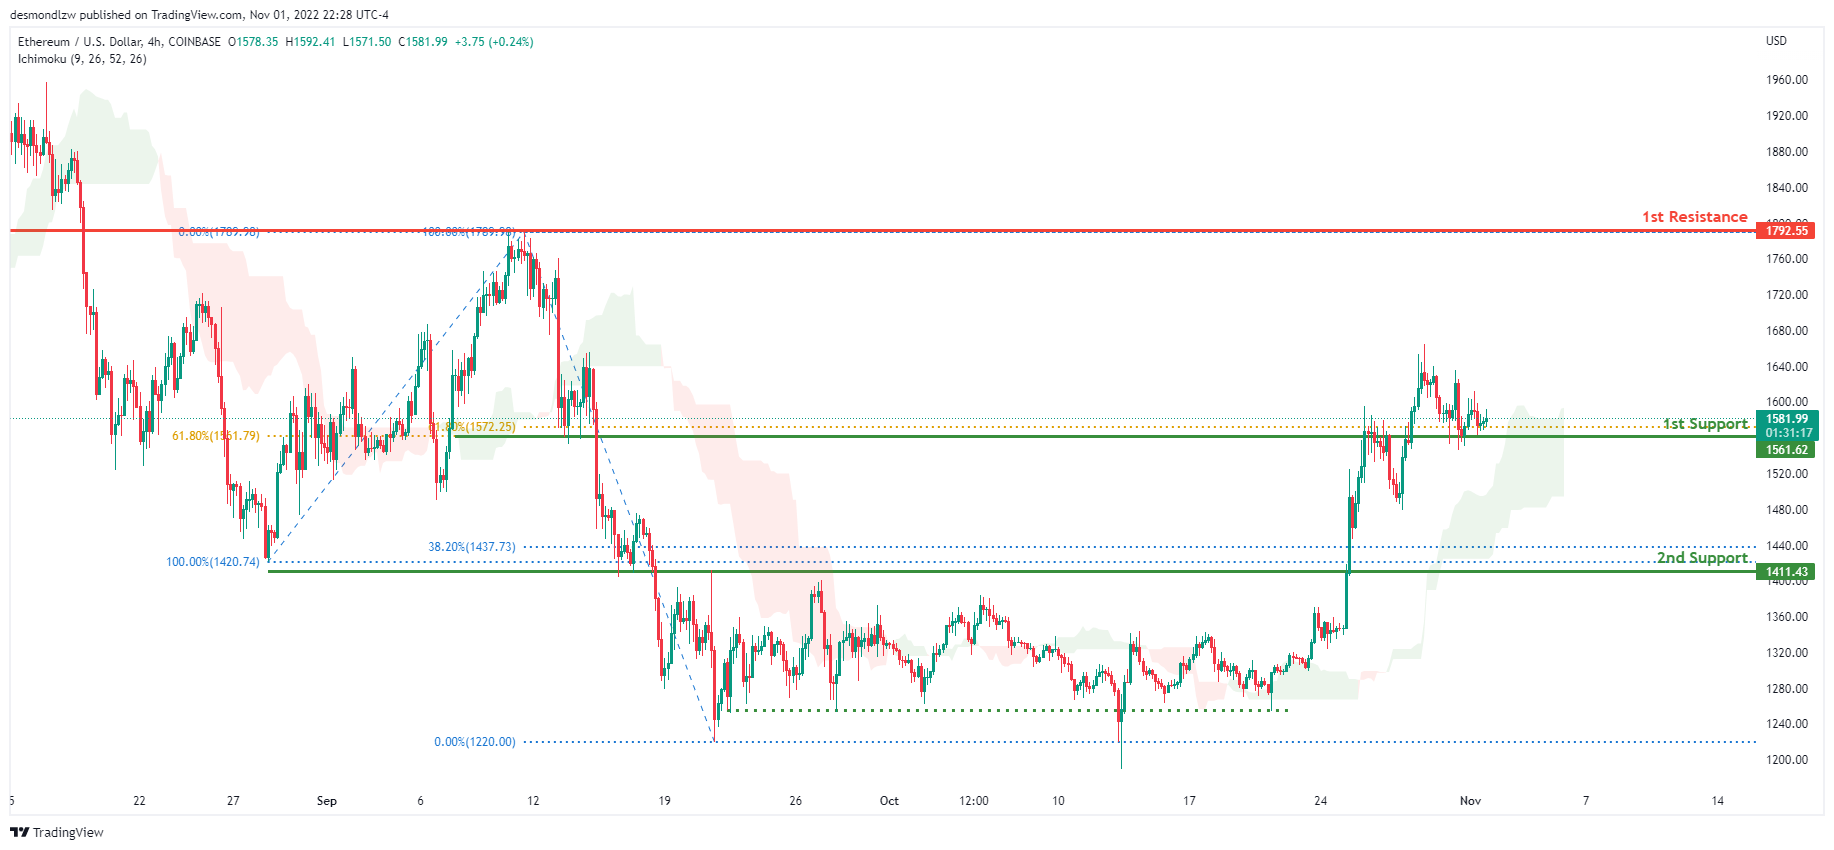
Looking at the H4 chart, the current overall bias for ETHUSD is bullish. To add confluence to this, the price is above the Ichimoku cloud which indicates a bullish market. Overnight, price continued to consolidate along the 1st support level at 1561.62 where 2 of the 61.8% Fibonacci lines are located. If this bullish momentum continues, expect the price to head towards the 1st resistance at 1792.55 where the previous swing high and 100% Fibonacci line is located.
Areas of consideration:
- H4 time frame, 1st resistance of 1792.55
- H4 time frame, 1st support at 1561.62
BTCUSD:
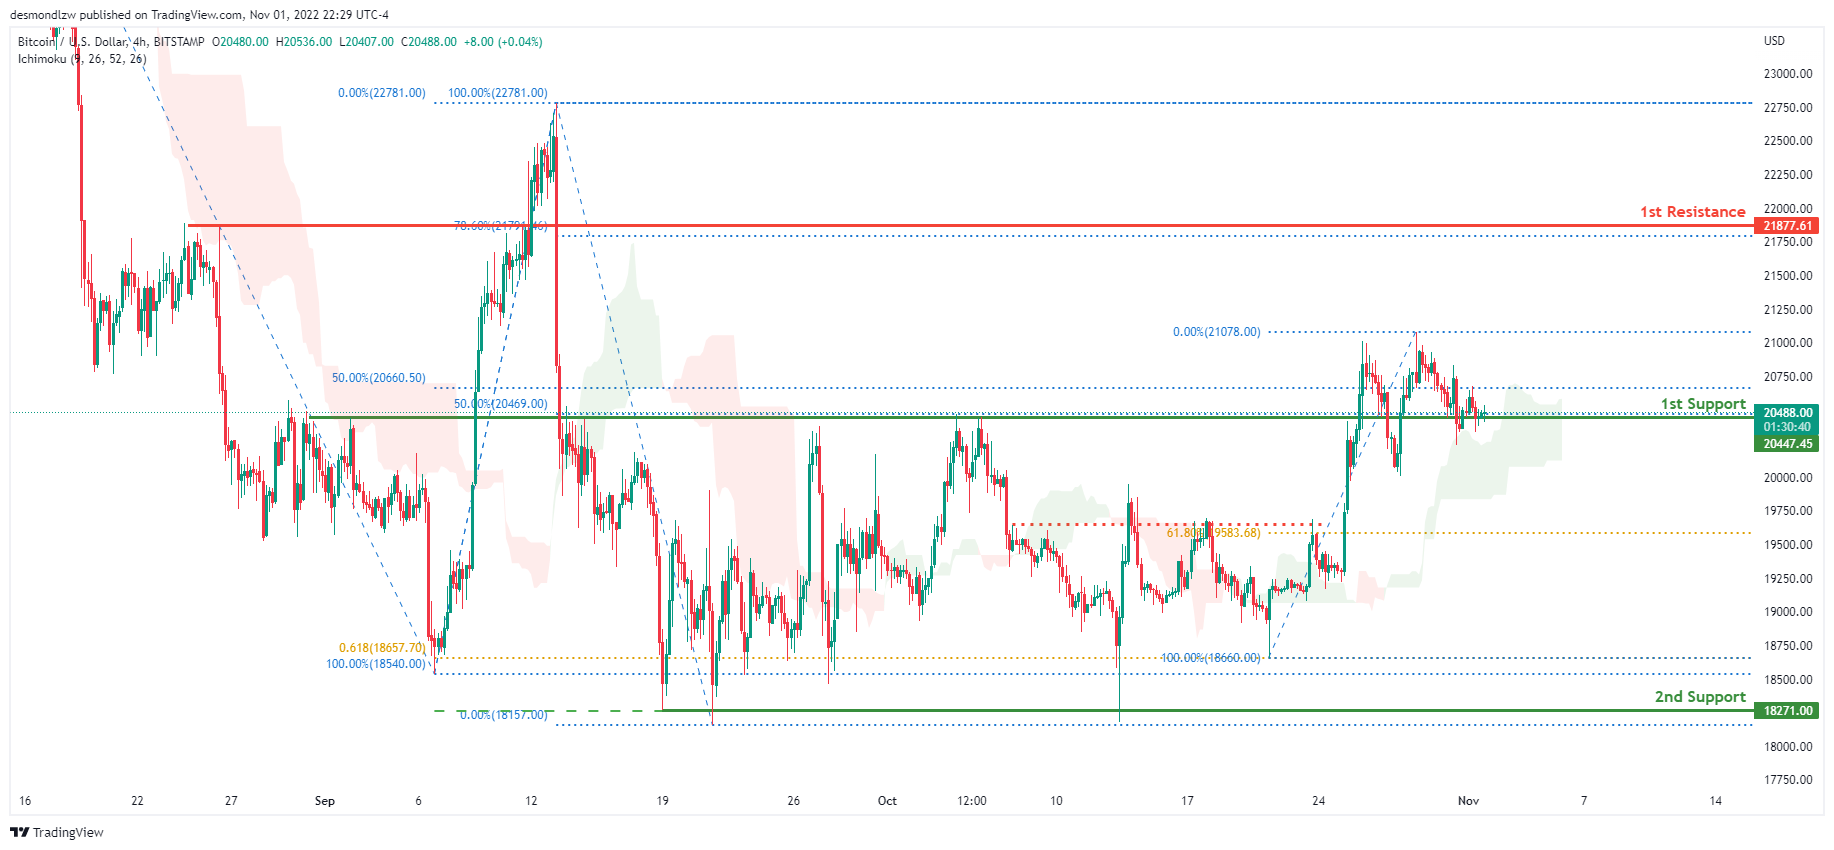
On the H4 chart, the overall bias for BTCUSD is bullish. To add confluence to this, the price is above the Ichimoku cloud which indicates a bullish market. Overnight, price continued to consolidate along the 1st support at 20440.00 where the 2 of the 50% Fibonacci lines are located. If this bullish momentum continues, expect the price to head towards the 1st resistance at 21892.00, where the 78.6% Fibonacci line is located.
Areas of consideration:
- H4 time frame, 1st resistance 21892.00
- H4 time frame, 1st support at 20440.00
S&P 500:
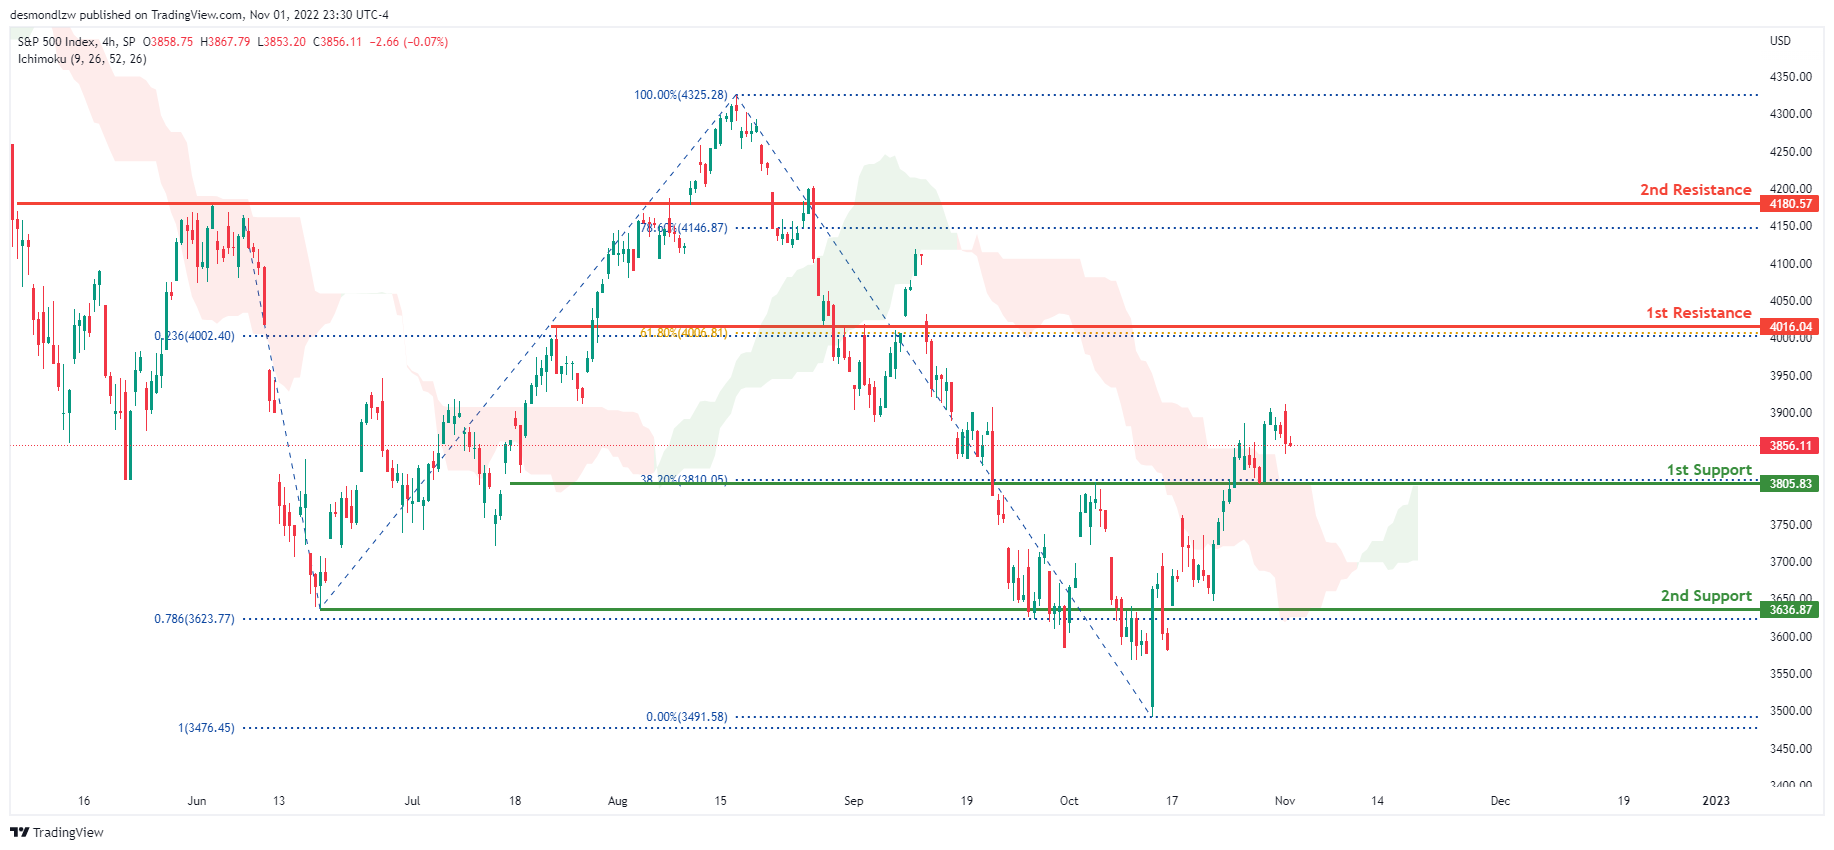
On the H4 chart, the overall bias for S&P500 is bullish. To add confluence to this, the price is above the Ichimoku cloud which indicates a bullish market. Overnight, price continued to consolidate with price currently trading at 3856.11 at time of writing. If this bullish momentum continues, expect price to possibly head towards the 1st resistance at 4016.04 where the 61.8% Fibonacci line and 23.6% Fibonacci projection line is located.
Areas of consideration:
- H4 time frame, 1st support at 3805.83
- H4 time frame, 1st resistance at 4016.04
USD/CHF Daily Outlook
Daily Pivots: (S1) 0.9937; (P) 0.9980; (R1) 1.0044; More...
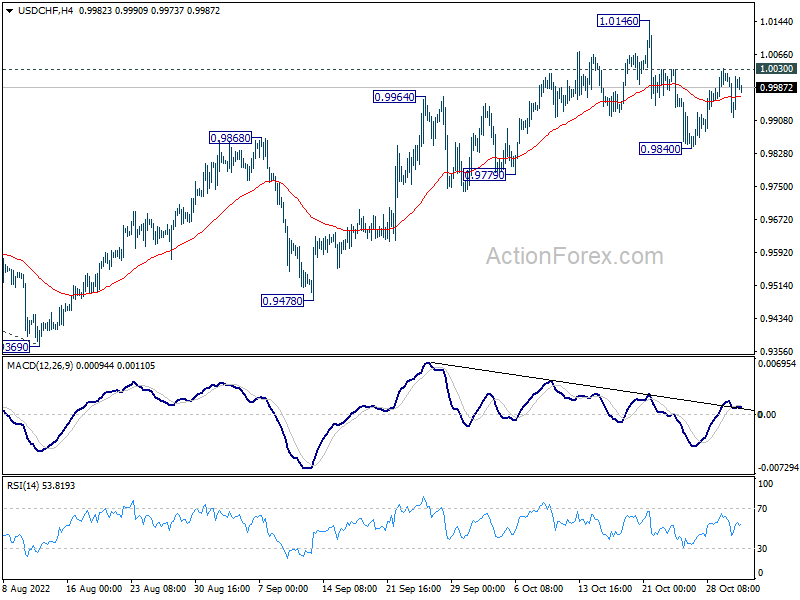
Intraday bias in USD/CHF stays neutral and outlook is unchanged. On the upside, break of 1.0030 minor resistance will suggest that pull back from 1.0146 has completed at 0.9840. Bias will be back on the upside for retesting 1.0146. Firm break there will resume larger up trend to 1.0283 projection level. However, break of 0.9840 support will now be a sign of reversal, and bring deeper decline back to 0.9779 support instead.
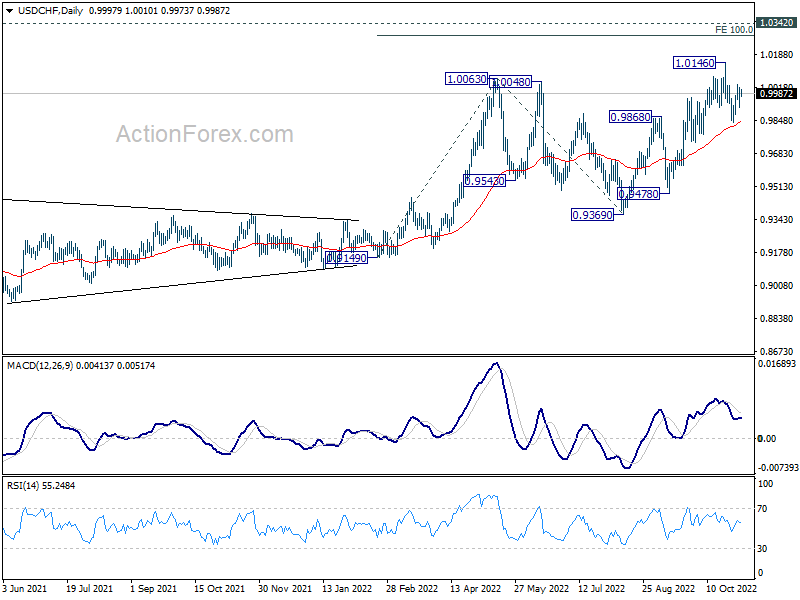
In the bigger picture, current development suggests that up trend from 0.8756 (2021 low) is still in progress. Next target is 100% projection of 0.9149 to 1.0063 from 0.9369 at 1.0283, and then 1.0342 (2016 high). For now, this will remain the favored case as long as 0.9779 support holds, even in case of deep pull back.
Dollar Softens as FOMC Awaited, Yen Firms Up
Dollar is trading mildly lower in Asian session today, but manages to maintain most of this week's gain so far. The greenback will look into today's FOMC rate decision, where a 75bps hike is well priced in. Today's Fed meeting is not about today, but how Chair Jerome Powell would indicate the rate path ahead. Meanwhile, Yen is trading broadly higher as supported by comment from Japanese official that even gradual depreciation in exchange rate is now a concern. Overall, most major pairs and crosses are stuck inside last week's range, with the exception of Kiwi.
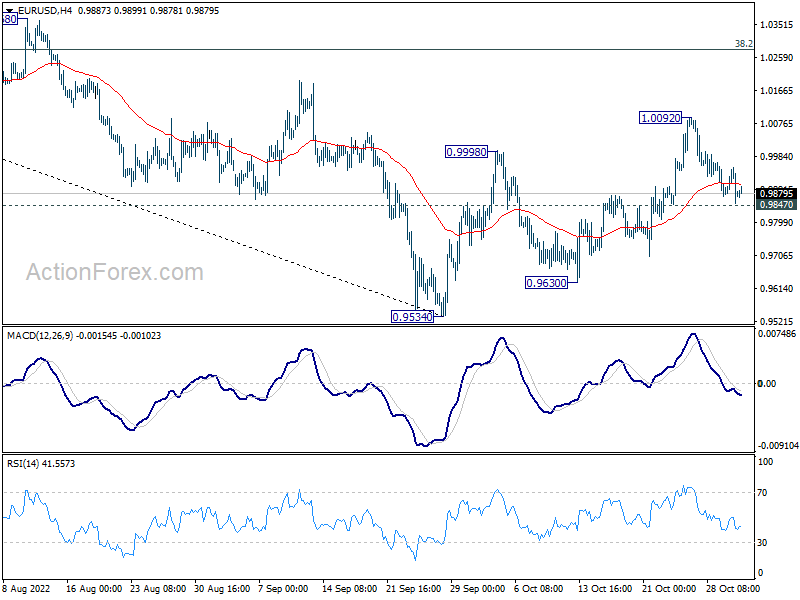
Technically, some focuses will be on 0.9847 minor support in EUR/USD and 1.0030 minor resistance in USD/CHF. Break of these levels will argue that Dollar's near term pull back is finished, which set the stage for more upside in the greenback, at least until Friday's non-farm payrolls.
In Asia, at the time of writing, Nikkei is down -0.11%. Hong Kong HSI is up 1.74%. China Shanghai SSE is up 0.88%. Singapore Strait Times is down -0.23%. Japan 10-year JGB yield is up 0.0026 at 0.255. Overnight, DOW dropped -0.24%> S&P 500 dropped -0.41%. NASDAQ dropped -0.89%. 10-year yield dropped -0.025 to 4.052, after dipping to 3.920.
BoC Macklem: We are getting closer, but we are not there yet
BoC Governor Tiff Macklem said in a speech that the central bank is trying to "balance the risks of under- and over-tightening." "The tightening phase will draw to a close," he added. "We are getting closer, but we are not there yet."
BoC is still "far from that goal" of ensuring "low, stable and predictable" inflation. "With inflation so far above our target, we are particularly concerned about the upside risks," he added.
Macklem also said, "We expect growth will stall in the next few quarters—in other words, growth will be close to zero. But once we get through this slowdown, growth will pick up, our economy will grow solidly, and the benefits of low and predictable inflation will be restored."
Japan Suzuki concerned about gradual weakening of Yen
Japan Finance Minister Shunichi Suzuki told the parliament, "I am very concerned about the gradual weakening of the yen", which could accelerate inflation by increasing import costs.
BoJ Governor Haruhiko Kuroda also said, recent Yen weakness raises uncertainty on the outlook, and is negative for the economy.
Regarding monetary policy, Kuroda said, "If the achievement of our 2% inflation target comes into sight, making yield curve control more flexible could become an option." But for now, he added that the central bank must maintain ultra-low loose monetary policy to support the economy.
Australia AiG manufacturing fell to 49.6, longstanding supply-side problems continue
Australia AiG Performance of Manufacturing Index dropped -0.6 to 49.6 in October. Looking at some details, production dropped -0.1 to 47.6. Employment rose 7.1 to 46.9. New orders dropped -4.0 to 53.8. sales dropped -3.0 to 48.4. Input prices dropped -6.8 to 78.0. Selling prices dropped -2.7 to 67.5. Average wages dropped -5.1 to 71.0.
Innes Willox, Chief Executive of Ai Group said: "Australian manufacturing is in a holding pattern, with three straight months of flat results. Demand conditions in the market remain stable, but longstanding supply-side problems, such as labour and supply chain shortages, continue to drag on the industry."
NZ unemployment rate unchanged at 3.3%, record hourly earning growth
New Zealand employment grew 1.3% in Q3, above expectation of 0.5%. Unemployment rate was unchanged at 3.3%, above expectation of 3.2%. Labor force participation rate rose 0.8% to 71.7%. Underutilization rate dropped -0.2 to 9.0%.
Average ordinary time hourly earnings rose 2.4% qoq, 7.4% yoy. The annual rise was the highest since the series began in 1989. All salary and wage rates (including overtime) index rose 3.7% yoy, second highest annual rate since record began in 1993.
Fed to hike 75bps, would Powell indicate slower tightening ahead?
Fed is widely expected to raise interest rate by 75bps again today, to 3.75-4.00%. The main question is whether Chair Jerome Powell would signal that tightening pace is going to slow afterwards.
Currently, there are some expectations that Fed would opt for a smaller hike of 50bps in December, then a 25bps hike in February, and probably another 25bps in March, and pause from there.
However, such hope was somewhat dashed as job data released yesterday showed that the job market could have tightened further. Job openings surged to 10.7m in September, rather than a fall to 9.8m. Ratio of openings to unemployed persons also climbed from 1.7 to 1.9. ISM manufacturing employment also improved.
Overall, there could be some negative market reactions if Powell doesn't deliver any firm message of a pivot.
Here are some suggested readings on Fed:
- FOMC Meeting Preview: Fed Expected to Hike 75bps, But is the Pivot Imminent?
- Will the Fed Confirm Hopes of Slower Tightening?
- Fed Preview: Too Early for a Pivot
- Powell and NFP Release Will Crash USD
- November Flashlight for the FOMC Blackout Period: Our Expectations Ahead of the November 2nd FOMC Meeting
Elsewhere
Germany trade balance and unemployment, Eurozone PMI manufacturing final will be released in European session. US will also publish ADP private employment today.
USD/CHF Daily Outlook
Daily Pivots: (S1) 0.9937; (P) 0.9980; (R1) 1.0044; More...
Intraday bias in USD/CHF stays neutral and outlook is unchanged. On the upside, break of 1.0030 minor resistance will suggest that pull back from 1.0146 has completed at 0.9840. Bias will be back on the upside for retesting 1.0146. Firm break there will resume larger up trend to 1.0283 projection level. However, break of 0.9840 support will now be a sign of reversal, and bring deeper decline back to 0.9779 support instead.
In the bigger picture, current development suggests that up trend from 0.8756 (2021 low) is still in progress. Next target is 100% projection of 0.9149 to 1.0063 from 0.9369 at 1.0283, and then 1.0342 (2016 high). For now, this will remain the favored case as long as 0.9779 support holds, even in case of deep pull back.
Economic Indicators Update
| GMT | Ccy | Events | Actual | Forecast | Previous | Revised |
|---|---|---|---|---|---|---|
| 21:30 | AUD | AiG Performance of Mfg Index Oct | 49.6 | 50.2 | ||
| 21:45 | NZD | Employment Change Q3 | 1.30% | 0.50% | 0.00% | |
| 21:45 | NZD | Unemployment Rate Q3 | 3.30% | 3.20% | 3.30% | |
| 21:45 | NZD | Labour Cost Index Q/Q Q3 | 1.10% | 1.00% | 1.30% | |
| 23:50 | JPY | Monetary Base Y/Y Oct | -6.90% | -2.00% | -3.30% | |
| 23:50 | JPY | BoJ Minutes | ||||
| 00:01 | GBP | BRC Shop Price Index Y/Y Sep | 6.60% | 5.50% | 5.70% | |
| 00:30 | AUD | Building Permits M/M Sep | -5.80% | -9.00% | 28.10% | 23.10% |
| 07:00 | EUR | Germany Trade Balance (EUR) Sep | 0.5B | 1.2B | ||
| 08:45 | EUR | Italy Manufacturing PMI Oct | 46.9 | 48.3 | ||
| 08:50 | EUR | France Manufacturing PMI Oct F | 47.4 | 47.4 | ||
| 08:55 | EUR | Germany Unemployment Change Oct | 15K | 14K | ||
| 08:55 | EUR | Germany Manufacturing PMI Oct F | 45.7 | 45.7 | ||
| 09:00 | EUR | Eurozone Manufacturing PMI Oct | 46.6 | 46.6 | ||
| 12:15 | USD | ADP Employment Change Oct | 198K | 208K | ||
| 14:30 | USD | Crude Oil Inventories | -0.2M | 2.6M | ||
| 18:00 | USD | Fed Interest Rate Decision | 4.00% | 3.25% | ||
| 18:30 | USD | FOMC Press Conference |
Fed to hike 75bps, would Powell indicate slower tightening ahead?
Fed is widely expected to raise interest rate by 75bps again today, to 3.75-4.00%. The main question is whether Chair Jerome Powell would signal that tightening pace is going to slow afterwards.
Currently, there are some expectations that Fed would opt for a smaller hike of 50bps in December, then a 25bps hike in February, and probably another 25bps in March, and pause from there.
However, such hope was somewhat dashed as job data released yesterday showed that the job market could have tightened further. Job openings surged to 10.7m in September, rather than a fall to 9.8m. Ratio of openings to unemployed persons also climbed from 1.7 to 1.9. ISM manufacturing employment also improved.
Overall, there could be some negative market reactions if Powell doesn't deliver any firm message of a pivot.
Here are some suggested readings on Fed:
- FOMC Meeting Preview: Fed Expected to Hike 75bps, But is the Pivot Imminent?
- Will the Fed Confirm Hopes of Slower Tightening?
- Fed Preview: Too Early for a Pivot
- Powell and NFP Release Will Crash USD
- November Flashlight for the FOMC Blackout Period: Our Expectations Ahead of the November 2nd FOMC Meeting
NZ unemployment rate unchanged at 3.3%, record hourly earning growth
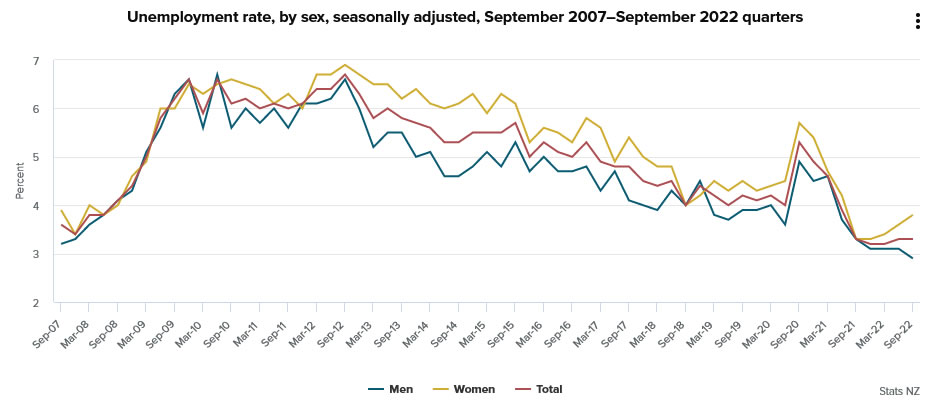
New Zealand employment grew 1.3% in Q3, above expectation of 0.5%. Unemployment rate was unchanged at 3.3%, above expectation of 3.2%. Labor force participation rate rose 0.8% to 71.7%. Underutilization rate dropped -0.2 to 9.0%.
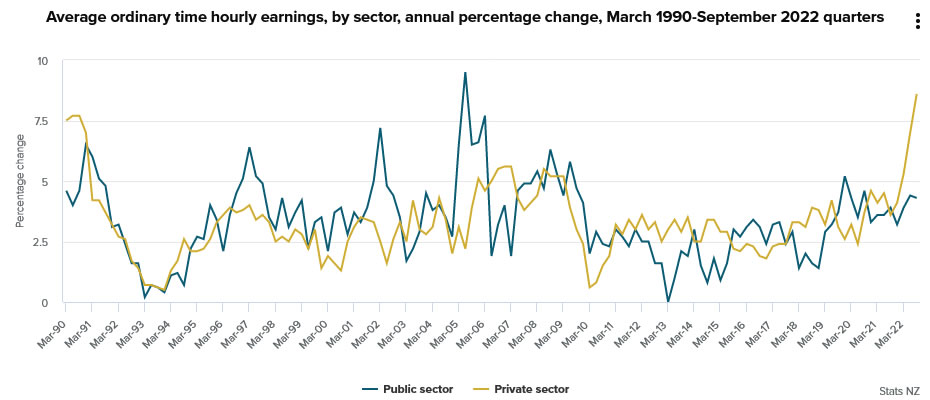
Average ordinary time hourly earnings rose 2.4% qoq, 7.4% yoy. The annual rise was the highest since the series began in 1989. All salary and wage rates (including overtime) index rose 3.7% yoy, second highest annual rate since record began in 1993.
Australia AiG manufacturing fell to 49.6, longstanding supply-side problems continue
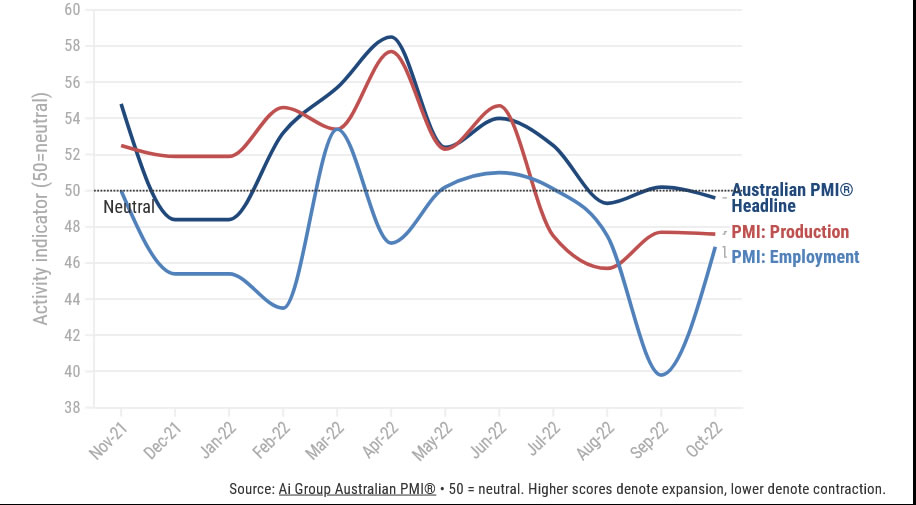
Australia AiG Performance of Manufacturing Index dropped -0.6 to 49.6 in October. Looking at some details, production dropped -0.1 to 47.6. Employment rose 7.1 to 46.9. New orders dropped -4.0 to 53.8. sales dropped -3.0 to 48.4. Input prices dropped -6.8 to 78.0. Selling prices dropped -2.7 to 67.5. Average wages dropped -5.1 to 71.0.
Innes Willox, Chief Executive of Ai Group said: "Australian manufacturing is in a holding pattern, with three straight months of flat results. Demand conditions in the market remain stable, but longstanding supply-side problems, such as labour and supply chain shortages, continue to drag on the industry."
Japan Suzuki concerned about gradual weakening of Yen
Japan Finance Minister Shunichi Suzuki told the parliament, "I am very concerned about the gradual weakening of the yen", which could accelerate inflation by increasing import costs.
BoJ Governor Haruhiko Kuroda also said, recent Yen weakness raises uncertainty on the outlook, and is negative for the economy.
Regarding monetary policy, Kuroda said, "If the achievement of our 2% inflation target comes into sight, making yield curve control more flexible could become an option." But for now, he added that the central bank must maintain ultra-low loose monetary policy to support the economy.
BoC Macklem: We are getting closer, but we are not there yet
BoC Governor Tiff Macklem said in a speech that the central bank is trying to "balance the risks of under- and over-tightening." "The tightening phase will draw to a close," he added. "We are getting closer, but we are not there yet."
BoC is still "far from that goal" of ensuring "low, stable and predictable" inflation. "With inflation so far above our target, we are particularly concerned about the upside risks," he added.
Macklem also said, "We expect growth will stall in the next few quarters—in other words, growth will be close to zero. But once we get through this slowdown, growth will pick up, our economy will grow solidly, and the benefits of low and predictable inflation will be restored."
Crude Oil Price Eyes Fresh Increase, Fed Decision Next
Key Highlights
- Crude oil price started a fresh increase above the $86.50 and $87.20 resistance levels.
- A major bullish trend line is forming with support near $85.60 on the 4-hours chart.
- Gold price might gain pace if it clears the $1,660 resistance zone.
- Today, the Fed could increase interest rates from 3.25% to 4.0%.
Crude Oil Price Technical Analysis
Crude oil price started a fresh increase from the $82.20 zone against the US Dollar. The price gained pace for a move above the $85.00 resistance level.
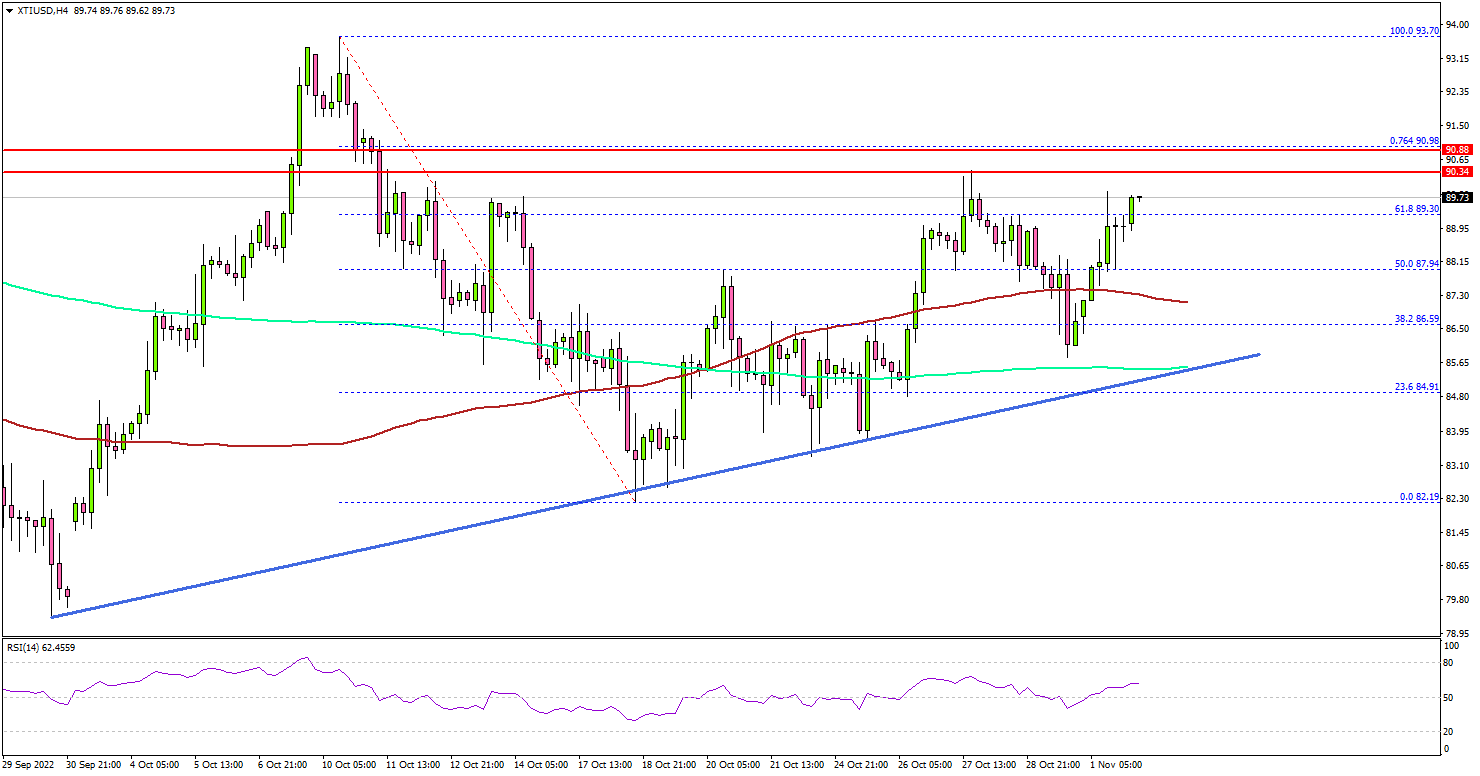
Looking at the 4-hours chart of XTI/USD, there was a break above the $86.50 resistance zone. The price even settled above the $87.20 level, the 100 simple moving average (red, 4-hours), and the 200 simple moving average (green, 4-hours).
The bulls pushed the price above the 61.8% Fib retracement level of the downward move from the $93.70 swing high to $82.19 low.
On the upside, the price might face sellers near the $90.40 zone. The next major resistance is near $91.00, above which the price could accelerate higher towards the $95.00 zone.
If not, there might be a fresh decline below the $87.50 support zone. On the downside, there is a key support forming near the $85.00 zone. There is also a major bullish trend line forming with support near $85.60 on the same chart.
The next major support is near $84.00 zone. Any more losses might call for a test of the $82.20 support zone in the coming days.
Looking at gold price, there was a recovery wave above the $1,640 level, but it must clear $1,660 to set the pace for a steady increase.
Economic Releases to Watch Today
- Germany’s Manufacturing PMI for Oct 2022 - Forecast 45.7, versus 45.7 previous.
- Euro Zone Manufacturing PMI for Oct 2022 – Forecast 46.6, versus 46.6 previous.
- US ADP Employment Change for Oct 2022 - Forecast 193K, versus 208K previous.
- Fed Interest Rate Decision - Forecast 4.0%, versus 3.25% previous.
Gold: Forecasting The Next Move After 5 Waves Decline
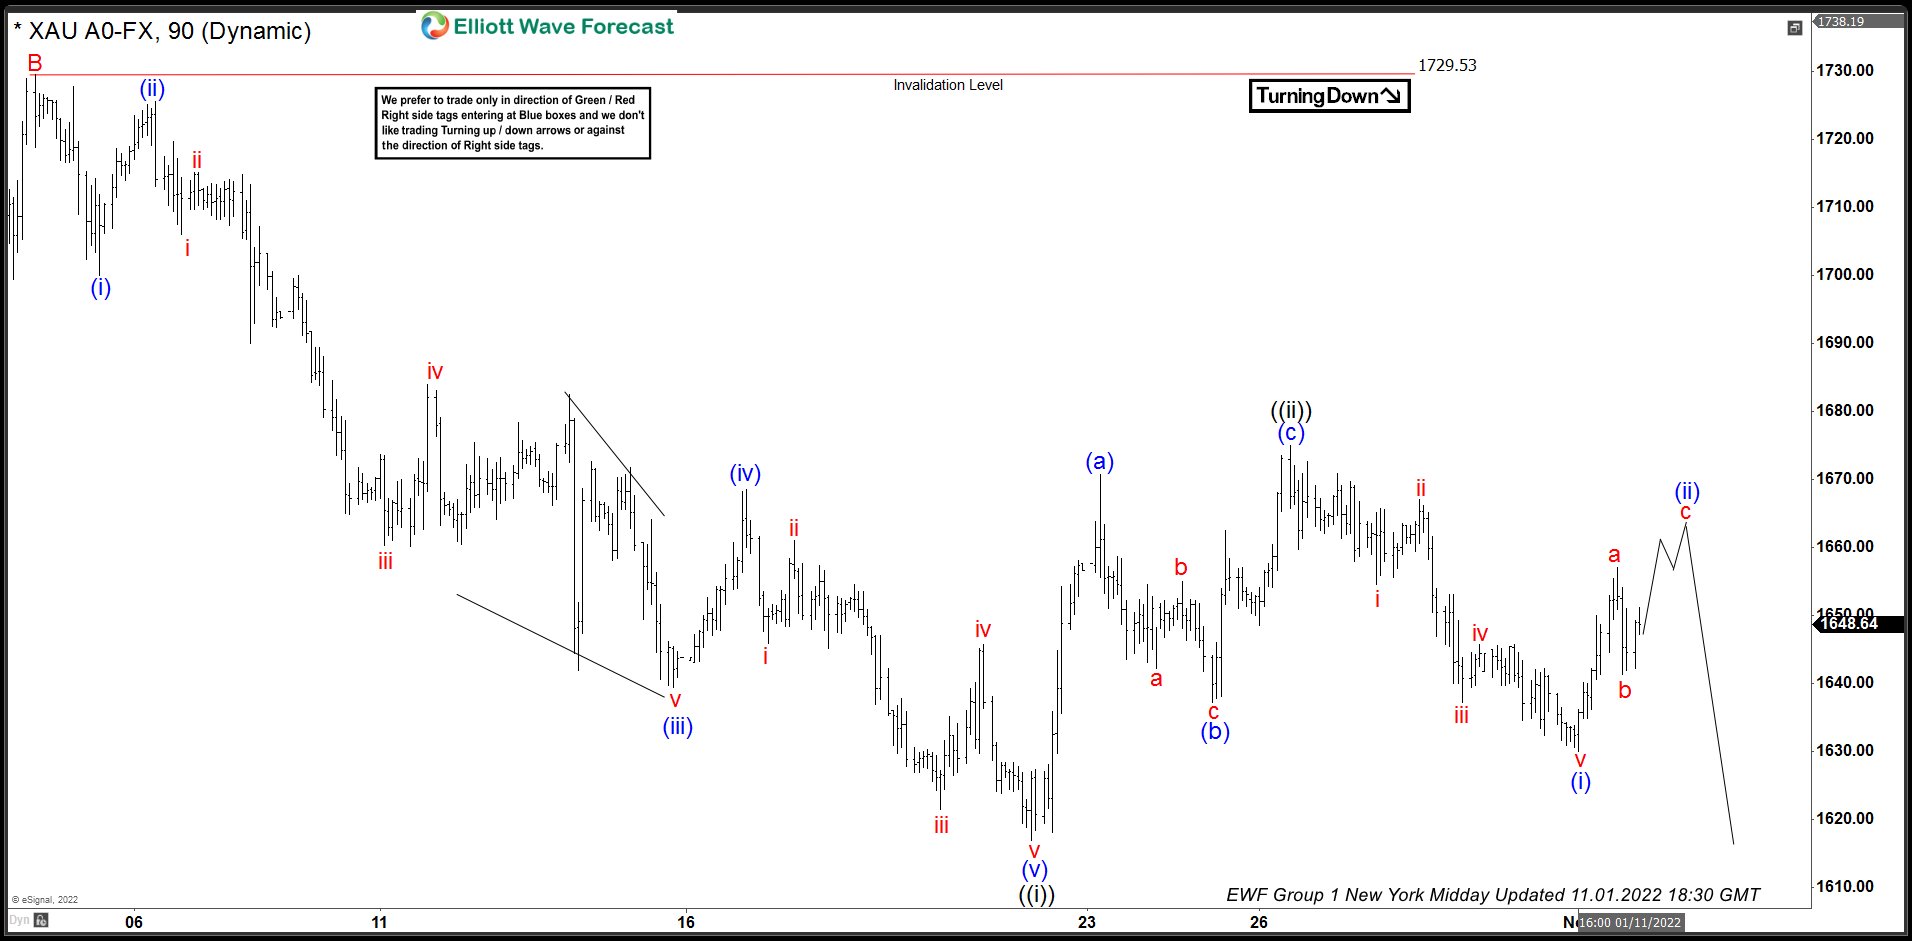
In this technical blog we’re going to take a look at some Elliott wave charts of yellow metal (Gold) published in members area of the website. Gold formed a high on October 4, 2022 (1729.46) and started declining. Decline took the form of an impulse, we will explain the internals of this impulsive decline, the bounce which we expected and current forecast.
Gold: 21, October 2022: 1 Hour Elliott Wave Analysis
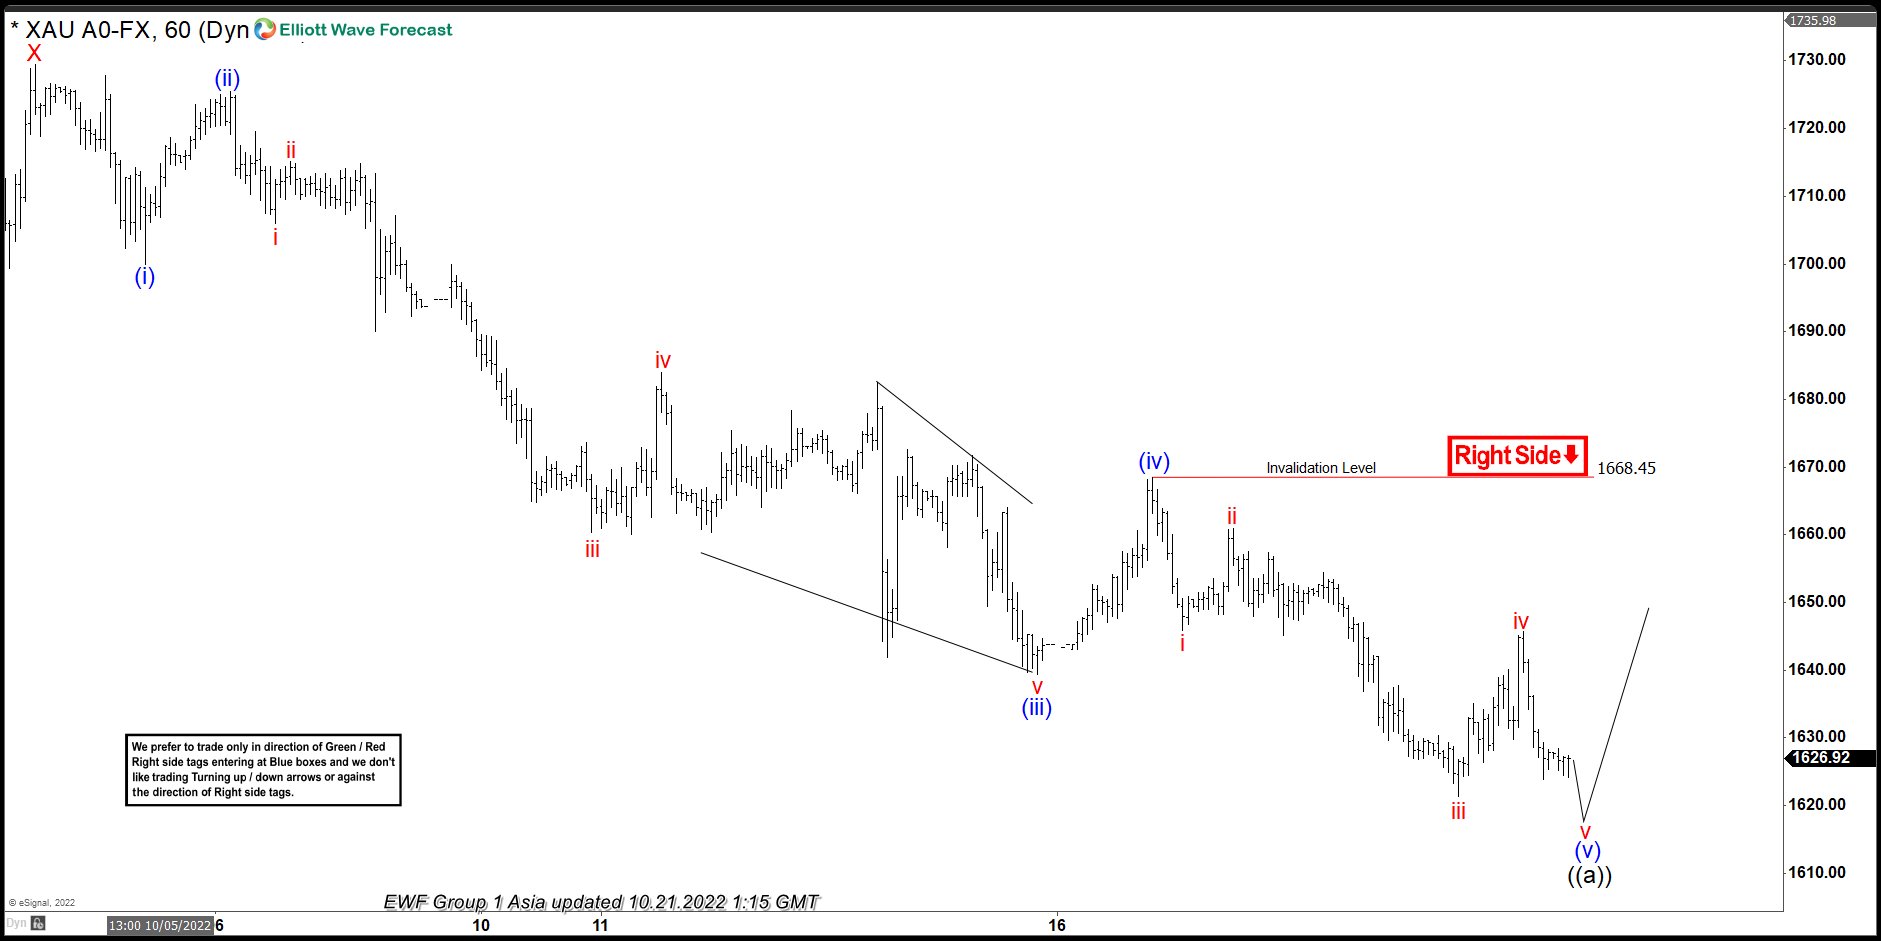
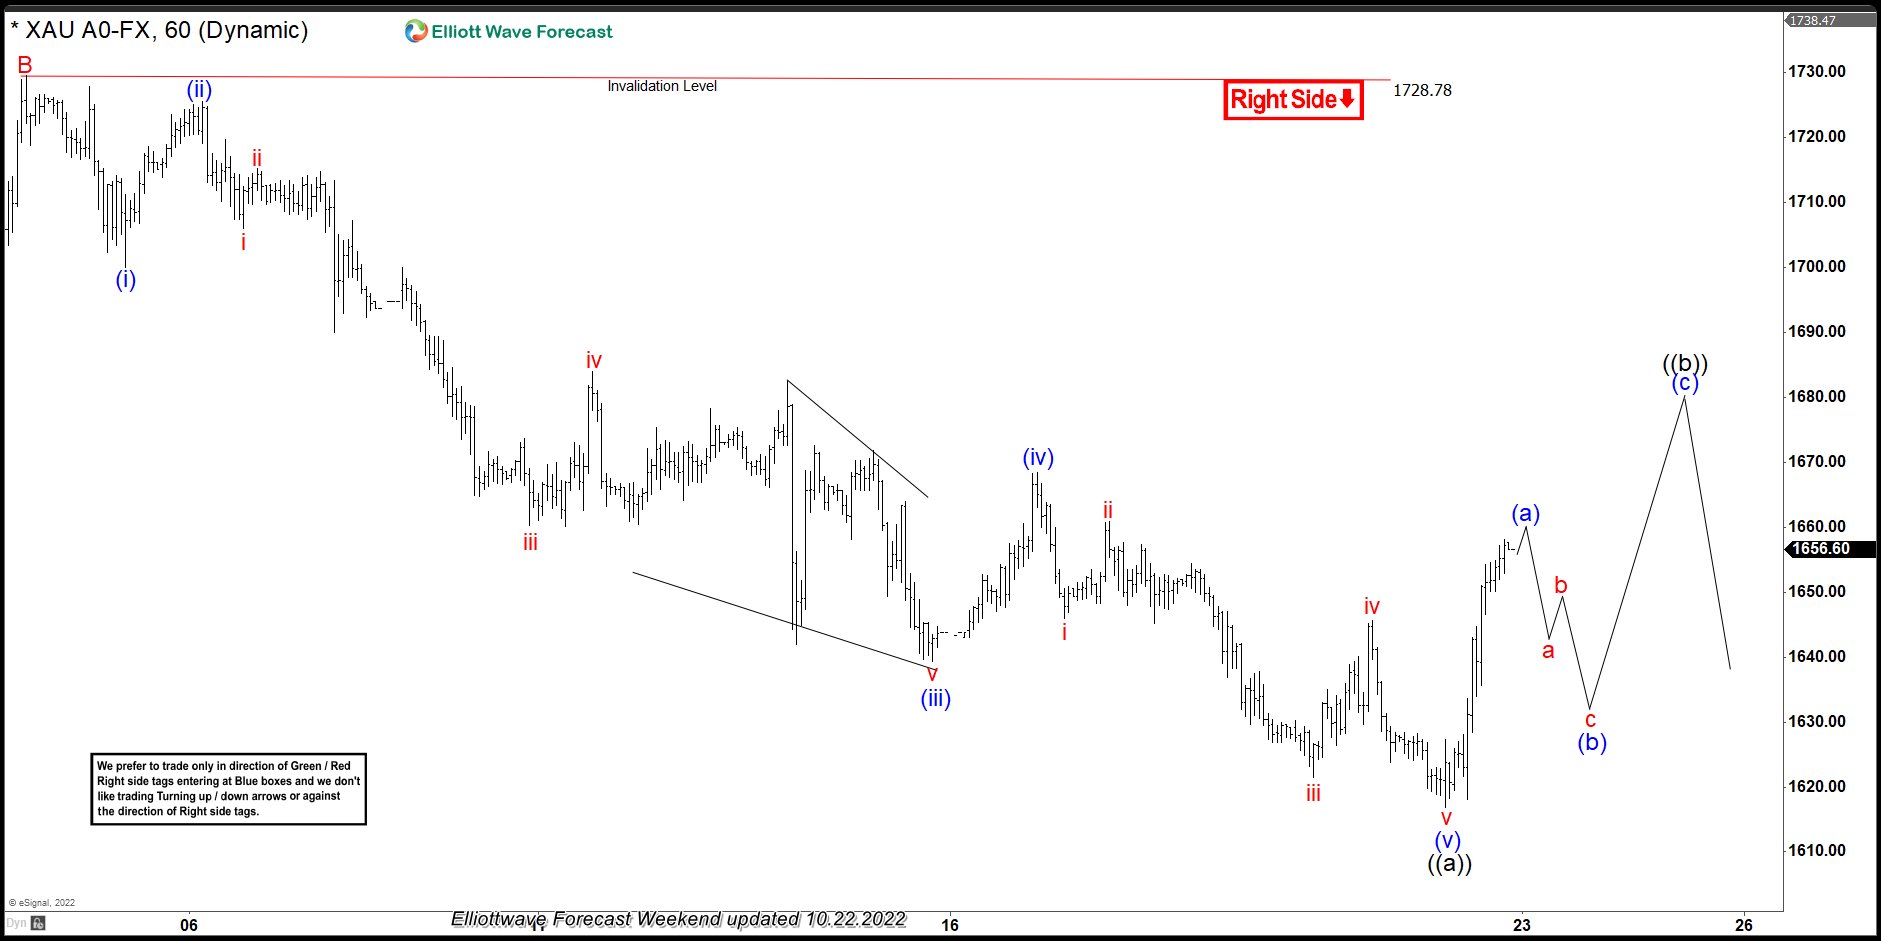
In the chart below we can see Gold is an impulsive 5 waves decline from October 4, 2022 (1729.46) high. Wave (i) ended at $1700, wave (ii) ended at $1725.55, wave i of (iii) ended at $1706, wave ii of (iii) ended at $1715.16, strongest part of the impulse i.e. wave iii of (iii) ended at $1660.30, wave iv of (iii) ended at $1683.94, wave v of (iii) took the form of an Ending Diagonal and ended at $1639.30, wave (iv) ended at $1668.42. We can already see 3 swings down from blue (iv) peak so expecting another low to complete wave (v) and cycle from October 4, 2022 peak before a bounce.
Gold: 22 October, 2022: 1 Hour Elliott Wave Analysis
As per Elliott Wave Theory, after a 5 waves decline, there should be a recovery in minimum 3 waves. In the chart below, we can see Gold made a new low to complete wave (v) at $1616.80 on October 21, 2022 and bounced strongly. First leg of the bounce is close to ending, after which we expect a pull back and one more leg higher to complete three waves bounce before the decline resumes.
Gold: 1 November, 2022: 1 Hour Elliott Wave Analysis
In the chart below, we can see yellow metal completed 3 waves bounce on October 26, 2022 at $1674.94 and has turned lower again. Since decline from October 4, 2022 peak was an impulse, forecast is for XAUUSD to resume the decline and make a new low below October 21, 2022 ($1616.80) low. Alternate view suggests it can hold the low at October 21 , 2022 for seven swings higher before the decline resumes but as far as October 4, 2022 high remains intact, forecast is for Gold to resume the decline and break below October 21, 2022 low.