

Sample Category Title
EUR/CHF Daily Outlook
Daily Pivots: (S1) 0.9682; (P) 0.9740; (R1) 0.9781; More....
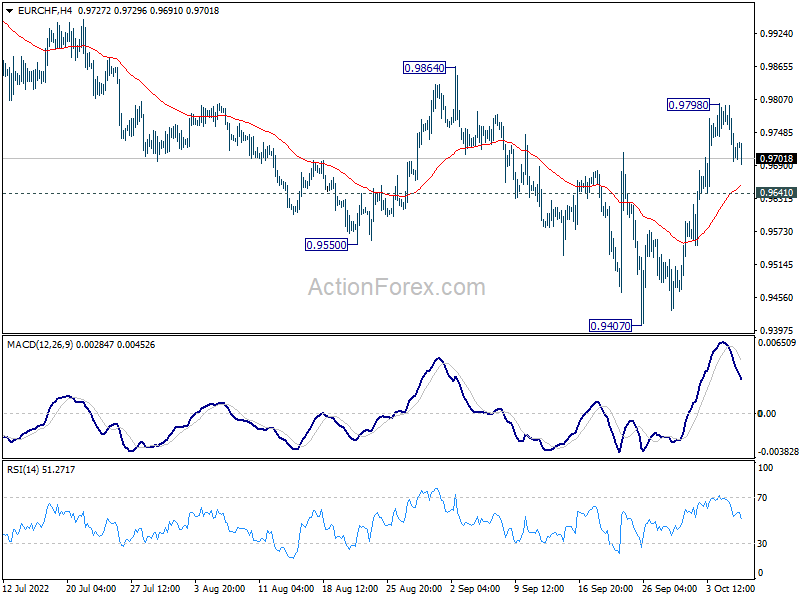
Intraday bias in EUR/CHF is turned neutral with current retreat. On the upside, above 0.9798 will resume the rebound to 0.9864 resistance. Firm break there will solidify the case of medium term bottoming at 0.9407, and target 38.2% retracement of 1.1149 to 0.9407 at 1.0072. On the downside, below 0.9641 minor support will turn bias back to the downside for retesting 0.9407 low.
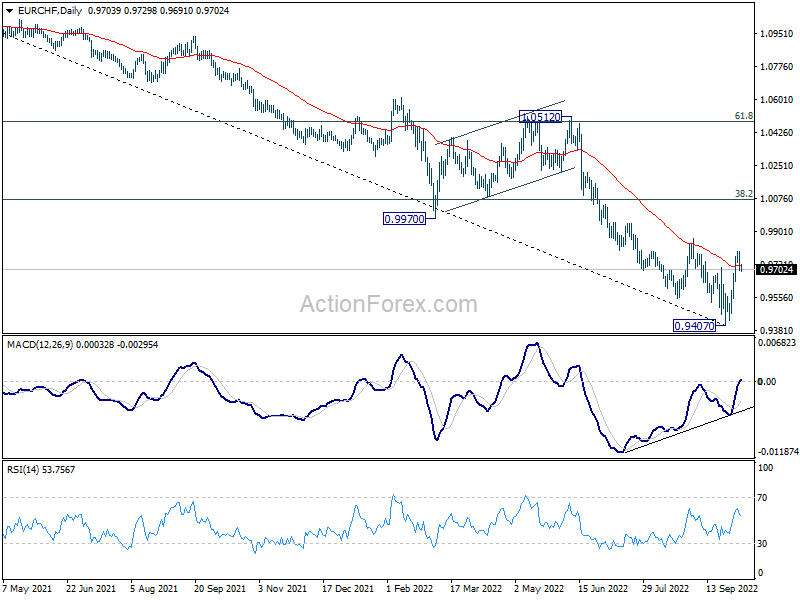
In the bigger picture, as long as 0.9864 resistance holds, long term down trend from 1.2004 (2008 high) is expected to continue. Next target is 138.2% projection of 1.2004 to 1.0505 to 1.1149 at 0.9033. However, firm break of 0.9864 will confirm medium term bottoming, on bullish convergence condition in daily MACD. Stronger rally would then be seen back to 55 week EMA (now at 1.0188), even as a corrective rebound.
USD/CAD Daily Outlook
Daily Pivots: (S1) 1.3518; (P) 1.3607; (R1) 1.3710; More...
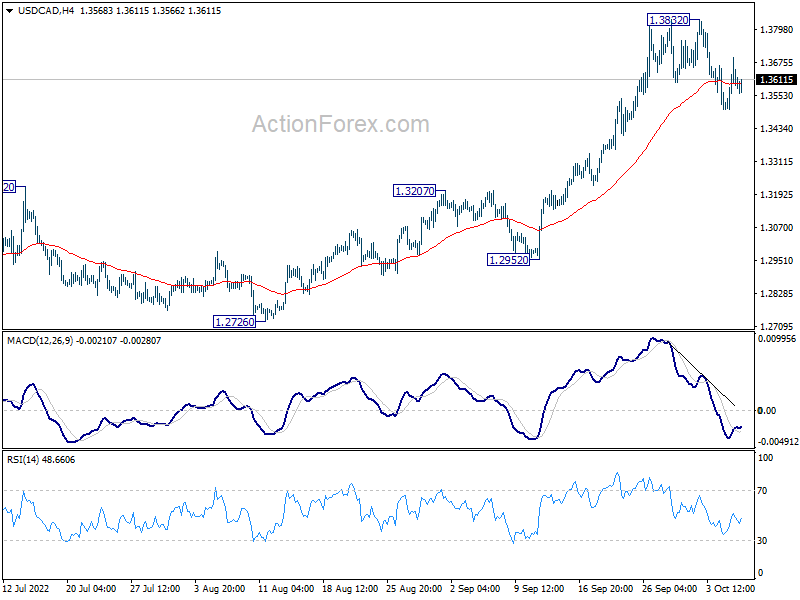
Intraday bias in USD/CAD is turned neutral with 4 hour MACD crossed above signal line. Correction from 1.3832 could extend lower. But downside should be contained above 1.3222 resistance turned support to bring rebound. On the upside, break of 1.3832 will resume larger up trend to 161.8% projection of 1.2005 to 1.2947 from 1.2401 at 1.3925.
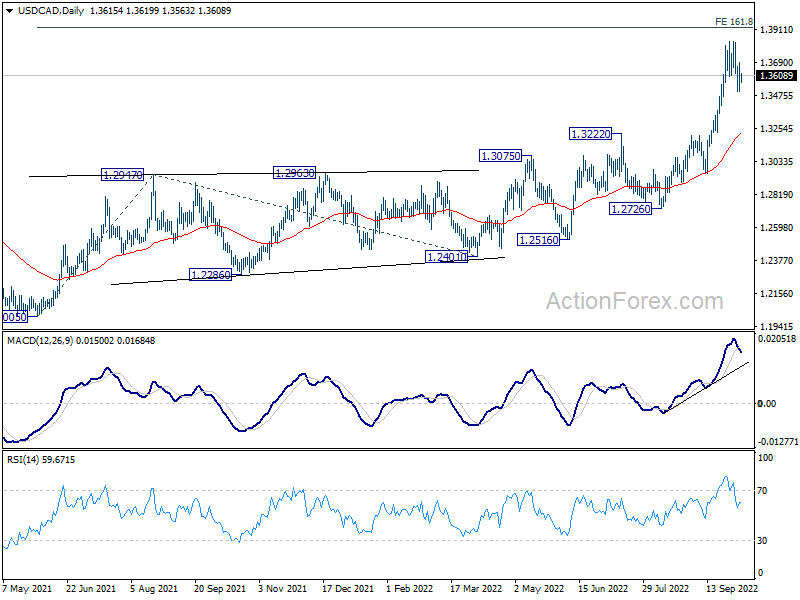
In the bigger picture, up trend from 1.2005 (2021 low) is still in progress. Based on current impulsive momentum, it could be resuming long term up trend from 0.9056 (2007 low). Whether it is or it isn't, retest of 1.4689 (2016 high) should be seen next. This will now remain the favored case as long as 1.3222 resistance turned support holds.
AUD/USD Daily Report
Daily Pivots: (S1) 0.6429; (P) 0.6478; (R1) 0.6538; More...
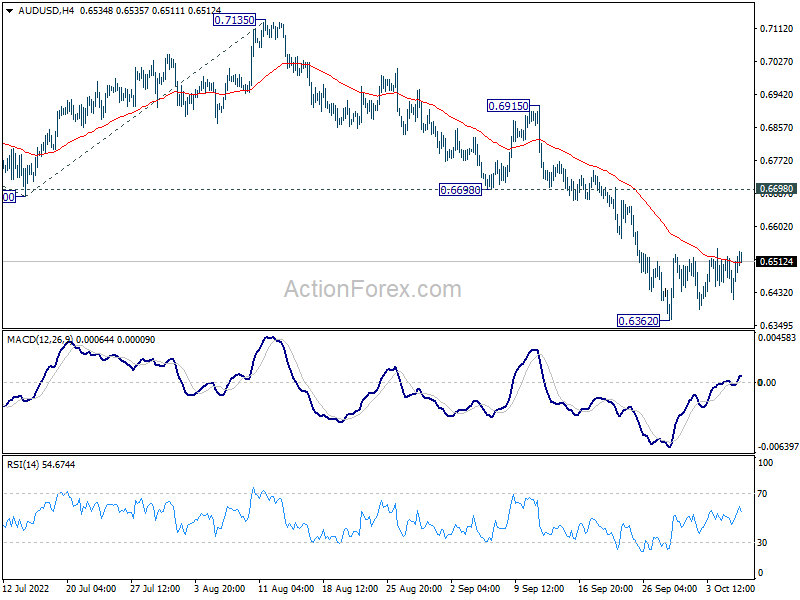
Intraday bias in AUD/USD remains neutral at this point. Consolidation from 0.6362 is extending and stronger recovery cannot be ruled out. But upside should be limited well below 0.6698 support turned resistance. Break of 0.6362 will resume larger down trend to 100% projection of 0.7660 to 0.6680 from 0.7135 at 0.6155.
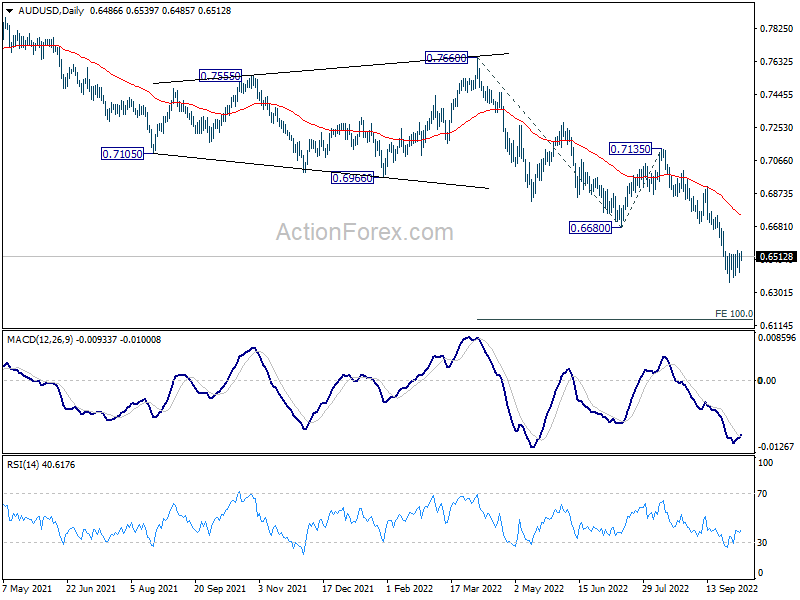
In the bigger picture, down trend form 0.8006 (2021 high) is expected to continue as long as 0.7135 resistance holds. With 61.8% retracement of 0.5506 (2020 low) to 0.8006 at 0.6461 firmly taken out, next target is 0.5506 low. Medium term momentum will now be closely monitored to gauge the chance of break of 0.5506.
USD/JPY Daily Outlook
Daily Pivots: (S1) 143.86; (P) 144.36; (R1) 145.18; More...
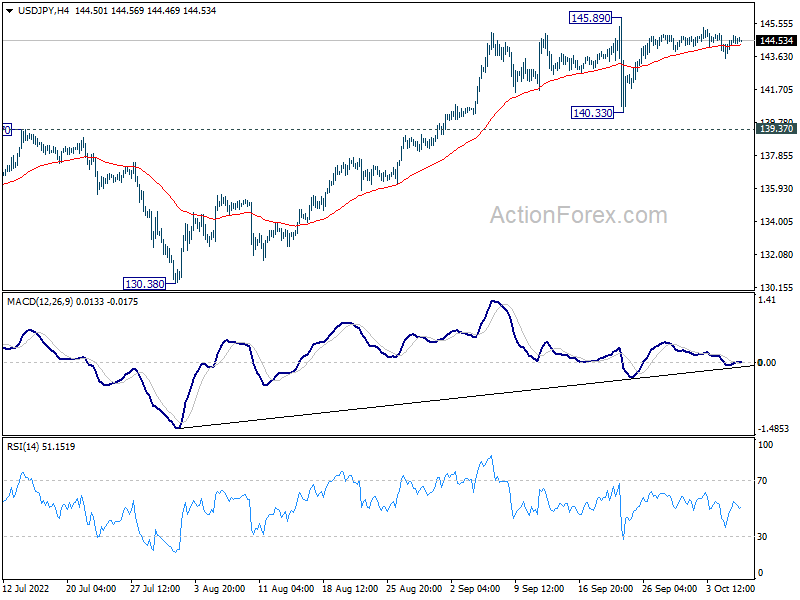
Intraday bias in USD/JPY remains neutral as consolidation from 145.89 is still in progress. Further rally is expected as long as 139.37 resistance turned support holds. Break of 145.89 will target 147.68 long term resistance. On the downside, however, decisive break of 139.37 will confirm short term topping. Deeper decline would be seen back towards 130.38 support.
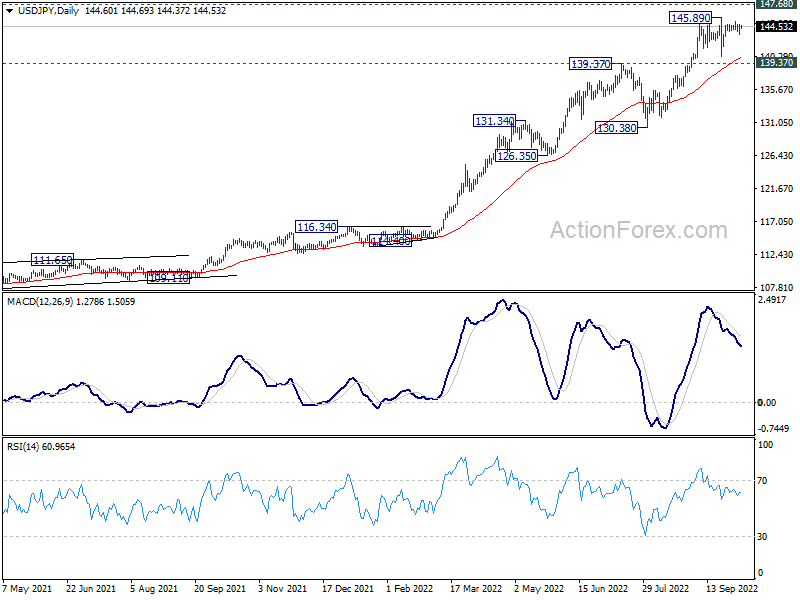
In the bigger picture, up trend from 101.18 is still in progress, as part of the whole up trend from 75.56 (2011 low). Further rise should be seen to 147.68 (1998 high). For now, break of 130.38 support is needed to be the first indication of medium term topping. Otherwise, outlook will stay bullish even in case of deep pull back.
USD/CHF Daily Outlook
Daily Pivots: (S1) 0.9784; (P) 0.9836; (R1) 0.9888; More...
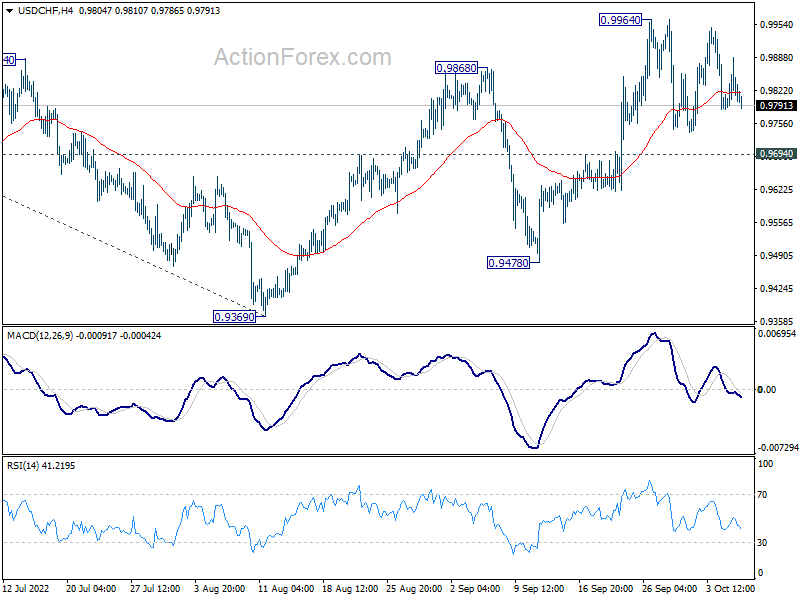
Intraday bias in USD/CHF remains neutral as consolidation from 0.9964 is extending. Outlook is unchanged that further rally is in favor as long as 0.9694 support holds. On the upside, above 0.9964 will resume the rally from 0.9369 to retest 1.0063 high. On the downside, however, break of 0.9694 support will extend the corrective pattern from 1.0063 with another falling leg, towards 0.9478 support first.
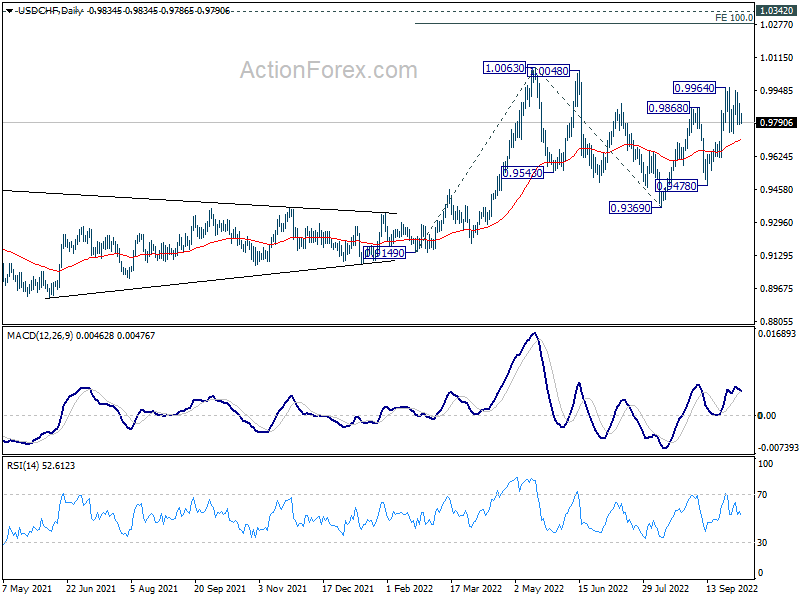
In the bigger picture, current development suggests that up trend from 0.8756 (2021 low) is still in progress. Sustained break of 1.0063 will target 100% projection of 0.9149 to 1.0063 from 0.9369 at 1.0283, and then 1.0342 (2016 high). For now, this will remain the favored case as long as 0.9369 support holds, even in case of deep pull back.
EUR/USD Daily Outlook
Daily Pivots: (S1) 0.9816; (P) 0.9906; (R1) 0.9976; More...
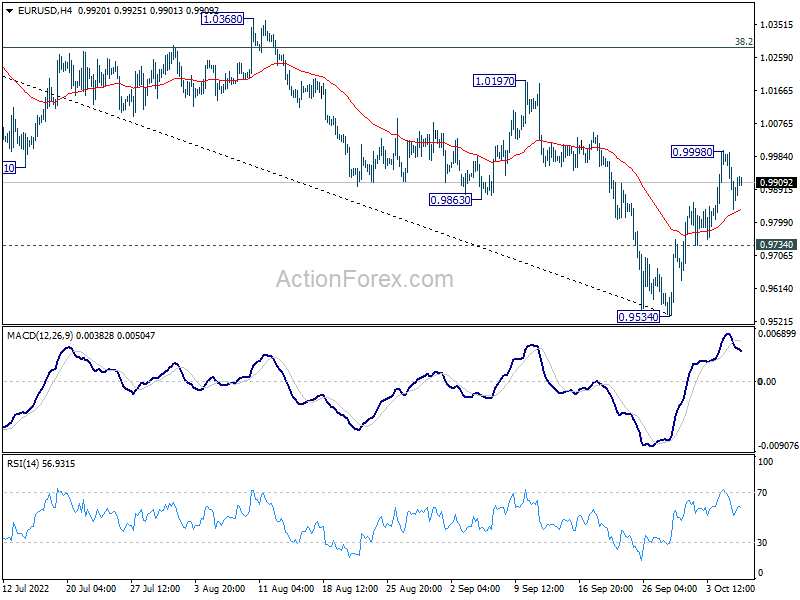
Intraday bias in EUR/USD remains neutral for the moment. On the downside, break of 0.9734 minor support will suggest rejection by 55 day EMA, and medium term falling channel. Bias will be turned back to the downside for retesting 0.9534 low and then resume down trend. Nevertheless, considering bullish convergence condition in daily MACD, sustained break of 55 day EMA (now at 1.0019) will raise the chance of medium term bottoming at 0.9534. Further rally should then be seen to 38.2% retracement of 1.1494 to 0.9534 at 1.0283.
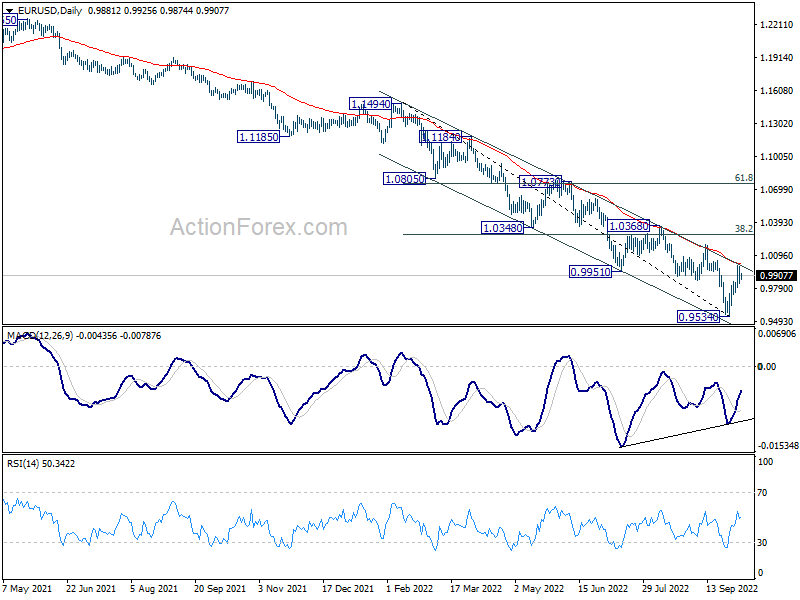
In the bigger picture, down trend from 1.6039 (2008 high) is still in progress. Next target is 100% projection of 1.3993 to 1.0339 from 1.2348 at 0.8694. In any case, break of 1.0197 resistance is needed to be the first sign of medium term bottoming. Otherwise, outlook will stay bearish even with strong rebound.
Technical Outlook and Review
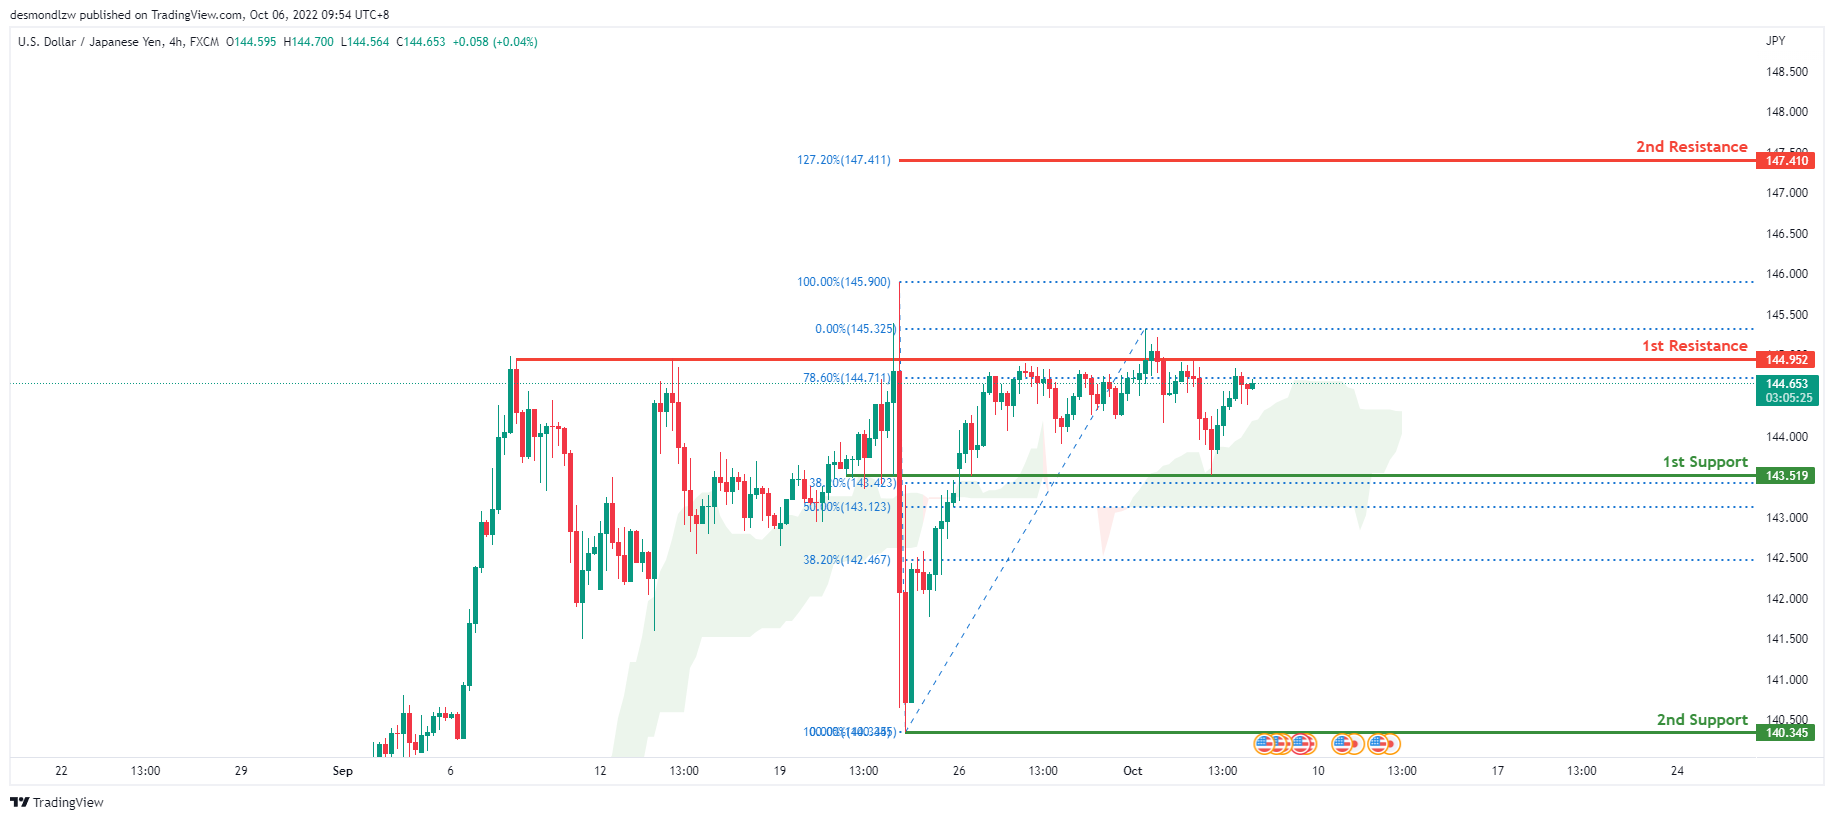
USD/JPY:
USDJPY is in a bullish trend on the H4 chart. To add to the confluence, the price is also above the ichimoku cloud, indicating that the market is bullish. Price reflected off the first support at 143.519, where the 38.2% Fibonacci line is located, overnight. Price is expected to move towards the first resistance level at 144.952, where the key 145 level is located.
Areas of consideration:
- H4 time frame, 1st resistance at 144.952
- H4 time frame, 1st support at 143.474
DXY:
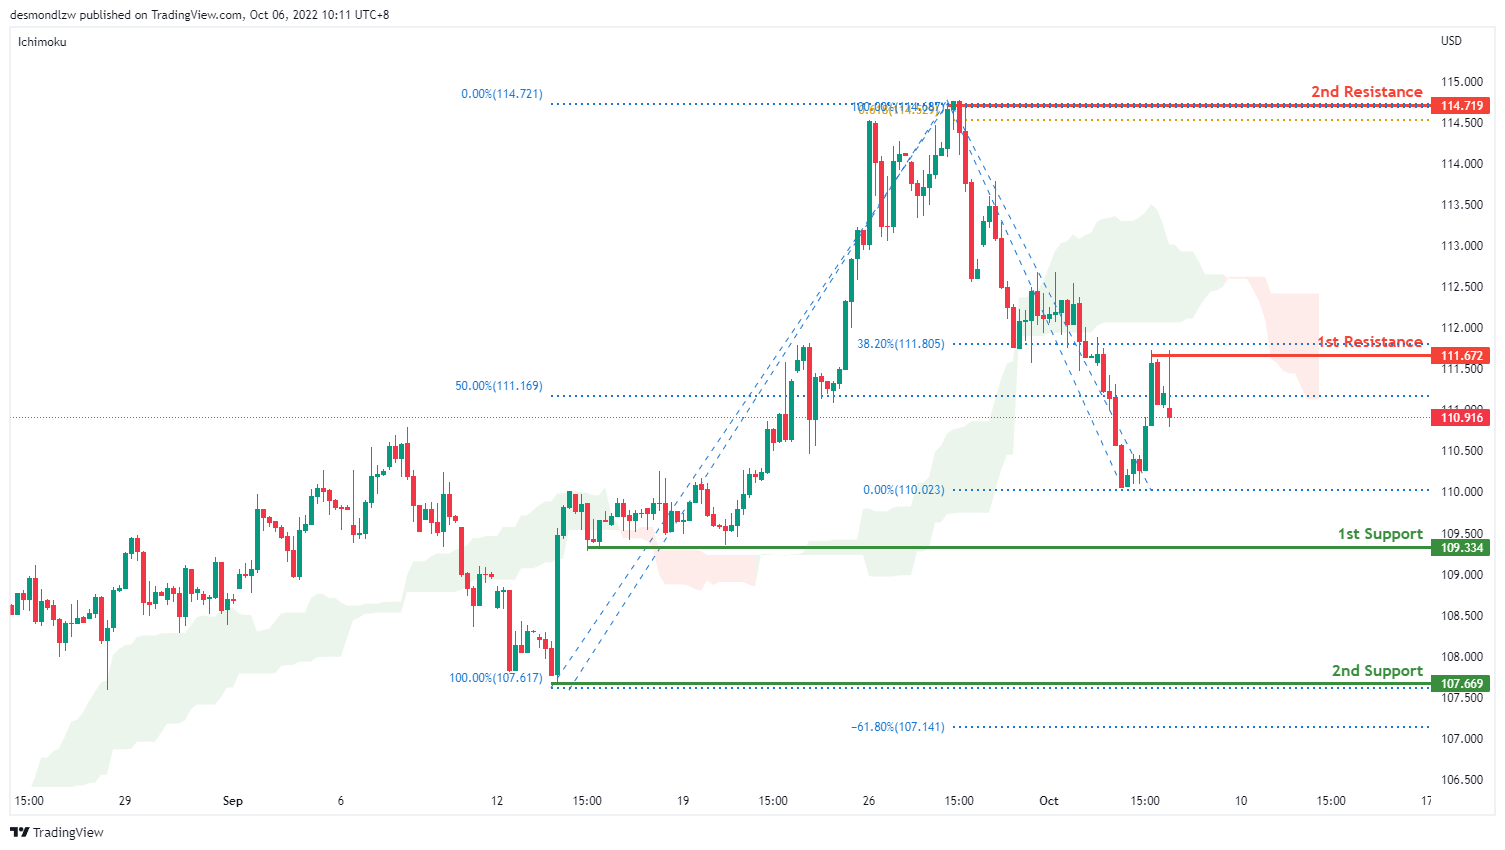
On the H4, price has broken lower from the ichimoku cloud and is moving in a descending manner hence we are bearish bias. It has broken the resistance and is moving toward the first support at 109.334 where my swing low sits. If bearish momentum continues, it will bring price to my second support at 107.669 where my second support and previous swing low sits. Alternatively price could bounce back to test the first resistance at 111.672 where my 38.2% retracement sits then the second resistance at 114.719 where the 61.8% projection and previous swing high sits
Areas of consideration:
- H4 time frame, 1st resistance at 111.672
- H4 time frame, 1st support at 109.334
EUR/USD:
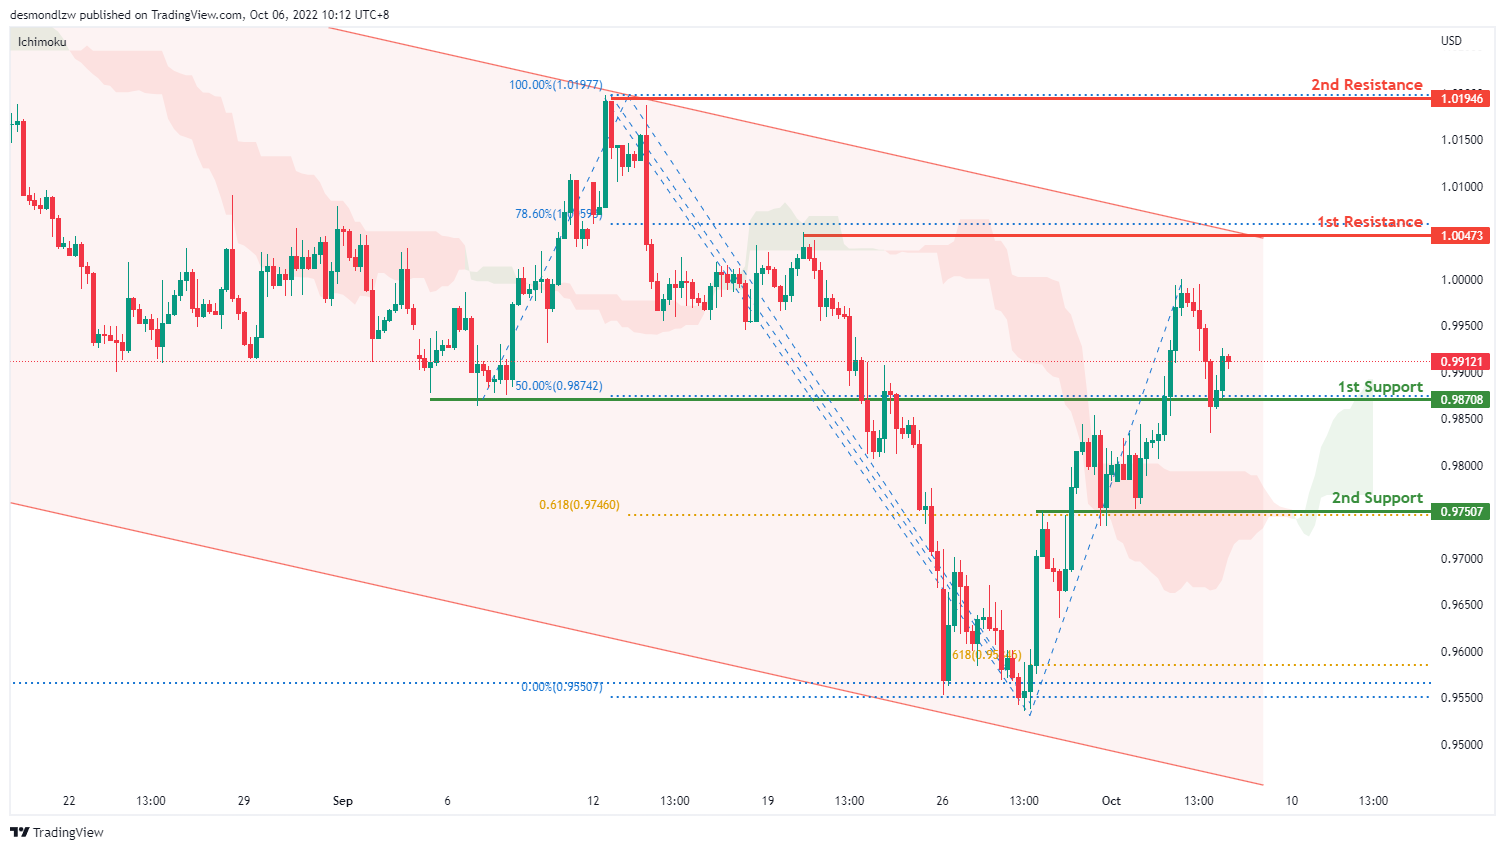
On the H4, price is moving within the descending trendline but in an ascending manner, with the price above ichimoku cloud- we are slightly bullish biased. Price has bounced off the first support and is moving toward the first resistance at 1.00473 where the 78.6% projection sits. If price breaks this level, it will test the second resistance at 1.0194, where the previous swing high sits. Alternatively, the overall bearish momentum could bring price back to test the first support at 0.9870 where the previous swing low and 50% retracement sits. If it breaks this level, we have a strong bearish confirmation to bring price down to 0.9750 where the swing low and 61.8% projection sits
Areas of consideration :
- H4 1st resistance at 1.0047
- H4 1st support at 0.9907
GBP/USD:
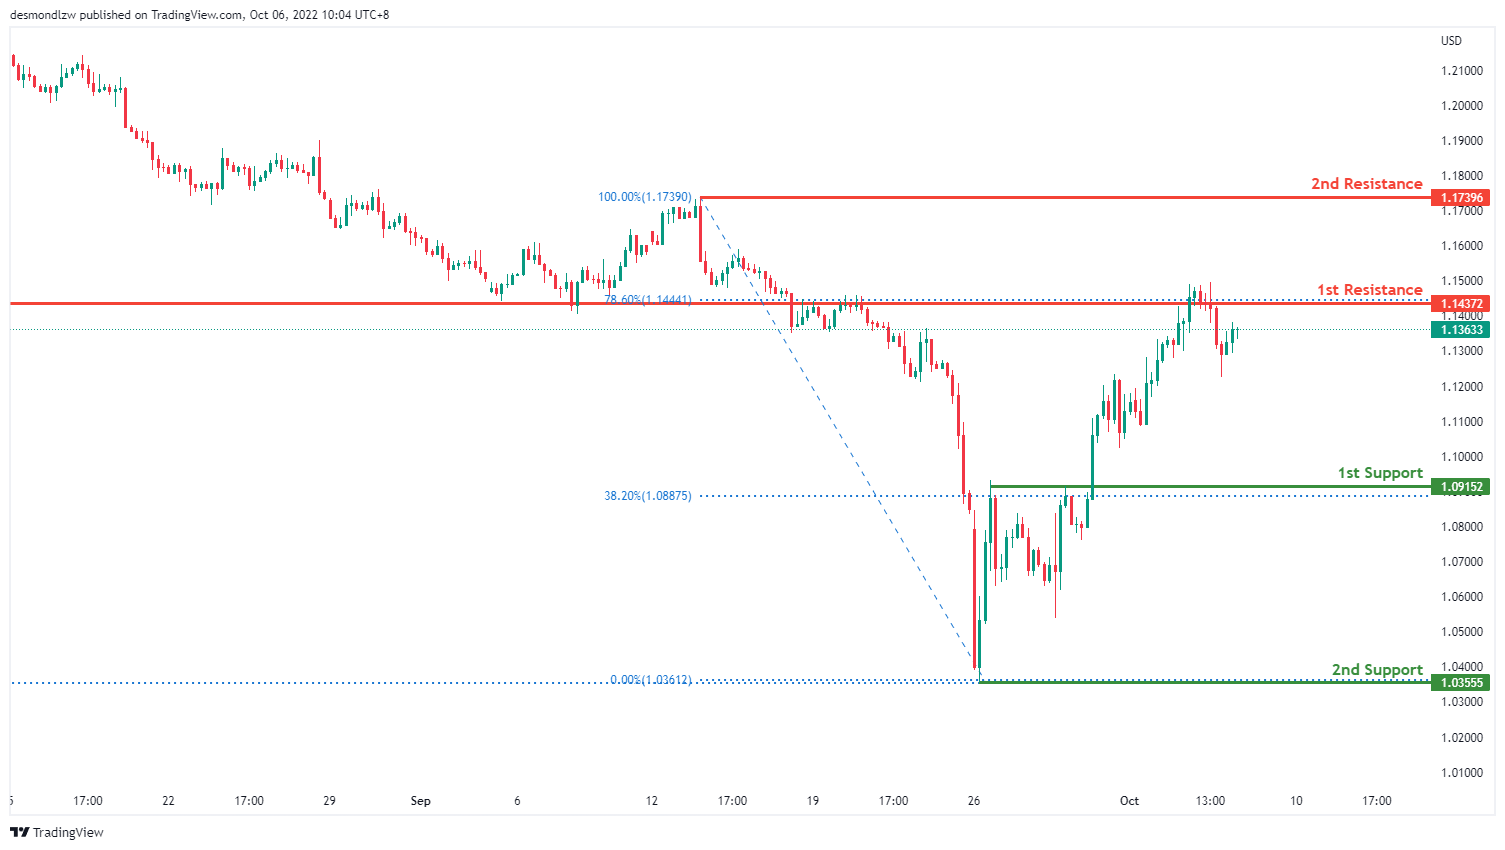
On the H4 time frame, prices have bounced off the support level and are moving in an ascending manner, we are slightly bullish. Price is moving toward the first resistance at 1.1443, where the 78.6% retracement and overlap resistance sits. If it breaks this level, its bullish momentum will bring price to second resistance at 1.1739 where the previous swing high sits. Alternatively, price could pull back to test the first support at 1.0915, where the 38.2% retracement sits then the second support at 1.0355 where the 138.2% extension sits
Areas of consideration:
- H4 1st resistance at 1.1443
- H4 1st support at 1.10915
USD/CHF:
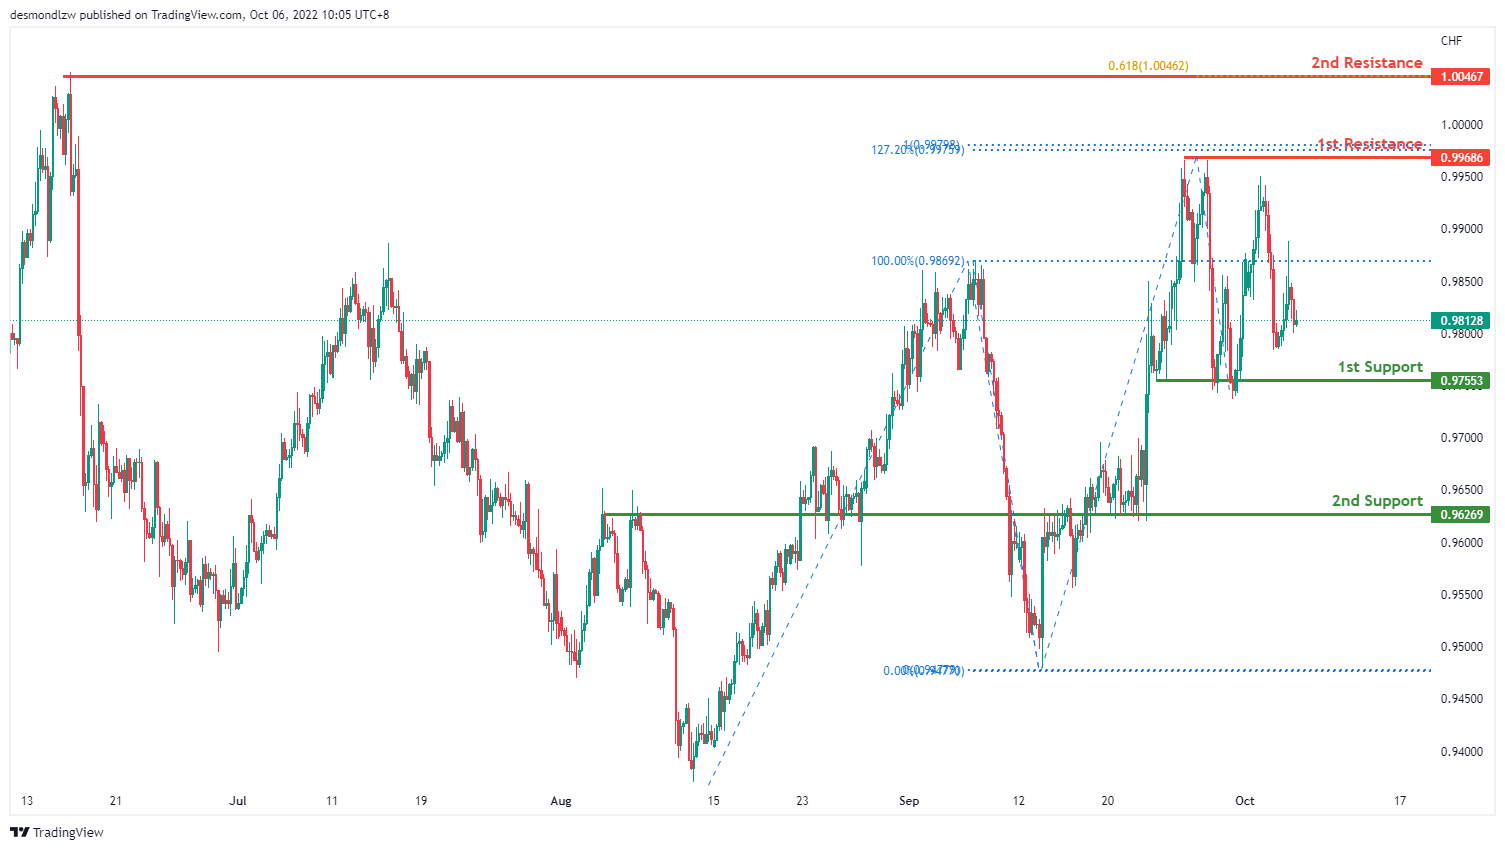
On the H4 chart, price has rejected the resistance level and is moving in a descending manner hence we are bearish bias- prices are moving toward the first support at 0.9755 where the previous swing low sits. If bearish momentum continues, it will bring price down to the second support at 0.9626 where the overlap support sits. Alternatively, price could bounce back to test the first resistance at 0.9968 where the 127.2% extension and 100% projection sits then to test the second resistance at 1.0046
Areas of consideration
- H4 1st support at 0.9755
- H4 1st resistance at 0.9968
XAU/USD (GOLD):
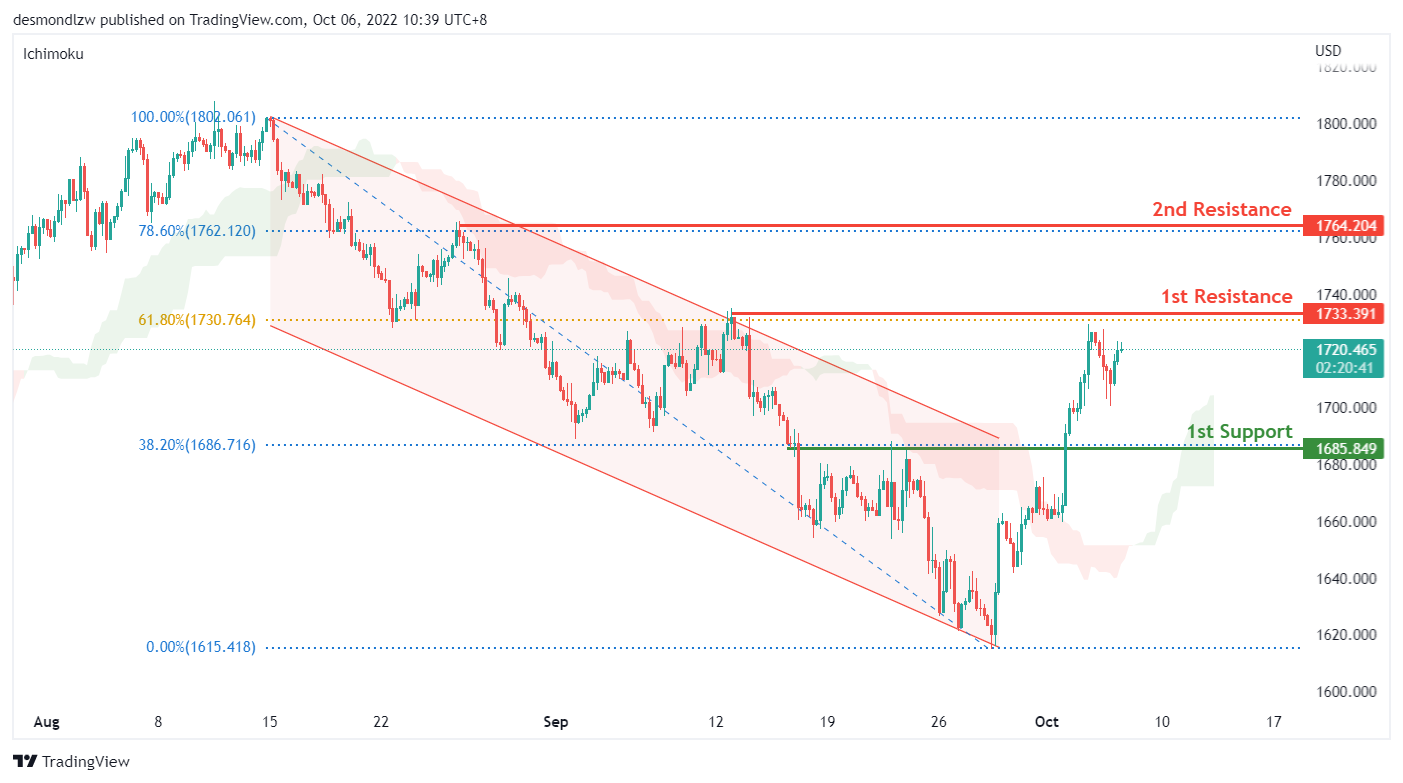
On the H4, price continues to trade higher above the ichimoku cloud as it approaches the 1st resistance of 1733 which is the previous swing high from 12 September 2022 and the 61.80% fibonacci retracement level. We continue to have a bullish bias that price could trade higher to the 2nd resistance of 1764 which is in line with the 78.60% fibonacci retracement level and previous swing high from end August 2022.
Areas of consideration:
- H4 time frame, 1st resistance at 1733.39
- H4 time frame, 1st support at 1685
- H4 time frame, 2nd resistance at 1764
AUD/USD:
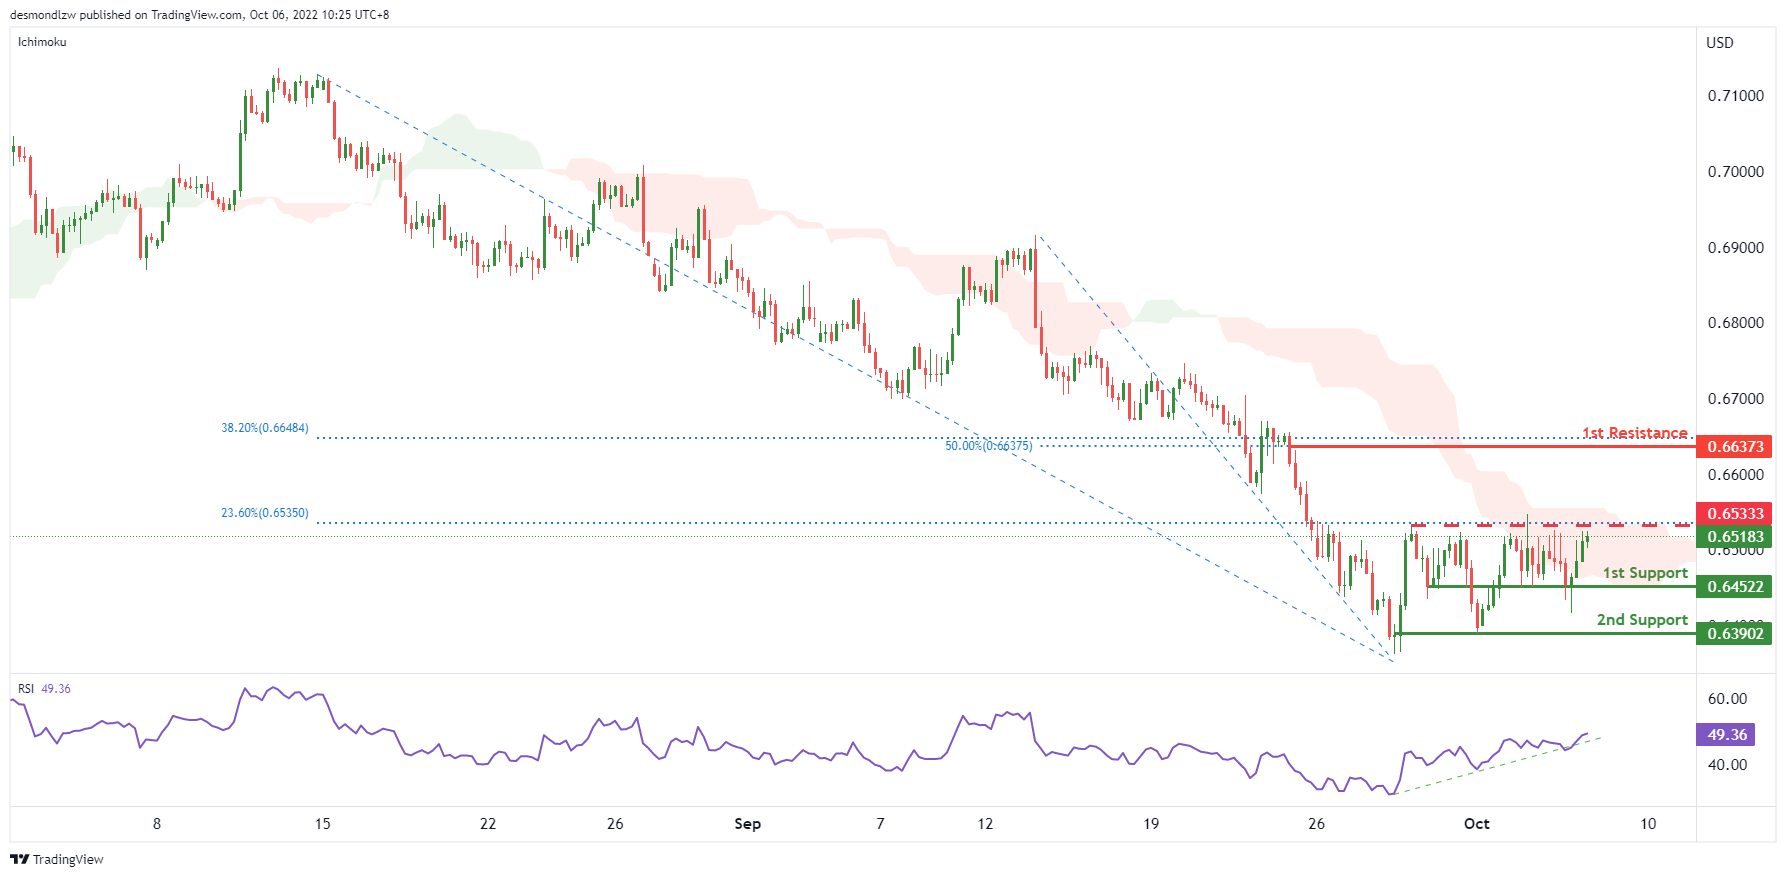
On the H4, with the price testing the resistance at 0.65333, where the 23.6% fibonacci retracement sits, and crossing ichimoku cloud, if the price can break the current resistance successfully, we can expect the price rise to the 1st resistance at 0.66373, which is in line with the 50% and 38.2% fibonacci retracement. Alternatively, the price may drop back to the 1st support at 0.645225, which is in line with the overlap support, if the 1st support is broken, the 2nd support could be at 0.63902, where the swing low is.
Areas of consideration
- H4, intermediate resistance at 0.65333
- H4, 1st resistance at 0.66373
NZD/USD:
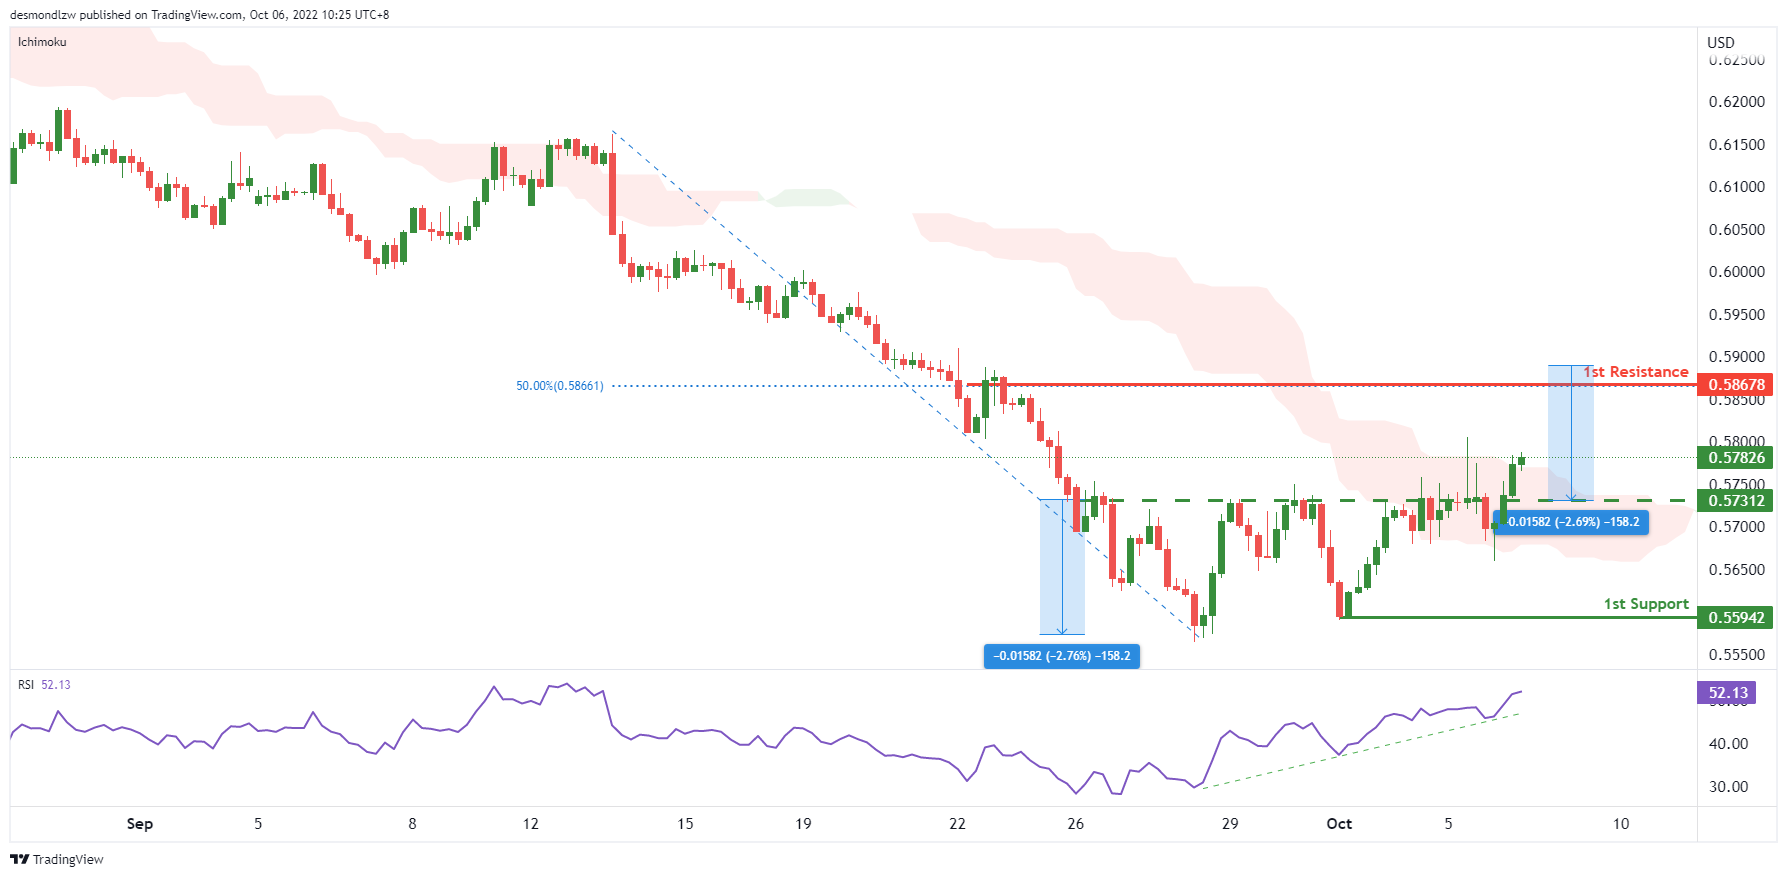
On the H4, with the price crossing the ichimoku cloud and crossing the neckline of double bottom pattern, we have a bullish bias that the price may rise to the 1st resistance at 0.58678, which is in line with the 50% fibonacci retracement and the target price of double bottom pattern. Alternatively, the price may drop to the 1st support at 0.55942, where the previous swing low is.
Areas of consideration:
- H4 time frame, current price
- H4 time frame, 1st resistance at 0.58678
USD/CAD:
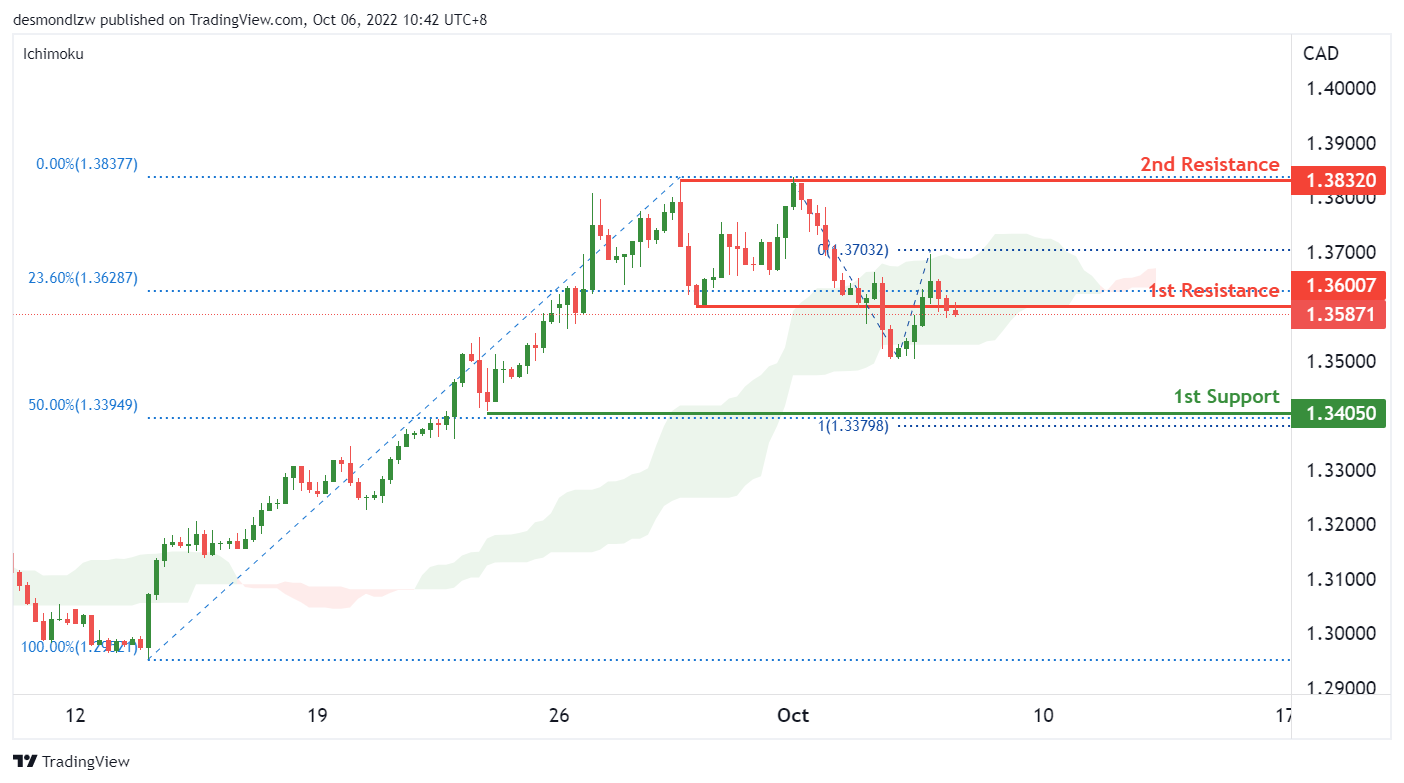
On the H4, the price trades at the support turned 1st resistance level of 1.36 which is in line with the 23.60% fibonacci retracement level. With the price within the ichimoku cloud, we have a short term bearish bias. Price could fall to the 1st support of 1.34 which is in line with the 50% retracement level and the previous swing low. Alternatively, if price breaks above the 1st resistance level, the USDCAD could trade higher towards the 2nd resistance of 1.3832 which is the previous swing high.
Areas of consideration:
- H4 time frame, 1st resistance at 1.36
- H4 time frame, 1st support at 1.34
- H4 time frame, 2nd resistance at 1.3832
OIL:
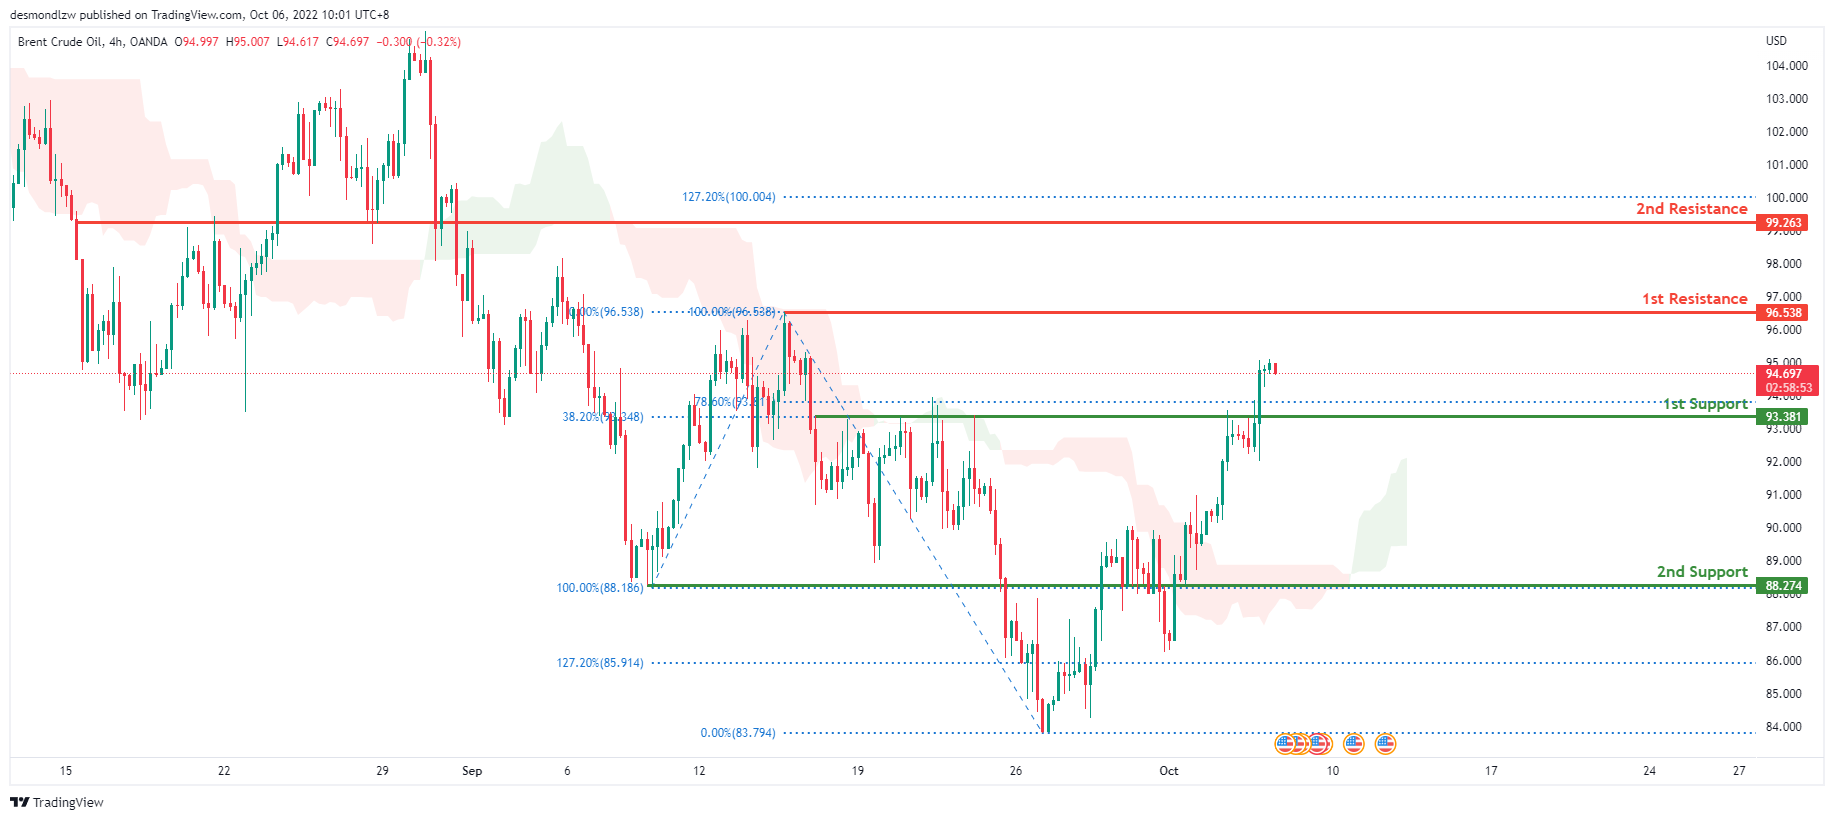
Oil is in a bearish trend on the H4 chart. However, price turned bullish a week ago, and price is now above the Ichimoku cloud, indicating that the market has entered a medium term bullish trend. Price has also closed above the first support level at 93.381, which is marked by the 78.6% Fibonacci line. Price is expected to move towards the first resistance level at 96.538, which contains the 100% Fibonacci and 0% Fibonacci lines.
Areas of consideration:
- H4 time frame, 1st resistance at 96.538
- H4 time frame, 1st support at 93.381
Dow Jones Industrial Average:
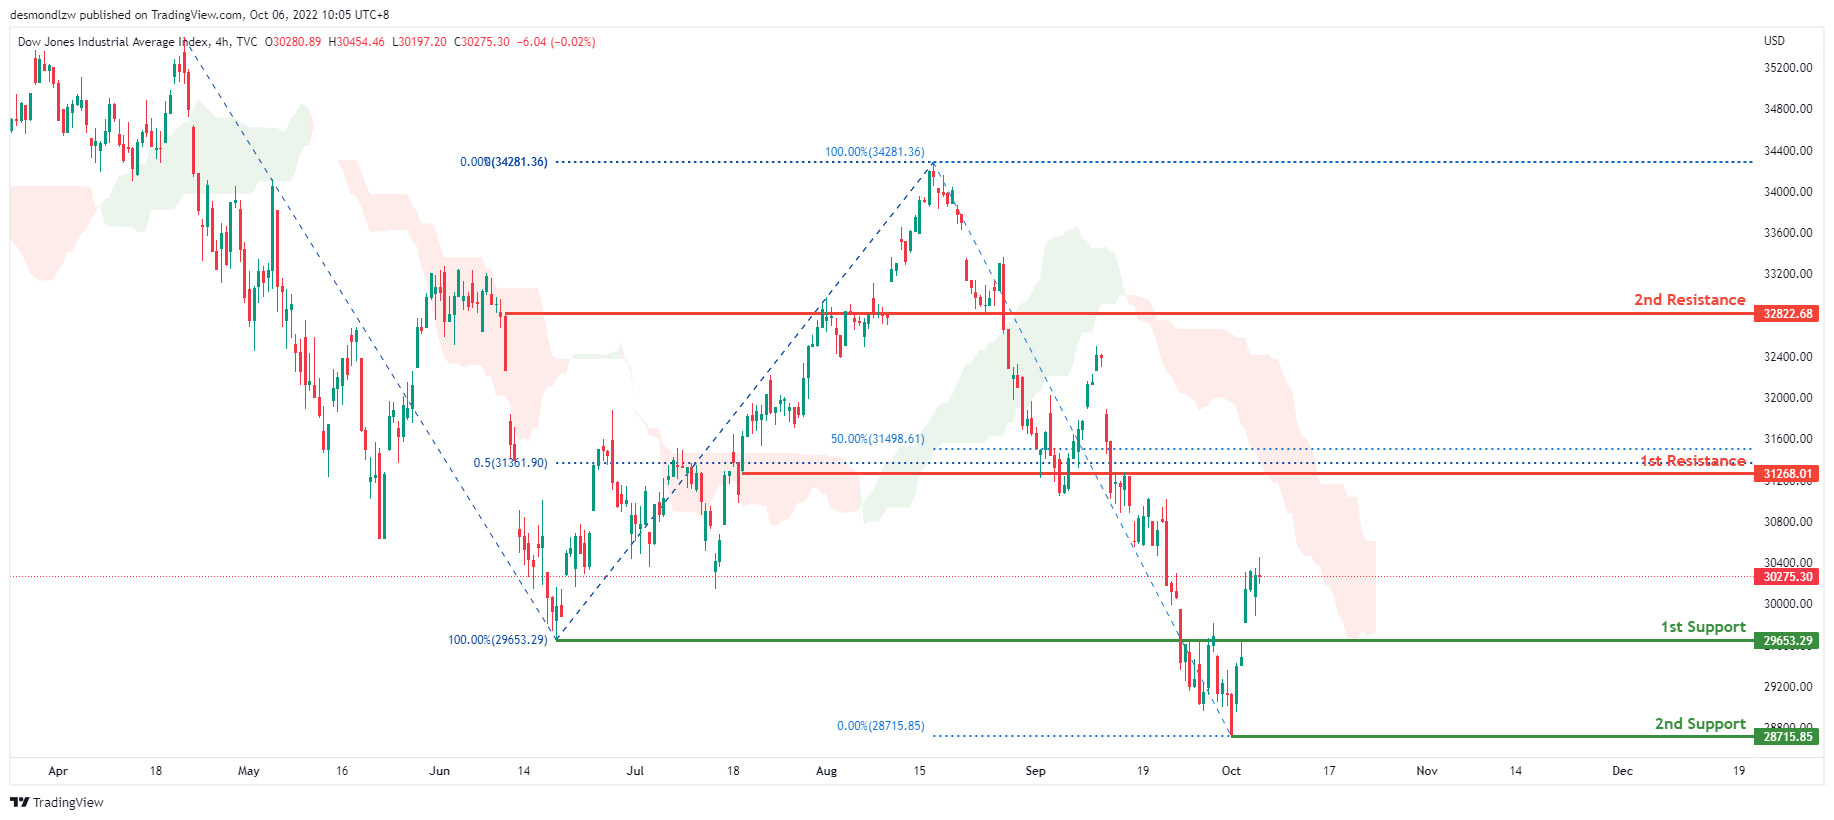
Price is bearish on the H4 chart. However, a short-term bullish trend appears to be forming over the last week. Price broke back above the first support level at 29653.29, which corresponds to the previous swing low. If the short-term bullish momentum continues, price will move towards the first resistance level at 31268.01, which contains two 50% Fibonacci lines.
Areas of consideration:
- H4 time frame, 1st support at 29653.29
- H4 time frame, 1st resistance at 31268.01
DAX:
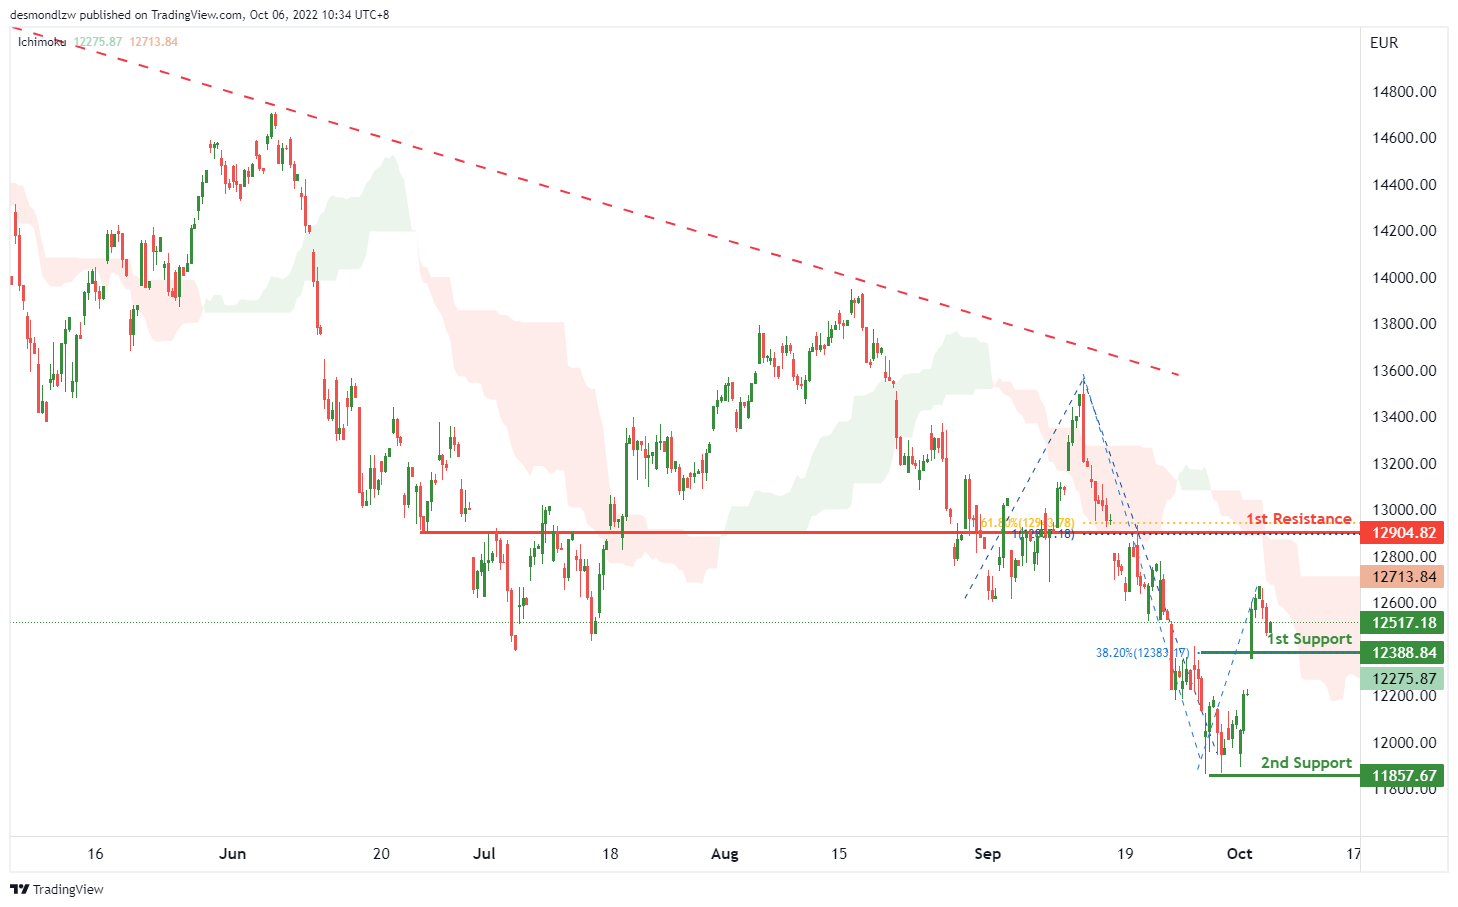
On the H4, with the price moving below ichimoku cloud and long term descending trendline, we have a bearish bias that the price may drop to the 1st support at 12388.84, which is in line with the 38.2% fibonacci retracement. If the 1st support is broken, the 2nd support could be at 11857.67, which is in line with the swing low. Alternatively, the price may rise to the 1st resistance at 12904.82, which is in line with the 100% fibonacci projection and 61.8% fibonacci retracement.
Areas of consideration:
- H4 time frame, 1st support at 12388.84
- H4 time frame, 2nd support at 11857.67
ETHUSD:
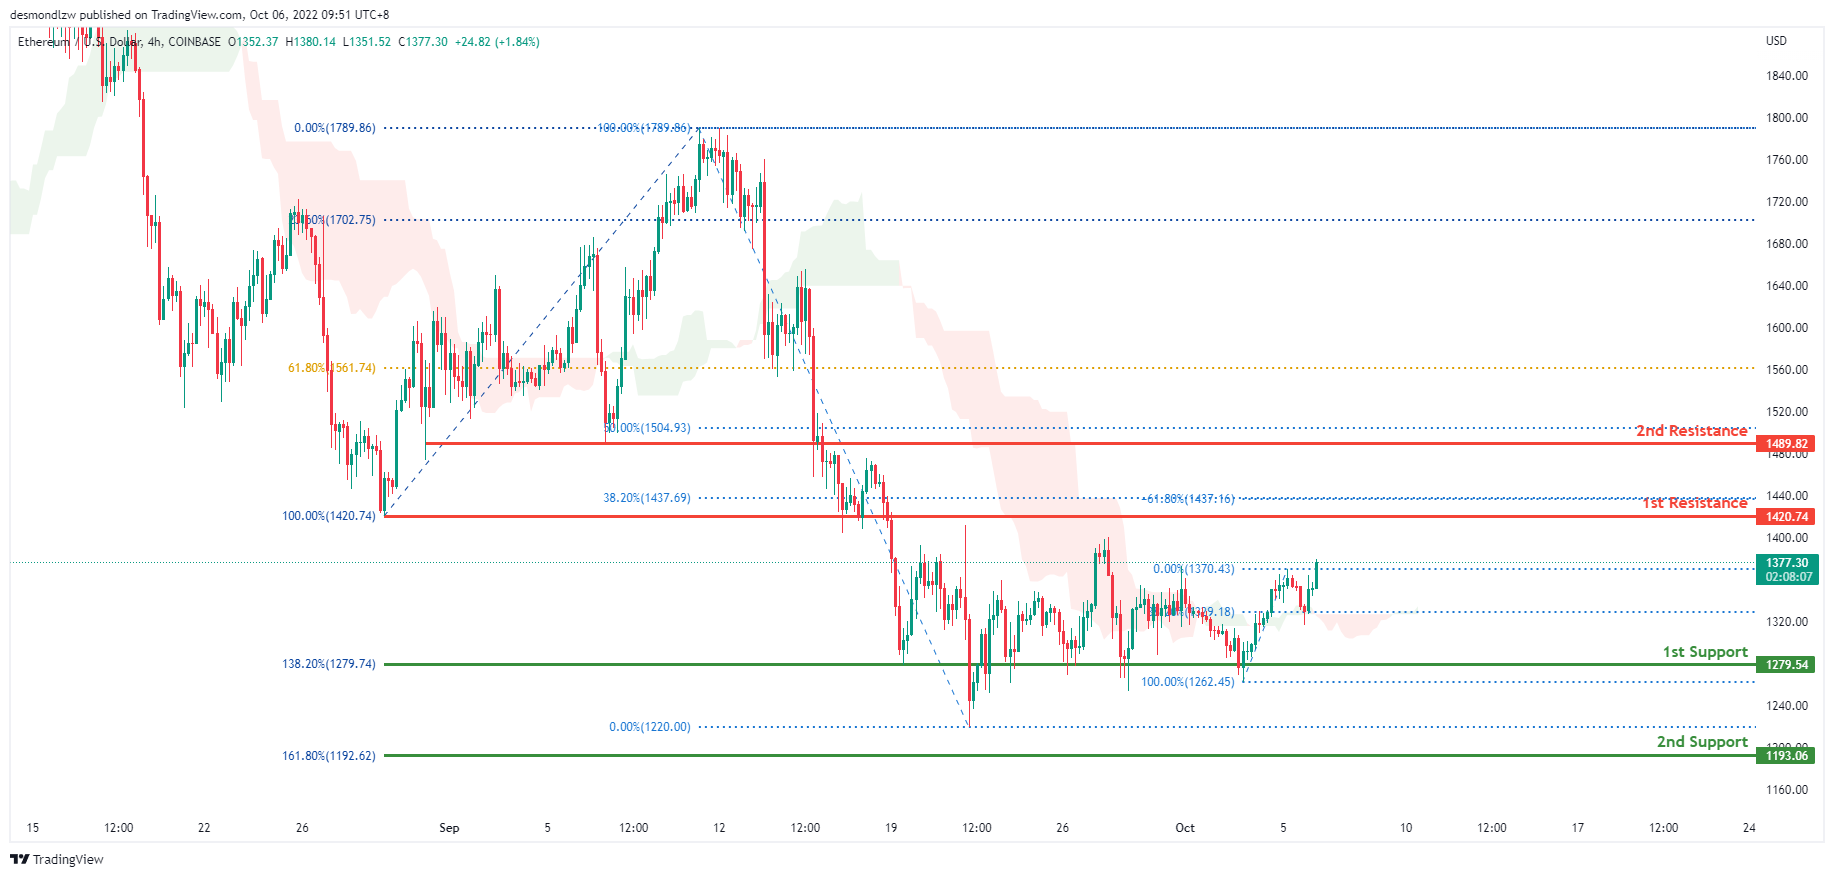
ETHUSD is bearish on the H4 chart. However, the overnight price has closed above the Ichimoku cloud, indicating that the market may turn bullish in the short term. For the past three weeks, the price has consolidated along 1279.54, the first support level. Price is expected to continue rising towards the first resistance level at 1420.74, where the previous swing low is located.
Areas of consideration:
- H4 time frame, 1st resistance of 1420.74
- H4 time frame, 1st support at 1279.00
BTCUSD:
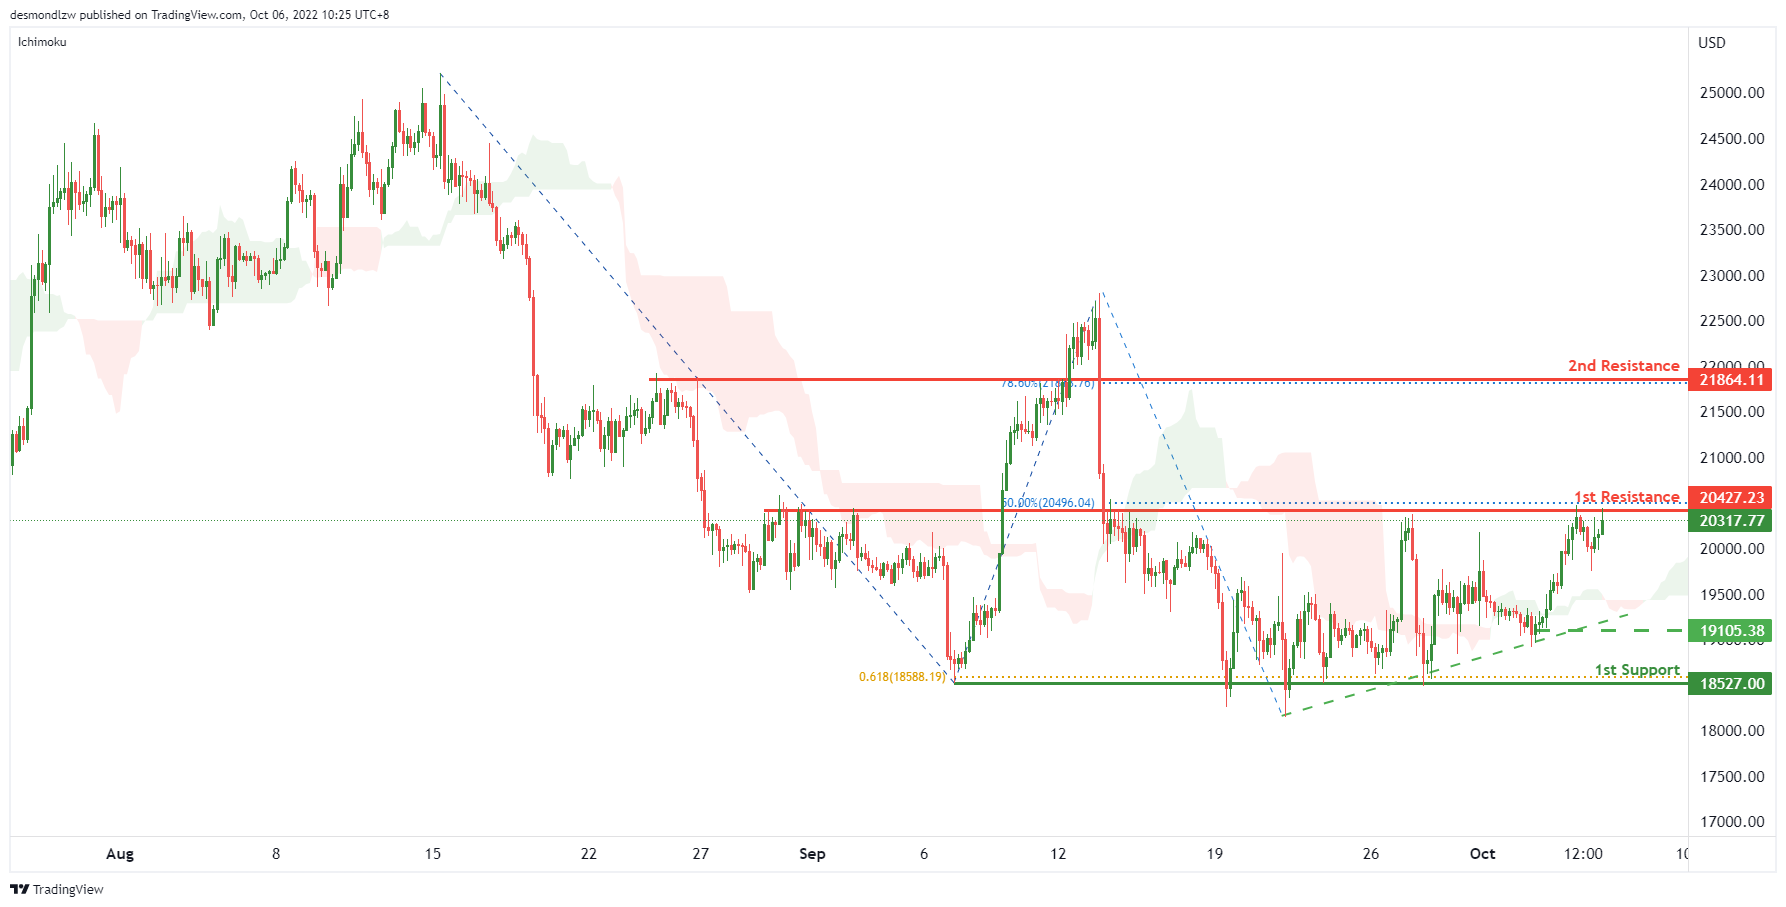
On the H4, price is showing a short term ascending trendline and testing the 1st resistance at 20427.23, where the overlap resistance and 50% fibonacci retracement are. If the 1st resistance is broken, the next resistance could be at 21864.11, which is in line with the 78.6% fibonacci retracement. Alternatively, the price may pull back from the 1st resistance and drop to the 1st support at 18527, which is in line with the swing lows and 61.8% fibonacci projection. Take note the 19105.38 could be the intermediate support.
Areas of consideration:
- H4 time frame, 1st resistance at 20427.23
- H4 time frame, 2nd resistance at 21864.11
S&P 500:
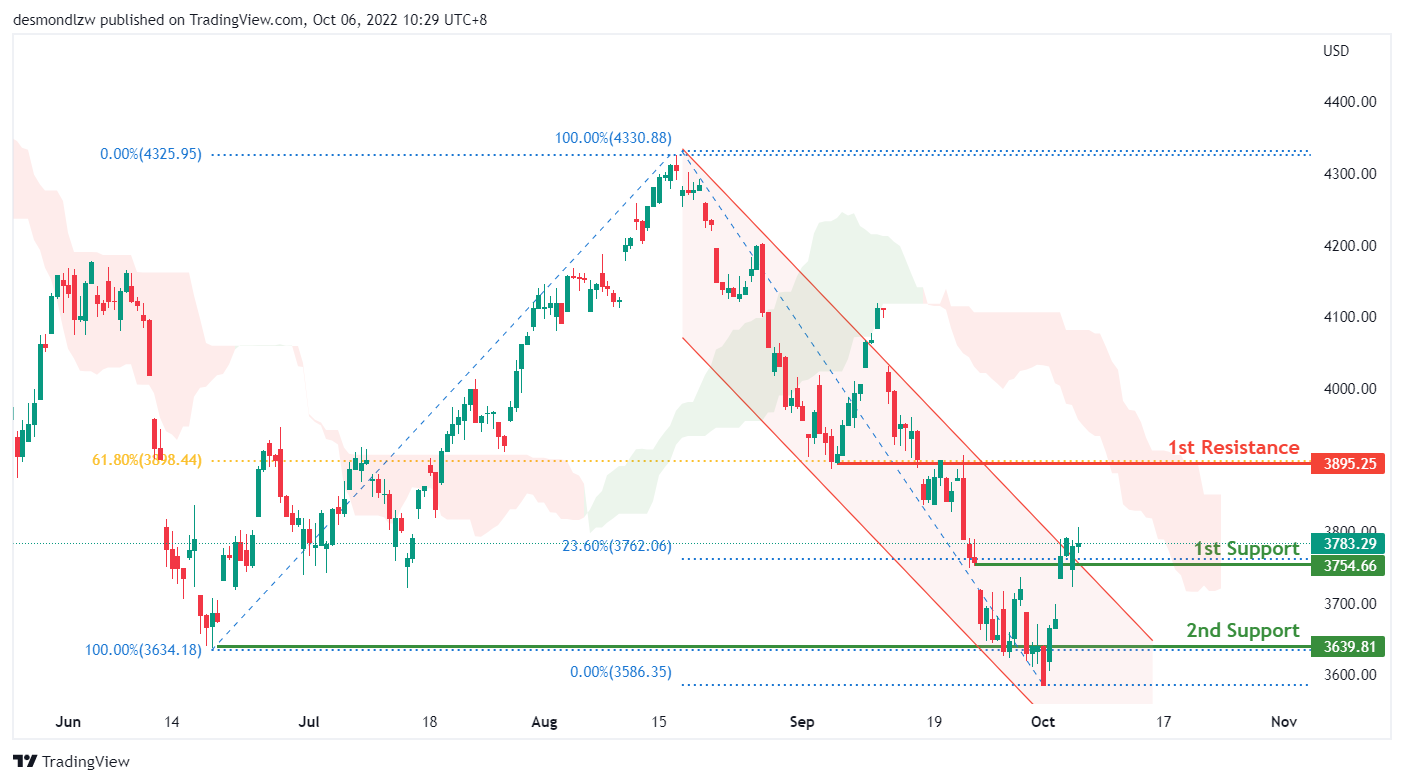
On the H4, with the price breaking out of the descending channel and trading higher from 1st support of 3754, which is in line with the 23.60% fibonacci retracement level, we continue to have a bearish bias. The price could continue trading higher to the 1st resistance of 3895 which is inline with the 61.80% fibonacci retracement level and previous swing high. Alternatively, the price could reverse back into the descending channel to trade lower towards the 2nd support level, which is at the previous swing low of June 2022.
Areas of consideration:
- H4 time frame, 1st resistance at 3895
- H4 time frame, 1st support at 3754
- H4 time frame, 2nd support at 3639
GBP/USD Daily Outlook
Daily Pivots: (S1) 1.1206; (P) 1.1350; (R1) 1.1473; More...
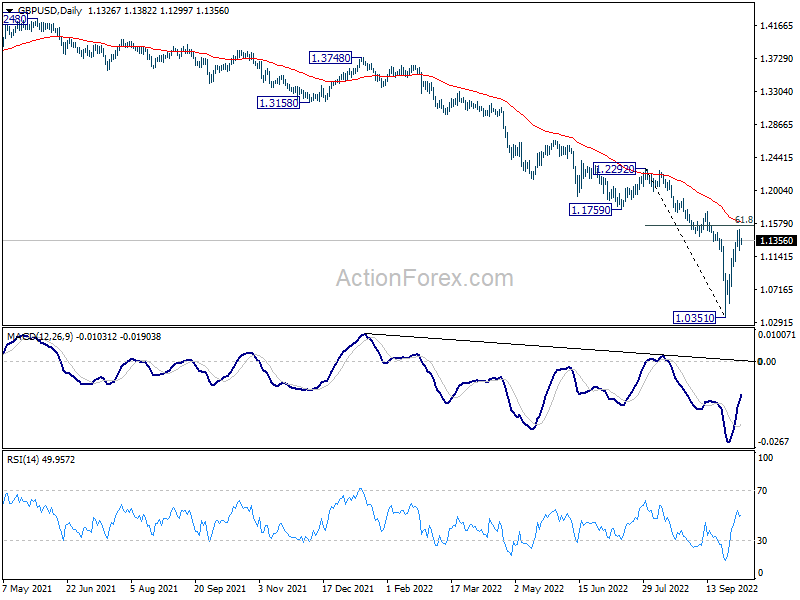
Intraday bias in GBP/USD remains neutral for the moment. On the downside, break of 1.1023 minor support will indicate that rebound from 1.0351 is over. Intraday bias will be back on the downside for retesting 1.0351. On the upside, firm break of 61.8% retracement of 1.2292 to 1.0351 at 1.1551 will pave the way to 1.2292 resistance.
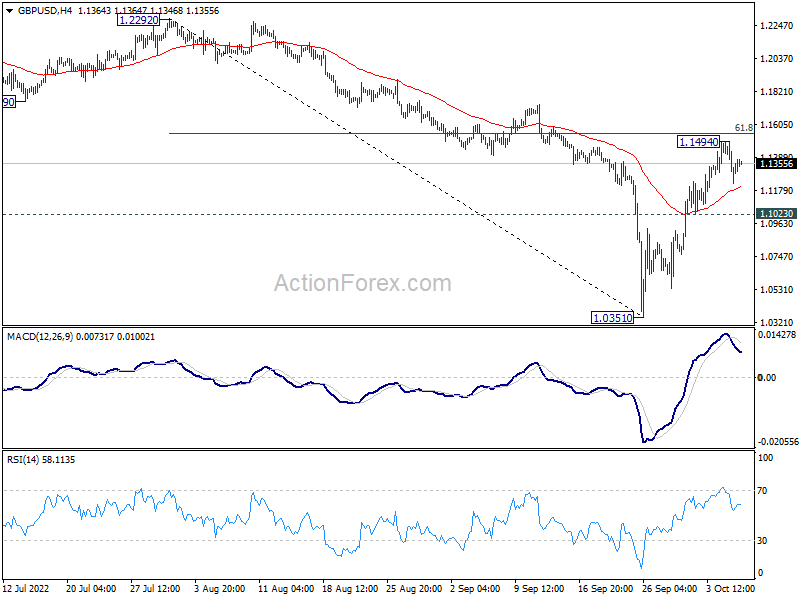
In the bigger picture, fall from 1.4248 (2018 high) is resuming long term down trend from 2.1161 (2007 high). Next target is 100% projection of 2.1161 to 1.3503 from 1.7190 at 0.9532. There is no scope of a medium term rebound as long as 1.1759 support turned resistance holds.
Dollar Soft With Yen and Franc, Sterling Awaits Next Move
Dollar traded with an undertone in Asian session together with Yen and Swiss Franc. The pull back in US stocks overnight turned out to be shallow and brief. Major indexes managed to pare back much of earlier losses to close just slightly lower. Investors seemed to be just cautious ahead of Friday's job report. Meanwhile, commodity currencies are strengthening in Asian session, while Euro and Sterling are mixed.
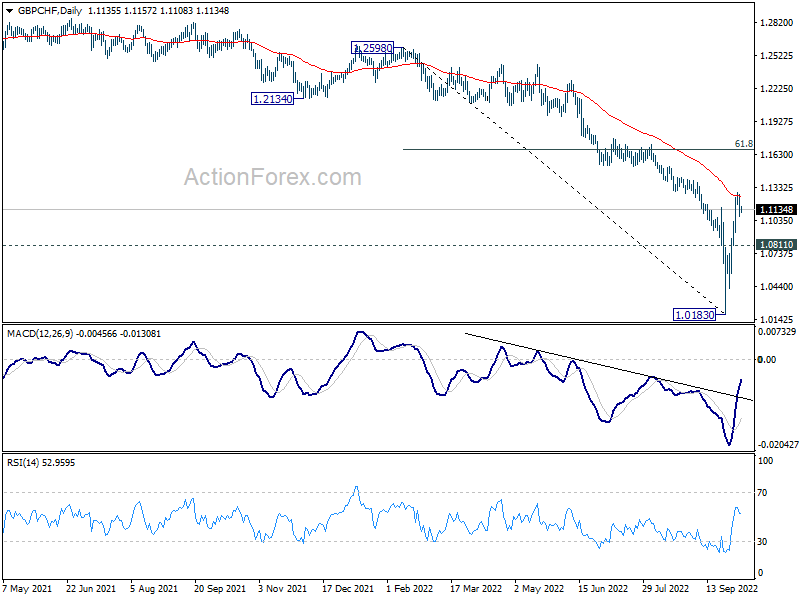
Technically, in addition to Dollar's next move, development in Sterling is also worth a note. After two volatile weeks, both EUR/GBP and GBP/CHF are now pressing 55 day EMA (from opposite sides of course). The Pound appears to be finding it difficult to break through the EMAs decisively. Rejection from there could prompt sellers to come back and push it back towards the near term spike low. As for GBP/CHF, break of 1.0811 minor support will argue that rebound from 1.0183 has completed, and bring deeper fall back towards there.
In Asia, at the time of writing, Nikkei is up 1.01%. Hong Kong HSI is down -0.17%. Singapore Strait Times is up 0.32%. Japan 10-year JGB yield is up 0.004 at 0.254. Overnight, DOW dropped -0.14%. S&P 500 dropped -0.20%. NASDAQ dropped -0.25%. 10-year yield rose 0.142 to 3.759
Fed Bostic: Lowering rates in 2023? Not so fast
Atlanta Fed president Raphael Bostic said yesterday, "I would like to reach a point where policy is moderately restrictive --between 4 and 4 1/2 percent by the end of this year -- and then hold at that level and see how the economy and prices react,"
There is "considerable speculation already that the Fed could begin lowering rates in 2023 if economic activity slows and the rate of inflation starts to fall," Bostic said. "I would say: not so fast."
"We should not let the emergence of (economic) weakness deter our push to lower inflation," he added. "We must remain vigilant because this inflation battle is likely still in early days."
NZ Robertson not concerned with NZD outlook, NZD/USD extending recovery
New Zealand Deputy Prime Minister Grant Robertson said today that it's going to be a "challenging year" with "global slowdown". New Zealand would see "less demand and some slowdown". But, "that doesn't mean, to me, a recession. There is balance to struck here."
"Monetary and fiscal policies need to be coordinated, to work together," he said. "As interest rates rise they'll restrict demand." He also said that he's "not concerned on the long-term outlook for the New Zealand dollar."
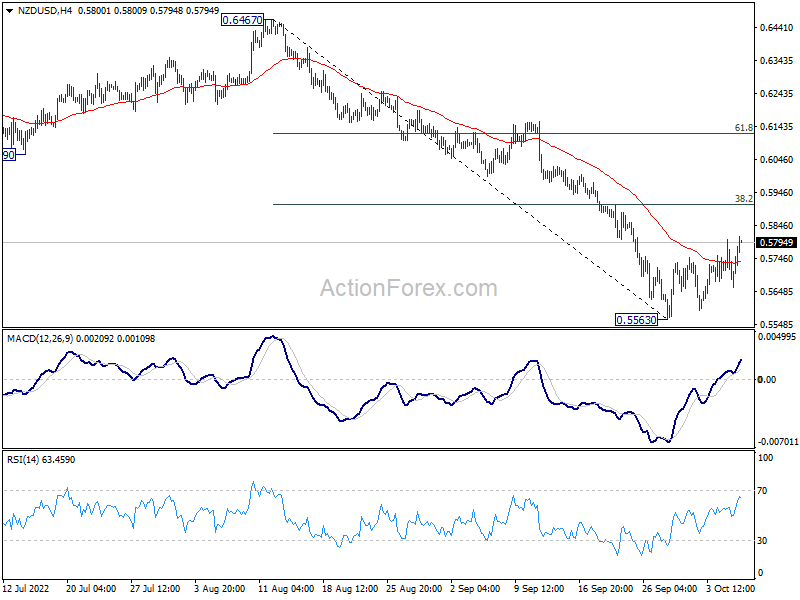
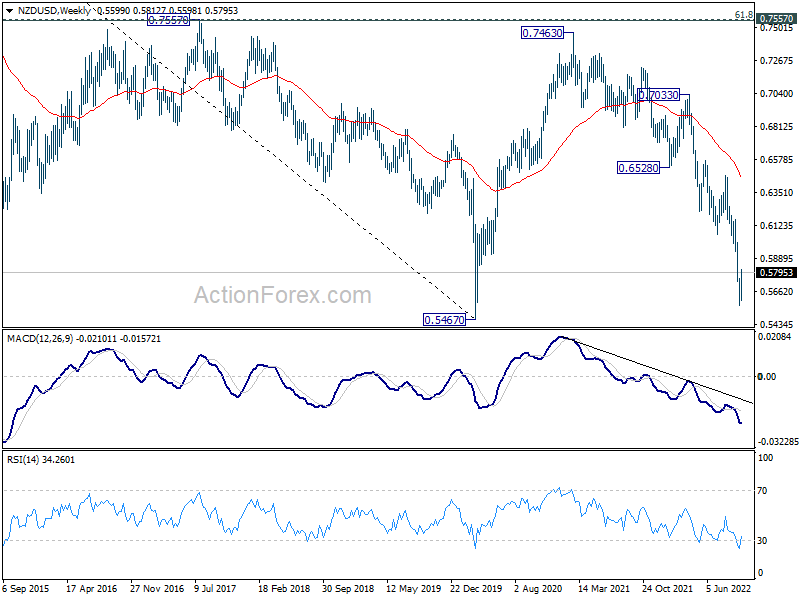
NZD/USD is extending the recovery from 0.5563, but after all, that's seen as a corrective move in a down trend. Upside should be limited by 38.2% retracement of 0.6467 to 0.5563 at 0.5908. Larger down trend is still expected to resume at a later stage to 2020 low at 0.5467.
On the data front
Australia AiG performance of construction dropped from 47.9 to 46.5 in September. Goods and services trade surplus narrowed from AUD 8.97B to AUD 8.32B in August, below expectation of AUD 10.0B.
Looking ahead, Germany factor orders, UK PMI construction, Eurozone retail sales, and ECB meeting accounts will be featured in European session. US Challenger job cuts, jobless claims and Ivey PMI will be released later in the day.
GBP/USD Daily Outlook
Daily Pivots: (S1) 1.1206; (P) 1.1350; (R1) 1.1473; More...
Intraday bias in GBP/USD remains neutral for the moment. On the downside, break of 1.1023 minor support will indicate that rebound from 1.0351 is over. Intraday bias will be back on the downside for retesting 1.0351. On the upside, firm break of 61.8% retracement of 1.2292 to 1.0351 at 1.1551 will pave the way to 1.2292 resistance.
In the bigger picture, fall from 1.4248 (2018 high) is resuming long term down trend from 2.1161 (2007 high). Next target is 100% projection of 2.1161 to 1.3503 from 1.7190 at 0.9532. There is no scope of a medium term rebound as long as 1.1759 support turned resistance holds.
Economic Indicators Update
| GMT | Ccy | Events | Actual | Forecast | Previous | Revised |
|---|---|---|---|---|---|---|
| 21:30 | AUD | AiG Performance of Construction Index Sep | 46.5 | 47.9 | ||
| 00:30 | AUD | Trade Balance (AUD) Aug | 8.32B | 10.00B | 8.73B | 8.97B |
| 06:00 | EUR | Germany Factory Orders M/M Aug | -0.50% | -1.10% | ||
| 08:30 | GBP | Construction PMI Sep | 48.1 | 49.2 | ||
| 09:00 | EUR | Eurozone Retail Sales M/M Aug | -0.30% | 0.30% | ||
| 11:30 | EUR | ECB Monetary Policy Meeting Accounts | ||||
| 11:30 | USD | Challenger Job Cuts Y/Y Sep | 30.30% | |||
| 12:30 | USD | Initial Jobless Claims (Sep 30) | 205K | 193K | ||
| 14:00 | CAD | Ivey PMI Sep | 62.3 | 60.9 | ||
| 14:30 | USD | Natural Gas Storage | 125B | 103B |
NZ Robertson not concerned with NZD outlook, NZD/USD extending recovery
New Zealand Deputy Prime Minister Grant Robertson said today that it's going to be a "challenging year" with "global slowdown". New Zealand would see "less demand and some slowdown". But, "that doesn't mean, to me, a recession. There is balance to struck here."
"Monetary and fiscal policies need to be coordinated, to work together," he said. "As interest rates rise they'll restrict demand." He also said that he's "not concerned on the long-term outlook for the New Zealand dollar."
NZD/USD is extending the recovery from 0.5563, but after all, that's seen as a corrective move in a down trend. Upside should be limited by 38.2% retracement of 0.6467 to 0.5563 at 0.5908. Larger down trend is still expected to resume at a later stage to 2020 low at 0.5467.