Sample Category Title
GBPUSD Wave Analysis
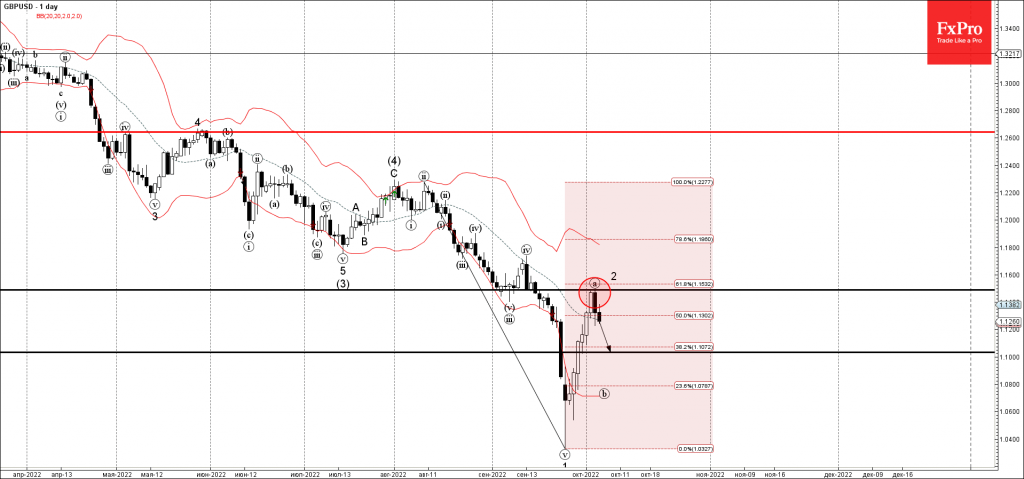
- GBPUSD reversed from resistance level 1.1490
- Likely to fall to support level 1.1000
GBPUSD currency pair recently reversed down from the key resistance level 1.1490 (former strong support from the start of September), intersecting with the 61.8% Fibonacci correction of the earlier sharp downward impulse from August.
The downward reversal from this resistance level 1.1490 stopped the earlier short-term impulse wave (a) of the higher order ABC correction 2.
Given the clear daily downtrend, GBPUSD currency pair can be expected to fall further toward the next support level 1.1000.
GBP/USD: Near-Term Structure Weakens after a Double Failure at 1.1500 Barrier
Cable remains in red for the second day, pressured by weaker risk sentiment and downbeat report from the BoE, which showed raised expectations for inflation in one year time to 9.5% from 8.4% estimation in August and expectations for 4.8% inflation in three years.
Inflation in UK eased to 9.9% in September from 10.1% in August, but still about five times above the central bank’s 2% target.
BoE remains on track for further rate hikes to in fight to bring red-hot inflation under control, though high borrowing cost would further hurt already weakened economic growth.
Overall negative near-term picture could be partially offset by better than expected UK PMI data which showed unexpected increase of activity in construction sector, sending the index to three-month high.
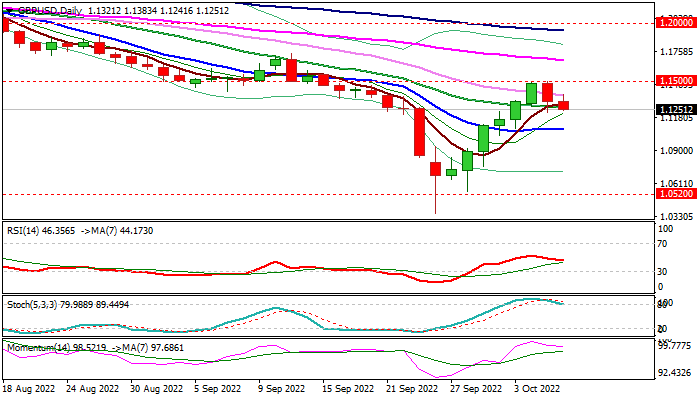
Daily studies show near-term structure weakening, following a pullback after repeated reject at round-figure 1.15 resistance, as negative momentum is rising and stochastic emerging from overbought territory. Fresh bears tested initial support at 1.1225 (Fibo 23.6% of 1.0348/1.1495 recovery leg), but need break here to further weaken near-term structure and open way for attack at key supports at 1.1082/1.1057 (10DMA/Fibo 38.2%) and psychological 1.10 level, to generate stronger reversal signal on break. Falling 30DMA offers immediate resistance at 1.1373, guarding the upper pivot at 1.1500, violation of which would bring bulls back to play.
Res: 1.1373; 1.1410; 1.1460; 1.1500.
Sup: 1.1225; 1.1082; 1.1057; 1.1000.
EUR/USD Mid-Day Outlook
Daily Pivots: (S1) 0.9816; (P) 0.9906; (R1) 0.9976; More...
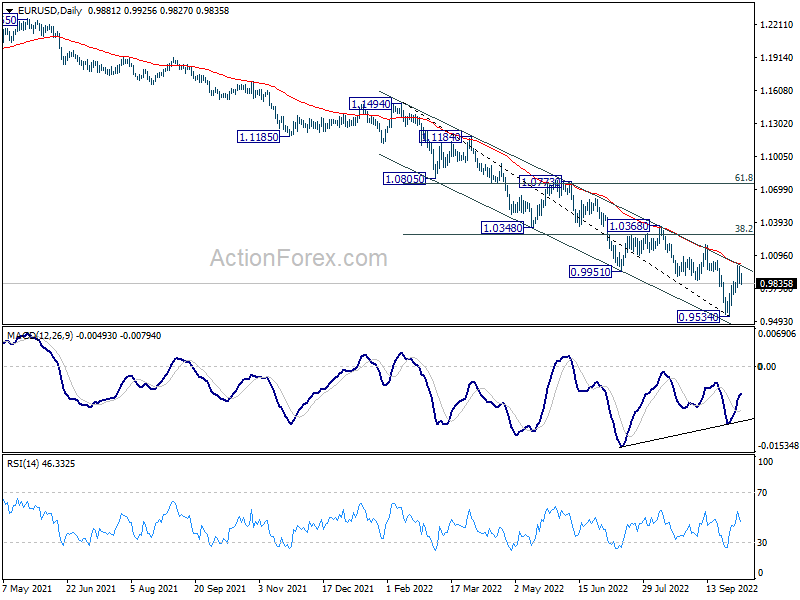
Intraday bias in EUR/USD stays neutral at this point. On the downside, break of 0.9734 minor support will suggest rejection by 55 day EMA, and medium term falling channel. Bias will be turned back to the downside for retesting 0.9534 low and then resume down trend. Nevertheless, considering bullish convergence condition in daily MACD, sustained break of 55 day EMA (now at 1.0019) will raise the chance of medium term bottoming at 0.9534. Further rally should then be seen to 38.2% retracement of 1.1494 to 0.9534 at 1.0283.
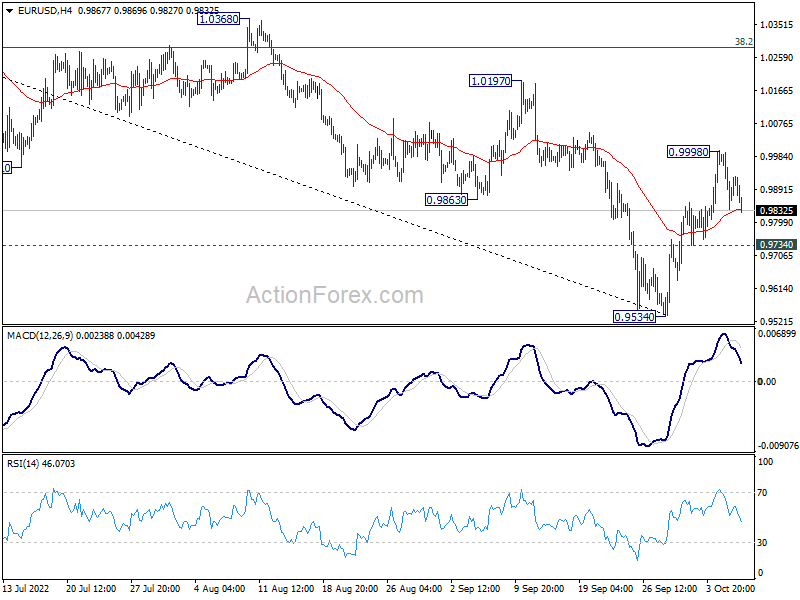
In the bigger picture, down trend from 1.6039 (2008 high) is still in progress. Next target is 100% projection of 1.3993 to 1.0339 from 1.2348 at 0.8694. In any case, break of 1.0197 resistance is needed to be the first sign of medium term bottoming. Otherwise, outlook will stay bearish even with strong rebound.
GBP/USD Mid-Day Outlook
Daily Pivots: (S1) 1.1206; (P) 1.1350; (R1) 1.1473; More...
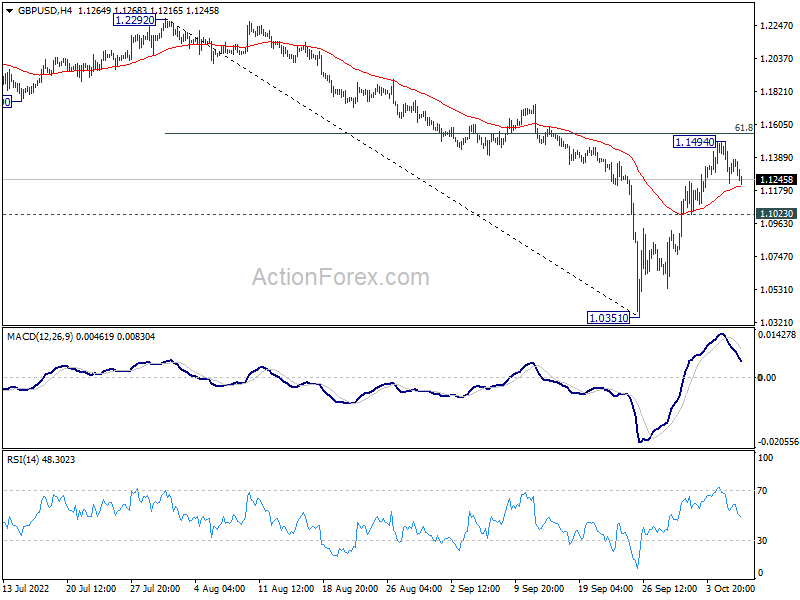
Intraday bias in GBP/USD stays neutral at this point. On the downside, break of 1.1023 minor support will indicate that rebound from 1.0351 is over. Intraday bias will be back on the downside for retesting 1.0351. On the upside, firm break of 61.8% retracement of 1.2292 to 1.0351 at 1.1551 will pave the way to 1.2292 resistance.
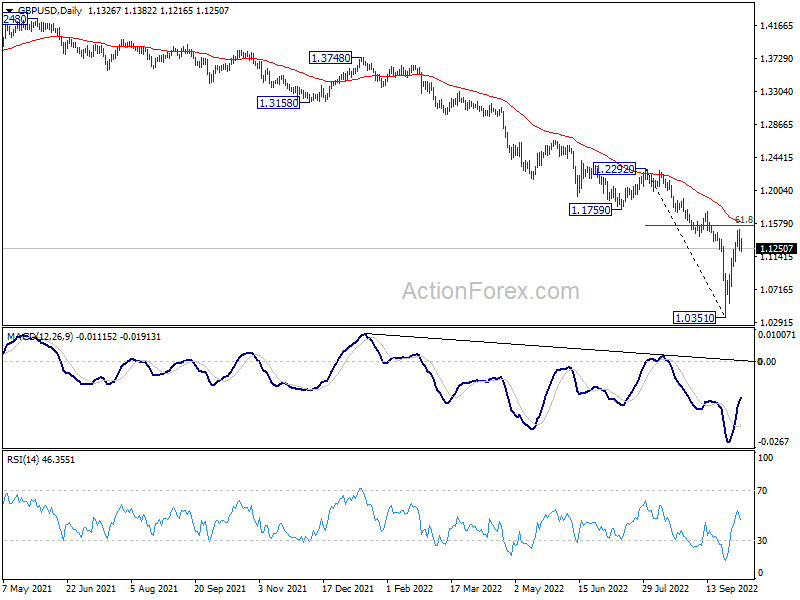
In the bigger picture, fall from 1.4248 (2018 high) is resuming long term down trend from 2.1161 (2007 high). Next target is 100% projection of 2.1161 to 1.3503 from 1.7190 at 0.9532. There is no scope of a medium term rebound as long as 1.1759 support turned resistance holds.
USD/JPY Daily Outlook
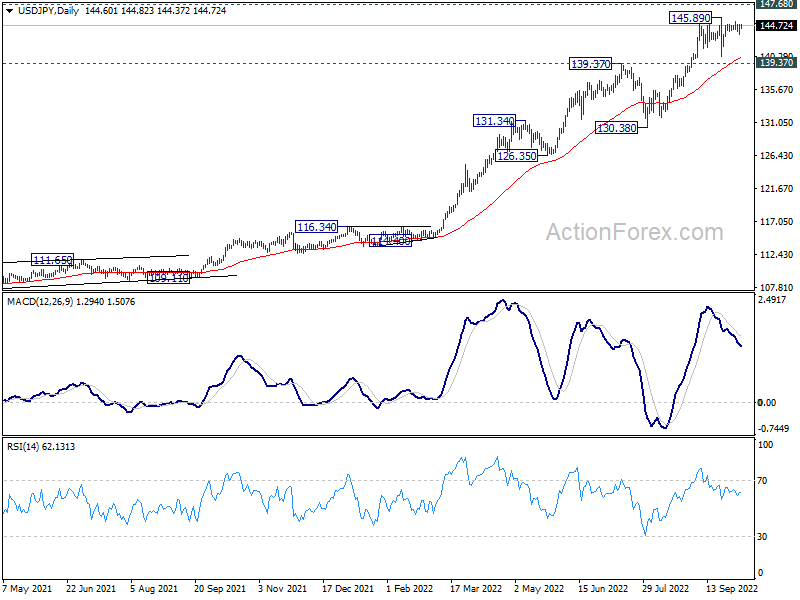
Daily Pivots: (S1) 143.86; (P) 144.36; (R1) 145.18; More...
No change in USD/JPY's outlook as consolidation from 145.89 is still extending. Intraday bias stays neutral and further rally is expected as long as 139.37 resistance turned support holds. Break of 145.89 will target 147.68 long term resistance. On the downside, however, decisive break of 139.37 will confirm short term topping. Deeper decline would be seen back towards 130.38 support.
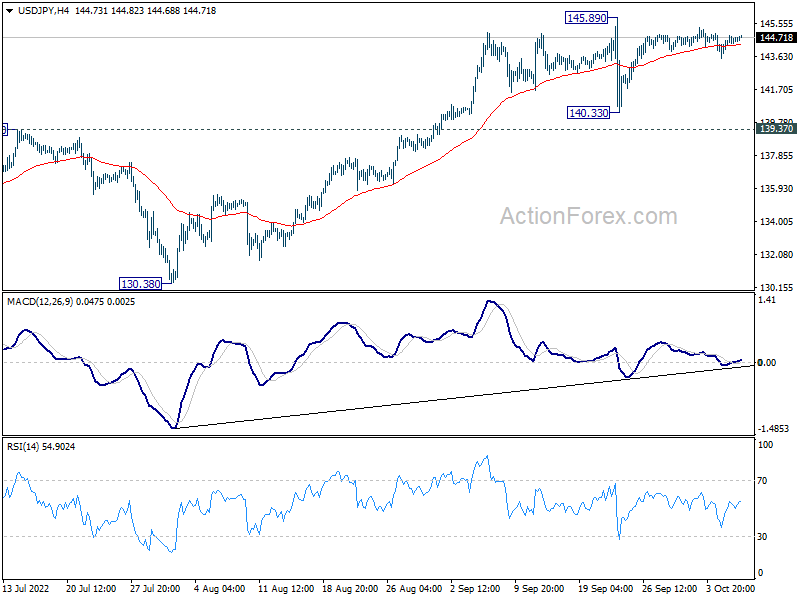
In the bigger picture, up trend from 101.18 is still in progress, as part of the whole up trend from 75.56 (2011 low). Further rise should be seen to 147.68 (1998 high). For now, break of 130.38 support is needed to be the first indication of medium term topping. Otherwise, outlook will stay bullish even in case of deep pull back.
USD/CHF Mid-Day Outlook
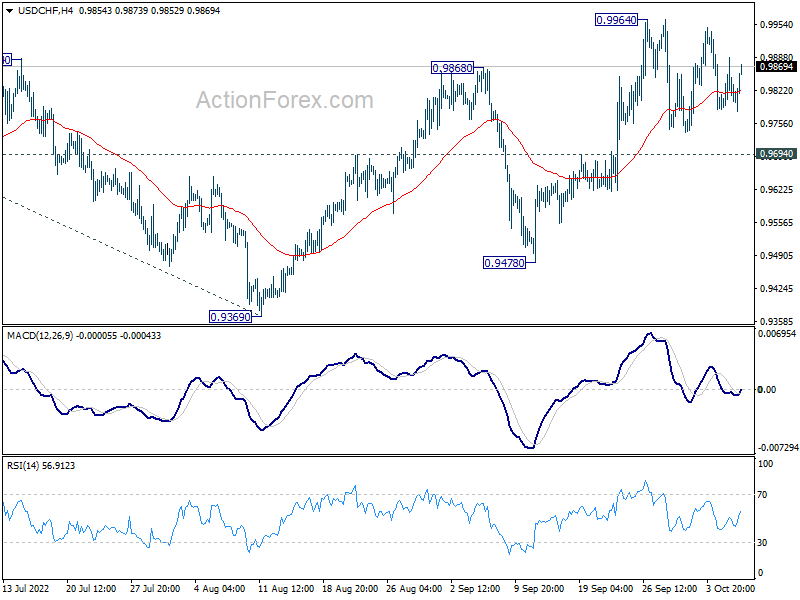
Daily Pivots: (S1) 0.9784; (P) 0.9836; (R1) 0.9888; More...
USD/CHF is still extending the consolidation pattern form 0.9964 and intraday bias remains neutral. Outlook is unchanged that further rally is in favor as long as 0.9694 support holds. On the upside, above 0.9964 will resume the rally from 0.9369 to retest 1.0063 high. On the downside, however, break of 0.9694 support will extend the corrective pattern from 1.0063 with another falling leg, towards 0.9478 support first.
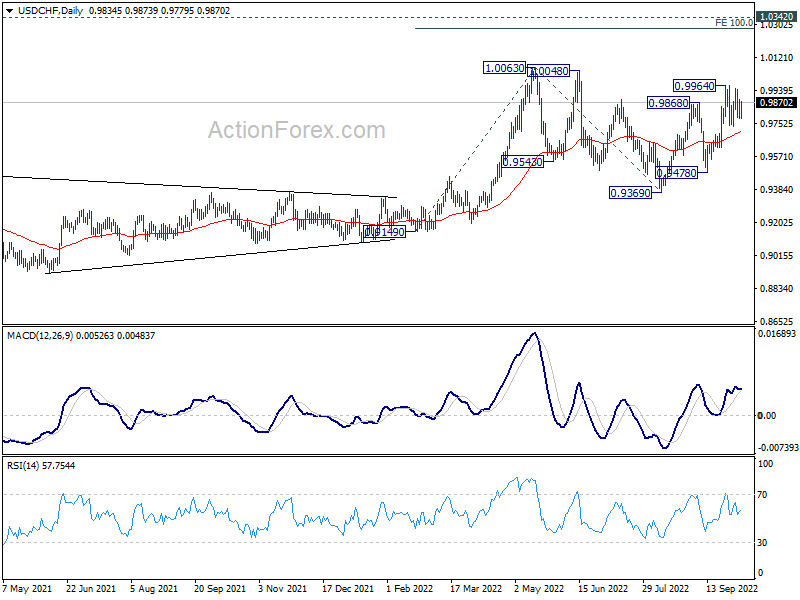
In the bigger picture, current development suggests that up trend from 0.8756 (2021 low) is still in progress. Sustained break of 1.0063 will target 100% projection of 0.9149 to 1.0063 from 0.9369 at 1.0283, and then 1.0342 (2016 high). For now, this will remain the favored case as long as 0.9369 support holds, even in case of deep pull back.
Dollar Mildly Higher in Tight Range, Markets Quiet
The forex markets are very quiet today, with major pairs and crosses stuck inside yesterday's range so far. Dollar is trying to recover but lacks sustained buying. Traders are clearly holding the bets before tomorrow's non-farm payroll report. As for the week, the greenback remains the worst performer, followed by Yen and Swiss Franc. Commodity currencies are the stronger ones, but they're just in corrective recovery. Euro and Sterling are mixed.
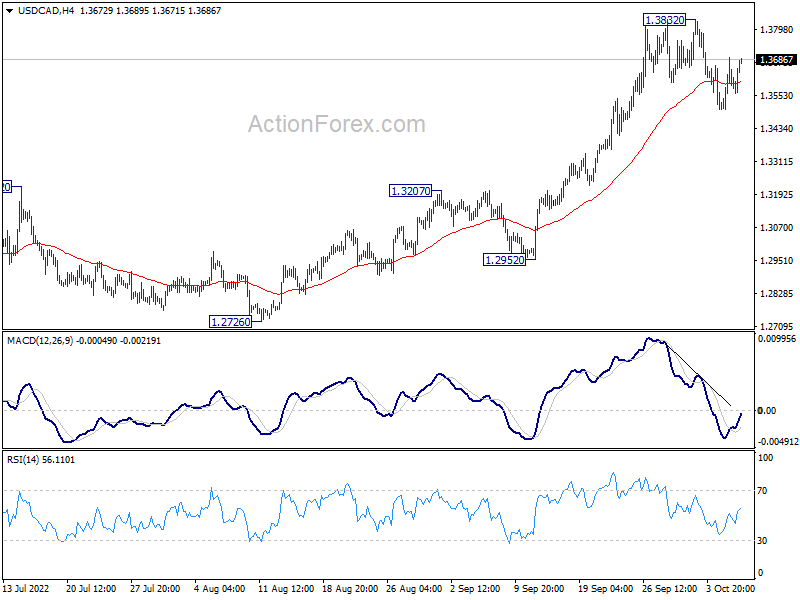
Technically, if Dollar is going to resume it's prior up trend, it will more likely breakout against commodity currencies first, with help from return of risk-off sentiment. Thus, some focuses will be on 0.6362 temporary low in AUD/USD and 1.3832 temporary top in USD/CAD. Break of these levels could be a prelude to more broad-based comeback of the greenback.
In Europe, at the time of writing, FTSE is down -0.95%. DAX is down -0.18%. CAC is down -0.59%. Germany 10-year yield is up 0.0143 at 2.042. Earlier in Asia, Nikkei rose 0.70%. Hong Kong HSI dropped -0.42%. Singapore Strait Times dropped -0.05%. Japan 10-year JGB yield dropped -0.0059 at 0.244.
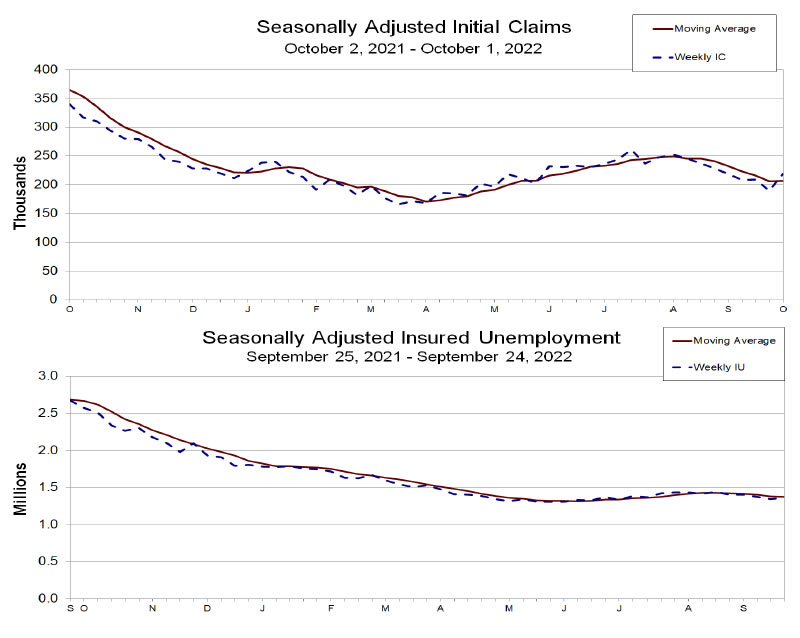
US initial jobless claims rose to 219k, above expectation
US initial jobless claims rose 29k to 219k in the week ending October 1, above expectation of 205k. Four-week moving average of initial claims rose 250 to 206.5k.
Continuing claims rose 15k to 1361k in the week ending September 24. Four-week moving average of continuing claims dropped 10k to 1371k.
ECB accounts: Some members preferred 50bps hike in Sep
The accounts of ECB's September 7-8 monetary policy meeting showed that a "very large number" of committee members expressed a preference for a 75bps hike, which was "a proportionate response" to upward revisions to inflation outlook and an important signal of the determination to bring inflation back to target in a "timely manner".
But "some members" preferred a 50bps hike as that would be "large enough to signal determination in proceeding with the interest rate normalization". With the "looming risk of a recession", a 50bps hike as part of a "sustained path towards more neutral rate levels" might prove "sufficient" to return inflation to target. "What needed to be addressed was the risk of the sharp rise in inflation, exacerbated by the war, destabilizing inflation expectations," the account noted.
But add the end, all members joined a consensus for the 75bps hike, while maintain that policy should "not follow a pre-set path", and be set on a "meeting-by-meeting basis.
Eurozone retail sales volume dropped -0.3% mom in Aug, EU down -0.2% mom
Eurozone retail sales volume dropped -0.3% mom in August, matched expectations. Retail trade volume decreased by -0.8% for food, drinks and tobacco, while it increased by 0.2% for non-food products and by 3.2% for automotive fuels.
EU retail sales volume dropped -0.2% mom. Among Member States for which data are available, the largest monthly decreases in the total retail trade volume were registered in the Netherlands (-2.2%), Germany (-1.3%) and Malta (-1.1%). The highest increases were observed in Slovenia (+7.0%), Luxembourg (+3.8%) and Ireland (+3.5%).
UK PMI construction rose to 52.3, but optimism sank
UK PMI construction rose from 49.2 to 52.3 in September, above expectation of 48.1. S&P Global said total industry activity rose for the first time three months. Output growth was linked to work on delayed projects. Business optimism was the lowest since July 2020 as new orders stalled.
Tim Moore, Economics Director at S&P Global Market Intelligence, said: "Forward-looking survey indicators took another turn for the worse in September, with new business volumes stalling and output growth expectations for the year ahead now the lowest since July 2020. This reflected deepening concerns across the construction sector that rising interest rates, the energy crisis and UK recession risks are all set to dampen client demand in the coming months."
NZ Robertson not concerned with NZD outlook, NZD/USD extending recovery
New Zealand Deputy Prime Minister Grant Robertson said today that it's going to be a "challenging year" with "global slowdown". New Zealand would see "less demand and some slowdown". But, "that doesn't mean, to me, a recession. There is balance to struck here."
"Monetary and fiscal policies need to be coordinated, to work together," he said. "As interest rates rise they'll restrict demand." He also said that he's "not concerned on the long-term outlook for the New Zealand dollar."
USD/CHF Mid-Day Outlook
Daily Pivots: (S1) 0.9784; (P) 0.9836; (R1) 0.9888; More...
USD/CHF is still extending the consolidation pattern form 0.9964 and intraday bias remains neutral. Outlook is unchanged that further rally is in favor as long as 0.9694 support holds. On the upside, above 0.9964 will resume the rally from 0.9369 to retest 1.0063 high. On the downside, however, break of 0.9694 support will extend the corrective pattern from 1.0063 with another falling leg, towards 0.9478 support first.
In the bigger picture, current development suggests that up trend from 0.8756 (2021 low) is still in progress. Sustained break of 1.0063 will target 100% projection of 0.9149 to 1.0063 from 0.9369 at 1.0283, and then 1.0342 (2016 high). For now, this will remain the favored case as long as 0.9369 support holds, even in case of deep pull back.
Economic Indicators Update
| GMT | Ccy | Events | Actual | Forecast | Previous | Revised |
|---|---|---|---|---|---|---|
| 21:30 | AUD | AiG Performance of Construction Index Sep | 46.5 | 47.9 | ||
| 00:30 | AUD | Trade Balance (AUD) Aug | 8.32B | 10.00B | 8.73B | 8.97B |
| 06:00 | EUR | Germany Factory Orders M/M Aug | -2.40% | -0.50% | -1.10% | 1.90% |
| 08:30 | GBP | Construction PMI Sep | 52.3 | 48.1 | 49.2 | |
| 09:00 | EUR | Eurozone Retail Sales M/M Aug | -0.30% | -0.30% | 0.30% | -0.40% |
| 11:30 | EUR | ECB Monetary Policy Meeting Accounts | ||||
| 11:30 | USD | Challenger Job Cuts Y/Y Sep | 67.60% | 30.30% | ||
| 12:30 | USD | Initial Jobless Claims (Sep 30) | 219K | 205K | 193K | 190K |
| 14:00 | CAD | Ivey PMI Sep | 62.3 | 60.9 | ||
| 14:30 | USD | Natural Gas Storage | 125B | 103B |
The Singapore Dollar: a Dark Horse Among Exotic Currencies?
In September 2022, USDSGD almost retested its peak of March 2020. The pair spiked above the 1.4400 level, driven by the strong US Dollar. Despite the obvious dominance of the USD, analysts believe that the Singapore dollar may be the one exotic currency worth our attention. Why do they share this opinion, and should we believe them? Let’s see.
Safe-haven?
The Singapore dollar, which some analysts refer to as the safe-haven currency in the South-Asian region, has relatively good fundamentals compared to other exotic peers.
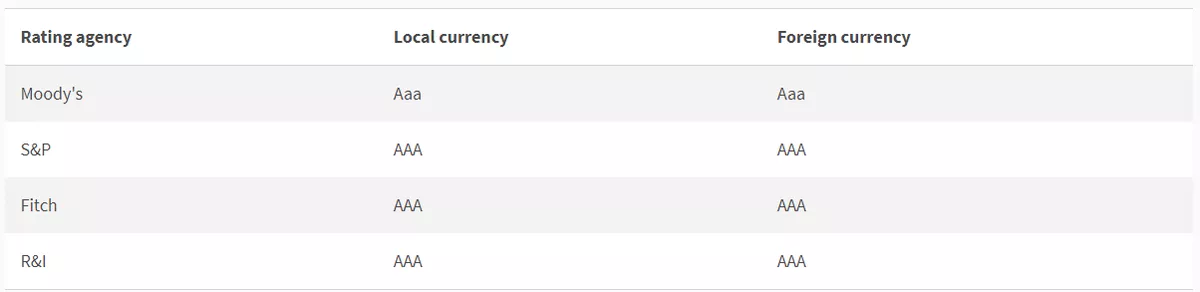
First, Singapore still has a triple-A sovereign credit rating. That is, four rating agencies gave the country high ratings. In general, that means that Singapore is a creditworthy country with a minimal probability of default. It also says that the country’s bonds are the safest possible investments.
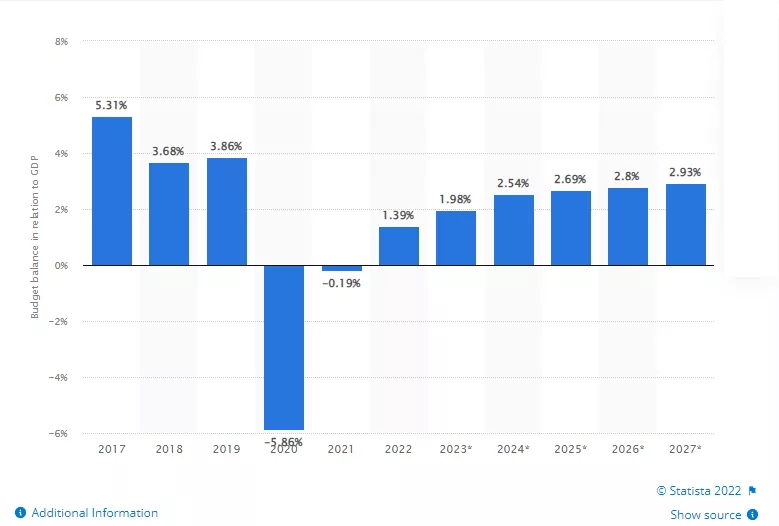
Analysts also mention that Singapore has a big budget surplus, which is set to rise in relation to GDP up until 2027.
Given the data above, the Singapore dollar is set to strengthen in times of uncertainty, as investors will choose it for saving their capital instead of less resilient currencies. Some analysts even claim that the SGD has the ability to replace the yen as a safe haven. The economic picture now proves it, as the Singapore dollar has been consolidating at nearly the same levels against the US dollar since 2018 compared to the Japanese yen.
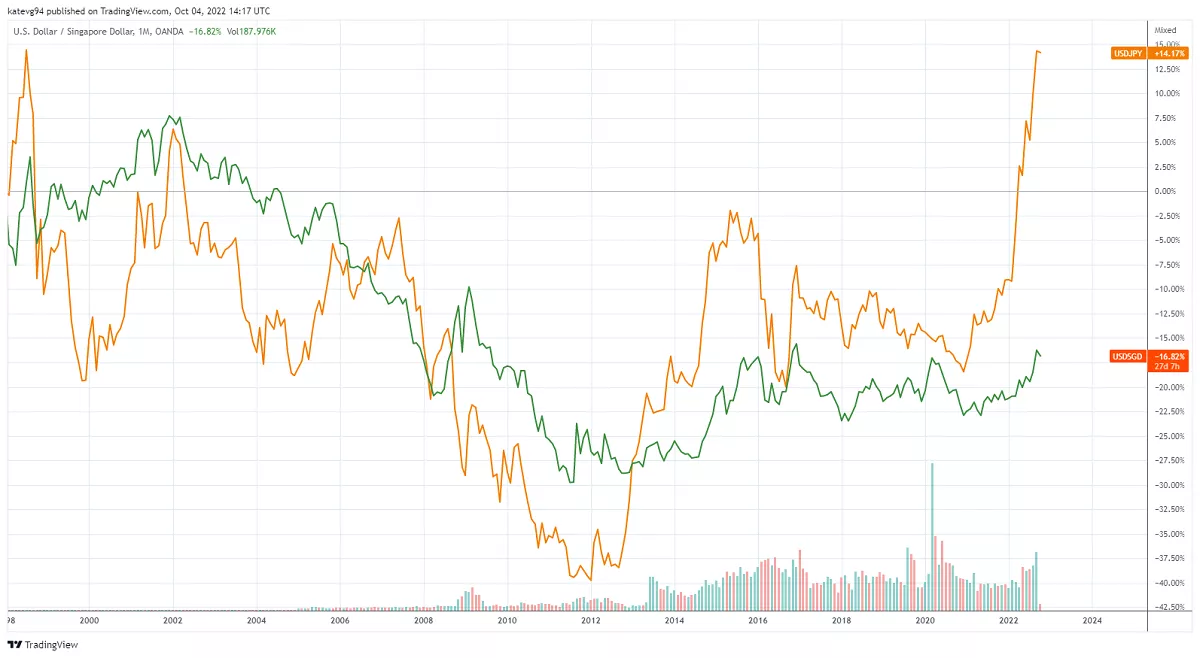
There are still certain doubts that the Singapore dollar will replace the Japanese yen as the most popular Asian safe-haven. The reason behind them lies in the liquidity of the asset. The currency is not widely traded as the JPY or any other currency of big economies.
MAS monetary policy
Now let’s look at the monetary policy of Singapore’s central bank. The Monetary Authority of Singapore (MAS) has a specific approach to monetary policy. Instead of traditional interest rates, the bank measures the value of the SGD against the weighted average of several foreign currencies and uses this metric as an intermediate monetary policy target. The exchange rate has a bigger influence on inflation in Singapore than the interest rate used by other central banks. So, the MAS allows the Singapore dollar to appreciate against other currencies as it pulls the cost of imported goods down.
The next meeting of the MAS will be in the middle of October. During the meeting, the regulator is expected to continue its tightening policy amid high inflation that hit a 14-year high in July. As the bank conducts monetary policy by guiding the exchange rate, we may see a stronger SGD soon.
However, let’s not forget that the world has turned to the USD these days. As a result, the Fed policy and the US inflation figures are the main determinants of the performance of USDSGD.
Technical Analysis
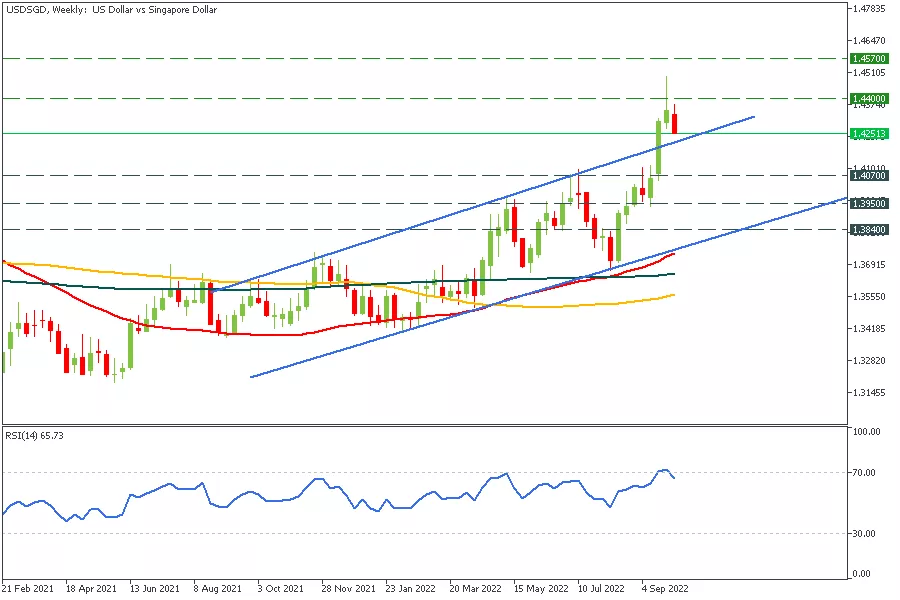
On the weekly chart, USDSGD has risen above 1.4400 but could not hold its position and corrected to the downside. After the retest of the upper border of the ascending channel, the pair may make another attempt to break the 1.44 resistance line.
If USDSGD breaks below the border, it will indicate a further slide towards the next support at 1.4070. After that, the support at 1.3950 will be in focus.
Conclusion
If you are looking for an exotic currency pair to trade, look at the USDSGD. Apart from other exotic pairs, USDSGD may provide interesting moves due to the optimistic fundamental picture of the Singapore economy.
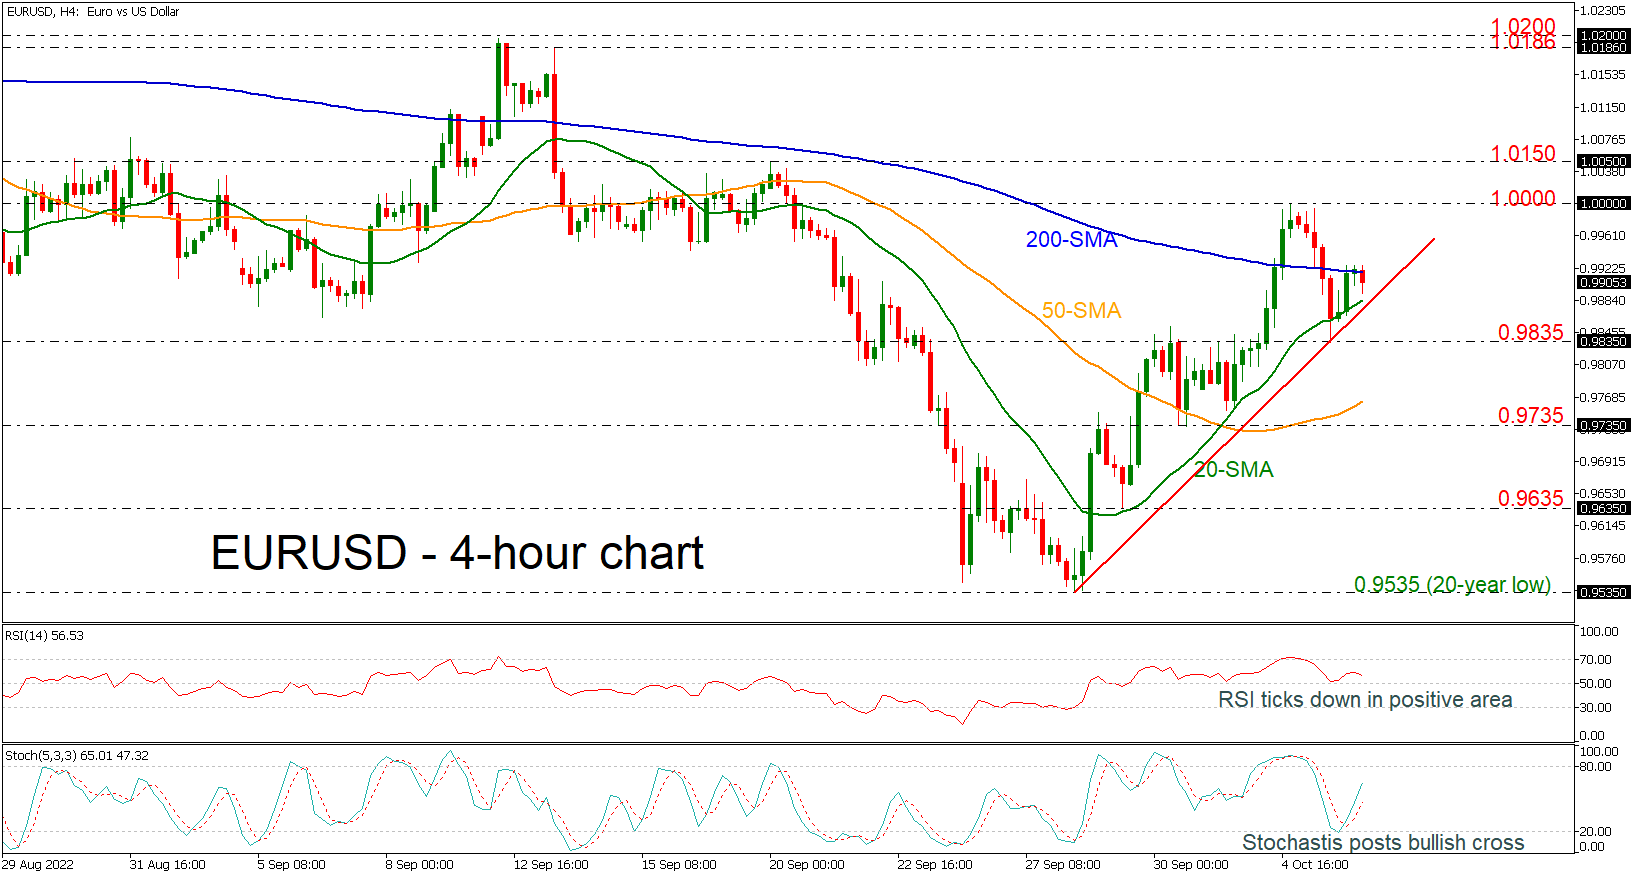
EURUSD Meets 200-Period SMA and Tests 0.9900
EURUSD is underperforming after the pullback off the 200-period simple moving average (SMA) around 0.9920. The pair is approaching the near-term uptrend line near the 0.9900 psychological mark and the 20-period SMA. The RSI is sloping south in the bullish area; however, the stochastic is still moving higher after the bullish cross within the %K and %D lines.
Should weakness extend below the uptrend line, support to downside movements could be initially detected within the 0.9835 barrier. Clearing that zone, the next stop could be around the 50-period SMA at 0.9765 and the 0.9735 support.
Alternatively, the pair needs to overcome the 200-period SMA to meet a key barrier between the parity level. The 1.0150 mark could act as resistance too before the 1.0186-1.0200 restrictive region.
In the short-term picture, the sentiment turned bullish after the price rebounded off the 20-year low of 0.9535. The positive slope in the 20-period SMA, which moves closer to the 200-period SMA, also adds optimism for a brighter outlook.
US initial jobless claims rose to 219k, above expectation
US initial jobless claims rose 29k to 219k in the week ending October 1, above expectation of 205k. Four-week moving average of initial claims rose 250 to 206.5k.
Continuing claims rose 15k to 1361k in the week ending September 24. Four-week moving average of continuing claims dropped 10k to 1371k.