

Sample Category Title
Euro Outlook: Why Price Caps Don’t Matter
In the last couple of days, the Euro has been drifting higher, back towards parity. It comes at a somewhat curious juncture, considering the context in the UK. Though, it should be pointed out that yesterday markets jumped higher on expectations that the Fed would pivot sooner than previously expected.
This isn't an unusual phenomenon for the markets, to get a dose of optimism after trending downward for over a month. US stocks hit a new low for the year, and bounced back. The dollar weakness would naturally help the Euro. But there's more going on here.
Not all spending is the same
Last week, the pound took a dive after the Chancellor announced plans for a fuel price cap that could cost up to £200B, and tax incentives that would potentially reduce the UK's tax revenue by £45B. This sent shockwaves through the market, affecting even the rate decision by the RBA, citing turmoil in the UK as one of the reasons for its surprise move to raise rates lower than anticipated.
Yet at the end of the week, Germany announced an energy price cap in the order of €200B, while the EU struggles to deal with surging prices. Yet there was no proportional reaction in the markets. Germany reaffirmed its commitment to the debt brake, suggesting possible austerity measures next year. In fact, the Euro got stronger, and there was no hint that the ECB would have to step in.
Germany can spend more
The debt-to-GDP ratio is an important aspect in how inflationary government spending is likely to be. Germany has a ratio just below the Maastricht guidelines of 59.8% (that's before the pandemic). The UK was much higher at 85.4%. This puts a limit on how high the central bank can raise rates without the cost to service the government's debt significantly impacting the budget. Thus, traders aren't as worried about German government spending.
The issue for the Euro, however, is the latest round of negotiations about expanding the capacity of other countries to maintain debt. Most EU countries are not only far from complying with Maastricht rules, but some are also over twice the allowed debt-to-GDP rate, such as Italy. When taken together, the Eurozone’s debt-to-GDP is higher than the UK's.
The future trends
While the ECB maintains a lower interest rate than the BOE, the debt issue isn't as noticeable. However, there are several indicators that rates will continue to rise, potentially more than in the UK. Inflation is still on the rise, the ECB is worried about "de-anchoring" expectations, and the Euro Zone's GDP grew by a healthy 4.1% last quarter, giving the central bank more headroom.
In other words, depending on how the economy evolves, the Euro is not immune from a market reaction similar to what happened to the cable. Probably not in the near term. But, if through the winter the economic situation worsens, governments could seek to increase spending to support consumers and businesses.
The EU likely won't have the same chaotic announcement with lack of details that drove a sudden drop in confidence, such as what happened in the UK. In other words, the move might not be as sudden, but it could be as large, and require intervention from the ECB.
USD/JPY Mid-Day Outlook
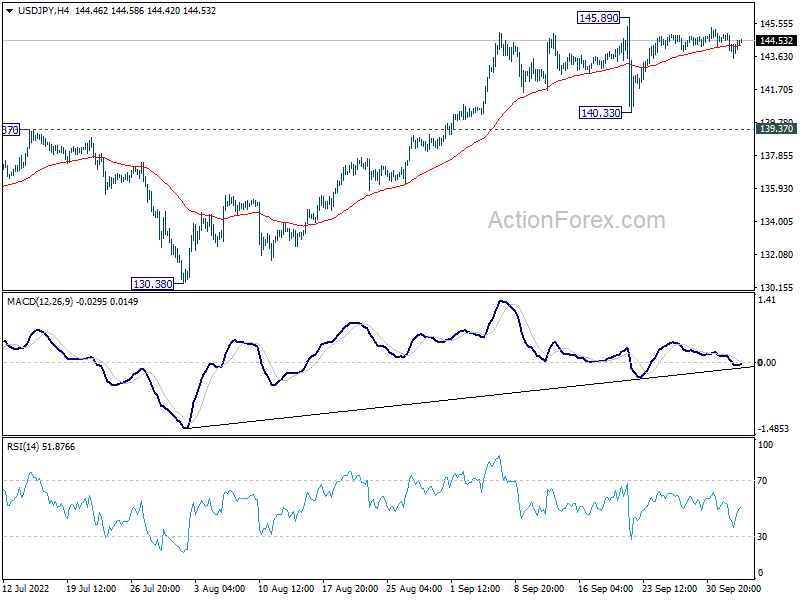
Daily Pivots: (S1) 144.06; (P) 144.67; (R1) 145.17; More...
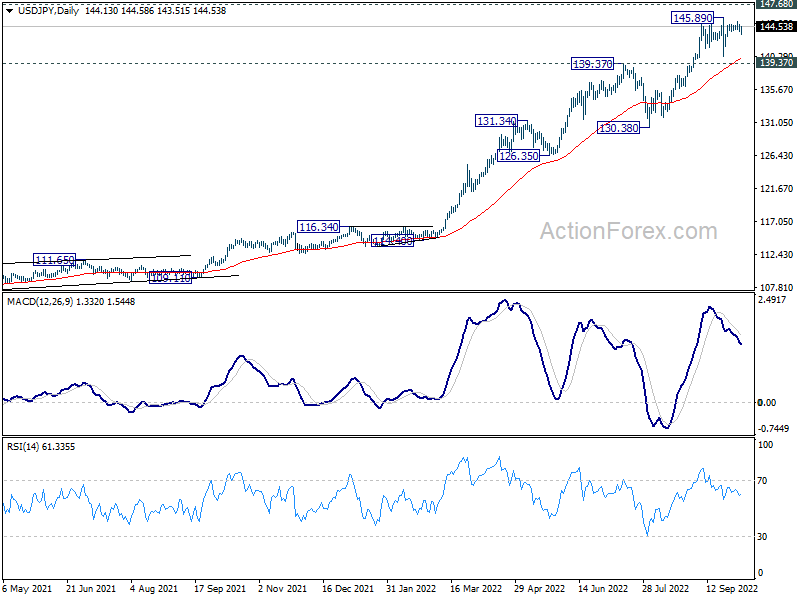
USD/JPY is staying in consolidation from 145.89 and intraday bias remains neutral. Further rally is expected as long as 139.37 resistance turned support holds. Break of 145.89 will target 147.68 long term resistance. On the downside, however, decisive break of 139.37 will confirm short term topping. Deeper decline would be seen back towards 130.38 support.
In the bigger picture, up trend from 101.18 is still in progress, as part of the whole up trend from 75.56 (2011 low). Further rise should be seen to 147.68 (1998 high). For now, break of 130.38 support is needed to be the first indication of medium term topping. Otherwise, outlook will stay bullish even in case of deep pull back.
USD/CHF Mid-Day Outlook
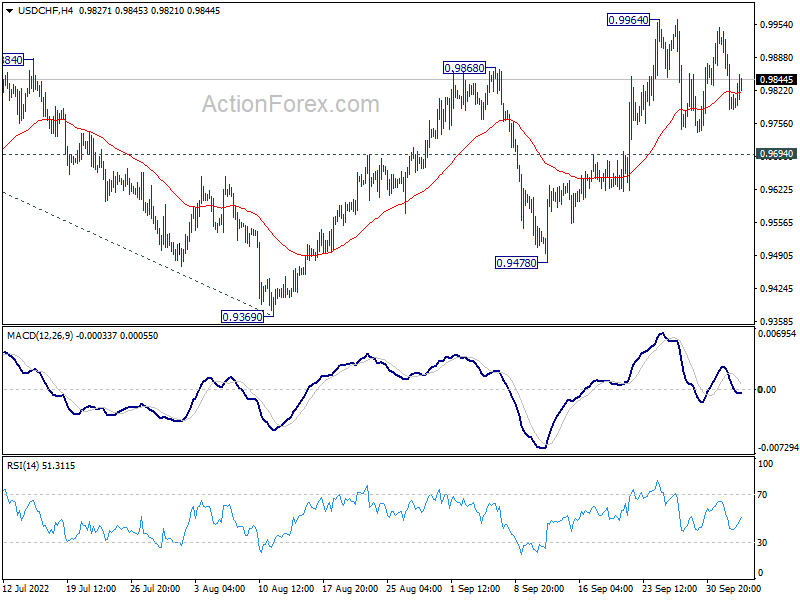
Daily Pivots: (S1) 0.9741; (P) 0.9842; (R1) 0.9898; More...
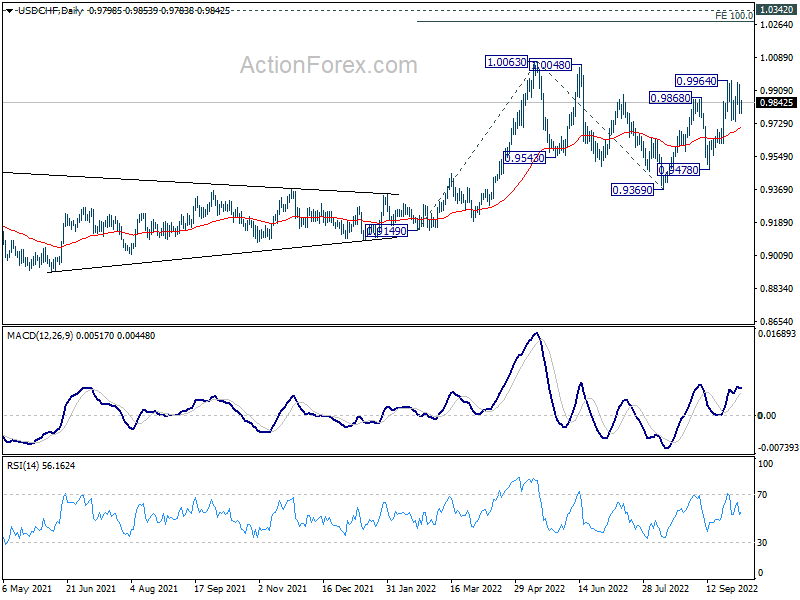
USD/CHF is still bounded in consolidation from 0.9964 and intraday bias remains neutral. Outlook is unchanged that further rally is in favor as long as 0.9694 support holds. On the upside, above 0.9964 will resume the rally from 0.9369 to retest 1.0063 high. On the downside, however, break of 0.9694 support will extend the corrective pattern from 1.0063 with another falling leg, towards 0.9478 support first.
In the bigger picture, current development suggests that up trend from 0.8756 (2021 low) is still in progress. Sustained break of 1.0063 will target 100% projection of 0.9149 to 1.0063 from 0.9369 at 1.0283, and then 1.0342 (2016 high). For now, this will remain the favored case as long as 0.9369 support holds, even in case of deep pull back.
GBP/USD Mid-Day Outlook
Daily Pivots: (S1) 1.1159; (P) 1.1247; (R1) 1.1408; More...
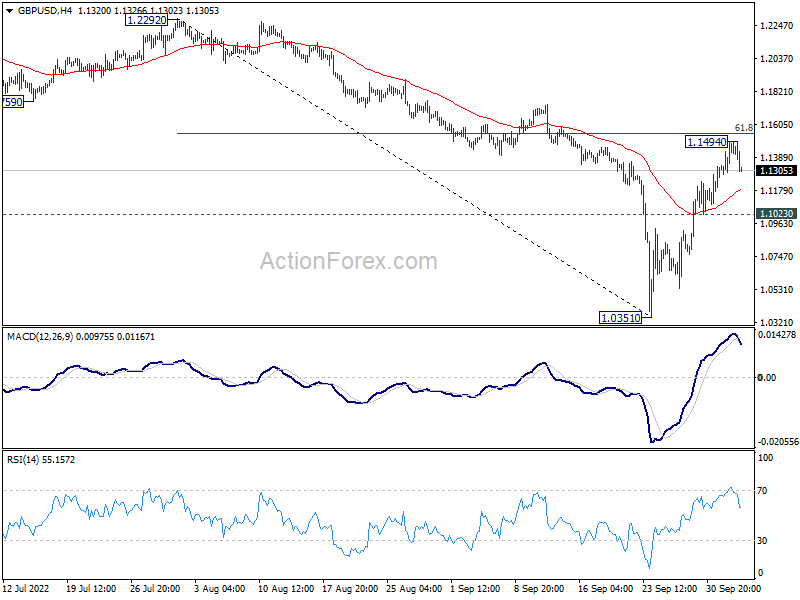
Intraday bias in GBP/USD is turned neutral with current retreat. On the downside, break of 1.1023 minor support will indicate that rebound from 1.0351 is over. Intraday bias will be back on the downside for retesting 1.0351. On the upside, firm break of 61.8% retracement of 1.2292 to 1.0351 at 1.1551 will pave the way to 1.2292 resistance.
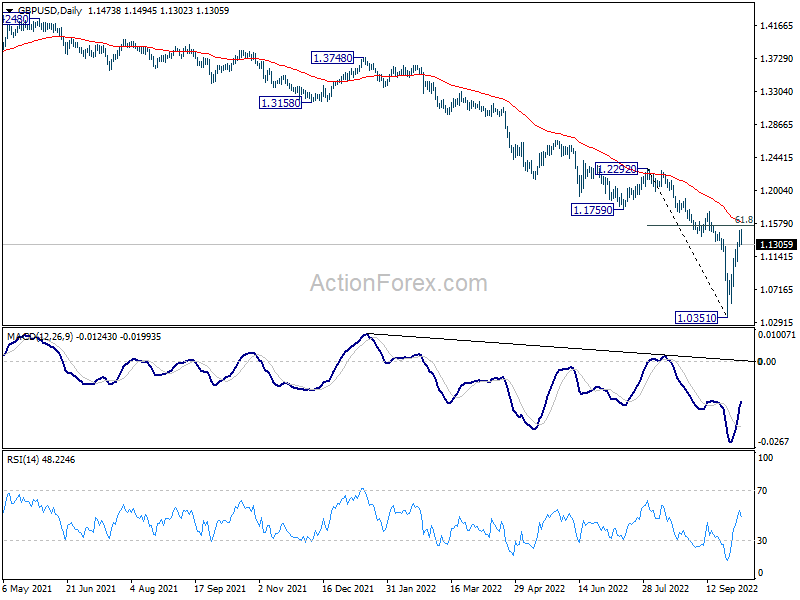
In the bigger picture, fall from 1.4248 (2018 high) is resuming long term down trend from 2.1161 (2007 high). Next target is 100% projection of 2.1161 to 1.3503 from 1.7190 at 0.9532. There is no scope of a medium term rebound as long as 1.1759 support turned resistance holds.
EUR/USD Mid-Day Outlook
Daily Pivots: (S1) 0.9862; (P) 0.9930; (R1) 1.0055; More...
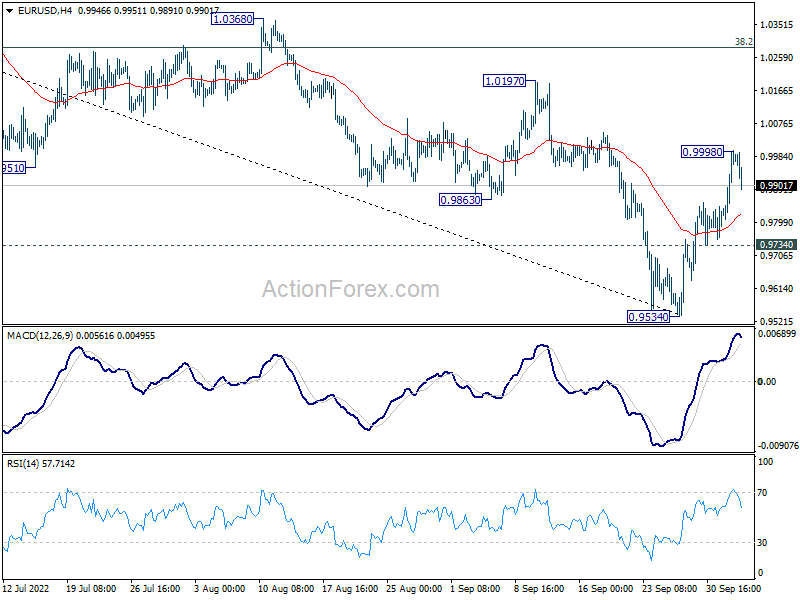
Intraday bias in EUR/USD is turned neutral first with current retreat. On the downside, break of 0.9734 minor support will suggest rejection by 55 day EMA (now at 1.0022), and medium term falling channel. Bias will be turned back to the downside for retesting 0.9534 low and then resume down trend. Nevertheless, considering bullish convergence condition in daily MACD, sustained break of 55 day EMA (now at 1.0022) will raise the chance of medium term bottoming at 0.9534. Further rally should then be seen to 38.2% retracement of 1.1494 to 0.9534 at 1.0283.
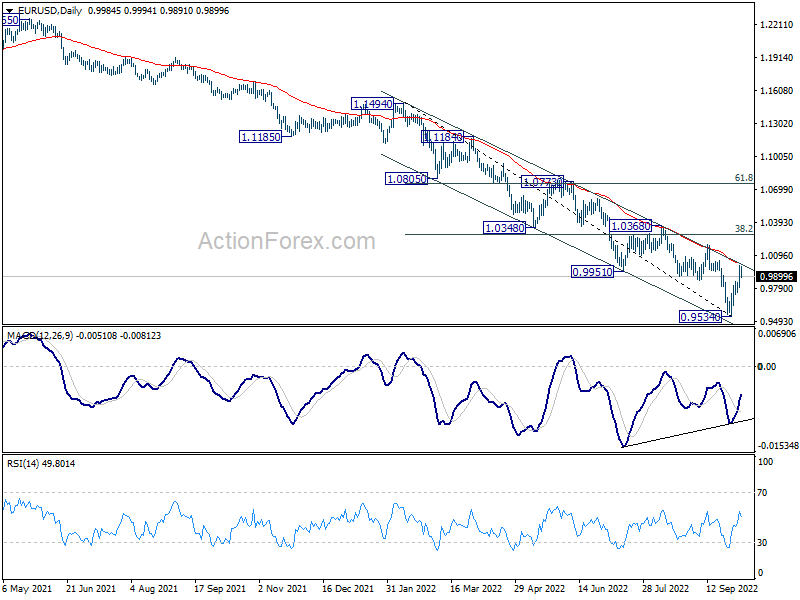
In the bigger picture, down trend from 1.6039 (2008 high) is still in progress. Next target is 100% projection of 1.3993 to 1.0339 from 1.2348 at 0.8694. In any case, break of 1.0197 resistance is needed to be the first sign of medium term bottoming. Otherwise, outlook will stay bearish even with strong rebound.
Dollar Recovers as Risk Round Lost Steam, Euro Failing Parity
This week's rebound in global stock markets is losing momentum, as major European indexes and US futures are trading lower. Dollar recovers and lead Yen and Swiss Franc higher. Meanwhile, the rebound in Sterling also appears to have exhausted. Aussie and Loonie are following the Pound and next weakest while Kiwi is supported by RBNZ rate hike earlier today. Also, it looks like Euro has failed parity against Dollar for now.
Technically, it's way to early to call for a trend reversal in stocks. For example, while DOW's rebound was impressive, it's kept well below 55 day EMA. Indeed, psychologically, if DOW couldn't firmly grip 30k handle for the rest of the week, the stage would be set for down trend resumption through 28715.85 low later in the month. Let's see.
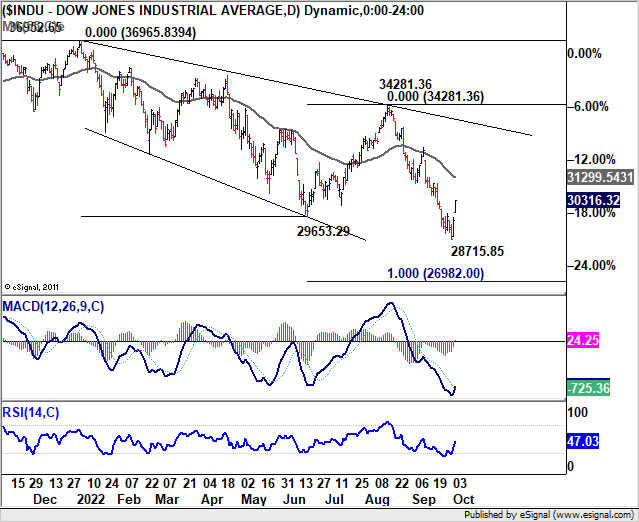
In Europe, at the time of writing, FTSE is down -0.74%. DAX is down -0.95%. CAC is down -0.65%. Germany 10-year yield rose 0.081 to 1.953. Earlier in Asia, Nikkei rose 0.48%. Hong Kong HSI rose 5.90%. Singapore Strait Times rose 0.46%. Japan 10-year JGB yield rose 0.0183 to 0.250.
US ADP employment grew 208k, steady job gains
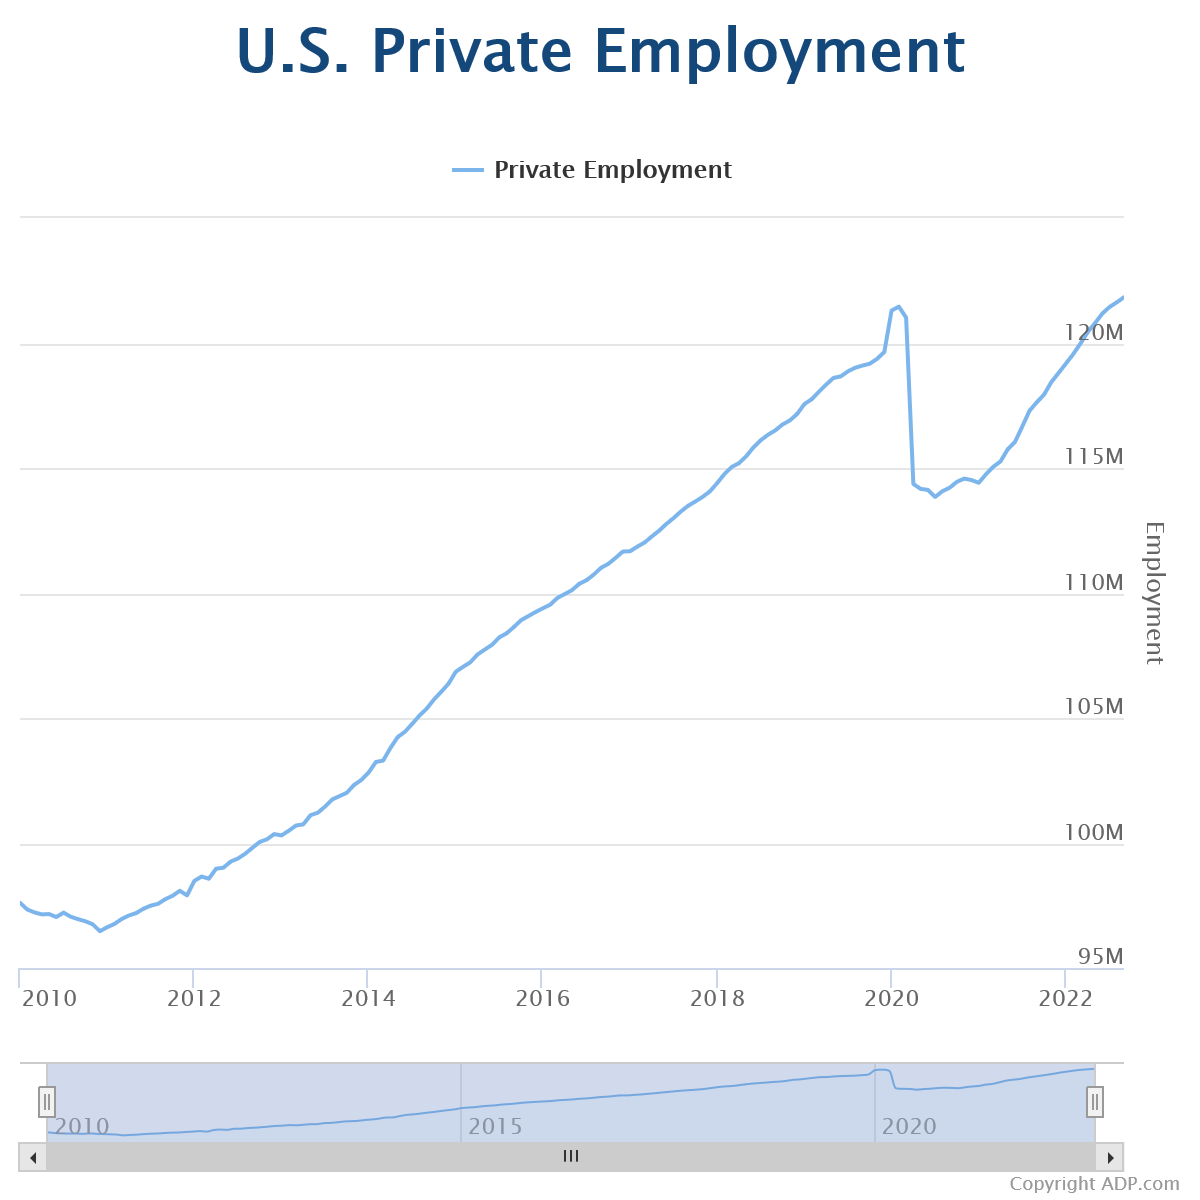
US ADP private sector employment grew 208k in September, slightly above expectation of 200k. BY sector, goods-producing jobs dropped -29k. But service-providing jobs rose 237k. By company size, small establishments added 58k, medium added 90k, large added 60k. Annual pay was up 7.8% yoy.
"We are continuing to see steady job gains," said Nela Richardson, chief economist, ADP. "While job stayers saw a pay increase, annual pay growth for job changers in September is down from August."
Germany Ifo: Wave of inflation isn't about to subside
According to an Ifo survey, price expectations of German businesses rose from 48.1 to 53.5. The balance is obtained by subtracting the percentage of companies that want to lower their prices from the percentage of those that want to raise their prices.
For food industry, the indicator rose further from 96.9 to 100, meaning that a 100% of food companies are expecting to raise prices.
"Unfortunately, this probably means the wave of inflation isn't about to subside," says Timo Wollmershäuser, Head of Forecasts at ifo. "Especially when it comes to gas and electricity, the price pipeline is not yet exhausted."
Eurozone PMI composite finalized at 20-mth low, hopes of avoiding recession further dashed
Eurozone PMI Services was finalized at 48.8 in September, down from August's 49.8, a 19-month low. PMI Composite was finalized at 48.1, down from prior month's 48.9, a 20-month low.
Looking at some member state, Ireland PMI Composite rose to 52.2 while France rose to 51.2. But Spain dropped to 48.4 (8-month low). Italy dropped to 47.6 (20-month low). Germany dropped to 45.7 (28-month low).
Chris Williamson, Chief Business Economist at S&P Global Market Intelligence said: "Any hopes of the eurozone avoiding recession are further dashed by the steepening drop in business activity signalled by the PMI. Not only is the survey pointing to a worsening economic downturn, but the inflation picture has also deteriorated, meaning policymakers face an increasing risk of a hard landing as they seek to rein in accelerating inflation.
UK PMI services finalized at 50.0, energy crisis hit business and consumer spending
UK PMI Services was finalized at 50.0 in September, down from August's 50.9, weakest reading since February 2021. PMI Composite was finalized at 49.1, down from prior month's 49.6, lowest since January 2021.
Tim Moore, Economics Director at S&P Global Market Intelligence: "September data highlighted an absence of growth in the UK service sector for the first time in 19 months as the energy crisis continued to hit business and consumer spending.... Service sector businesses trimmed their growth expectations to the lowest seen for nearly two-and-a-half years in September, which survey respondents linked to concerns about falling disposable income and the unfavourable global economic outlook."
RBNZ hikes by 50bps, considered 75bps
RBNZ raises Official Cash Rate by 50bps 3.50% as widely expected. In the summary of record it's noted that the Committee considered whether to hike by 50bps or 75bps, but decided that 50bps was appropriate at this meeting.
In the statement, RBNZ noted that domestic spending has remained "resilient". Employment levels are "high" while productivity capacity is "constrained" by labor shortages. wage pressures are "heightened". Also, "spending continues to outstrip the capacity to supply goods and services, with a range of indicators continuing to highlight broad-based pricing pressures."
EUR/USD Mid-Day Outlook
Daily Pivots: (S1) 0.9862; (P) 0.9930; (R1) 1.0055; More...
Intraday bias in EUR/USD is turned neutral first with current retreat. On the downside, break of 0.9734 minor support will suggest rejection by 55 day EMA (now at 1.0022), and medium term falling channel. Bias will be turned back to the downside for retesting 0.9534 low and then resume down trend. Nevertheless, considering bullish convergence condition in daily MACD, sustained break of 55 day EMA (now at 1.0022) will raise the chance of medium term bottoming at 0.9534. Further rally should then be seen to 38.2% retracement of 1.1494 to 0.9534 at 1.0283.
In the bigger picture, down trend from 1.6039 (2008 high) is still in progress. Next target is 100% projection of 1.3993 to 1.0339 from 1.2348 at 0.8694. In any case, break of 1.0197 resistance is needed to be the first sign of medium term bottoming. Otherwise, outlook will stay bearish even with strong rebound.
Economic Indicators Update
| GMT | Ccy | Events | Actual | Forecast | Previous | Revised |
|---|---|---|---|---|---|---|
| 01:00 | NZD | RBNZ Interest Rate Decision | 3.50% | 3.50% | 3.00% | |
| 06:00 | EUR | Germany Trade Balance (EUR) Aug | 1.2B | 4.0B | 5.4B | 3.4B |
| 06:45 | EUR | France Industrial Output M/M Aug | 2.40% | -0.30% | -1.60% | |
| 07:45 | Italy | Italy Services PMI Sep | 48.8 | 49.2 | 50.5 | |
| 07:50 | EUR | France Services PMI Sep F | 52.9 | 53 | 53 | |
| 07:55 | EUR | Germany Services PMI Sep F | 45 | 45.4 | 45.4 | |
| 08:00 | EUR | Eurozone Services PMI Sep F | 48.8 | 50.2 | 48.9 | |
| 08:30 | GBP | Services PMI Sep F | 50 | 49.2 | 49.2 | |
| 12:15 | USD | ADP Employment Change Sep | 208K | 200K | 132K | 185K |
| 12:30 | USD | Trade Balance (USD) Aug | -67.4B | -67.8B | -70.6B | |
| 12:30 | CAD | Building Permits M/M Aug | 11.90% | -0.80% | -6.60% | -7.30% |
| 12:30 | CAD | International Merchandise Trade (CAD) Aug | 1.5B | 3.5B | 4.1B | 2.4B |
| 13:45 | USD | Services PMI Sep F | 49.2 | 49.2 | ||
| 14:00 | USD | ISM Services PMI Sep | 56 | 56.9 | ||
| 14:30 | USD | Crude Oil Inventories | 1.7M | -0.2M |
US ADP employment grew 208k, steady job gains
US ADP private sector employment grew 208k in September, slightly above expectation of 200k. BY sector, goods-producing jobs dropped -29k. But service-providing jobs rose 237k. By company size, small establishments added 58k, medium added 90k, large added 60k. Annual pay was up 7.8% yoy.
"We are continuing to see steady job gains," said Nela Richardson, chief economist, ADP. "While job stayers saw a pay increase, annual pay growth for job changers in September is down from August."
NZD Has Responded to RBNZ’s Hawkishness
Unlike the RBA yesterday, the Reserve Bank of New Zealand met expectations by raising its key rate by 50 points to 3.5%. Having started raising the rate a year ago, the RBNZ accelerated the move from 25 to 50 points in April, bringing it to the cyclical highs of 2014-15.
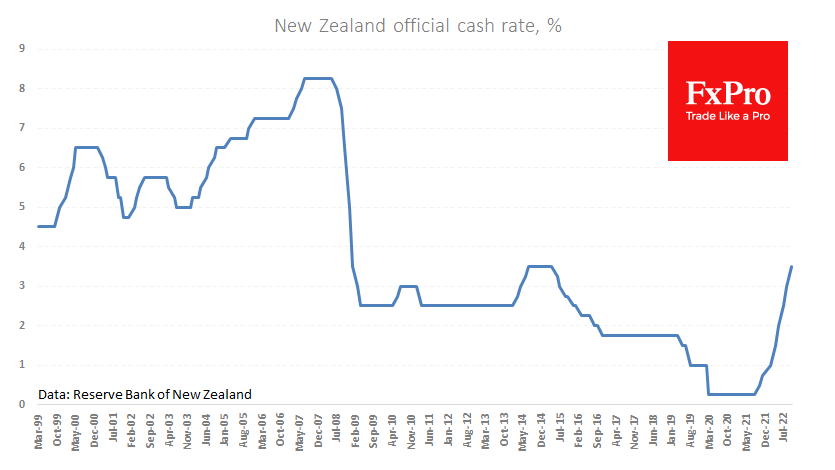
The Reserve Bank cites too high core inflation (without food and energy) and labour shortages as reasons for further rate hikes. And here, it is worth remembering that at its peak in 2007/08, New Zealand’s key rate reached 8.25%, and cyclical lows in 2002 and 2003 were 4.75% and 5.00%, respectively. In other words, the New Zealand economy is more suited to high rates than many.
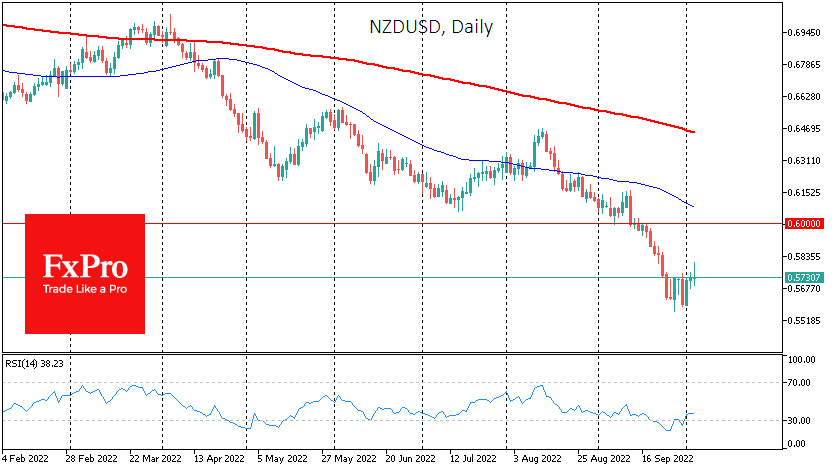
The NZDUSD is gaining 2.6% so far this week and feels quite comfortable since the beginning of the day, in contrast to the pullback in the dollars on Wednesday morning. On the daily charts, the two September lows formed a double bottom. From roughly the same levels, we saw an intensification of buying in the Kiwi in March 2020.
That said, the NZDUSD position remains quite fragile and the initial bounce in the pair could quickly stall if the bears remain the dominant force in the world markets. Cautious traders to confirm a change of trend from bearish to bullish should wait for the pair to strengthen from the current 0.5740 to levels above 0.6000, where the 50-day average and the former support are concentrated besides the beautiful round level.
WTI Oil: Crude Oil Holds Bullish Stance ahead of OPEC+ Decision
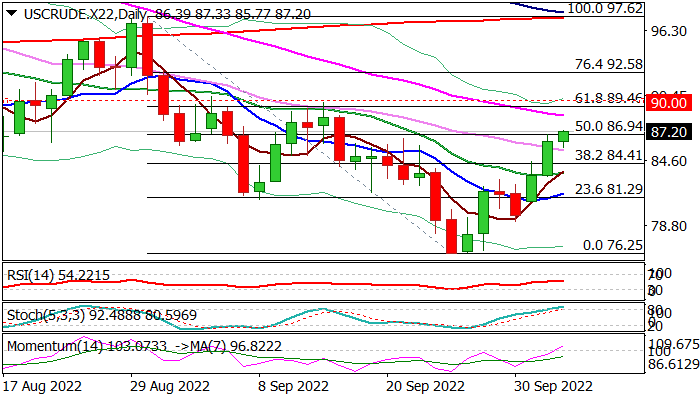
The WTI oil is consolidating within a narrow range on Wednesday, after the recent recovery rally peaked at $86.94 (the highest since Sep 15), taking a breather ahead of today’s OPEC+ meeting, which is expected to provide fresh signals.
The cartel had a proposal of stronger production cut on its table for some time, with expectations for a 2 million barrels per day cut to boost oil prices.
The recent discussions between the OPEC+ member countries lacked consensus, as some producers are unable reach their production quotas, while the United States are opposing the plan.
In addition, the US prepared a letter to order stopping exports in attempts to keep oil prices lower ahead of mid-term elections, though faced strong opposition from US oil trade groups, which urge the administration not to proceed with the plan.
Technical view shows improving daily studies, as daily MA’s (10/20/30) turned into bullish setup and 14-d momentum emerged into positive territory that support near-term action.
Bulls probe through 50% retracement of $9762./$76.25 bear-leg, close above which would generate bullish signal and open way for attack at $89.46/$90.00 pivots (Fibo 61.8% / psychological).
Res: 88.67; 89.46; 90.00; 92.58.
Sup: 85.54; 84.41; 83.30; 81.68.
Promising Stock Rally, But it Needs Fed Support
S&P500 index futures are trading 6% above the lows set at Monday’s start of the day. Such a solid start for the new month, quarter and financial year in the US is helped in no small part by the low base, as the index ended September at the lows since November 2020, below the 3,600 mark.
The powerful two-day rally suggests that we could see the start of more than just a portfolio shakeout at the start of a new period.
On the bulls’ side, there is another revival of hopes that the monetary watchdogs in the USA and other developed countries will slow down their policy tightening.
The “worse is better” rule was in full effect in the markets yesterday. Markets treat the sharpest drop in job openings as a possible excuse for the Fed to move from a 75-point rate hike to a 50-point step. However, such hopes are overly speculative for a couple of days. There will be official labour market data to which the Fed is paying much more attention.
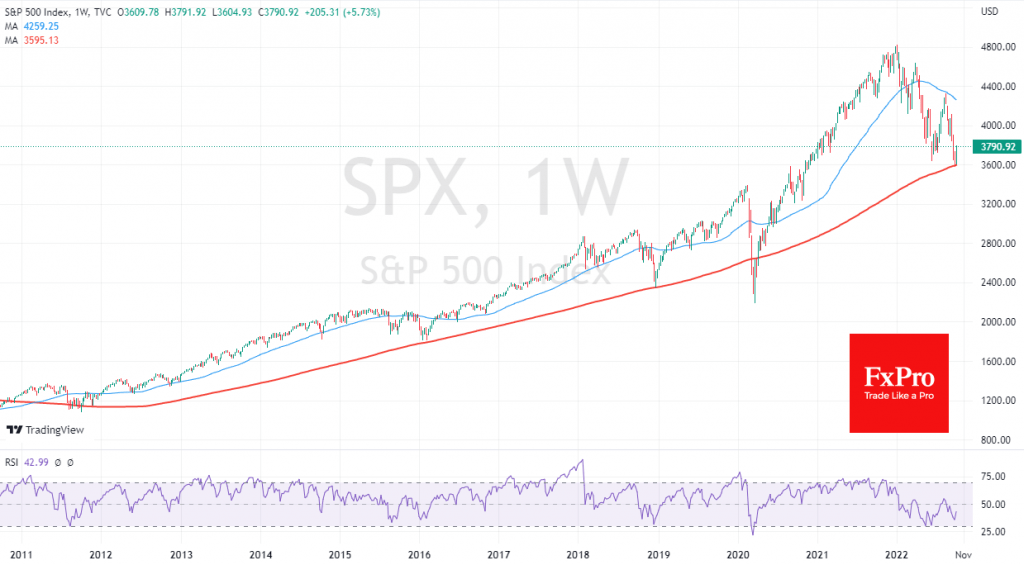
Nevertheless, we note that the buyers in the S&P500 appeared just after touching the significant 200-week moving average, which was near the 3600 level. The market bounced back from this curve in 2018, 2016 and 2011. A correction towards the 200-week moving average made the stock an attractive buy in all those cases and in the long period from 1980 to 2001. This is how the market tries to stay within the patterns formed after the global financial crisis. In 2020, the panic of covid uncertainty took the market lower, followed by a robust response from governments and central banks that returned the markets to growth within weeks.
In addition to the 200-week average, the stock was helped by the oversold conditions over the past few months, where so many sellers were piling up that it was difficult to find new ones.
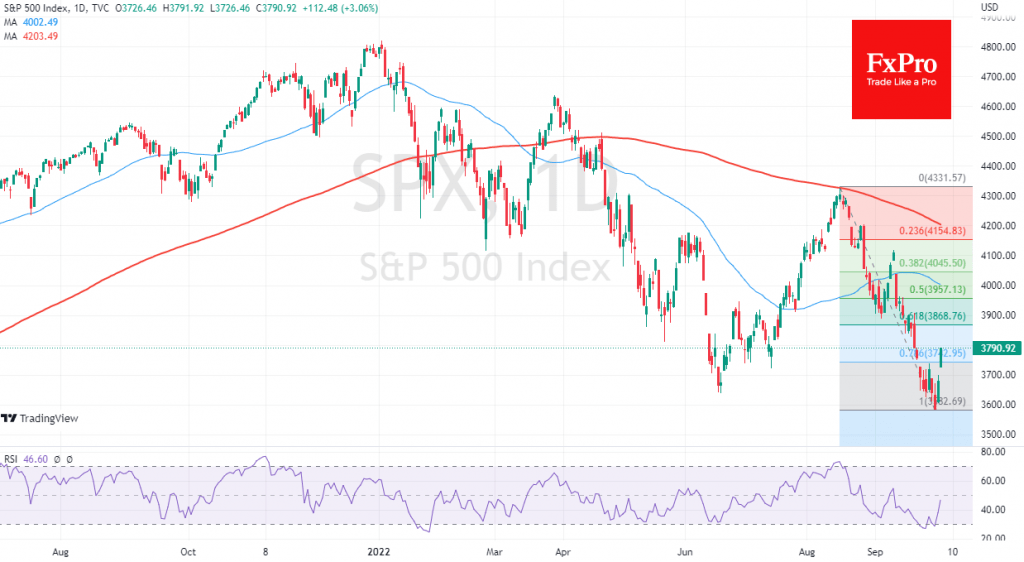
However, the bull market has yet to prove itself. Moving from the weekly to the daily chart, we can see that the last sell-off started in mid-August and failed to get above the 200-day MA. The first technically solid sign of a break of this trend would be for the S&P500 to consolidate above 3900 (61.8% of momentum).
The potential buyers should pay more attention to the index’s performance around 4000, where the 50-day average is hovering, and around 4200, with the 200-day average near. Only firm buying from these levels will indicate that we are witnessing a fundamental reversal of the market sentiment and not a rally in the bear market. In turn, only a change in the tone of the Fed and other central banks could perhaps support such buying.