Sample Category Title
AUD/USD Daily Report
Daily Pivots: (S1) 0.6352; (P) 0.6438; (R1) 0.6484; More...
Intraday bias in AUD/USD remains neutral for the moment. Consolidation from 0.6362 should extend, and another recovery cannot be ruled out. But upside should be limited well below 0.6698 support turned resistance. Break of 0.6362 will resume larger down trend to 100% projection of 0.7660 to 0.6680 from 0.7135 at 0.6155.
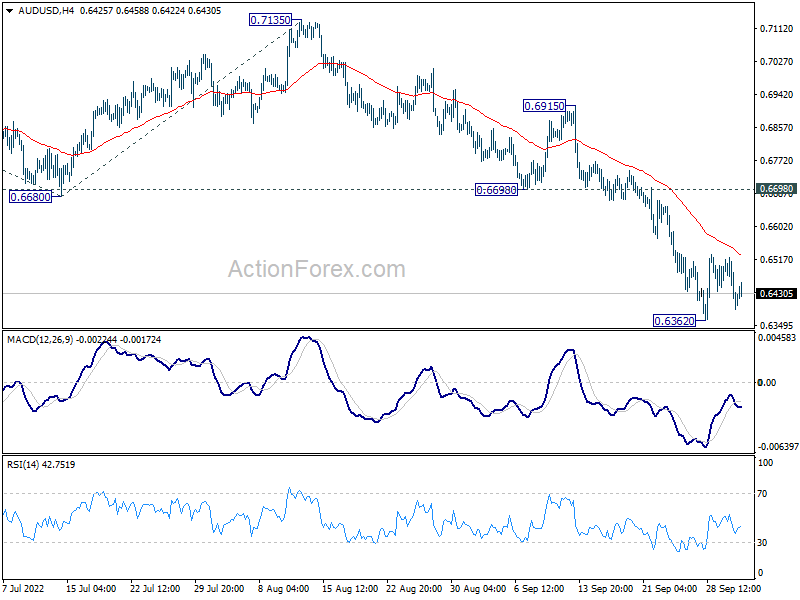
In the bigger picture, down trend form 0.8006 (2021 high) is expected to continue as long as 0.7135 resistance holds. With 61.8% retracement of 0.5506 (2020 low) to 0.8006 at 0.6461 firmly taken out, next target is 0.5506 low. Medium term momentum will now be closely monitored to gauge the chance of break of 0.5506.
USD/CAD Daily Outlook
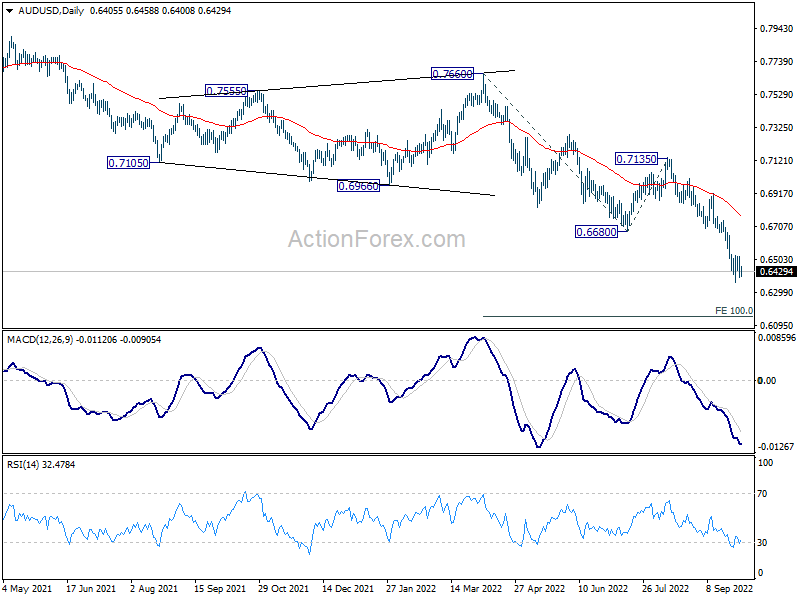
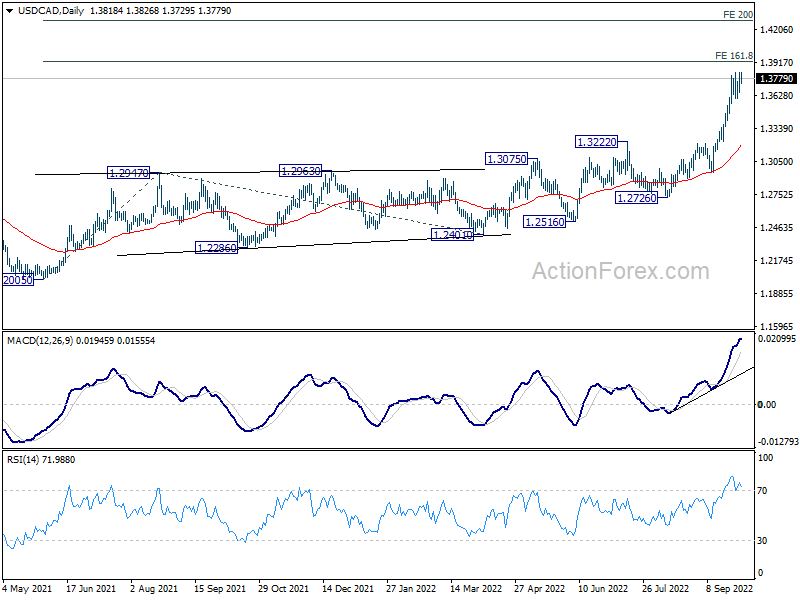
Daily Pivots: (S1) 1.3713; (P) 1.3776; (R1) 1.3895; More...
Intraday bias in USD/CAD stays on the upside at this point. Current up trend should target 161.8% projection of 1.2005 to 1.2947 from 1.2401 at 1.3925. Firm break there will target 200% projection at 1.4285. On the downside, break of 1.3601 minor support is needed to indicate short term topping. Otherwise, outlook will stay bullish in case of retreat.
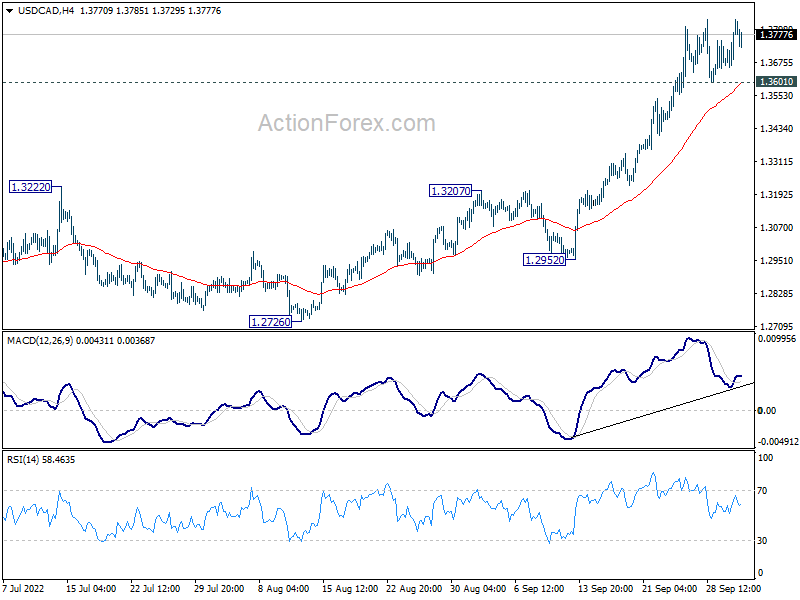
In the bigger picture, up trend from 1.2005 (2021 low) is still in progress. Based on current impulsive momentum, it could be resuming long term up trend from 0.9056 (2007 low). Whether it is or it isn't, retest of 1.4689 (2016 high) should be seen next. This will now remain the favored case as long as 1.3222 resistance turned support holds.
EUR/GBP Daily Outlook
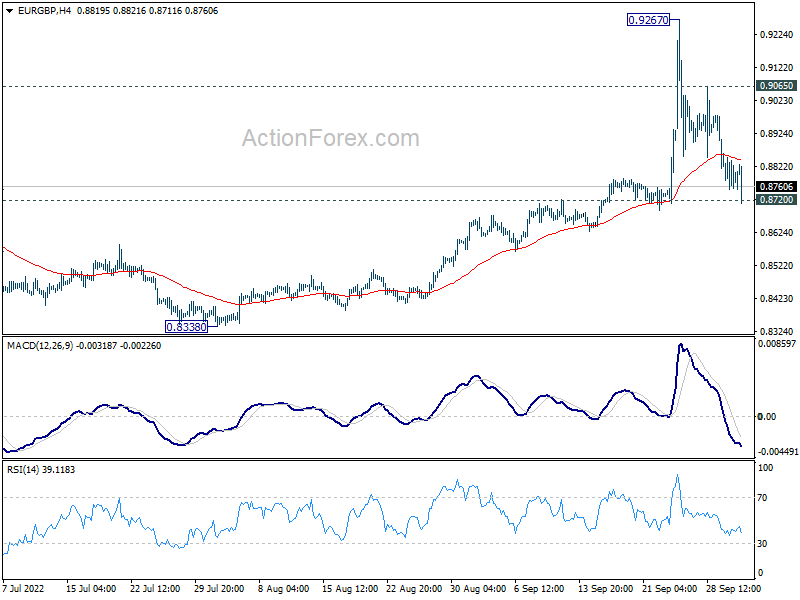
Daily Pivots: (S1) 0.8741; (P) 0.8796; (R1) 0.8838; More...
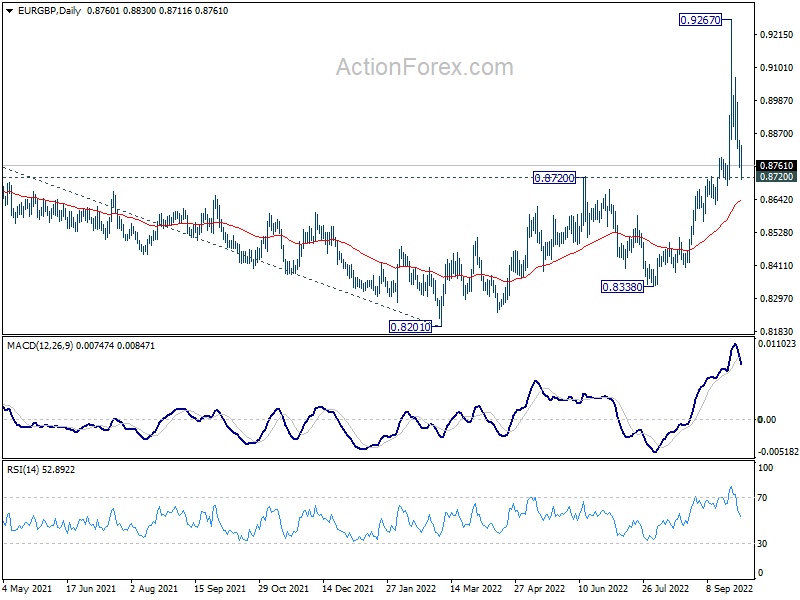
Intraday bias in EUR/GBP stays neutral with focus on 0.8720 resistance turned support. Firm break of 0.8720 will argue that whole rise from 0.8201 has completed in three-wave corrective pattern, and target 55 day EMA (now at 0.8636) first. Strong rebound from current level, will retain near term bullishness. Break of 0.9065 minor resistance will bring retest of 0.9267.
In the bigger picture, as long as 0.8720 resistance turned support holds, rise from 0.8201 is seen as resuming larger up trend from 0.6935 (2015 low). Break of 0.9499 (2020 high) should be seen at a later stage. However, firm break of 0.8720 will argue that sideway pattern from 0.9499 is extending with another falling leg instead.
EUR/AUD Daily Outlook
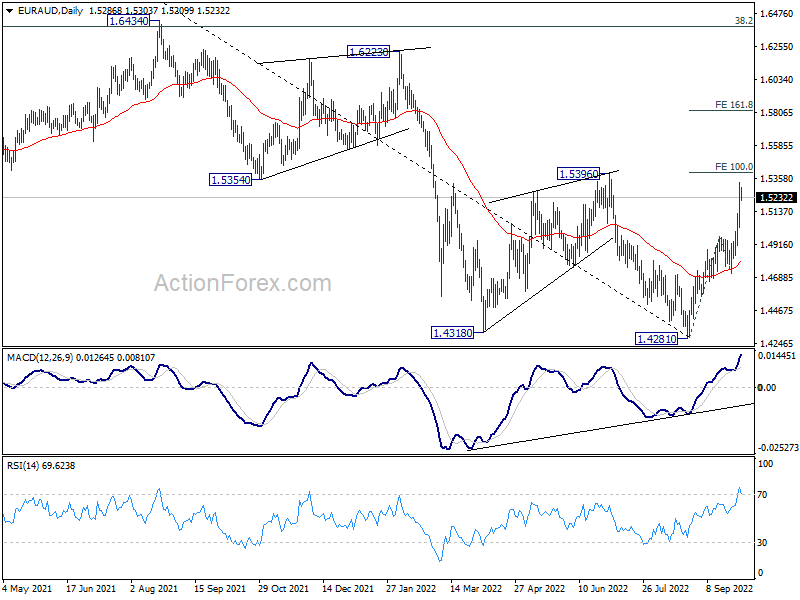
Daily Pivots: (S1) 1.5122; (P) 1.5230; (R1) 1.5424; More...
Intraday bias in EUR/AUD stays on the upside for the moment. Rise from 1.4281 should target 100% projection of 1.4281 to 1.4965 from 1.4716 at 1.5400, which is close to 1.5396 key resistance. Firm break there will carry larger bullish implication. Next target is 161.8% projection at 1.5823. On the downside, below 1.5132 minor support will turn intraday bias neutral first.

In the bigger picture, current development raises the chance of medium term bottoming at at 1.4281, on bullish convergence condition in daily MACD. Firm break of 1.5396 will bring stronger rally back to 1.6434 key resistance next. Nevertheless, rejection by 1.5396 will maintain medium term bearishness for another fall through 1.4281 at a later stage.
EUR/CHF Daily Outlook
Daily Pivots: (S1) 0.9589; (P) 0.9636; (R1) 0.9721; More....
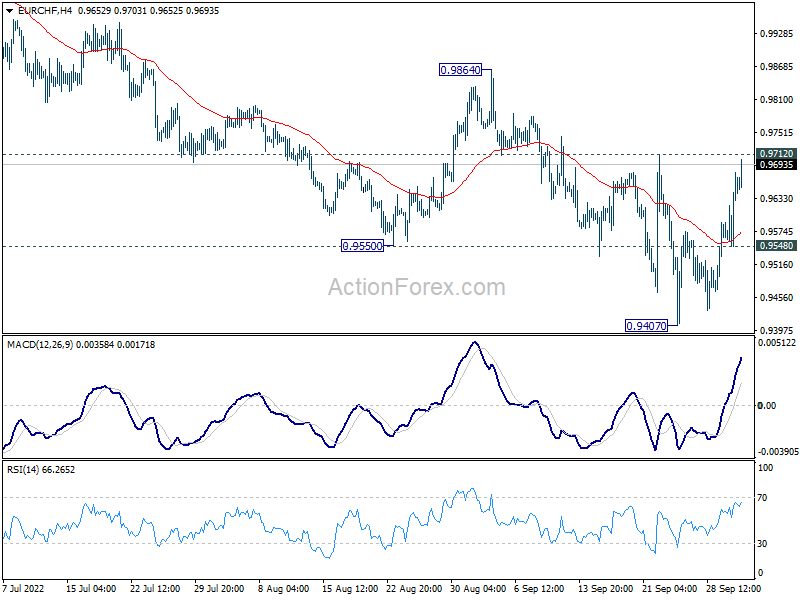
Intraday bias in EUR/CHF stays neutral first with focus on 0.9712 resistance. Decisive break there will argue that fall from 0.9864 has completed totally at 0.9407, and bring stronger rally back to this résistance. Further break there will carry larger bullish implication. Nevertheless, break of 0.9548 minor support will retain near term bearishness, and bring retest of 0.9407 low first.
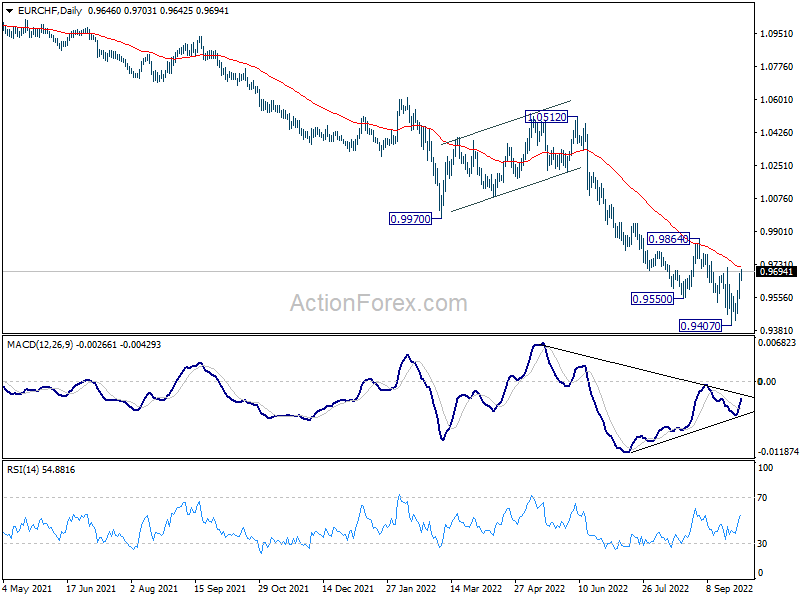
In the bigger picture, as long as 0.9864 resistance holds, long term down trend from 1.2004 (2008 high) is expected to continue. Next target is 138.2% projection of 1.2004 to 1.0505 to 1.1149 at 0.9033. However, firm break of 0.9864 will indicate medium term bottoming, on bullish convergence condition in daily MACD. Stronger rally would then be seen back to 55 week EMA (now at 1.0188).
EUR/JPY Daily Outlook
Daily Pivots: (S1) 141.03; (P) 141.66; (R1) 142.53; More....
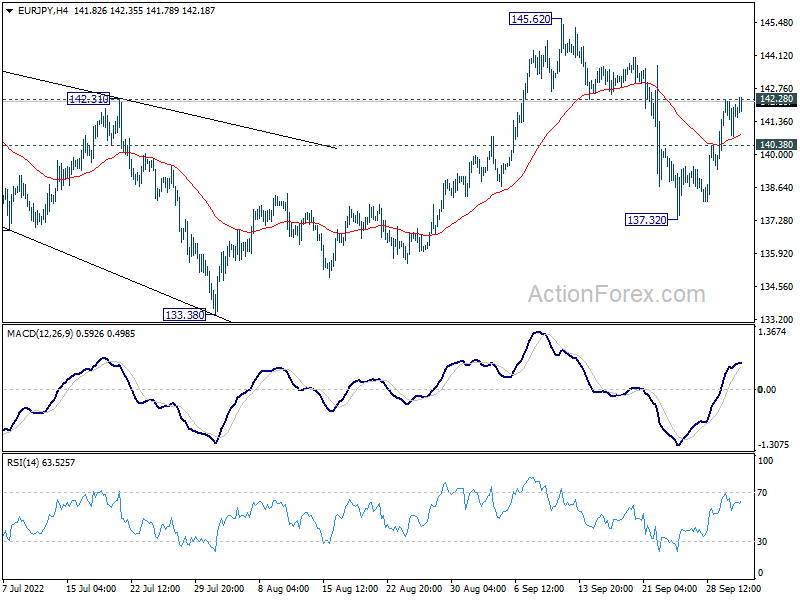
Intraday bias in EUR/JPY stays neutral first, with focus on 142.28 resistance. Firm break there will indicate that the pull back from 145.62 has completed, and bring stronger rally to retest this high. On the downside, though, break of 140.38 minor support will turn bias back to the downside, to resume the fall from 145.62 through 137.32 support.
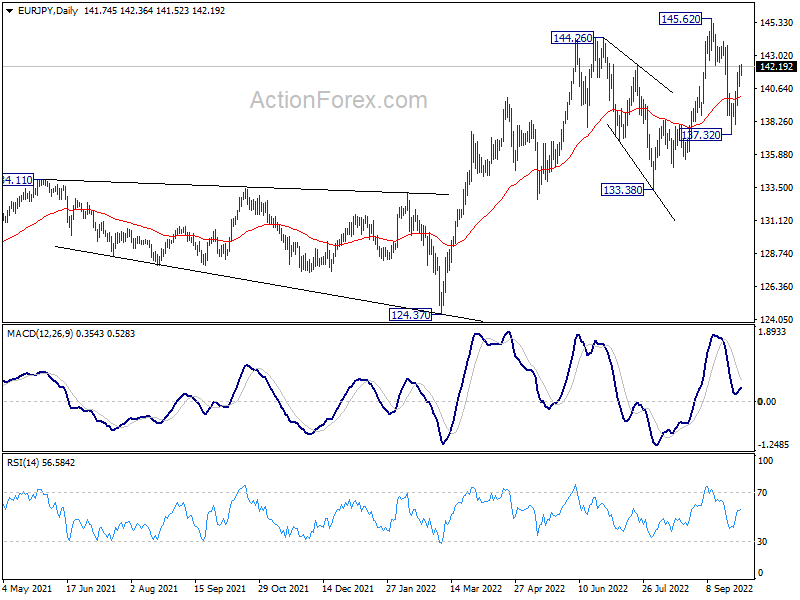
In the bigger picture, as long as 133.38 support holds, the up trend from 114.42 (2020 low) could still extend through 145.62 high. In that case, next target is 149.76 (2015 high). However, sustained break of 133.38 will be a sign of medium term bearish reversal and bring deeper fall to 124.37 support first.
GBP/JPY Daily Outlook
Daily Pivots: (S1) 159.91; (P) 161.05; (R1) 162.65; More...
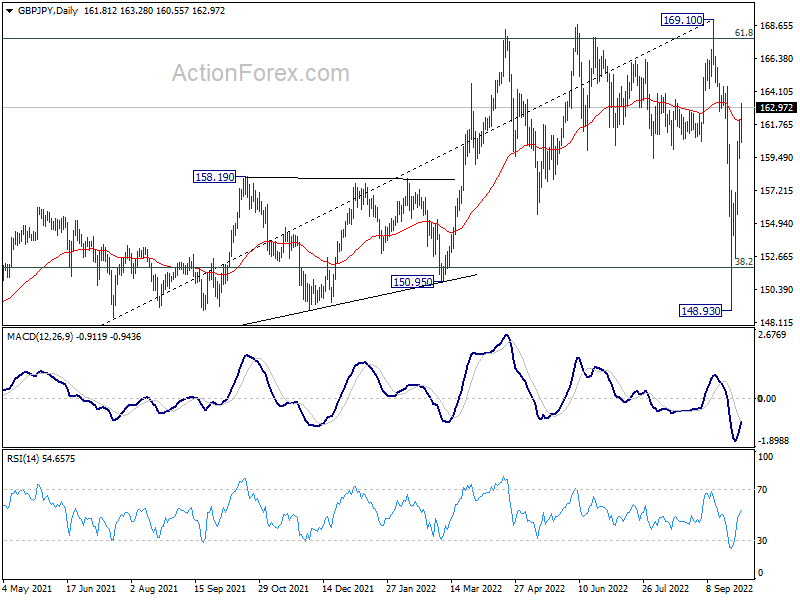
Intraday bias in GBP/JPY remains mildly on the upside as rebound from 148.93 extends higher. Further rally should be seen to retest 169.10 high. Strong resistance could be seen there to limit upside, at least on first attempt. On the downside, below 159.41 minor support will turn intraday bias neutral first.
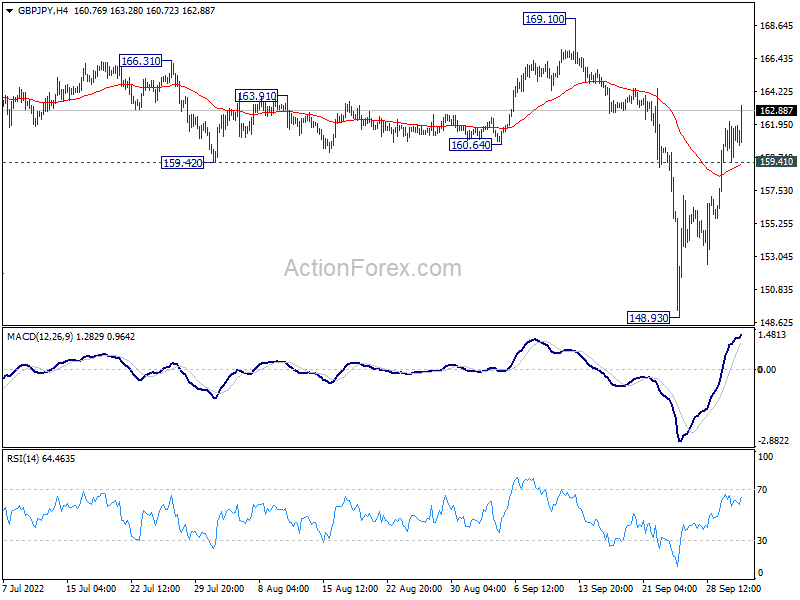
In the bigger picture, strong support from 38.2% retracement of 123.94 to 169.10 at 151.84 suggests that price actions from 169.10 are developing into a corrective pattern only. That is, rise from 123.94 (2020 low) should resume at a later stage. This will now remain the favored case as long as 148.93 support holds.
Sterling Rises on PM Truss U-Turn Rumor
Sterling strengthens entering into European session, on rumors that UK Prime Minister Liz Truss to preparing to do a U-turn on tax and spending cuts. The talks came after Truss faced heavy scrutiny from Tory rebellions at the Conservative Party Conference. Markets are steady elsewhere, though. Traders are holding their bets for now, and await RBA and RBNZ rate hikes, as well as US heavy weight data in ISM and NFP later in the week.
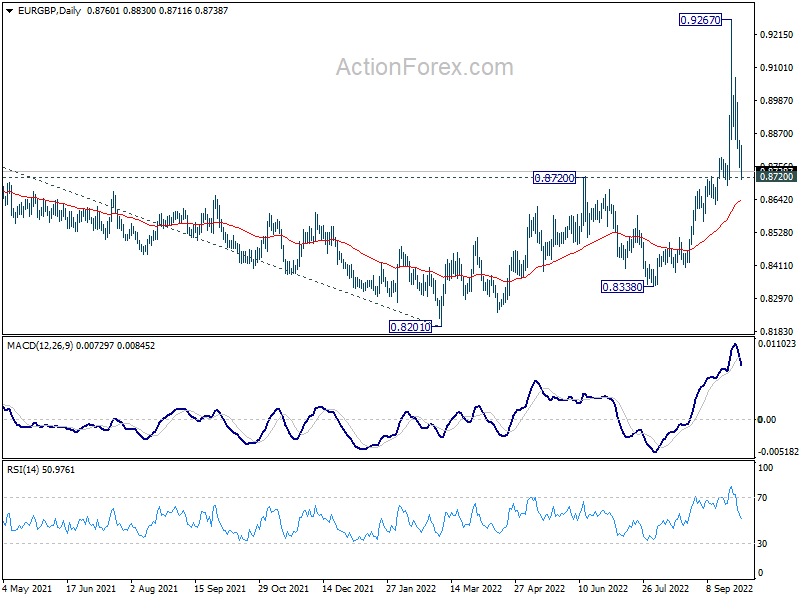
Technically, one immediate focus in EUR/GBP's reaction to 0.8720 resistance turned support. Sustained break there will argue that rise from 0.8201 has completed at 0.9267 as a three-wave move. That would in turn argue that long term sideway pattern is extending with another falling leg. Deeper decline would be see to 55 day EMA (now at 0.8636) and below. Such development, if happens, would provide support the to Pound against other currencies.
In Asia, Nikkei closed up 0.68%. Hong Kong HSI is down -1.27%. Singapore Strait Times is down -0.39%. Japan 10-year JGB yield is down -0.0091 at 0.243.
BoJ: Upside risks of inflation to be examined humbly and without any preconceptions
In the summary of opinions of BoJ's September 21-22 meeting, it's noted that risks of "consumer prices deviating significantly upward from the baseline scenario, including the impact of foreign exchange rates, needs to be examined humbly and without any preconceptions."
But while a "certain degree of upside risk to prices" exists, there is a "long way to go" to achieve 2% inflation target in a "sustainable and stable manner". Output gap has been "negative", unemployment rate and active active job openings-to-applicants ratio "have not returned to pre-pandemic levels". Surge in energy and raw material prices has brought about an "outflow of income" from Japan. It is "appropriate" to continue with the current monetary easing.
Regarding exchange rate, one opinion noted that " further depreciation of the yen is partly due to differences in the direction of monetary policy between Japan and other economies.. the Bank needs to carefully explain the significance of continuing with the current monetary easing."
Japan business outlook deteriorated in Q3
Japan Tankan large manufacturing index dropped from 9 to 8, below expectation of 11. That's the third straight quarter of deterioration. Non-manufacturing index improve slightly from 13 to 14, above expectation of 13, and rise for the second straight quarter.
Large manufacturing outlook dropped from 10 to 9, below expectation of 11. Non-manufacturing outlook also deteriorated from 13 to 11, below expectation of 15.
Nevertheless, large companies are expected to increase capital expenditure by 21.5% in the current fiscal year ending March 2023, above expectation of 18.8%.
Meanwhile, companies expect inflation to hit 2.6% a year from now, and 2.1% three years ahead. Five years ahead inflation is also projected at 2.0%, highest since data became available in 2014.
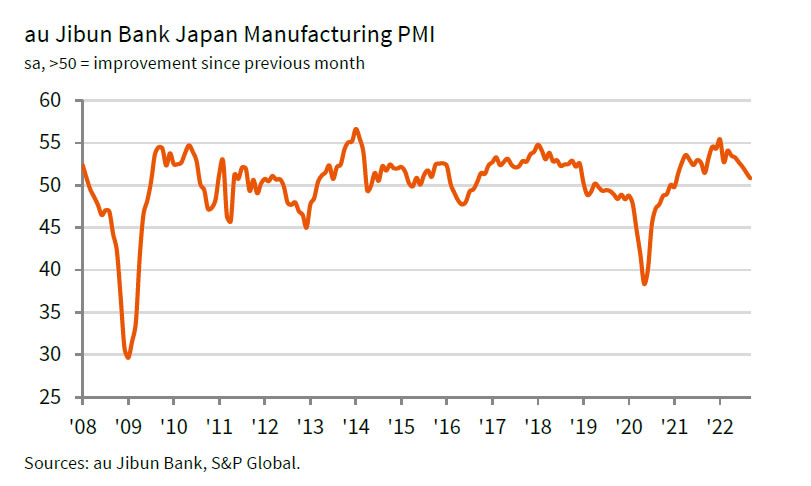
Japan PMI manufacturing finalized at 50.8, weakness even turned worse
Japan PMI Manufacturing was finalized at 50.8 in September, down from August's 51.5. S&P Global said high inflation and subdued global market conditions weight on order books. Output fell at sharpest pace in a year, while input buying reduced. Weak yen drove inflationary pressures higher.
Joe Hayes,, Senior Economist at S&P Global Market Intelligence, said: "Weakness in Japan's manufacturing sector persisted in September and even turned worse. New orders fell at their sharpest rate in two years – high inflation is eroding client purchasing power, while slowing global economic growth is hurting exports. Weakness in the yen is doing little to bolster export demand either and instead is pushing imported inflation up drastically and drove domestic price pressures up even further."
RBA and RBNZ to hike 50bps, US to release ISMs and NFP
Both RBA and RBNZ are expected to continue with tightening this week. RBA is expected to raise the cash rate by 50bps to 2.85%. Interest rate would then be at least in neutral region, if not restrictive. RBA might reinforce the signal that tightening pace would start to slow. RBNZ is also expected to hike by 50bps to 3.50%. Governor Adrian Orr has indicate that the tightening cycle is mature. Hence, there could be signals from RBNZ that the pace is going to slow ahead.
Other central bank activities include release of BoJ summary of opinions and ECB meeting accounts. Economic data events are also jam-packed, with biggest highlight in US ISMs and non-farm payroll employment.
Here are some highlights for the week:
- Monday: BoJ summary of opinions, Japan Tankan survey, PMI manufacturing final; Swiss CPI, PMI manufacturing; Eurozone PMI manufacturing final; UK PMI manufacturing final; Canada PMI manufacturing; US PMI manufacturing final, ISM manufacturing, construction spending.
- Tuesday: New Zealand NZIER business confidence; Australia AiG manufacturing, building approvals, RBA rate decision; Japan Tokyo CPI core, monetary base; Eurozone PPI; US factory orders.
- Wednesday: Australia retail sales; RBNZ rate decision; Germany trade balance; France industrial production; Eurozone PMI services final; UK PMI services final; Canada building permits, trade balance; US ADP employment, PMI services final, ISM services.
- Thursday: Australia AiG construction, trade balance; Germany factory orders; UK PMI construction; Eurozone retail sales, ECB meeting accounts; Canada Ivey PMI; US jobless claims.
- Friday: Japan average cash earnings, households spending, leading indicators; Germany import prices, industrial production, retail sales; France trade balance; Swiss foreign currency reserves; Italy retail sales; Canada employment; US non-farm payroll employment.
GBP/JPY Daily Outlook
Daily Pivots: (S1) 159.91; (P) 161.05; (R1) 162.65; More...
Intraday bias in GBP/JPY remains mildly on the upside as rebound from 148.93 extends higher. Further rally should be seen to retest 169.10 high. Strong resistance could be seen there to limit upside, at least on first attempt. On the downside, below 159.41 minor support will turn intraday bias neutral first.
In the bigger picture, strong support from 38.2% retracement of 123.94 to 169.10 at 151.84 suggests that price actions from 169.10 are developing into a corrective pattern only. That is, rise from 123.94 (2020 low) should resume at a later stage. This will now remain the favored case as long as 148.93 support holds.
Economic Indicators Update
| GMT | Ccy | Events | Actual | Forecast | Previous | Revised |
|---|---|---|---|---|---|---|
| 23:50 | JPY | Tankan Large Manufacturing Index Q3 | 8 | 11 | 9 | |
| 23:50 | JPY | Tankan Non-Manufacturing Index Q3 | 14 | 13 | 13 | |
| 23:50 | JPY | Tankan Large Manufacturing Outlook Q3 | 9 | 11 | 10 | |
| 23:50 | JPY | Tankan Non-Manufacturing Outlook Q3 | 11 | 15 | 13 | |
| 23:50 | JPY | Tankan Large All Industry Capex Q3 | 21.50% | 18.80% | 18.60% | |
| 00:00 | AUD | TD Securities Inflation M/M Sep | 0.50% | -0.50% | ||
| 00:30 | JPY | Manufacturing PMI Sep F | 50.8 | 51 | 51 | |
| 06:30 | CHF | CPI M/M Sep | 0.10% | 0.30% | ||
| 06:30 | CHF | CPI Y/Y Sep | 3.50% | 3.50% | ||
| 07:30 | CHF | SVME PMI Sep | 54.6 | 56.4 | ||
| 07:45 | EUR | Italy Manufacturing PMI Sep | 47.5 | 48 | ||
| 07:50 | EUR | France Manufacturing PMI Sep F | 47.8 | 47.8 | ||
| 07:55 | EUR | Germany Manufacturing PMI Sep F | 48.3 | 48.3 | ||
| 08:00 | EUR | Eurozone Manufacturing PMI Sep F | 48.5 | 48.5 | ||
| 08:30 | GBP | Manufacturing PMI Sep | 48.5 | 48.5 | ||
| 13:30 | CAD | Manufacturing PMI Sep | 50.6 | 48.7 | ||
| 13:45 | USD | Manufacturing PMI Sep F | 51.8 | 51.8 | ||
| 14:00 | USD | ISM Manufacturing PMI Sep | 52.3 | 52.8 | ||
| 14:00 | USD | ISM Manufacturing Prices Paid Sep | 51.8 | 52.5 | ||
| 14:00 | USD | ISM Manufacturing Employment Index Sep | 54.2 | |||
| 14:00 | USD | Construction Spending M/M Aug | -0.30% | -0.40% |
Technical Outlook and Review
USD/JPY:
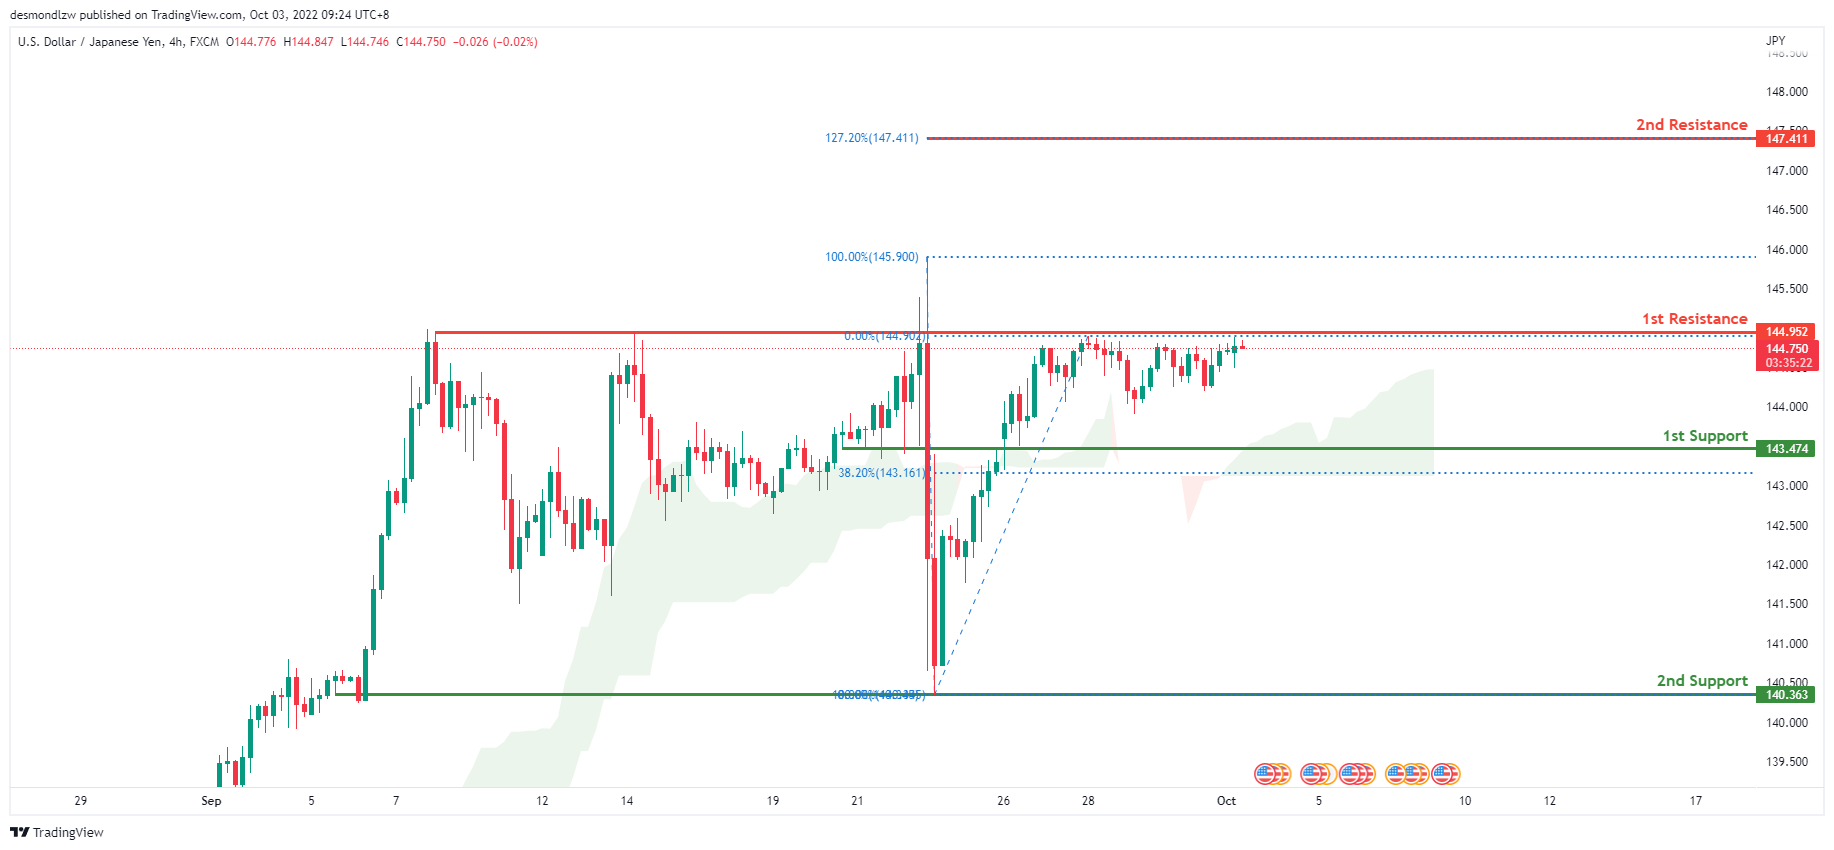
Price is in a strong bullish trend on the H4 chart. In addition, the price is above the ichimoku cloud, indicating a bullish market. Price has been consolidating near 144.952, the 0% Fibonacci line, for the past week following the Bank of Japan’s intervention. Price is expected to break through the first resistance and move towards the second resistance at 147.411 where the 127.2% Fibonacci expansion extension line is located.
Areas of consideration:
- H4 time frame, 1st resistance at 144.952
- H4 time frame, 1st support at 143.474
DXY:
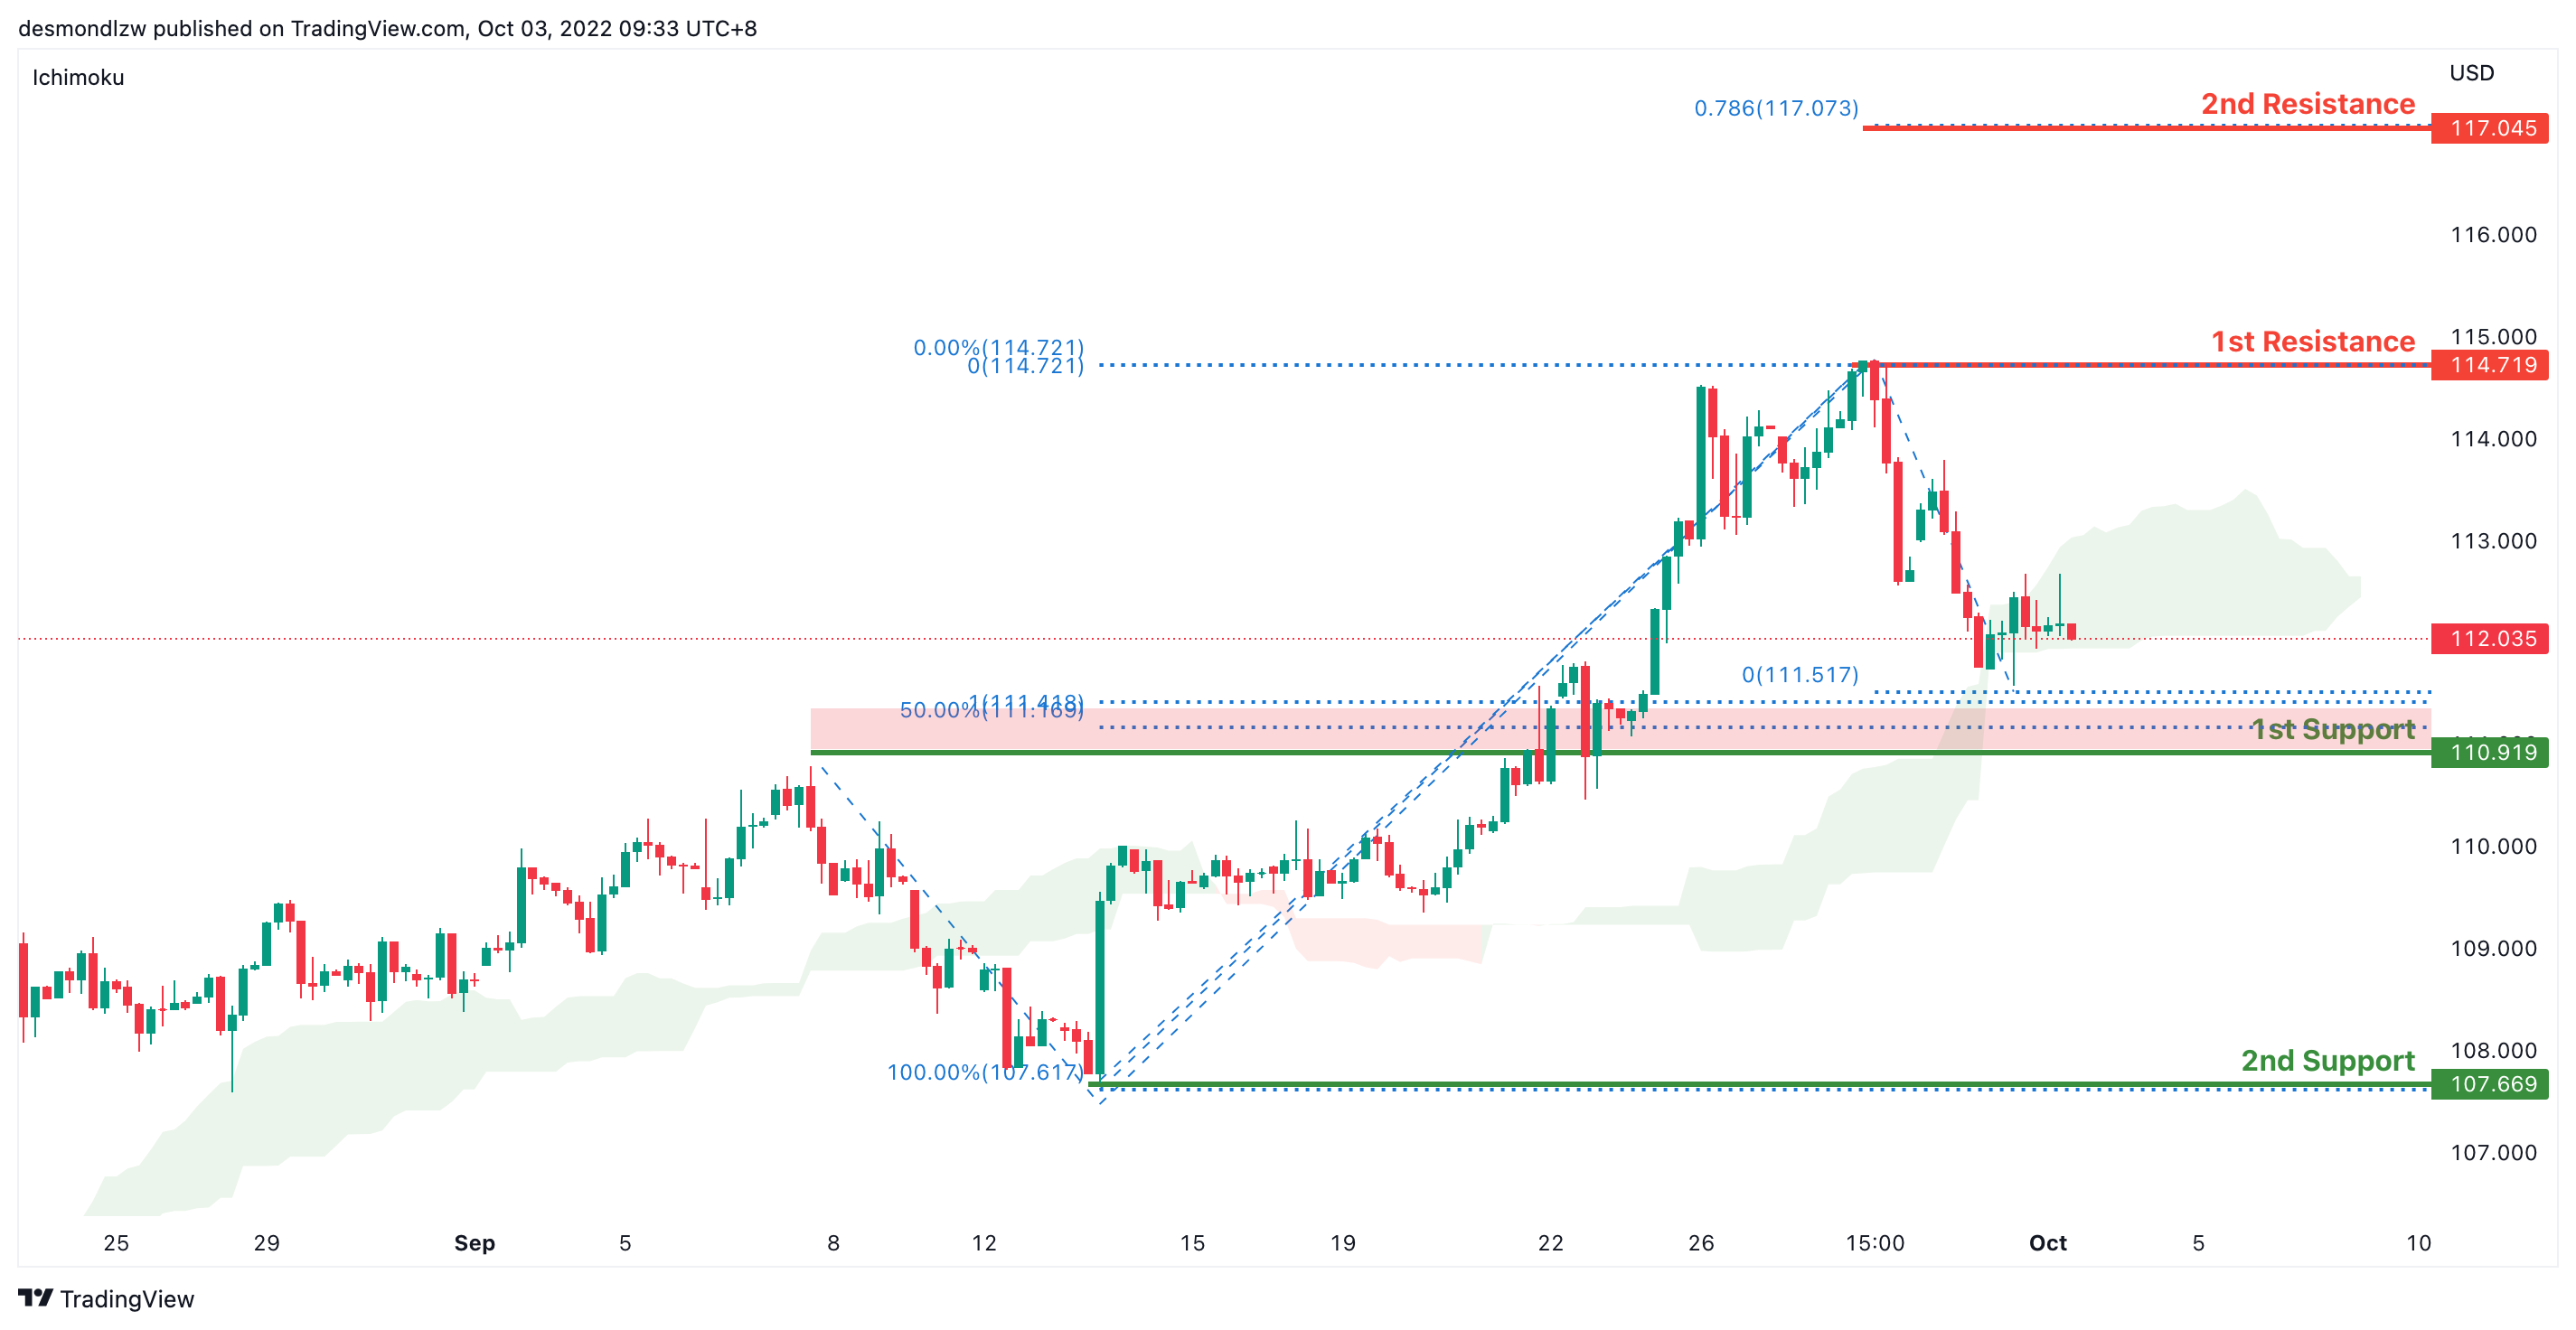
On the H4, price has broken the ichimoku and has pulled back slightly forming a double top- we are bearish bias. Price has rejected the first resistance and pulled back to test the first support at 110.919 where the 50% retracement and 100% projection sits. If price breaks this support it should test the second support at 107.669 where the previous swing low sits. Alternatively price could test the first resistance again at 114.719 levels where the previous swing high sits and if it breaks this level, price might test the second resistance at 117.045 where the 78.6% projection sits.
Areas of consideration:
- H4 time frame, 1st resistance at 114.719
- H4 time frame, 1st support at 110.919
EUR/USD:
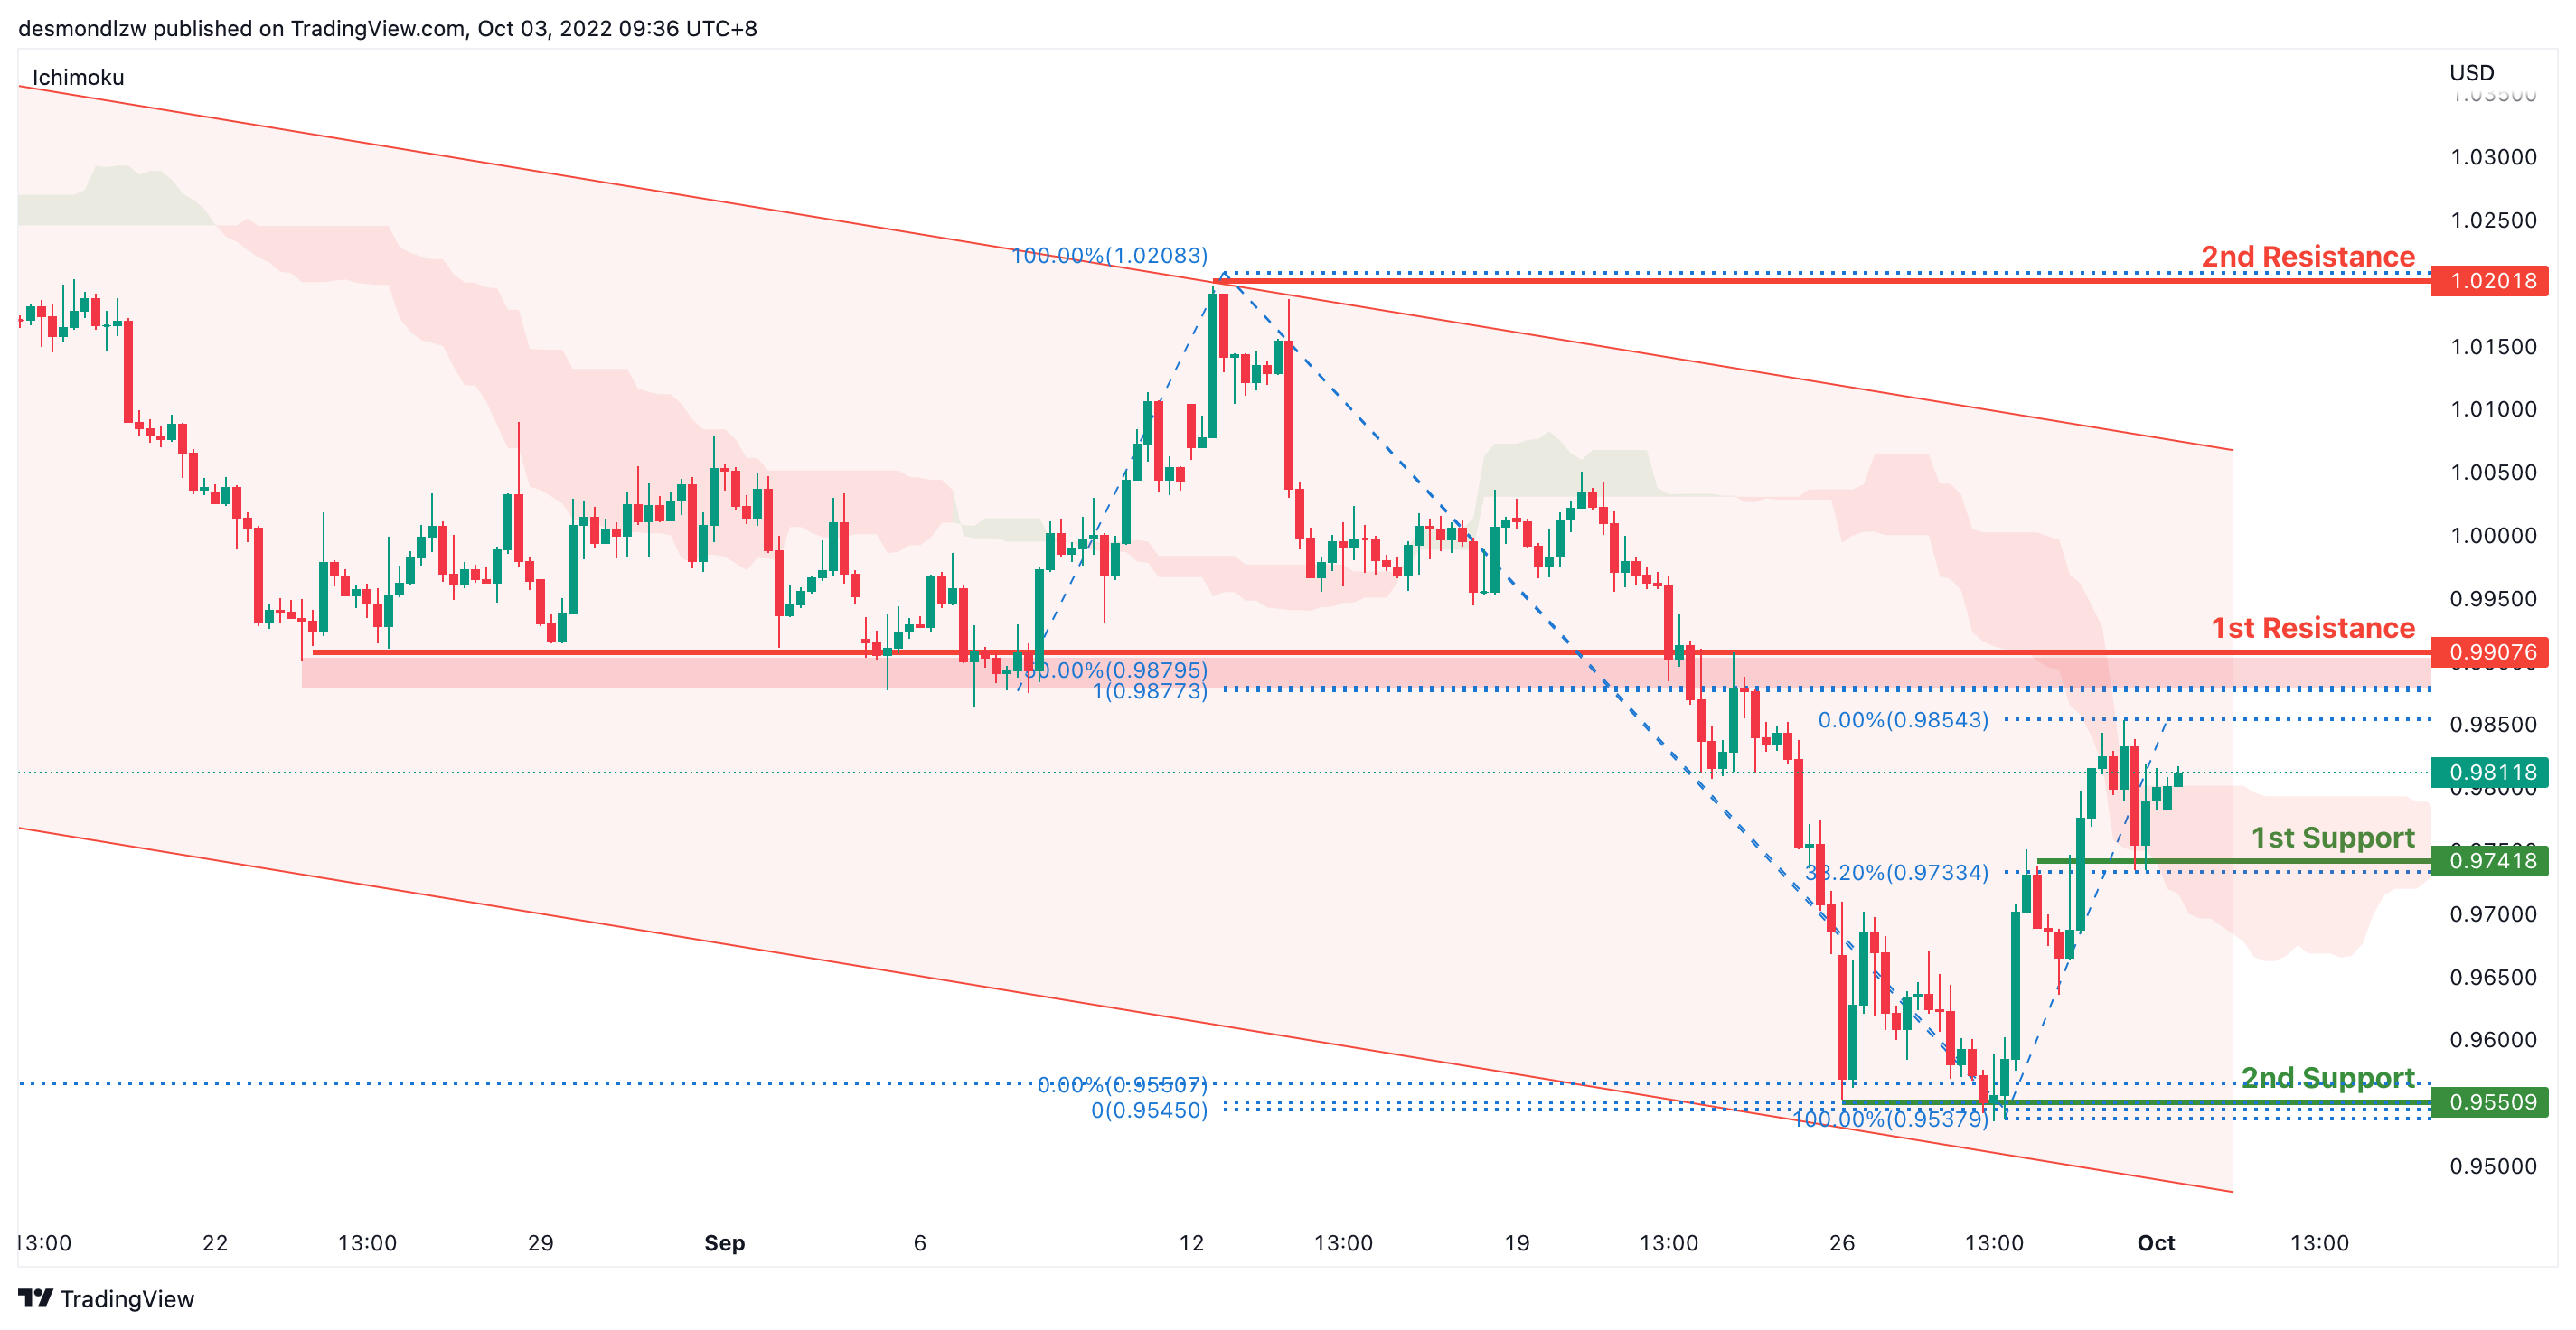
On the H4, price is moving within the channel but in an ascending manner- we are slightly bullish biased. Price has bounced off the first support and is moving toward the first resistance at 0.990 where the 100% projection and 50% retracement sits. If price breaks this level, it will test the second resistance at 1.0201 where the previous swing high sits. Alternatively, the overall bearish momentum could bring price back to test the first support at 0.9741 where the previous swing low and 38.2% retracement sits. If it breaks this level, we have a strong bearish confirmation to bring price down to 0.9550 where the 161.8% extension and swing low sits
Areas of consideration :
- H4 1st resistance at 0.9907
- H4 1st support at 0.9741
GBP/USD:
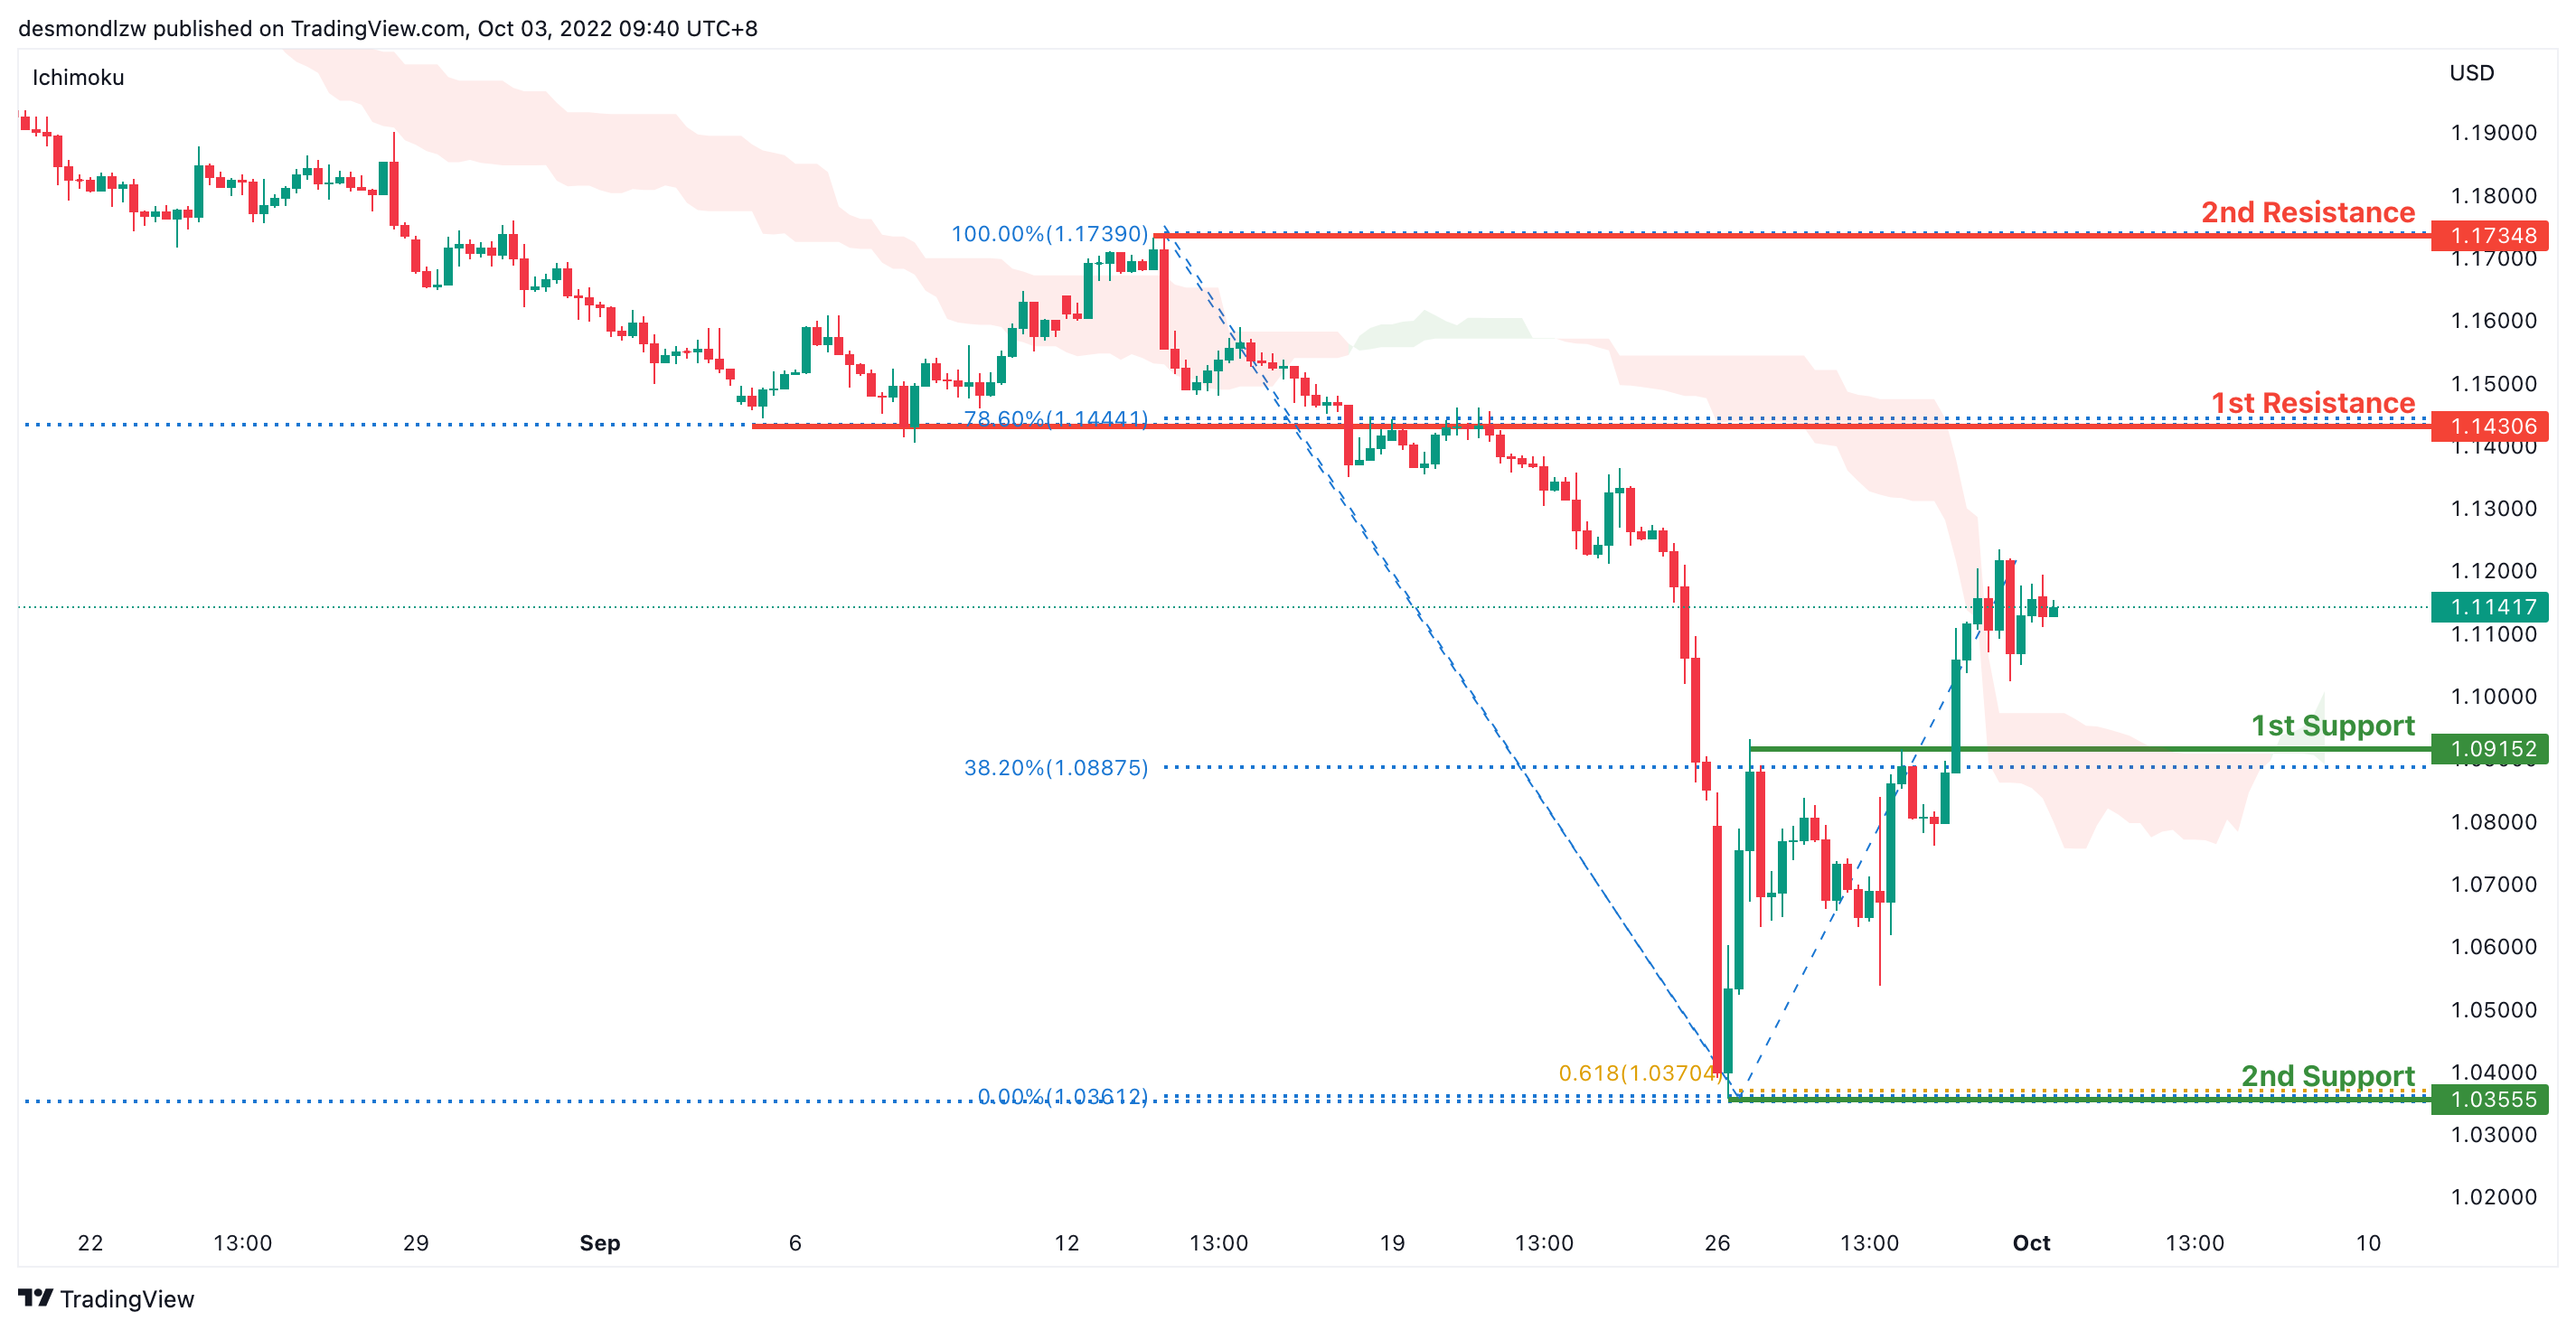
On the H4 time frame, prices have bounced off the support level and are moving in an ascending manner, we are slightly bullish. Price is moving toward the first resistance at 1.1430 where the 78.6% retracement and overlap support sits. If it breaks this level, its bullish momentum will bring price to second resistance at 1.1734 where the previous swing high sits. Alternatively, price could pull back to test the first support at 1.0915 where the 38.2% retracement sits then the second support at 1.0355 where the previous swing low and 138.2% extension and 61.8% projection sits
Areas of consideration:
- H4 1st resistance at 1.1430
- H4 1st support at 1.0915
USD/CHF:
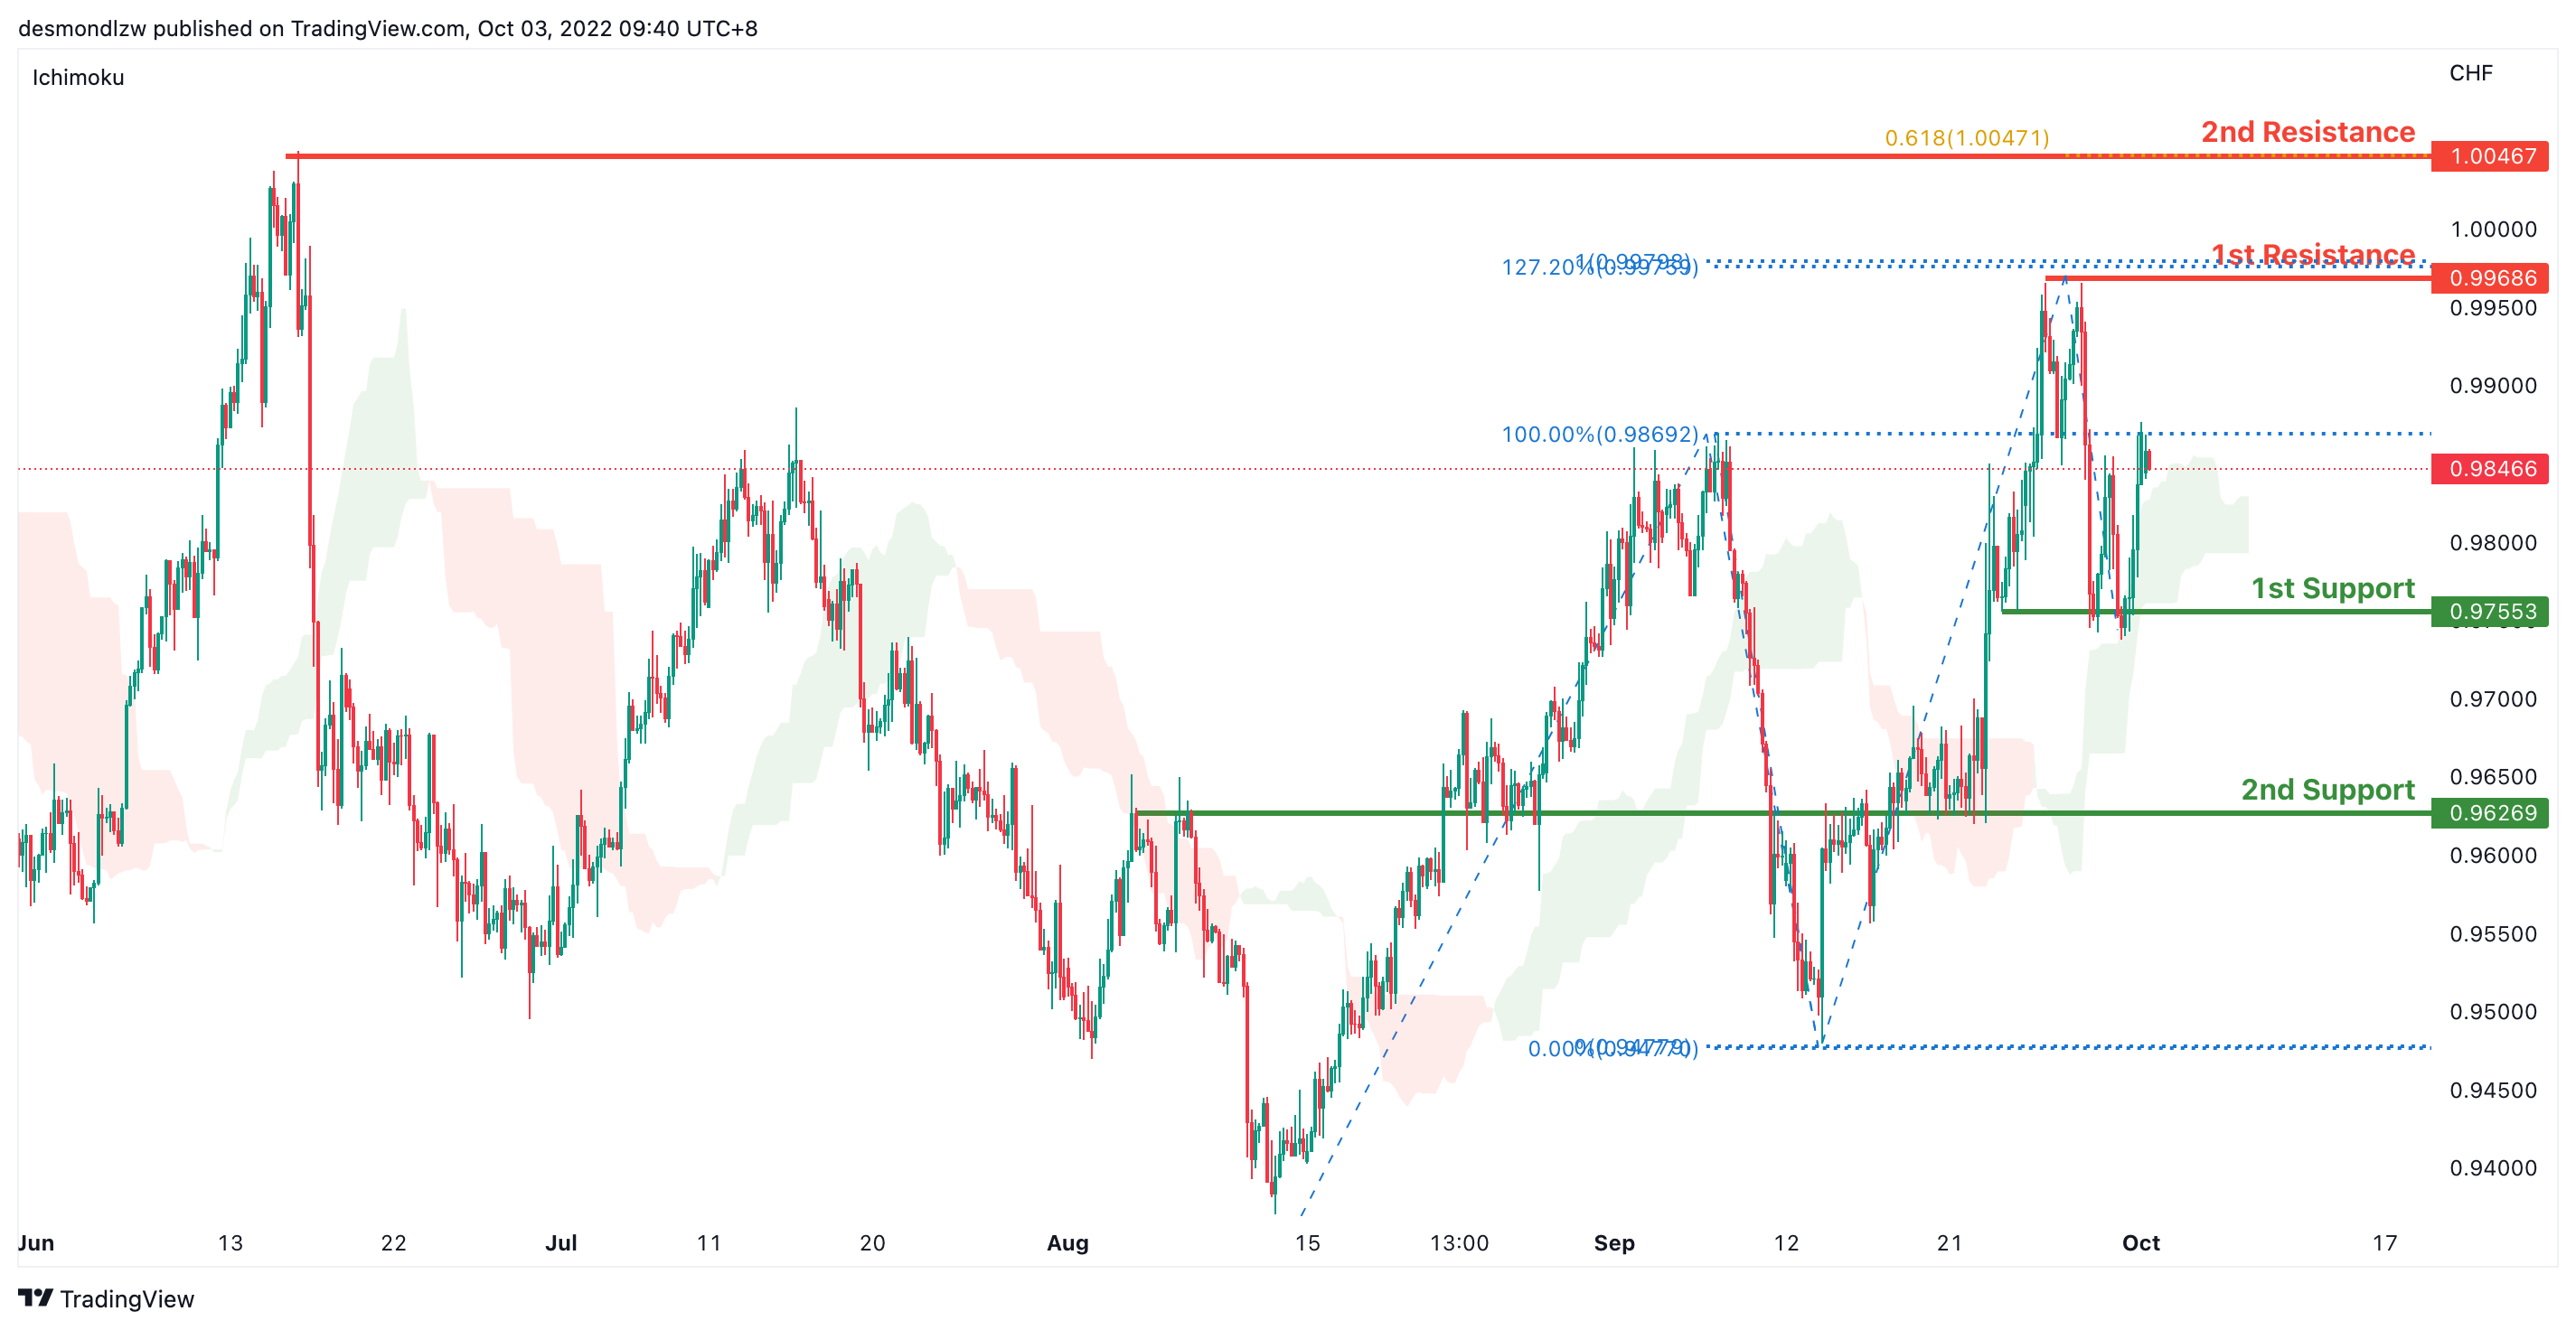
On the H4, prices are above the ichimoku and in an ascending trend we are bullish bias. Price has rejected the support twice and it’s moving toward the first resistance at 0.9968 where the 100% projection,127.2% extension and swing high sits. If bullish momentum continues, it should bring price to the second resistance at 1.0046 where the 61.8% projection and previous swing high sits. Alternatively, price could pull back to test 0.9755 where the first support sits if it breaks this level, we have a bearish confirmation to bring price further down to the second support at 0.9626 where the key overlap support sits.
Areas of consideration
- H4 1st support at 0.9755
- H4 1st resistance at 0.9968
XAU/USD (GOLD):
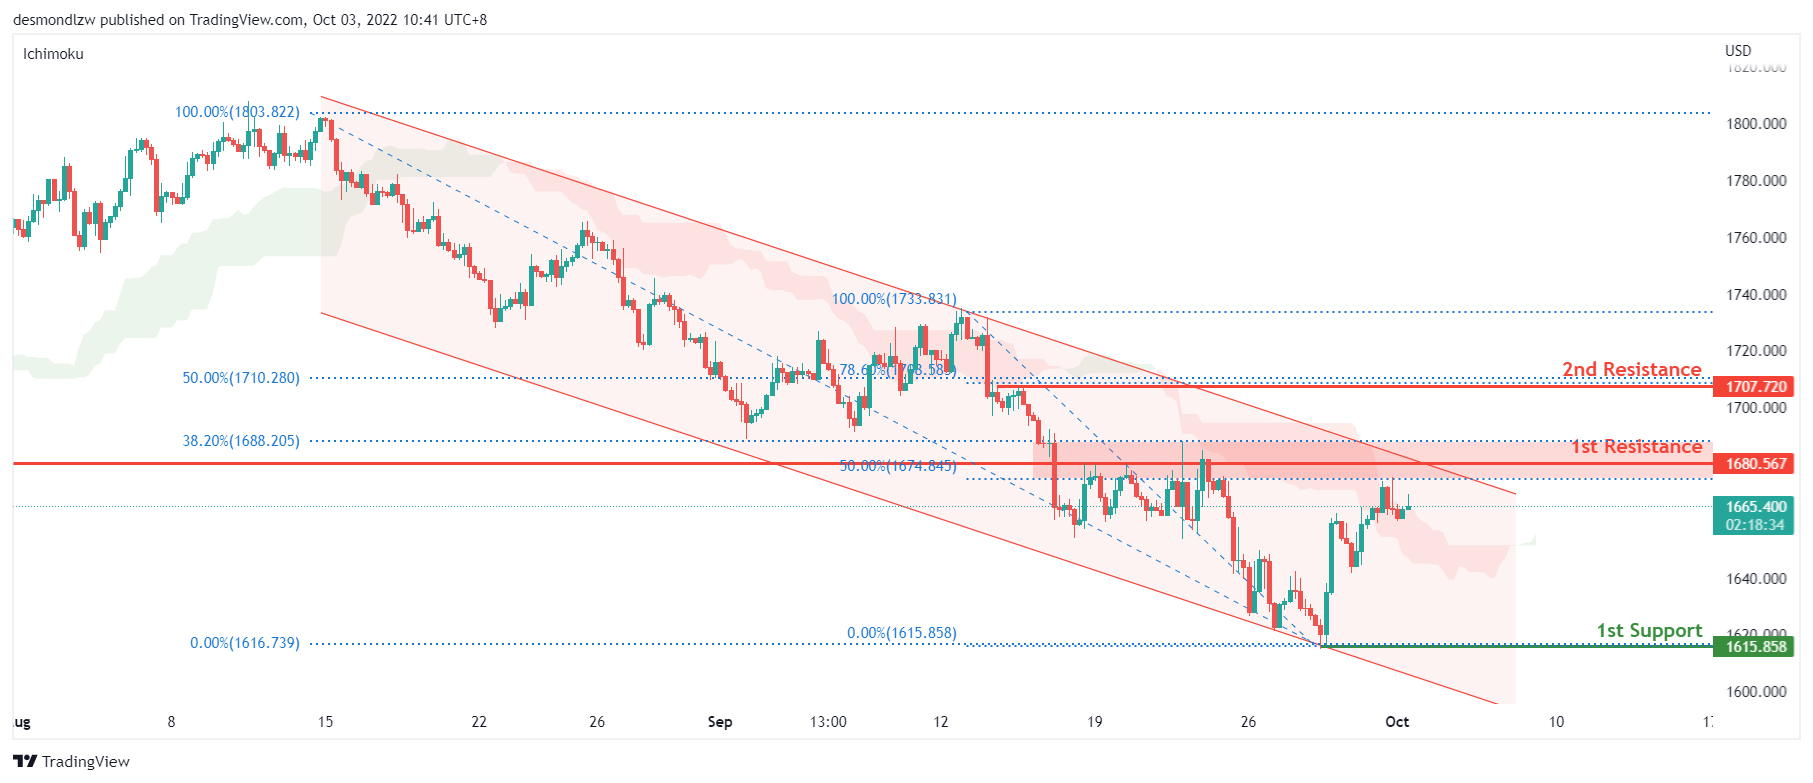
On the H4, price is showing a rejection of the 1st resistance of 1680, which is inline with the 50% and 38.2% fibonacci retracement level, swing low from July 2022 and within the bearish channel. With price in the ichimoku cloud, we have a neutral bias. However, price may trade lower towards the 1st support of 1615.85 with a risk level at 1640. Alternatively, price could break above the 1st resistance to trade higher towards the 2nd resistance of 1707 which is inline with the 50% and 78.6% fibonacci retracement level.
Areas of consideration:
- H4 time frame, 1st resistance at 1680.56
- H4 time frame, 2nd resistance at 1707.72
- H4 time frame, 1st support at 1615.85
AUD/USD:
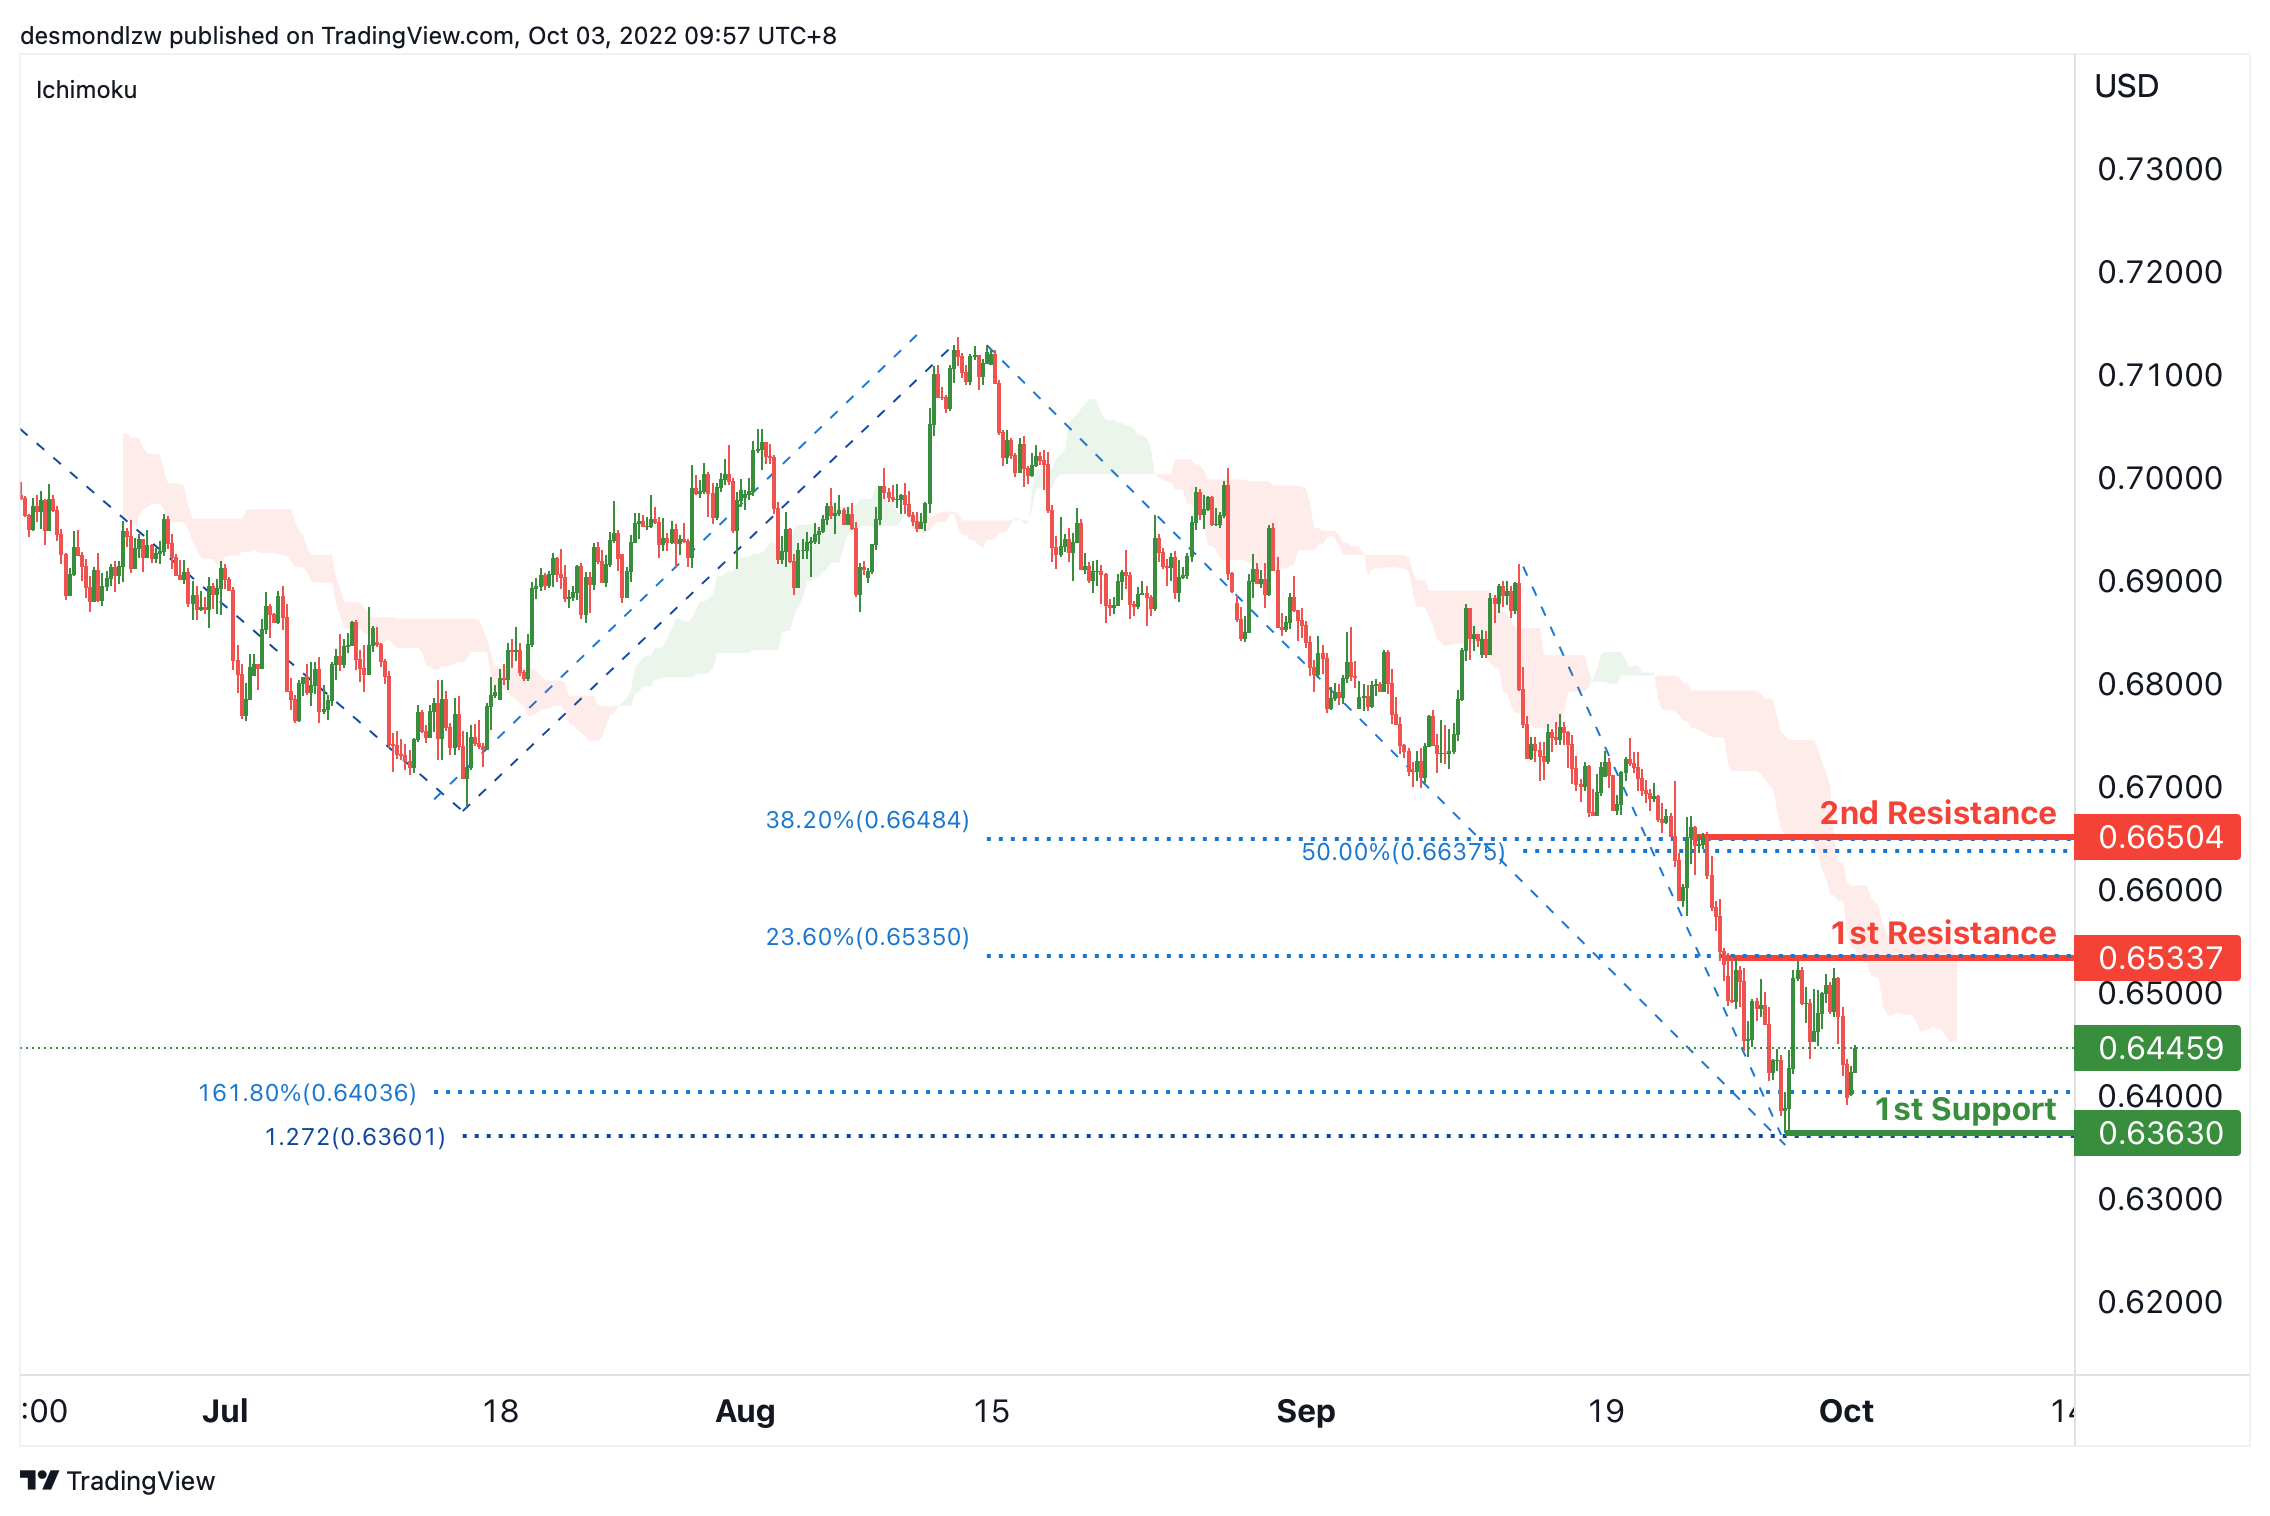
On the H4, the price is bouncing from the 1st support, we can expect the price test the 1st resistance at 0.65337, which is in line with the 23.6% fibonacci retracement, if the price can break the 1st resistance, we can expect the price rise to the 2nd resistance at 0.66504, where the pullback resistance, 50% and 38.2% fibonacci retracement are. Alternatively, as the price is still below ichimoku cloud, the price may drop to the 1st support again at 0.63630, which is in line with the swing low, 161.8% fibonacci extension and 127.2% fibonacci projection.
Areas of consideration
- H4, 1st resistance at 0.65337
- H4, 1st support at 0.63630
NZD/USD:
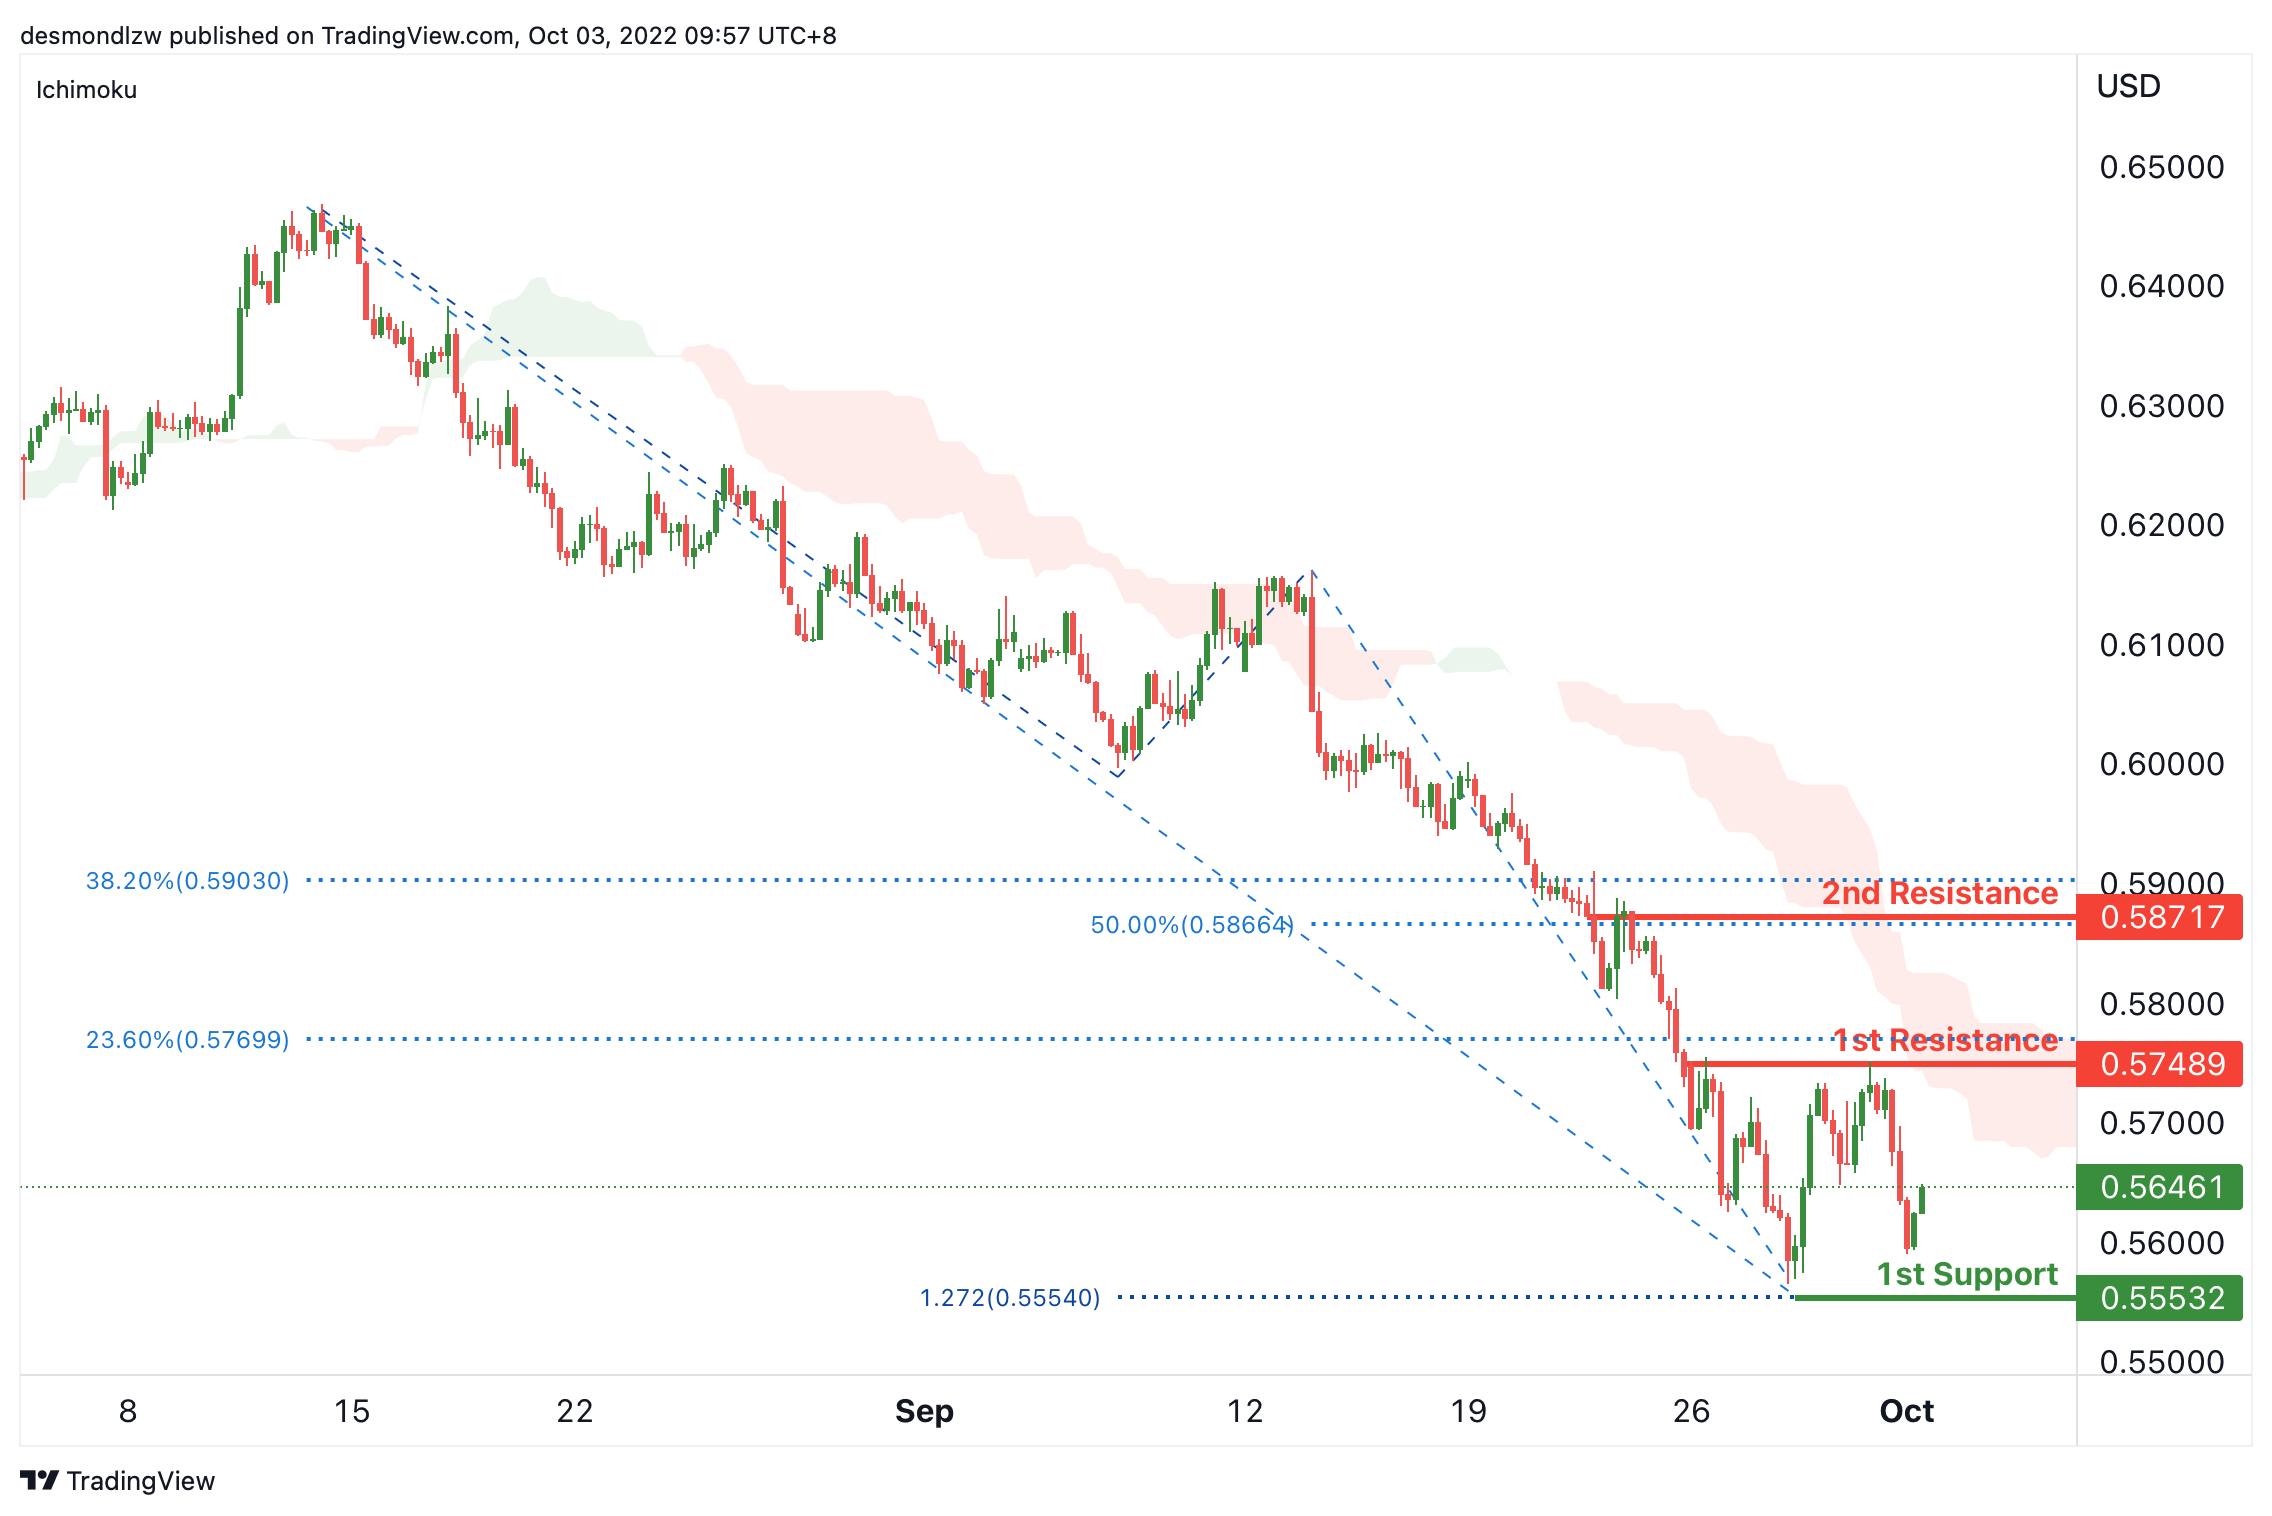
On the H4, with the price bouncing from the 1st support, we can expect the price test the 1st resistance at 0.57489, which is in line with the 23.6% fibonacci retracement, if the 1st resistance is broken, the price may break the 1st resistance and rise to the 2nd resistance at 0.58717, where the 38.2% and 50% fibonacci retracement are. Alternatively, the price may drop to the 1st support at 0.55532, where the swing low and 127.2% fibonacci projection are.
Areas of consideration:
- H4 time frame, 1st resistance at 0.57489
- H4 time frame, 1st support at 0.55532
USD/CAD:
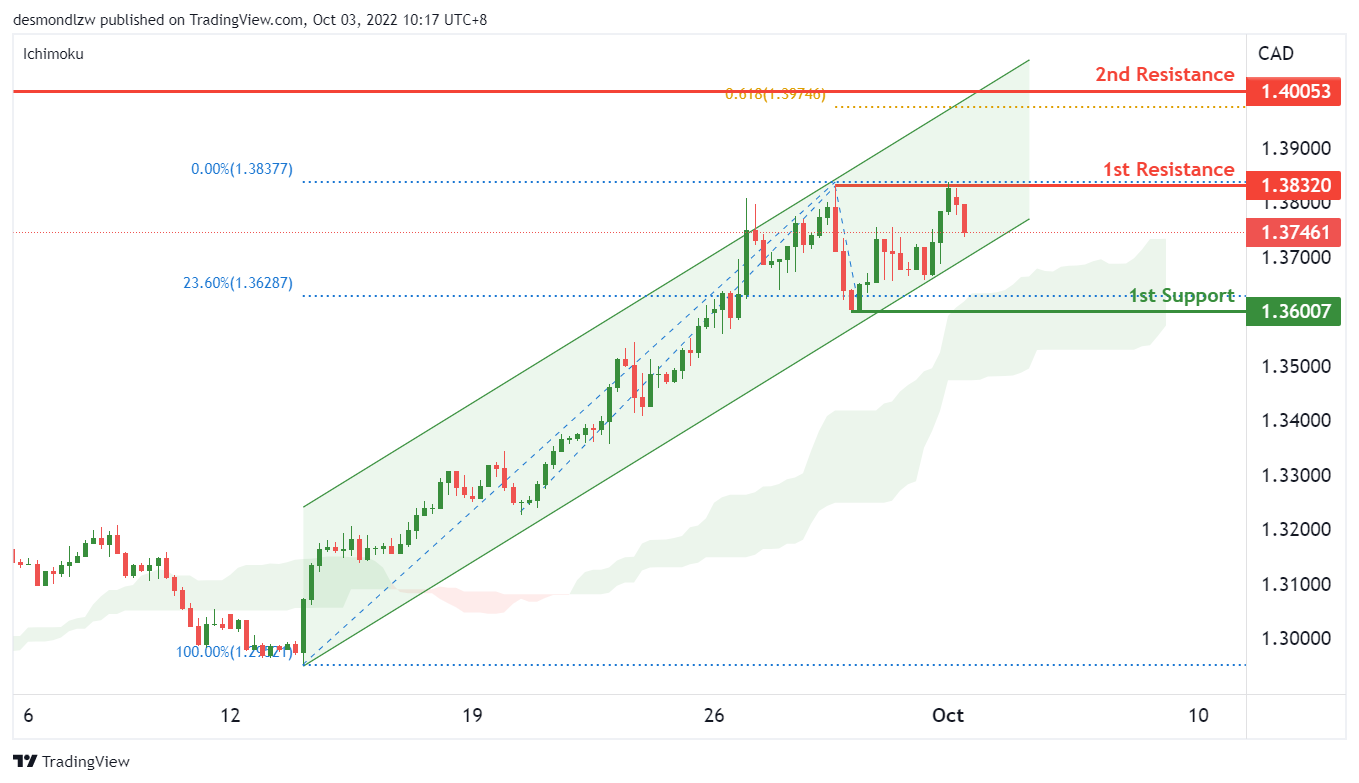
On the H4, the price fails to break above the 1st resistance of 1.3832 but maintains within the ascending channel and above the ichimoku cloud. We continue to have a bullish bias that price may rise to the 2nd resistance at 1.40, which is in line with the 61.8% fibonacci extension level and previous swing high from June 2020. However, price could first fall to test the 23.6% fibonacci retracement level before a continuation to the upside.
Areas of consideration:
- H4 time frame, 1st resistance at 1.3832
- H4 time frame, 2nd resistance at 1.40
- H4 time frame, 1st support at 1.36
OIL:
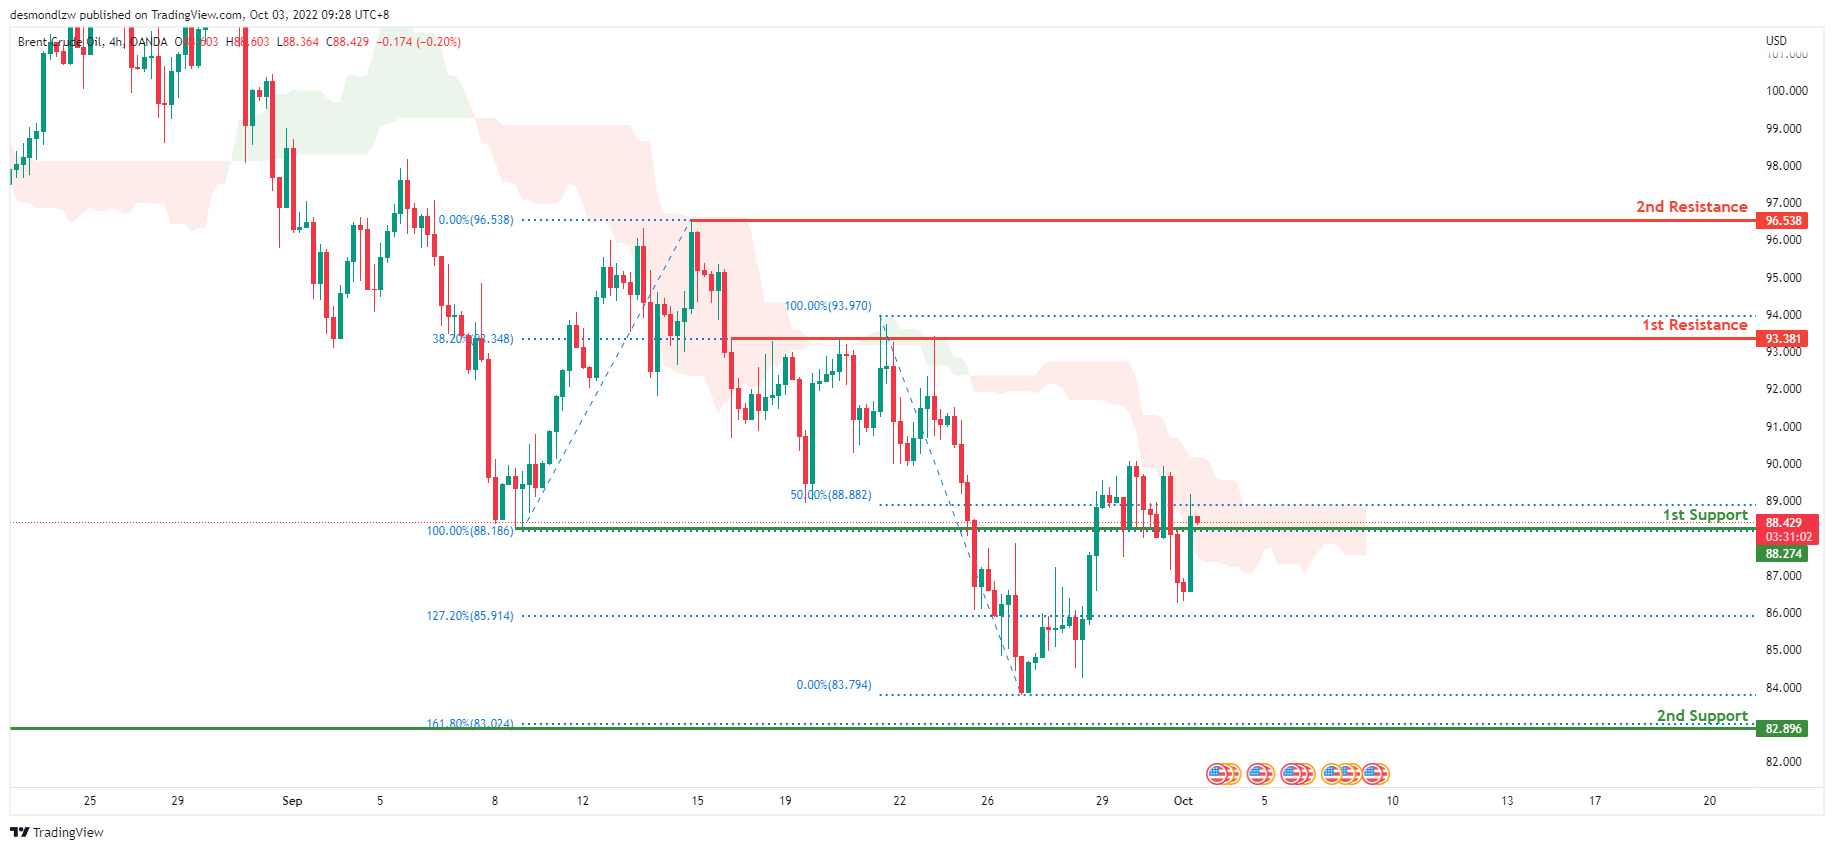
On the 4-hour chart, oil is in a bearish trend. Price is currently consolidating near the first support level at 88.788, which has a 100% Fibonacci extension and served as the previous swing low. Price has rejected and broken back up this level several times in the last week, indicating that it is a strong level. Price is expected to move towards the first resistance level, which is the 38.2% Fibonacci extension line, at 93.381.
Areas of consideration:
- H4 time frame, 1st resistance at 93.381
- H4 time frame, 1st support at 88.366
Dow Jones Industrial Average:
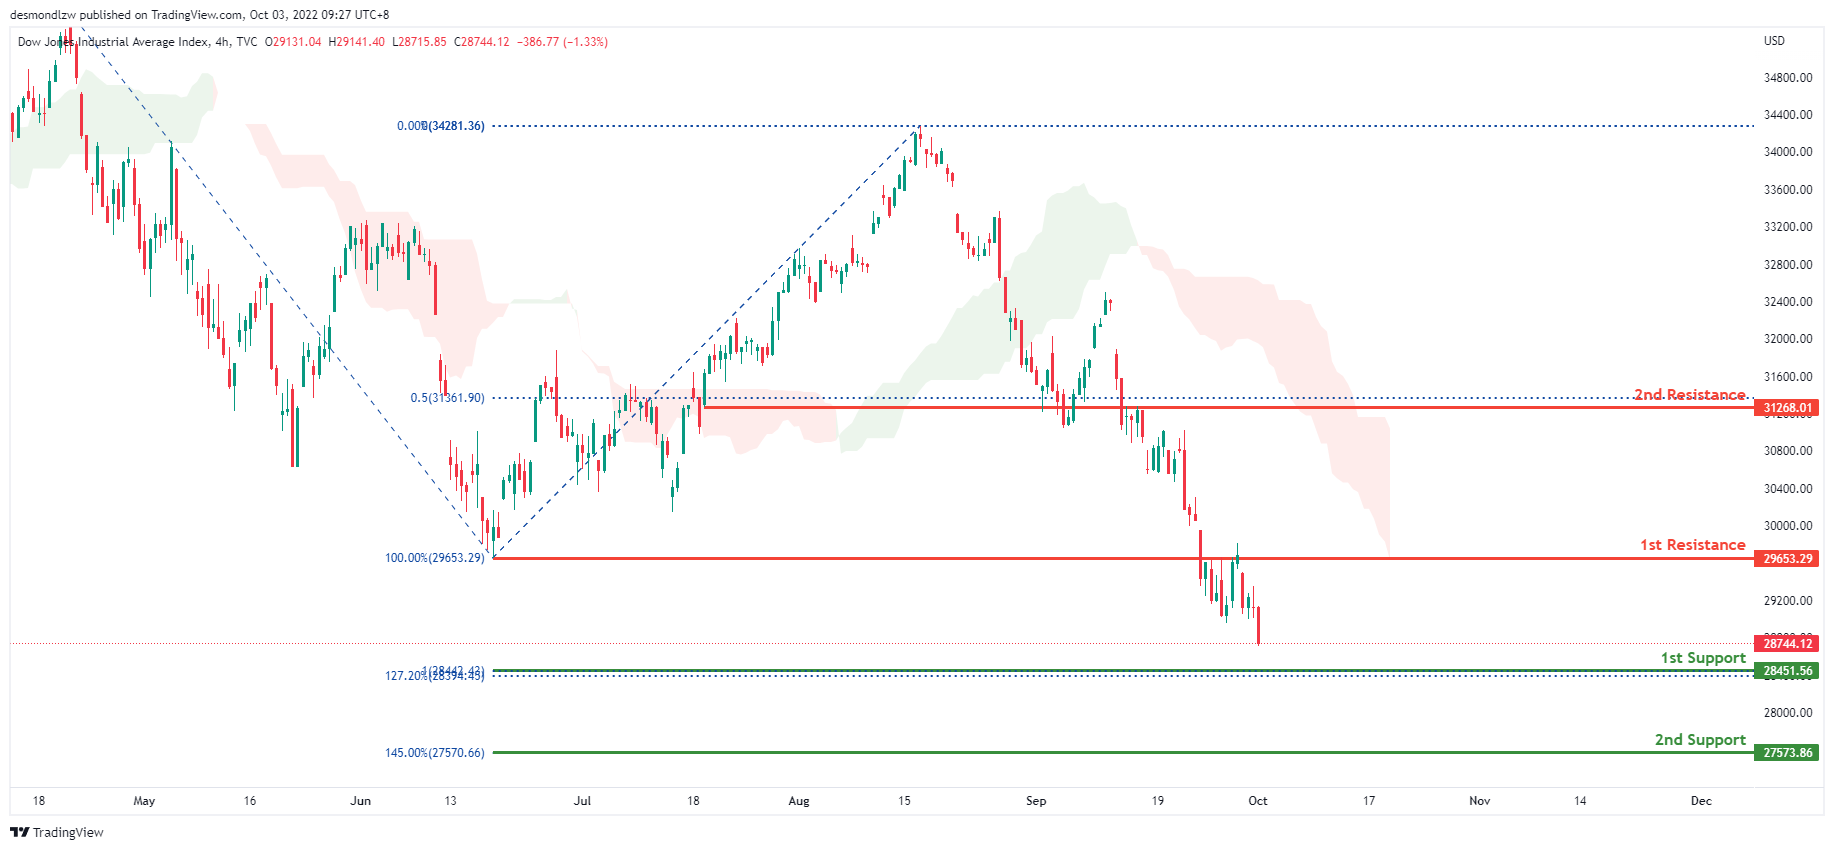
The price is in a bearish trend on the H4. Furthermore, the price is lower than the ichimoku cloud, indicating a bearish market. Price has also broken through the first resistance level, which contains the 100% Fibonacci line and the previous swing low, at 29653.29. Given the current bearish momentum, price is expected to move towards the first support level at 28422.42, which contains the 100% Fibonacci projection line and the 127.2% Fibonacci extension line.
Areas of consideration:
- H4 time frame, 1st support at 28408.73
- H4 time frame, 1st resistance at 29653.29
DAX:
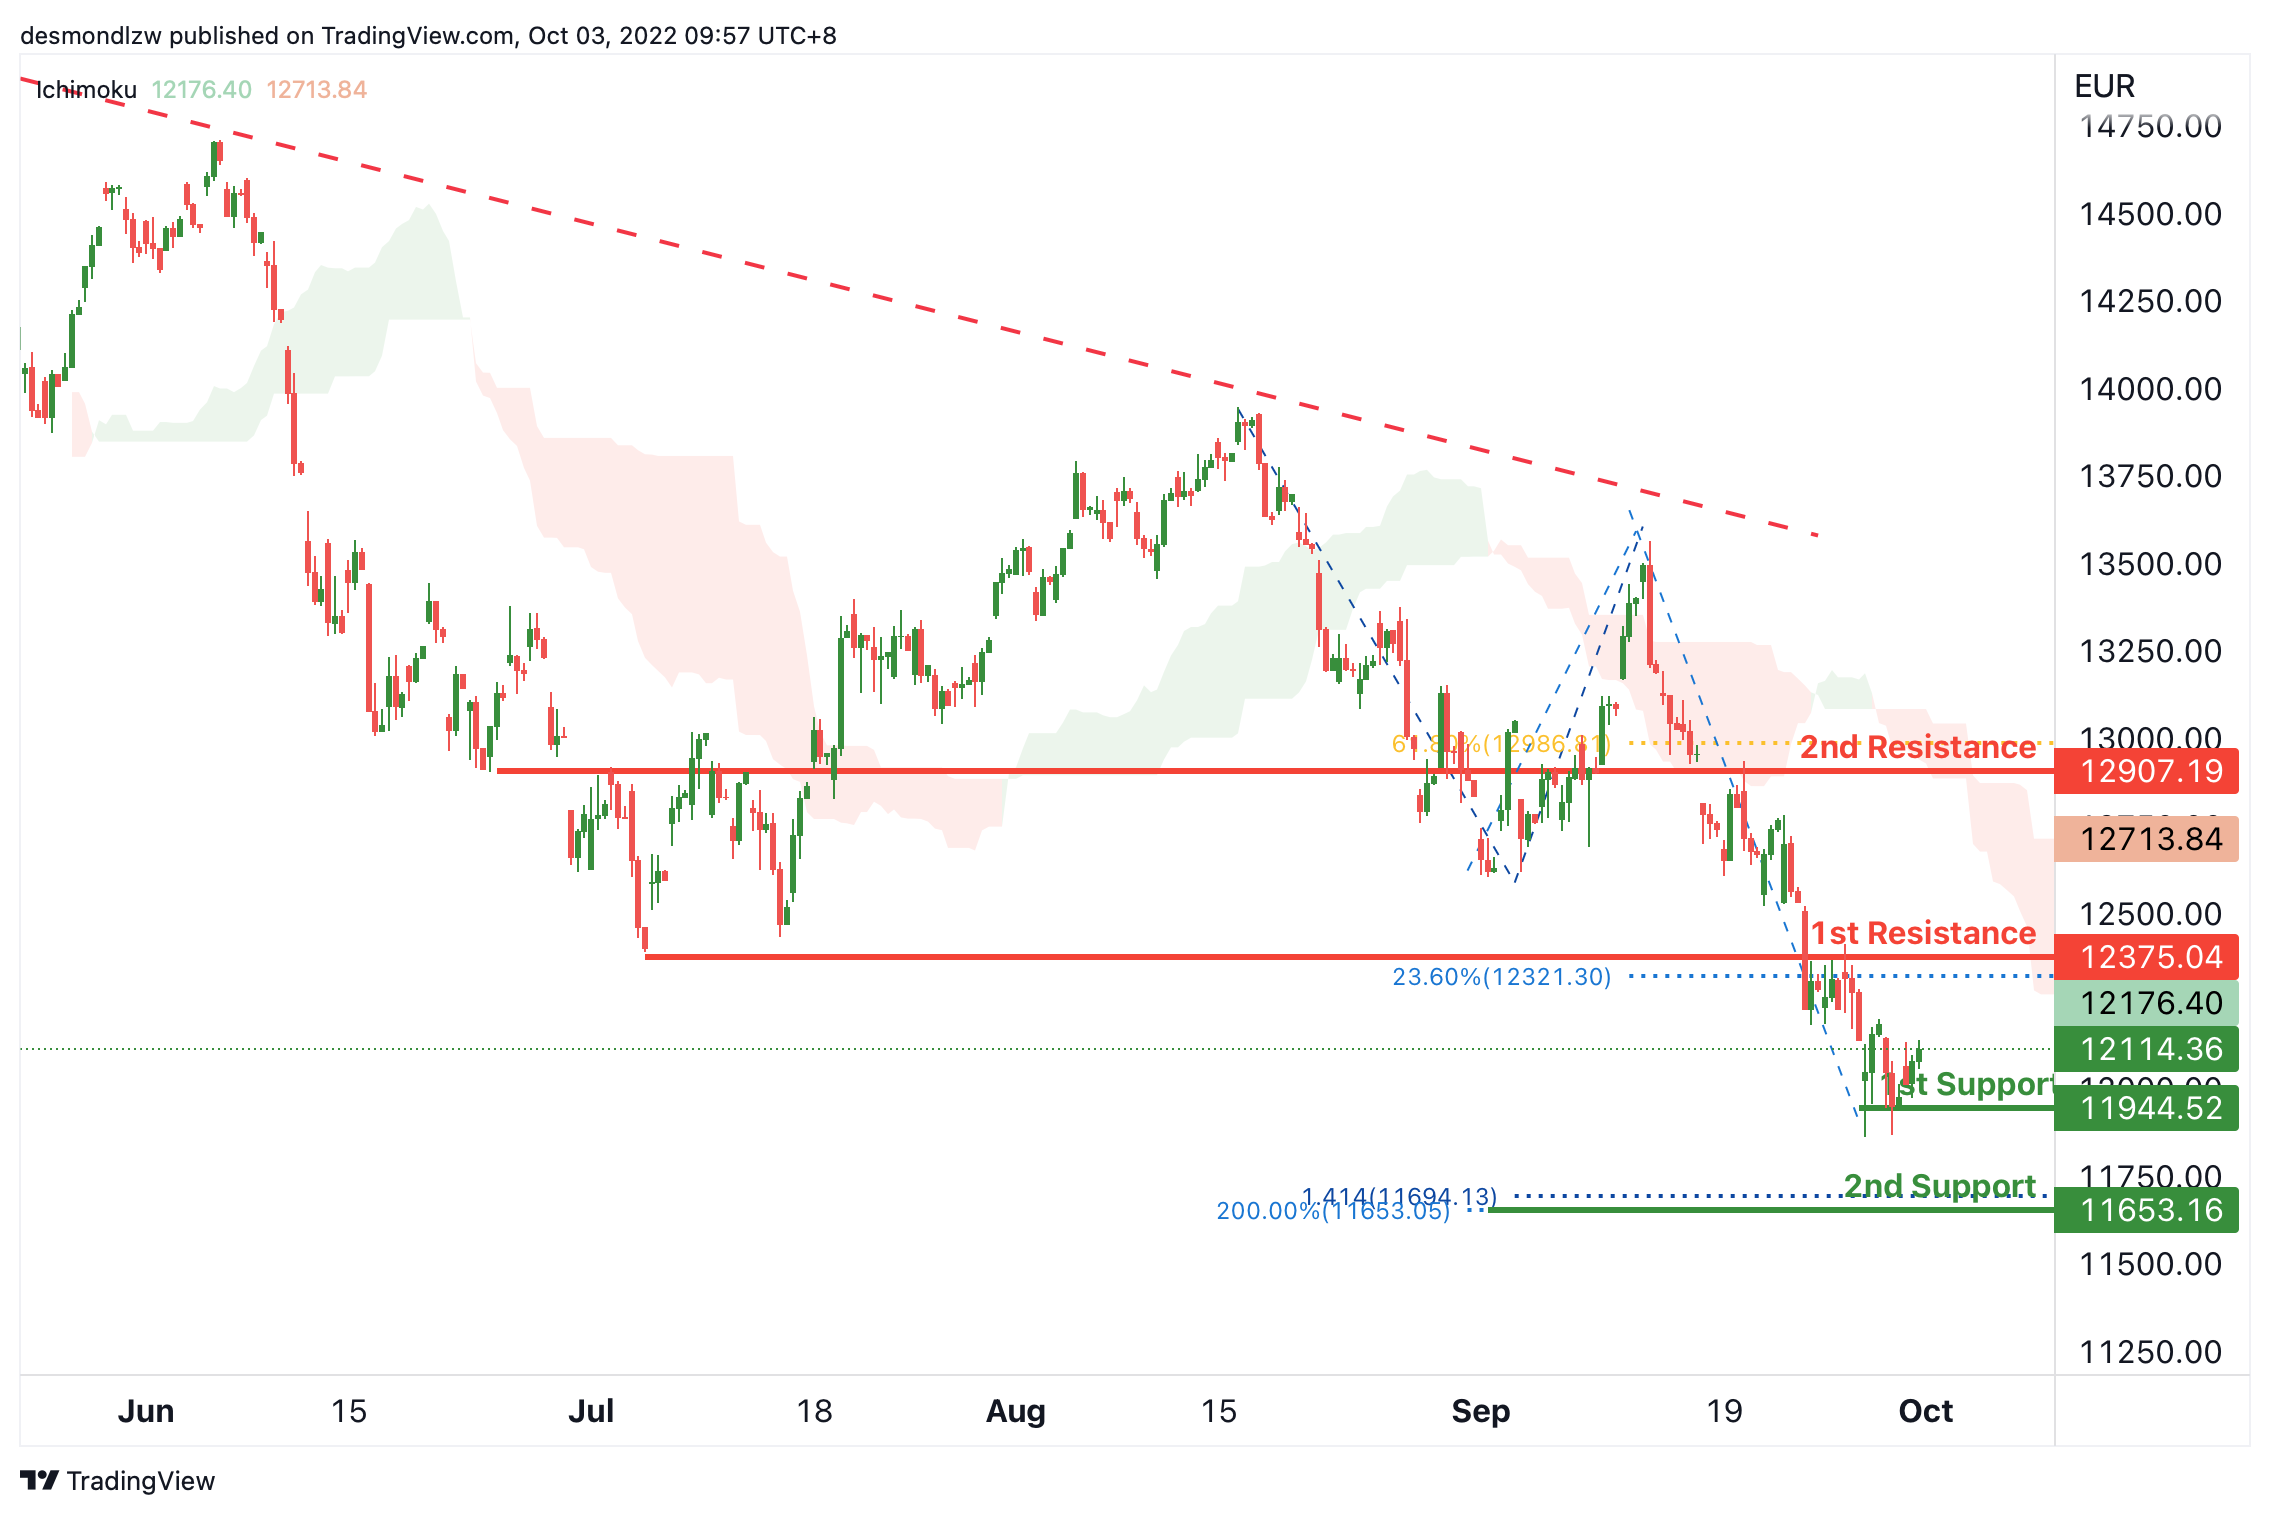
On the H4, with the price bouncing from the 1st support at 11944.52, the price may test the 1st resistance at 12375.04, which is in line with the overlap resistance and 23.6% fibonacci retracement. If the 1st resistance is broken, the price may rise to the 2nd resistance at 12907.19, where the 61.8% fibonacci retracement is. Alternatively, the price may break the 1st support and drop to the 2nd support at 11653.16, where where the 141.4% fibonacci projection and 200% fibonacci projection are.
Areas of consideration:
- H4 time frame, 1st resistance at 12375.04
- H4 time frame, 1st support at 11944.5
ETHUSD:
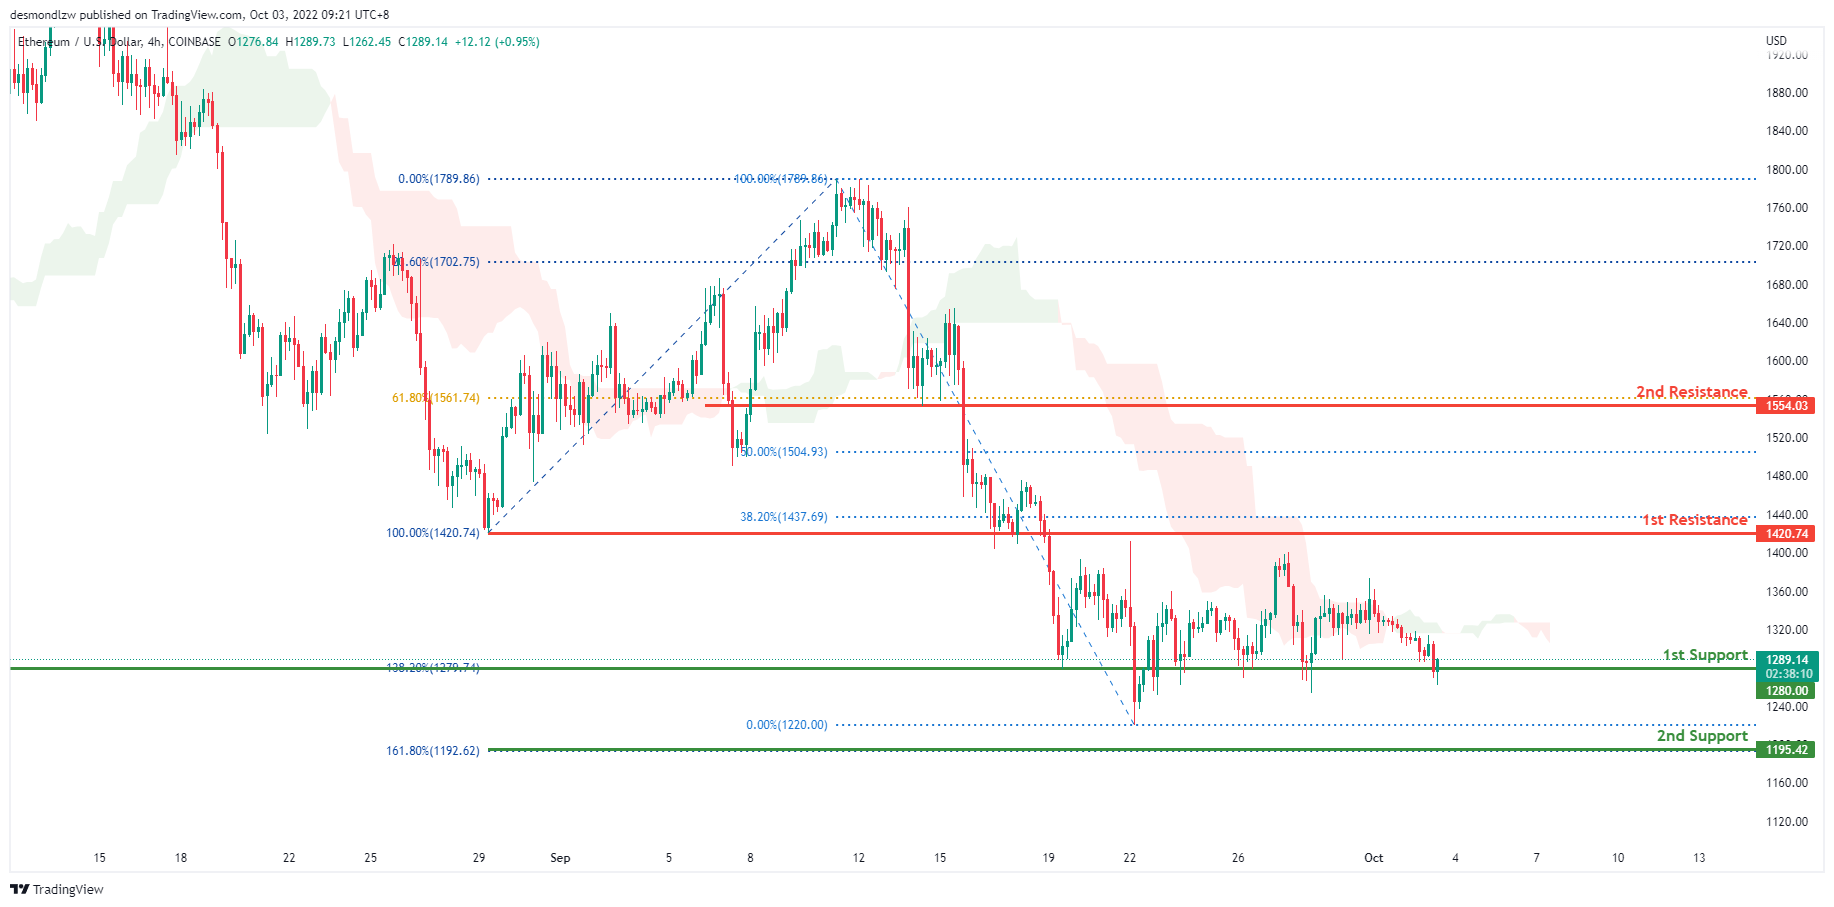
The overall price of ETHUSD on the H4 is very bearish. In addition, the price is below the ichimoku cloud, indicating a bear market. For the past two weeks, price has been consolidating above the first support line at 1270.74, which also happens to be the 138.2% Fibonacci line. Expect price to break through this support level and head towards the second support level at 1192.62, which contains the 161.8% Fibonacci extension line.
Areas of consideration:
- H4 time frame, 1st resistance of 1420.74
- H4 time frame, 1st support at 1280.00
BTCUSD:
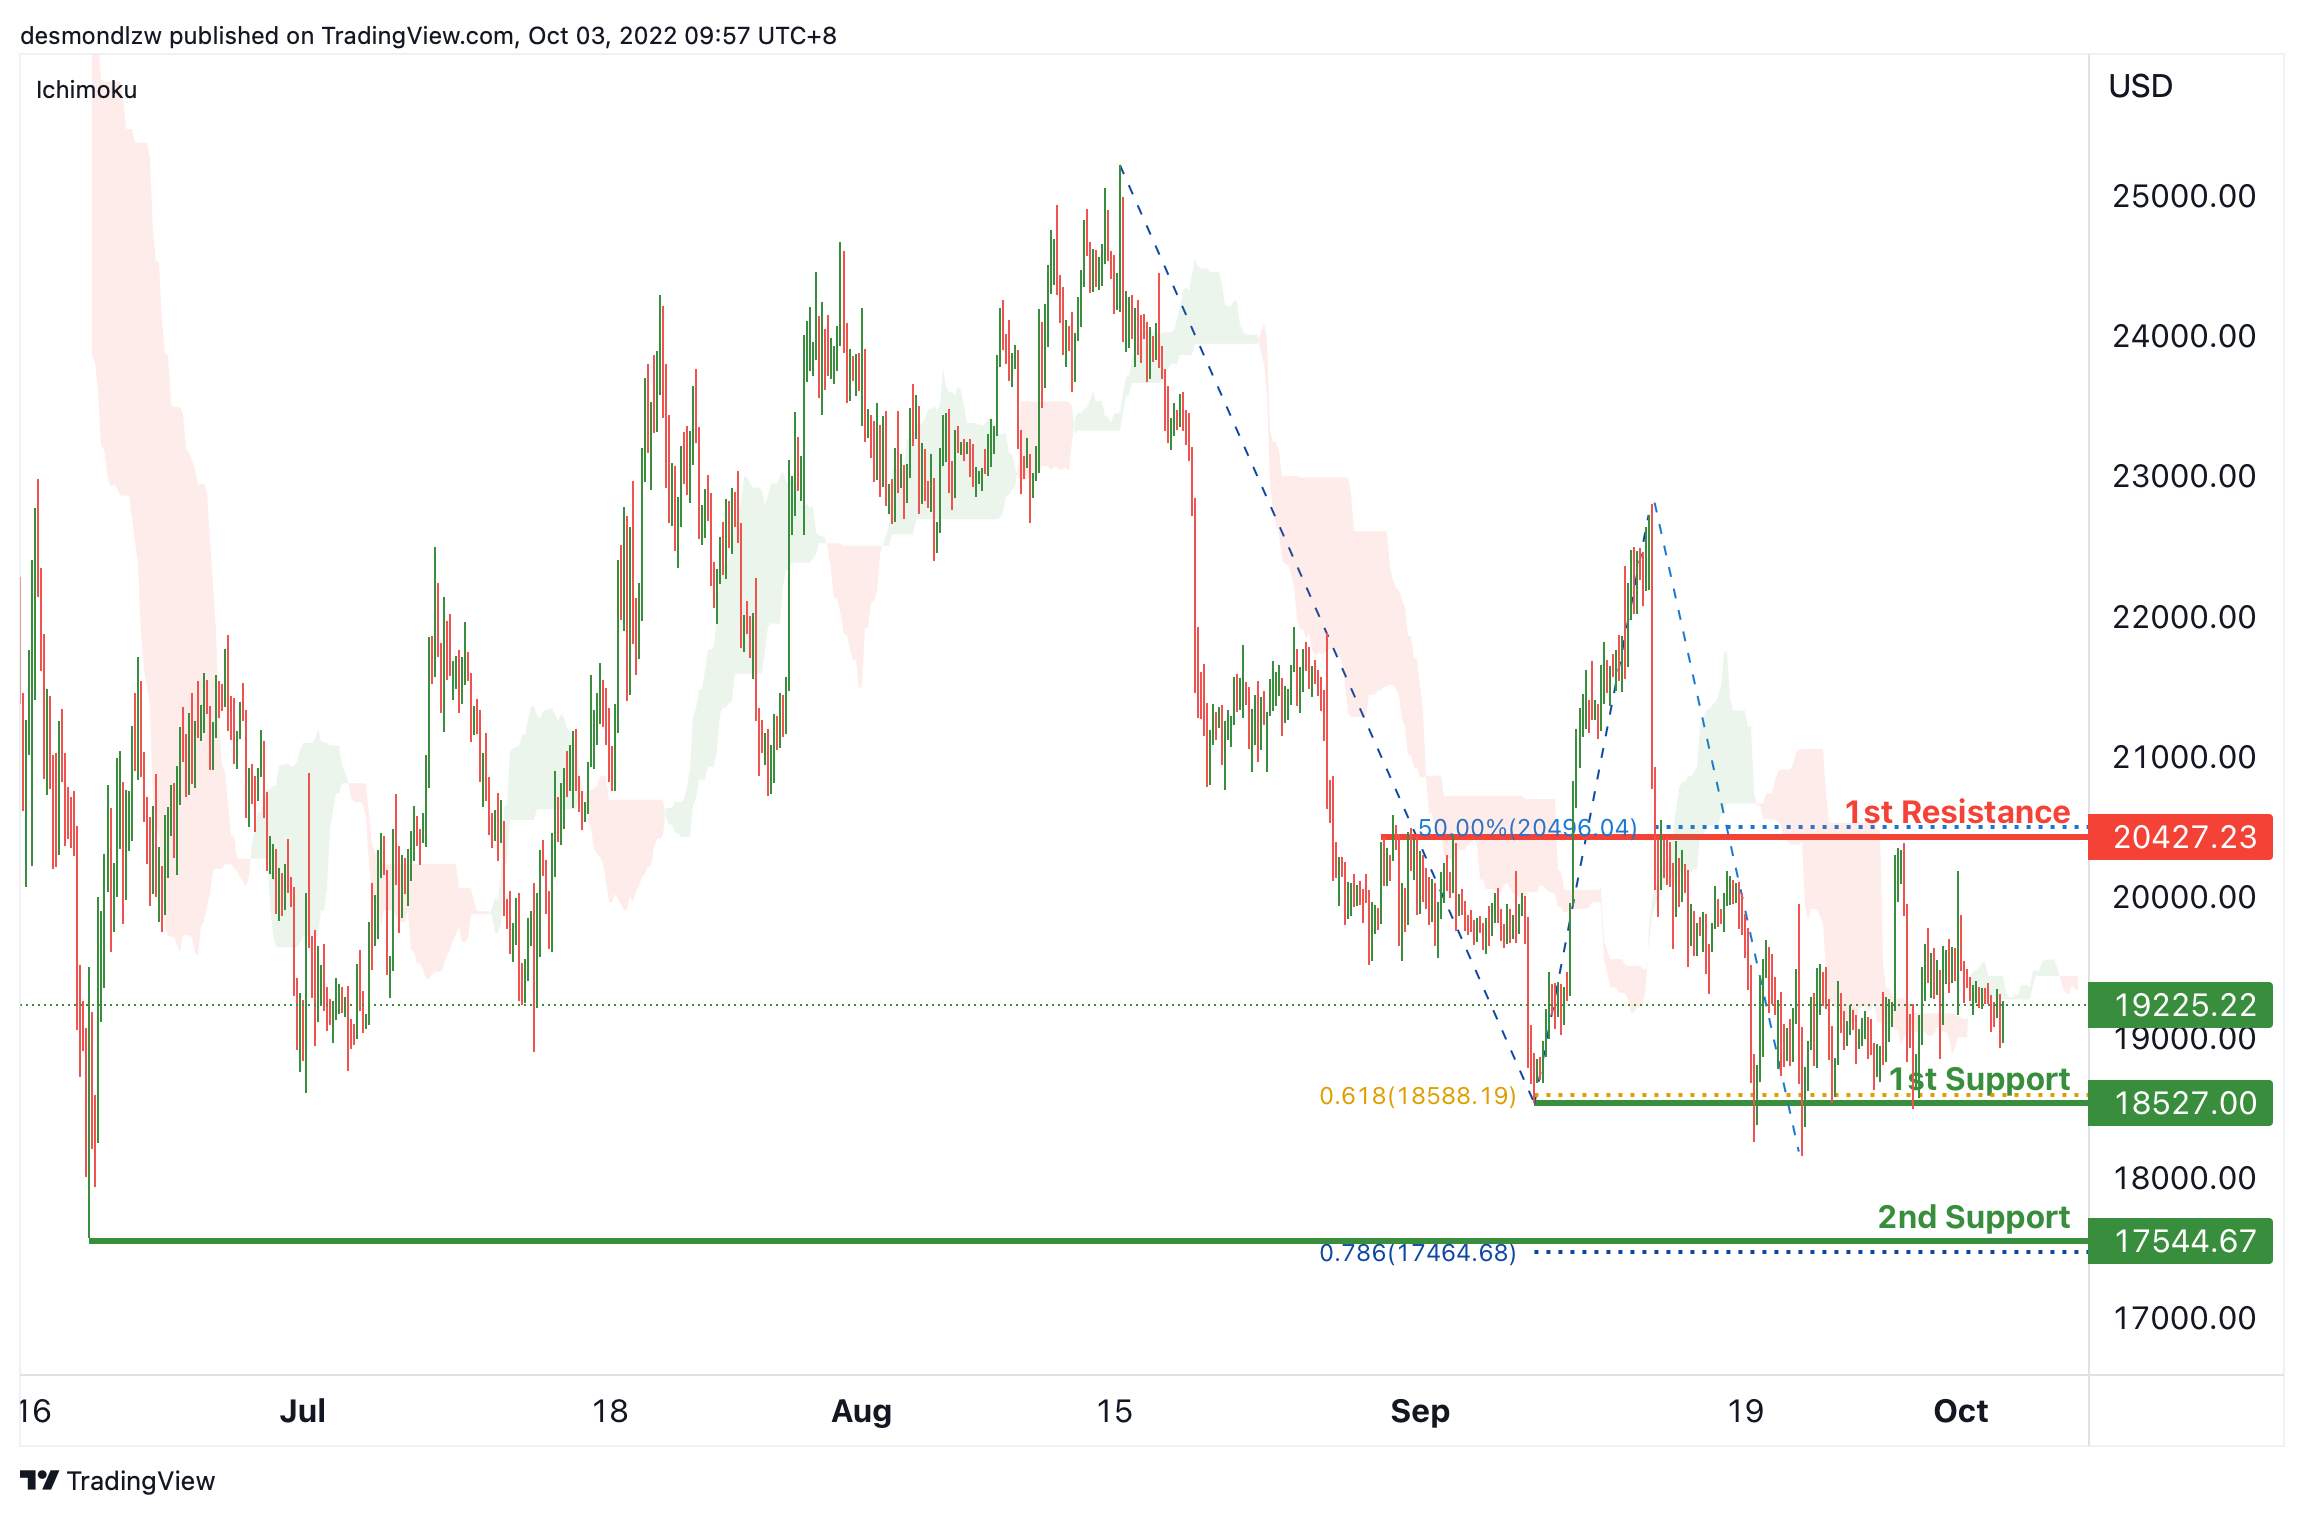
On the H4, price is consolidating. Currently the price is below the ichimoku cloud, the price may test the 1st the 1st support at 18527, which is in line with the swing lows and 61.8% fibonacci projection. If the 1st support is broken, the 2nd support could be at 17544.67, which is in line with the 78.6% fibonacci projection and swing low. Alternatively, the price may rise to test the resistance at 20427.23, where the overlap resistance and 50% fibonacci retracement are.
Areas of consideration:
- H4 time frame, 1st resistance at 20427.23
- H4 time frame, 1st support at 18527
S&P 500:
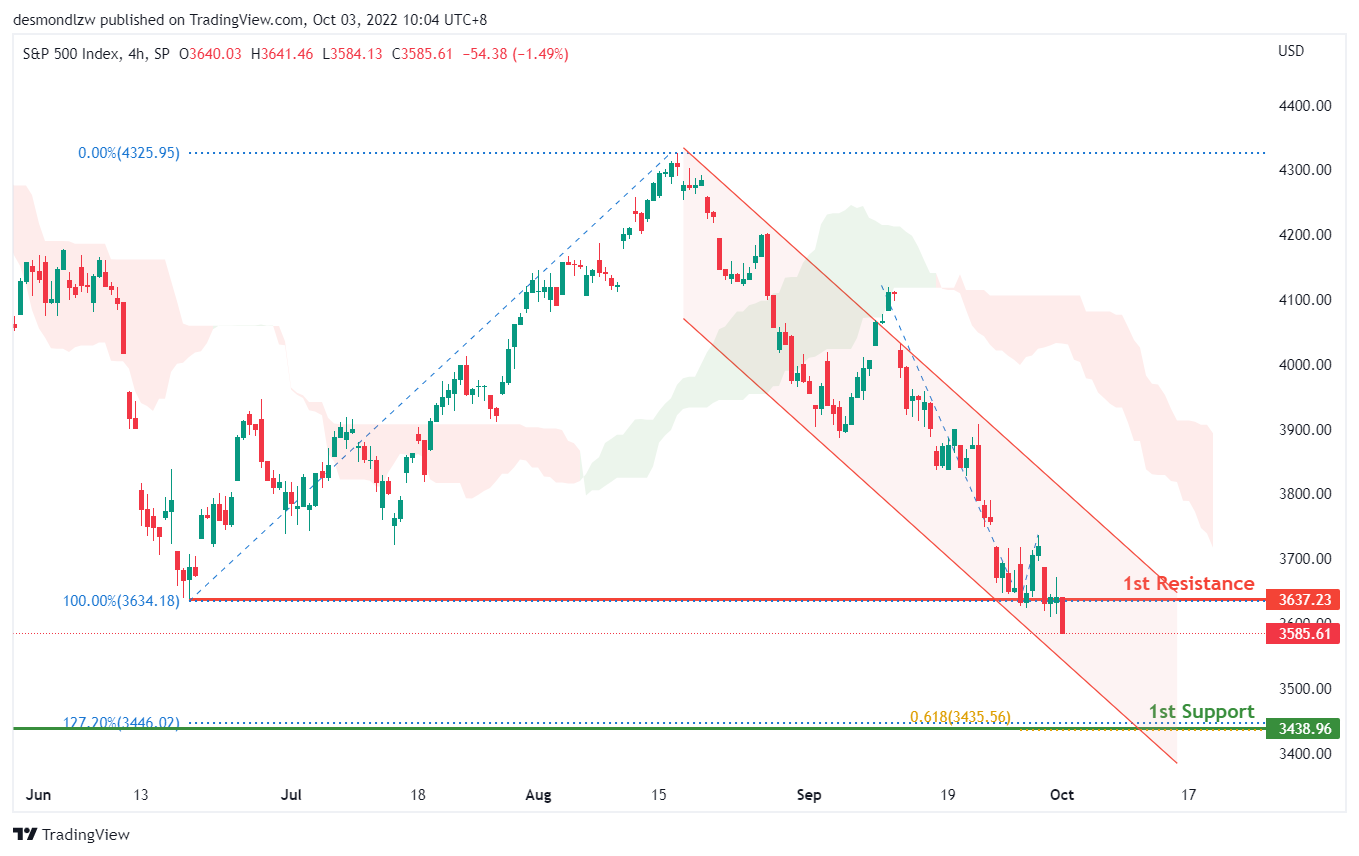
On the H4, with the price trading lower from the 1st resistance, within the descending channel and below the ichimoku cloud, we continue to have a bearish bias. Look for a bearish continuation with the 1st support at 3438.96, which is in line with the previous swing low of October 2020, 127.20% fibonacci expansion and 61.8% fibonacci extension level.
Areas of consideration:
- H4 time frame, 1st resistance at 3637.23
- H4 time frame, 1st support at 3438.96
Japan PMI manufacturing finalized at 50.8, weakness even turned worse
Japan PMI Manufacturing was finalized at 50.8 in September, down from August's 51.5. S&P Global said high inflation and subdued global market conditions weight on order books. Output fell at sharpest pace in a year, while input buying reduced. Weak yen drove inflationary pressures higher.
Joe Hayes, Senior Economist at S&P Global Market Intelligence, said: "Weakness in Japan's manufacturing sector persisted in September and even turned worse. New orders fell at their sharpest rate in two years – high inflation is eroding client purchasing power, while slowing global economic growth is hurting exports. Weakness in the yen is doing little to bolster export demand either and instead is pushing imported inflation up drastically and drove domestic price pressures up even further."