Sample Category Title
XAU/USD: Gold Edges Higher But Gains Likely to be Limited
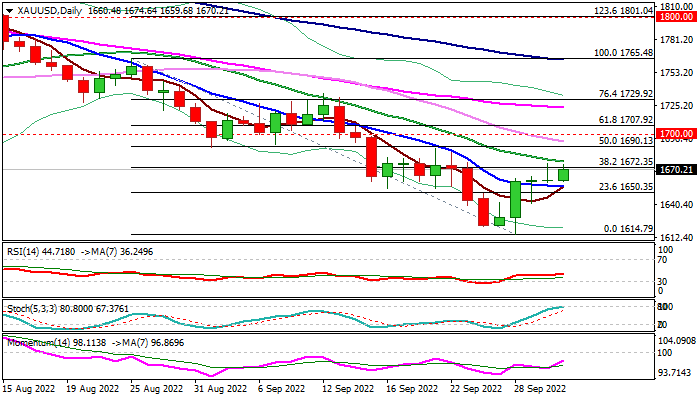
Spot gold price rose on Monday, generating initial signal of bullish continuation after the action in past two days moved in a large swings but without direction, leaving a double – Doji candles, one with long tail and the other with long upper shadow.
Weaker dollar contributed to metal’s fresh strength, but near-term bullish structure is still fragile, and gains could be short-lived, as signals that Fed remains on aggressive path on interest rate hikes, would continue to underpin the dollar.
Daily techs support scenario as momentum, although heading north, is still deeply in negative zone and stochastic is about to enter overbought territory, while moving averages are in mixed setup.
Fresh advance cracked pivotal Fibo barrier at $1672 (38.2% of $1765/$1614 and pressuring falling 20DMA ($1677), with sustained break here to firm near-term structure for further recovery which should be capped at key $1690/$1700 zone.
Repeated failure to register daily close above $1672 would keep the downside vulnerable and generate initial signal of possible recovery stall.
Res: 1672; 1277; 1690; 1700.
Sup: 1655; 1650; 1641; 1622.
USD/JPY Mid-Day Outlook
Daily Pivots: (S1) 144.36; (P) 144.59; (R1) 144.96; More...
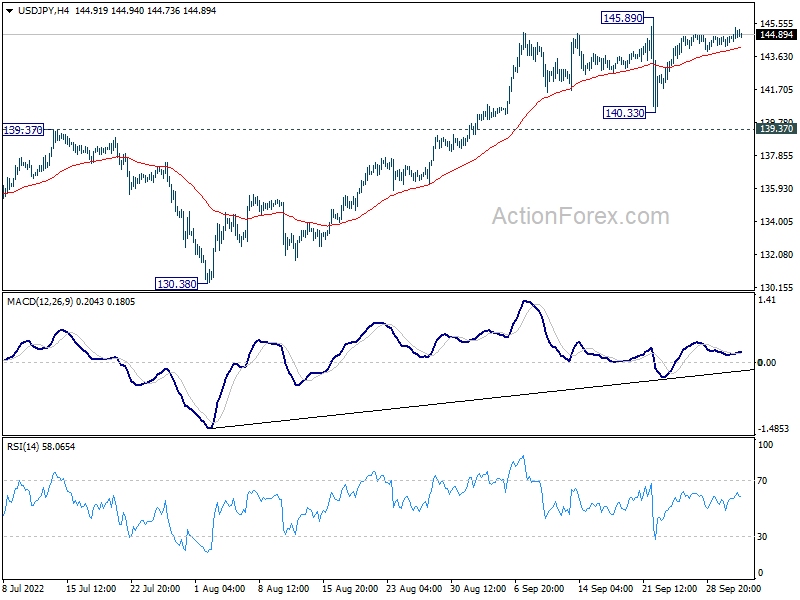
Intraday bias in USD/JPY stays neutral first, and consolidation from 145.89 could extend. Further rally is expected as long as 139.37 resistance turned support holds. Break of 145.89 will target 147.68 long term resistance. On the downside, however, decisive break of 139.37 will confirm short term topping. Deeper decline would be seen back towards 130.38 support.
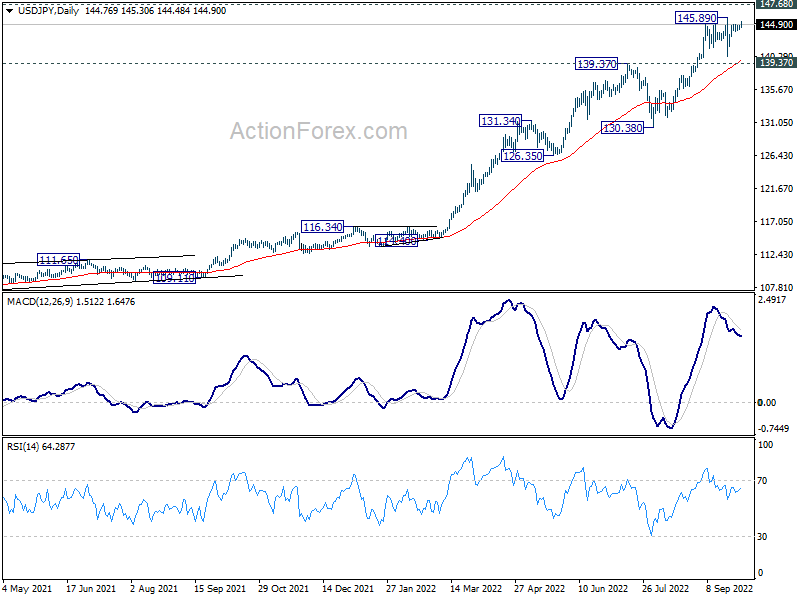
In the bigger picture, up trend from 101.18 is still in progress, as part of the whole up trend from 75.56 (2011 low). Further rise should be seen to 147.68 (1998 high). For now, break of 130.38 support is needed to be the first indication of medium term topping. Otherwise, outlook will stay bullish even in case of deep pull back.
USD/CHF Mid-Day Outlook
Daily Pivots: (S1) 0.9779; (P) 0.9828; (R1) 0.9918; More...
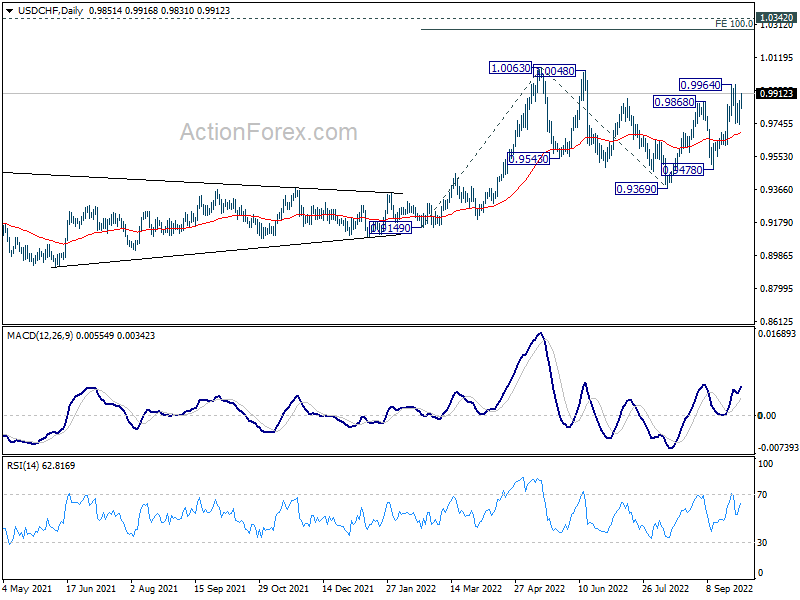
Intraday bias in USD/CHF remains neutral and outlook is unchanged. On the upside, above 0.9964 will resume the rally from 0.9369 to retest 1.0063 high. On the downside, break of 0.9694 support will extend the corrective pattern from 1.0063 with another falling leg, towards 0.9478 support first.
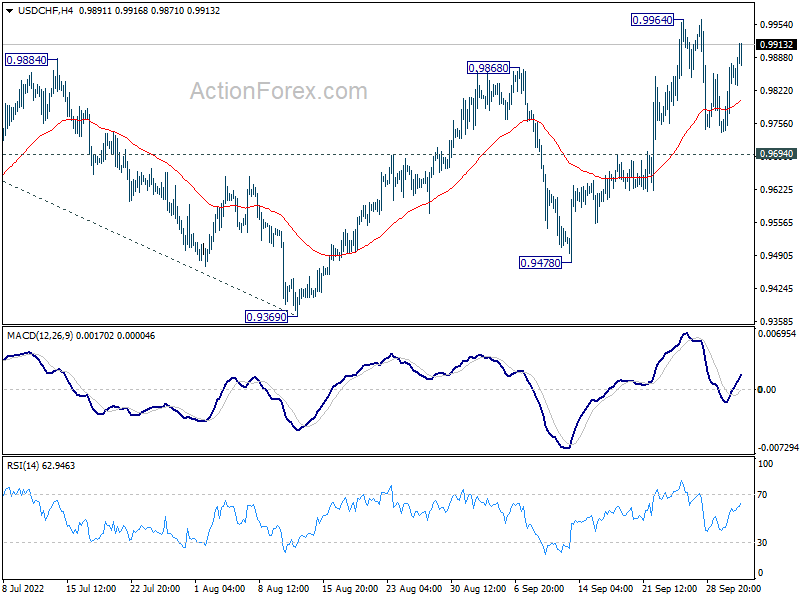
In the bigger picture, current development suggests that up trend from 0.8756 (2021 low) is still in progress. Sustained break of 1.0063 will target 100% projection of 0.9149 to 1.0063 from 0.9369 at 1.0283, and then 1.0342 (2016 high). For now, this will remain the favored case as long as 0.9369 support holds, even in case of deep pull back.
EUR/USD Mid-Day Outlook
Daily Pivots: (S1) 0.9740; (P) 0.9797; (R1) 0.9859; More...
Intraday bias in EUR/USD remains neutral and outlook is unchanged. Break of 0.9634 minor support will suggest that larger down trend is ready to resume. Intraday bias will be back on the downside for 0.9534 and below. However, sustained break of 0.9863 will confirm short term bottoming, and bring stronger rally back to 1.0197 resistance instead.
In the bigger picture, down trend from 1.6039 (2008 high) is still in progress. Next target is 100% projection of 1.3993 to 1.0339 from 1.2348 at 0.8694. In any case, break of 1.0197 resistance is needed to be the first sign of medium term bottoming. Otherwise, outlook will stay bearish even with strong rebound.
GBP/USD Mid-Day Outlook
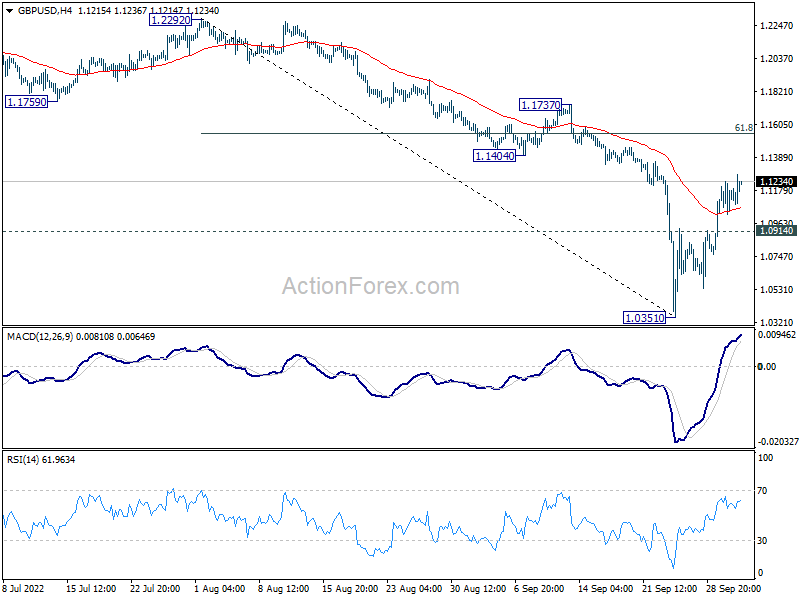
Daily Pivots: (S1) 1.1052; (P) 1.1143; (R1) 1.1260; More...
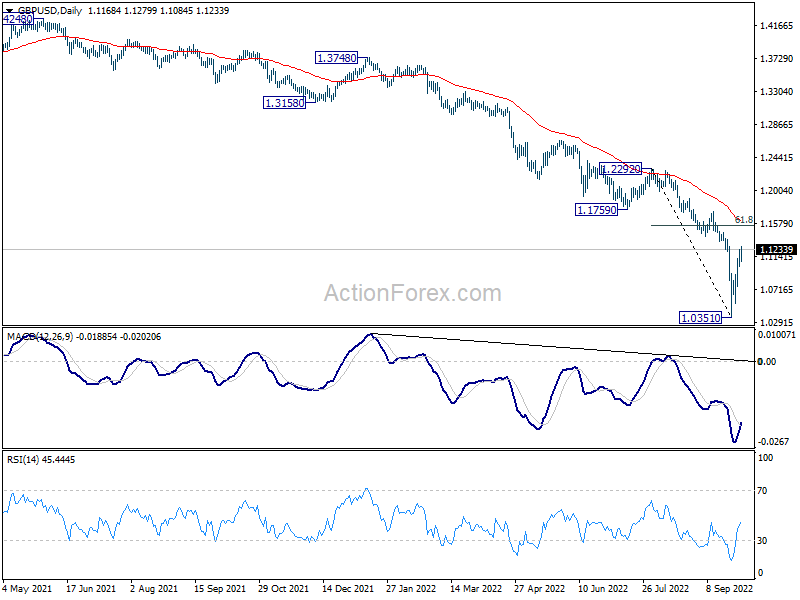
GBP/USD's rebound from 1.0351 is in progress and intraday bias stays on the upside, Further rally would be seen to 61.8% retracement of 1.2292 to 1.0351 at 1.1551. On the downside, break of 1.0914 minor support will indicate that the rebound is over, and bring retest of 1.0351 low.
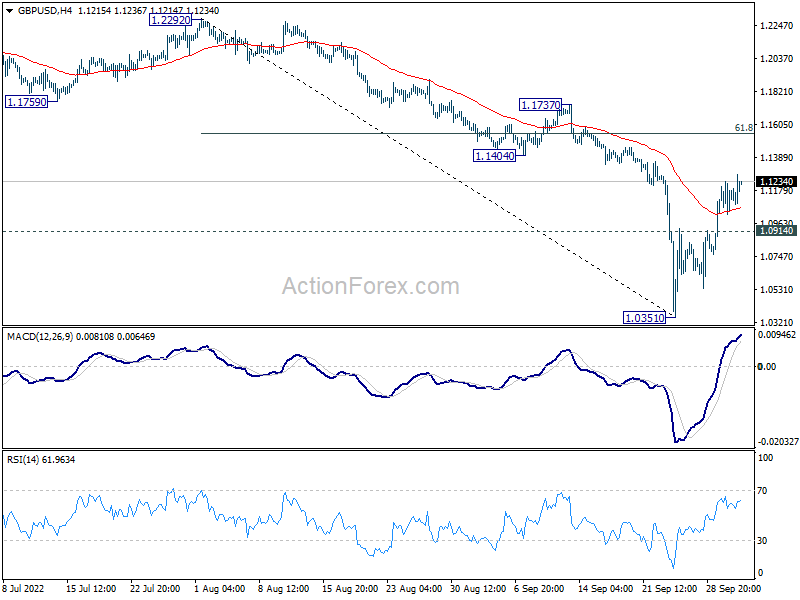
In the bigger picture, fall from 1.4248 (2018 high) is resuming long term down trend from 2.1161 (2007 high). Next target is 100% projection of 2.1161 to 1.3503 from 1.7190 at 0.9532. There is no scope of a medium term rebound as long as 1.1759 support turned resistance holds.
Euro and Swiss Franc Down, Sterling Extending Rebound
Funds appear to be flowing out of Euro and Swiss Franc, in relatively quiet trading today. Some focuses are on the Euro-denominated bonds issued by Credit Suisse, which dropped to record lows. Investors are concerned about the Swiss bank's restructuring program, due to be announced later in the month. Euro and Franc are the worst performers, followed by Yen, while Dollar is mixed. Sterling is trying to rebound after UK Finance Minister Kwasi Kwarteng confirmed to abandons plan to scrap 45p top rate of income tax. But Aussie and Kiwi are stronger ahead of rate hikes by RBA (Tue) and RBNZ (Wed).
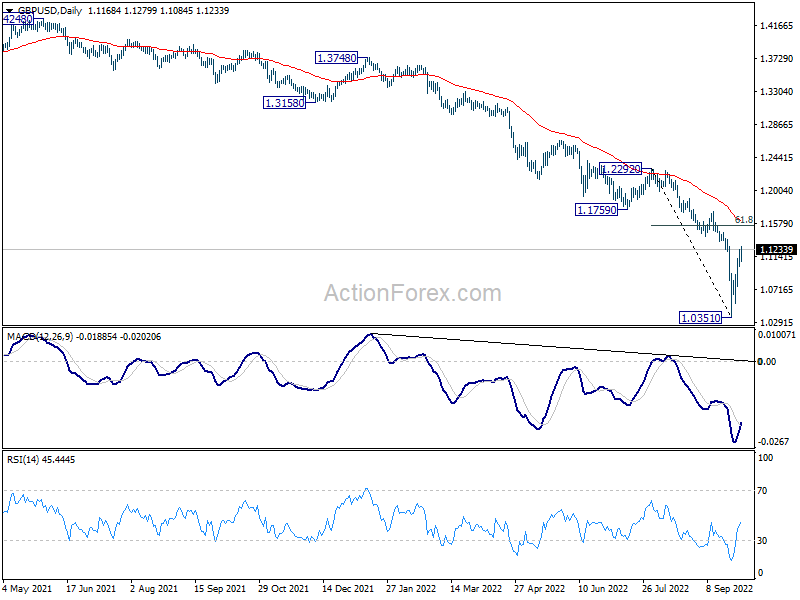
Technically, EUR/GBP is breaking through 0.8720 resistance turned support to indicate near term bearish reversal. But the question is whether it's translated into more upside in GBP/USD, downside in EUR/USD, or both. For now, outlook in EUR/USD isn't bullish as long as 0.9863 support turned resistance holds. Break of 0.9634 minor support will bring retest of 0.9534 low.
In Europe, at the time of writing, FTSE is down -0.34%. DAX is down -0.07%. CAC is down -0.27%. Germany 10-year yield is down -0.134 at 1.977. Earlier in Asia, Nikkei rose 1.07%. Hong Kong HSI dropped -0.83%. China was on holiday. Singapore Strait Times dropped -0.74%. Japan 10-year JGB yield dropped -0.0079 to 0.244.
UK PMI manufacturing finalized at 48.4, goods producing sector a drag on GDP
UK PMI Manufacturing was finalized at 48.4 in September, up from August's 47.3. S&P Global said output and new orders fell further. New export business declined. Input costs and output price inflation accelerated.
Rob Dobson, Director at S&P Global Market Intelligence, said: "The downturn in UK manufacturing continued at the end of the third quarter, meaning the goods producing sector looks set to have acted as a drag on GDP. Manufacturers have once again cut back production as new order intakes declined for the fourth successive month.
"Factories are reporting tough market conditions both at home and abroad. Disappointingly, exports continue to fall despite the more competitive exchange rate.
"There was also less positive news on the price front, with rates of inflation in input costs and selling prices both picking up in September, linked in part to import costs rising due to the weaker pound.
Eurozone PMI manufacturing finalized at 48.4, ugly combination of recession and inflation
Eurozone PMI Manufacturing was finalized at 48.4 in September, down from August's 49.6. That's also a 27-month low. Looking at some member states, France PMI Manufacturing was finalized at 47.7, a 28-month low. Germany was finalized at 47.8, a 27-month low. Greece (49.7), the Netherlands (49.0), Spain (49.0), Austria (48.8) and Italy (48.3) were all in contraction, while Ireland (51.5) was in expansion.
Chris Williamson, Chief Business Economist at S&P Global Market Intelligence said: "The ugly combination of a manufacturing sector in recession and rising inflationary pressures will add further to concerns about the outlook for the eurozone economy... Excluding the initial pandemic lockdowns, eurozone manufacturers have not seen a collapse of demand and production on this scale since the height of the global financial crisis in early-2009.
Swiss CPI unexpectedly slowed to 3.3% yoy
Swiss CPI dropped -0.2% mom in September, below expectation of 0.1% mom. The decrease of 0.2% compared with the previous month can be explained by several factors including falling prices for fuels, heating oil, hotels and supplementary accommodation. In contrast, prices for clothing and footwear increased.
Comparing with the same month a year ago, CPI slowed to 3.3% yoy, down from 3.5% yoy, below expectation of 3.5% yoy. Core CPI (excluding fresh and seasonal products, energy and fuel) was flat mom, up 2.0% yoy (unchanged from August). Domestic product prices rose 1.8% yoy (unchanged from August). Imported product prices rose 7.8% yoy (down from 8.6% yoy in August).
BoJ: Upside risks of inflation to be examined humbly and without any preconceptions
In the summary of opinions of BoJ's September 21-22 meeting, it's noted that risks of "consumer prices deviating significantly upward from the baseline scenario, including the impact of foreign exchange rates, needs to be examined humbly and without any preconceptions."
But while a "certain degree of upside risk to prices" exists, there is a "long way to go" to achieve 2% inflation target in a "sustainable and stable manner". Output gap has been "negative", unemployment rate and active active job openings-to-applicants ratio "have not returned to pre-pandemic levels". Surge in energy and raw material prices has brought about an "outflow of income" from Japan. It is "appropriate" to continue with the current monetary easing.
Regarding exchange rate, one opinion noted that " further depreciation of the yen is partly due to differences in the direction of monetary policy between Japan and other economies.. the Bank needs to carefully explain the significance of continuing with the current monetary easing."
Japan business outlook deteriorated in Q3
Japan Tankan large manufacturing index dropped from 9 to 8, below expectation of 11. That's the third straight quarter of deterioration. Non-manufacturing index improve slightly from 13 to 14, above expectation of 13, and rise for the second straight quarter.
Large manufacturing outlook dropped from 10 to 9, below expectation of 11. Non-manufacturing outlook also deteriorated from 13 to 11, below expectation of 15.
Nevertheless, large companies are expected to increase capital expenditure by 21.5% in the current fiscal year ending March 2023, above expectation of 18.8%.
Meanwhile, companies expect inflation to hit 2.6% a year from now, and 2.1% three years ahead. Five years ahead inflation is also projected at 2.0%, highest since data became available in 2014.
Japan PMI manufacturing finalized at 50.8, weakness even turned worse
Japan PMI Manufacturing was finalized at 50.8 in September, down from August's 51.5. S&P Global said high inflation and subdued global market conditions weight on order books. Output fell at sharpest pace in a year, while input buying reduced. Weak yen drove inflationary pressures higher.
Joe Hayes,, Senior Economist at S&P Global Market Intelligence, said: "Weakness in Japan's manufacturing sector persisted in September and even turned worse. New orders fell at their sharpest rate in two years – high inflation is eroding client purchasing power, while slowing global economic growth is hurting exports. Weakness in the yen is doing little to bolster export demand either and instead is pushing imported inflation up drastically and drove domestic price pressures up even further."
GBP/USD Mid-Day Outlook
Daily Pivots: (S1) 1.1052; (P) 1.1143; (R1) 1.1260; More...
GBP/USD's rebound from 1.0351 is in progress and intraday bias stays on the upside, Further rally would be seen to 61.8% retracement of 1.2292 to 1.0351 at 1.1551. On the downside, break of 1.0914 minor support will indicate that the rebound is over, and bring retest of 1.0351 low.
In the bigger picture, fall from 1.4248 (2018 high) is resuming long term down trend from 2.1161 (2007 high). Next target is 100% projection of 2.1161 to 1.3503 from 1.7190 at 0.9532. There is no scope of a medium term rebound as long as 1.1759 support turned resistance holds.
Economic Indicators Update
| GMT | Ccy | Events | Actual | Forecast | Previous | Revised |
|---|---|---|---|---|---|---|
| 23:50 | JPY | Tankan Large Manufacturing Index Q3 | 8 | 11 | 9 | |
| 23:50 | JPY | Tankan Non-Manufacturing Index Q3 | 14 | 13 | 13 | |
| 23:50 | JPY | Tankan Large Manufacturing Outlook Q3 | 9 | 11 | 10 | |
| 23:50 | JPY | Tankan Non-Manufacturing Outlook Q3 | 11 | 15 | 13 | |
| 23:50 | JPY | Tankan Large All Industry Capex Q3 | 21.50% | 18.80% | 18.60% | |
| 00:00 | AUD | TD Securities Inflation M/M Sep | 0.50% | -0.50% | ||
| 00:30 | JPY | Manufacturing PMI Sep F | 50.8 | 51 | 51 | |
| 06:30 | CHF | CPI M/M Sep | -0.20% | 0.10% | 0.30% | |
| 06:30 | CHF | CPI Y/Y Sep | 3.30% | 3.50% | 3.50% | |
| 07:30 | CHF | SVME PMI Sep | 57.1 | 54.6 | 56.4 | |
| 07:45 | EUR | Italy Manufacturing PMI Sep | 48.3 | 47.5 | 48 | |
| 07:50 | EUR | France Manufacturing PMI Sep F | 47.7 | 47.8 | 47.8 | |
| 07:55 | EUR | Germany Manufacturing PMI Sep F | 47.8 | 48.3 | 48.3 | |
| 08:00 | EUR | Eurozone Manufacturing PMI Sep F | 48.4 | 48.5 | 48.5 | |
| 08:30 | GBP | Manufacturing PMI Sep | 48.4 | 48.5 | 48.5 | |
| 13:30 | CAD | Manufacturing PMI Sep | 50.6 | 48.7 | ||
| 13:45 | USD | Manufacturing PMI Sep F | 51.8 | 51.8 | ||
| 14:00 | USD | ISM Manufacturing PMI Sep | 52.3 | 52.8 | ||
| 14:00 | USD | ISM Manufacturing Prices Paid Sep | 51.8 | 52.5 | ||
| 14:00 | USD | ISM Manufacturing Employment Index Sep | 54.2 | |||
| 14:00 | USD | Construction Spending M/M Aug | -0.30% | -0.40% |
EURUSD is Too Oversold
EURUSD, the world’s most liquid currency market pair, ended September down 2.5%, having consolidated below parity. A combination of technical and fundamental factors raises the chances of a rebound in the pair, potentially translating into long-term growth.
Last week ended on the bulls’ flag, which pushed the pair up by 3.2% to the week’s lows and allowed it to return to 0.9800 vs the lows of 0.9535 by the end.
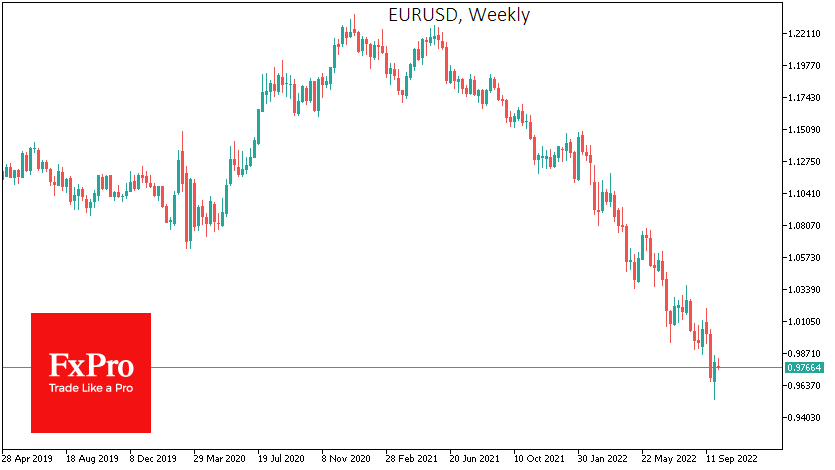
Of the last 15 months, declines have been recorded on 12 occasions, indicating sustained bearish sentiment. However, the accumulated oversold conditions in the pair during this period show that ‘buying the dip’ has intensified.
A large lower shadow on a monthly candlestick in the EURUSD after a prolonged downward trend might also be an early sign of a positive month ahead. There are plenty of such examples in the pair’s history.
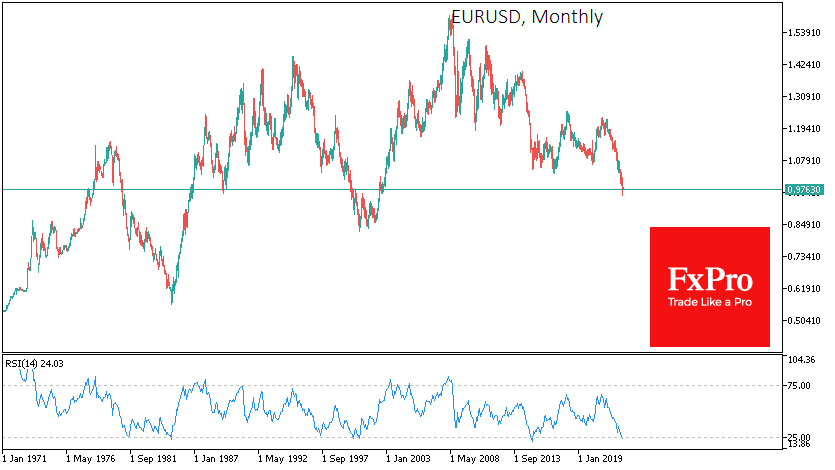
But an even stronger signal is the oversold RSI on the monthly charts. This index closed the month below the 25 levels. In the history of the Euro (including the one that has been emulated since 1971 based on its components), the index has reached such low levels five times, and for the following month, the rate rose by 3.9% with a range of 0.8% to 8.2%.
However, we also point out that the reversal from decline to rise occurred only in 1985. In the other cases, the low RSI signalled a switch from downside to sideways (October 2000, 2015) or a significant shake-up of some months (1981, April 2000).
In addition, there are signs that fundamental factors are increasingly supporting the corrective rebound. Monetary tightening in the eurozone is gaining momentum, preparing the markets for a rate hike of 75 points for the second time.
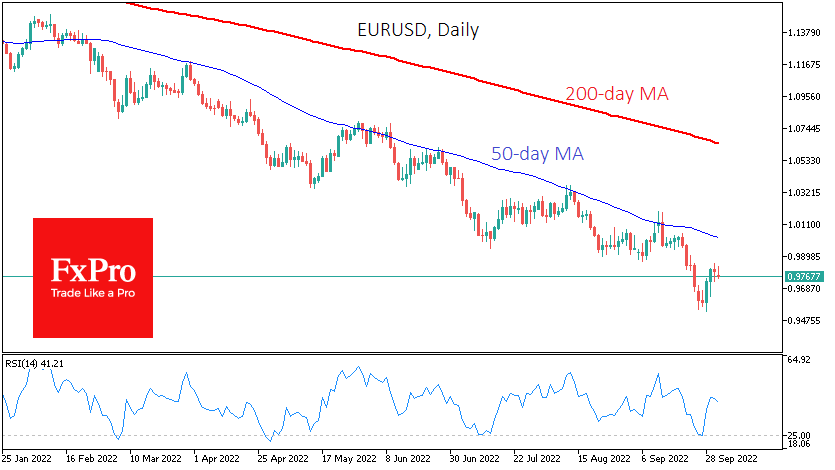
While the Fed is likely to slow down with policy tightening in the coming months in response to slowing inflation and the economy, this is not expected from the ECB, which will work to reduce spreads between European and US debt securities. This change would help to shift the balance of power in favour of the single currency.
In our view, it would not be surprising if market speculators saw the current low quotations for the Euro as a good buying point with a view to a possible long-term reversal.
AUD/USD Rebounds ahead of RBA
AUD/USD has started the trading week with strong gains. The Aussie is trading at 0.6447, up 0.67%.
Is the nasty slide over? The Australian dollar is coming off a third straight losing week. September was a disaster, as AUD/USD plummeted 6.4%. The escalation in the war in Ukraine, which has sapped risk sentiment, and the aggressive Federal Reserve have dampened market appetite for the risk-related Australian dollar.
RBA likely to hike by 50bp
The RBA meets on Tuesday, and Bank members are widely expected to deliver a fifth consecutive hike of 50 basis points, which would take the benchmark rate to 2.85%. After that, the RBA may lower gears to 25bp moves. Governor Lowe has signaled that he would like to shift to 25bp hikes at some point, which would help guide the economy to a soft landing and avoid choking off economic growth. However, there is no indication that inflation has peaked, and soaring inflation was the primary reason for the RBA’s sharp rate-hike cycle. The next inflation report will be released in late October, with the RBA November meeting just one week later. It’s a safe bet that the size of the rate hike in November will depend to a large extent on that inflation report.
In the US, the Fed may make a U-turn in policy before the end of the year, depending on the strength of the economy. The data can be conflicting, which was the case on Friday. The Fed’s preferred inflation indicator, the Core PCE Index, rose 4.9% in August, up from 4.7% in July and above the consensus of 4.7%. At the same time, the University of Michigan sentiment index showed that inflation expectations for 5-10 years ticked lower to 2.8%, down from 2.7%. In the meantime, the Fed’s hawkish stance has fuelled the US dollar’s upswing.
AUD/USD Technical
- AUD/USD has support at 0.6450 and 0.6363
- There is resistance at 0.6598 and 0.6685
Gold Price Moved into a Positive Zone above $1,645
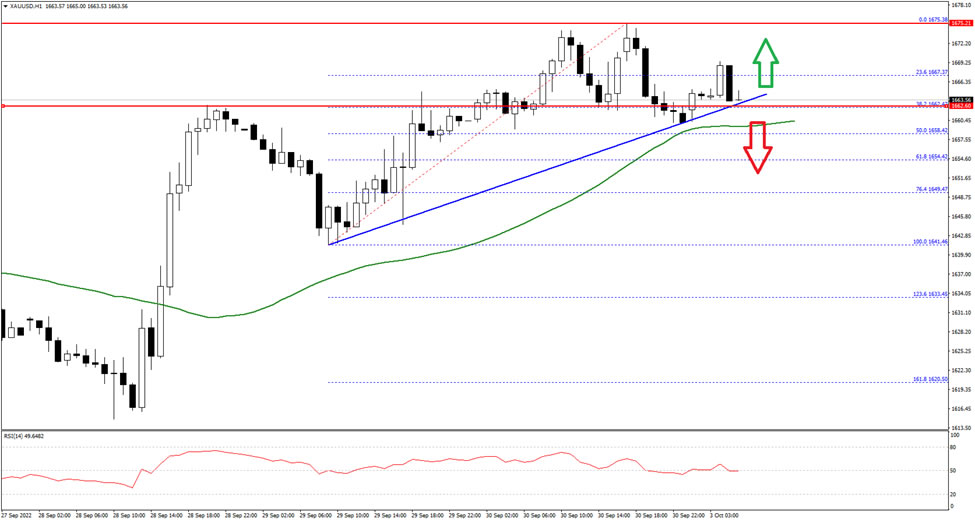
Gold price started a fresh upward move from the $1,615 zone against the US Dollar. The price climbed above the $1,645 resistance zone to move into a positive zone.
The pair even climbed above the $1,660 level and the 50 hourly simple moving average. A high was formed near $1,675 before the price corrected gains. On the downside, the price now trading near a bullish trend line with support at $1,662 on the hourly chart.
The next major support is near the $1,658 level, below which the price might decline towards the $1,650 support level in the near term. Any more losses might call for a test of $1,632 on FXOpen.
On the upside, the first major resistance is near the $1,672 level. The next main resistance could be near the $1,675 level, above which the price could start another steady increase.
EUR/USD: Euro Loses Traction But More Evidence Needed to Signal Recovery Stall
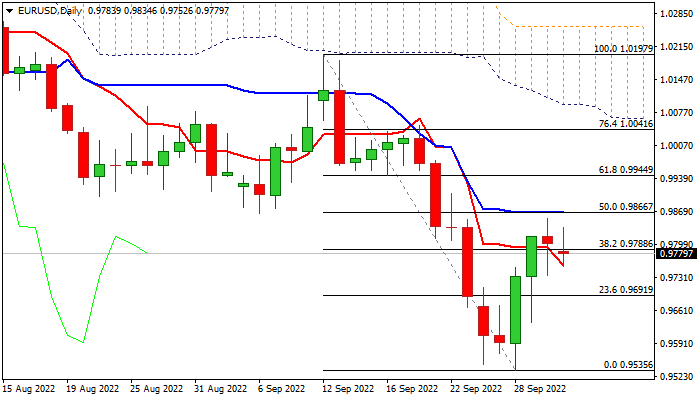
The Euro remains at the back foot on Monday, weighed by weak EU PMI data and higher oil prices, as well as bloc’s record inflation, while last Friday’s bearish Doji candle generates initial warning that three-day recovery might be over.
Monday’s action is holding in red, although still without clear direction, as fresh bears pressure initial support at 0.9755 (daily Tenkan-sen), with break here to generate initial negative signal, which will be confirmed by extension and close below pivotal support at 0.9732 (Fibo 38.2% of 0.9535/0.9853).
Overbought stochastic on daily chart and momentum holding deeply in the negative territory, support bearish near-term scenario.
Monthly drop of 2.5% in September (the fourth consecutive month in red) signals that bears are firmly in play, although last week’s bullish close suggests that bears may hold in extended consolidation before continuing.
Res: 0.9834; 0.9853; 0.9866; 0.9907.
Sup: 0.9755; 0.9732; 0.9694; 0.9657.