Sample Category Title
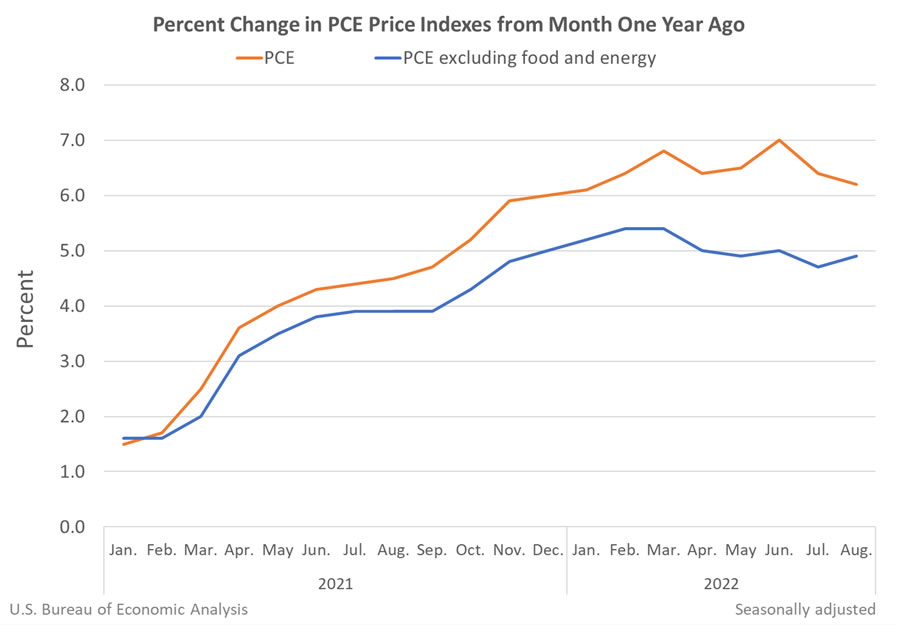
US PCE price slowed to 6.2% yoy, core PCE rose to 4.9% yoy
US personal income rose 0.3% mom or USD 71.6B in August, matched expectations. Personal spending rose 0.4% mom or USD 67.6B, above expectation of 0.2% mom.
PCE price index rose 0.3% mom, matched expectations. PCE core price index, ex-food and energy, rose 0.6% mom, above expectation of 0.5% mom. Prices for goods dropped -0.3% mom while prices for services rose 0.6% mom. Food prices rose 0.8% mom. Energy prices dropped -5.5% mom.
From the same month a year ago, PCE price index slowed from 6.4% yoy to 6.2% yoy, below expectation of 6.6% yoy. PCE core price index, ex-food and energy, accelerated from 4.7% yoy to 4.9% yoy, above expectation of 4.7% yoy. Goods prices rose 8.6% yoy while services prices rose 5.0% yoy. Food prices jumped 12.4% yoy and energy prices jumped 24.7% yoy.
GBPUSD Extends Recovery, But Still in Downtrend
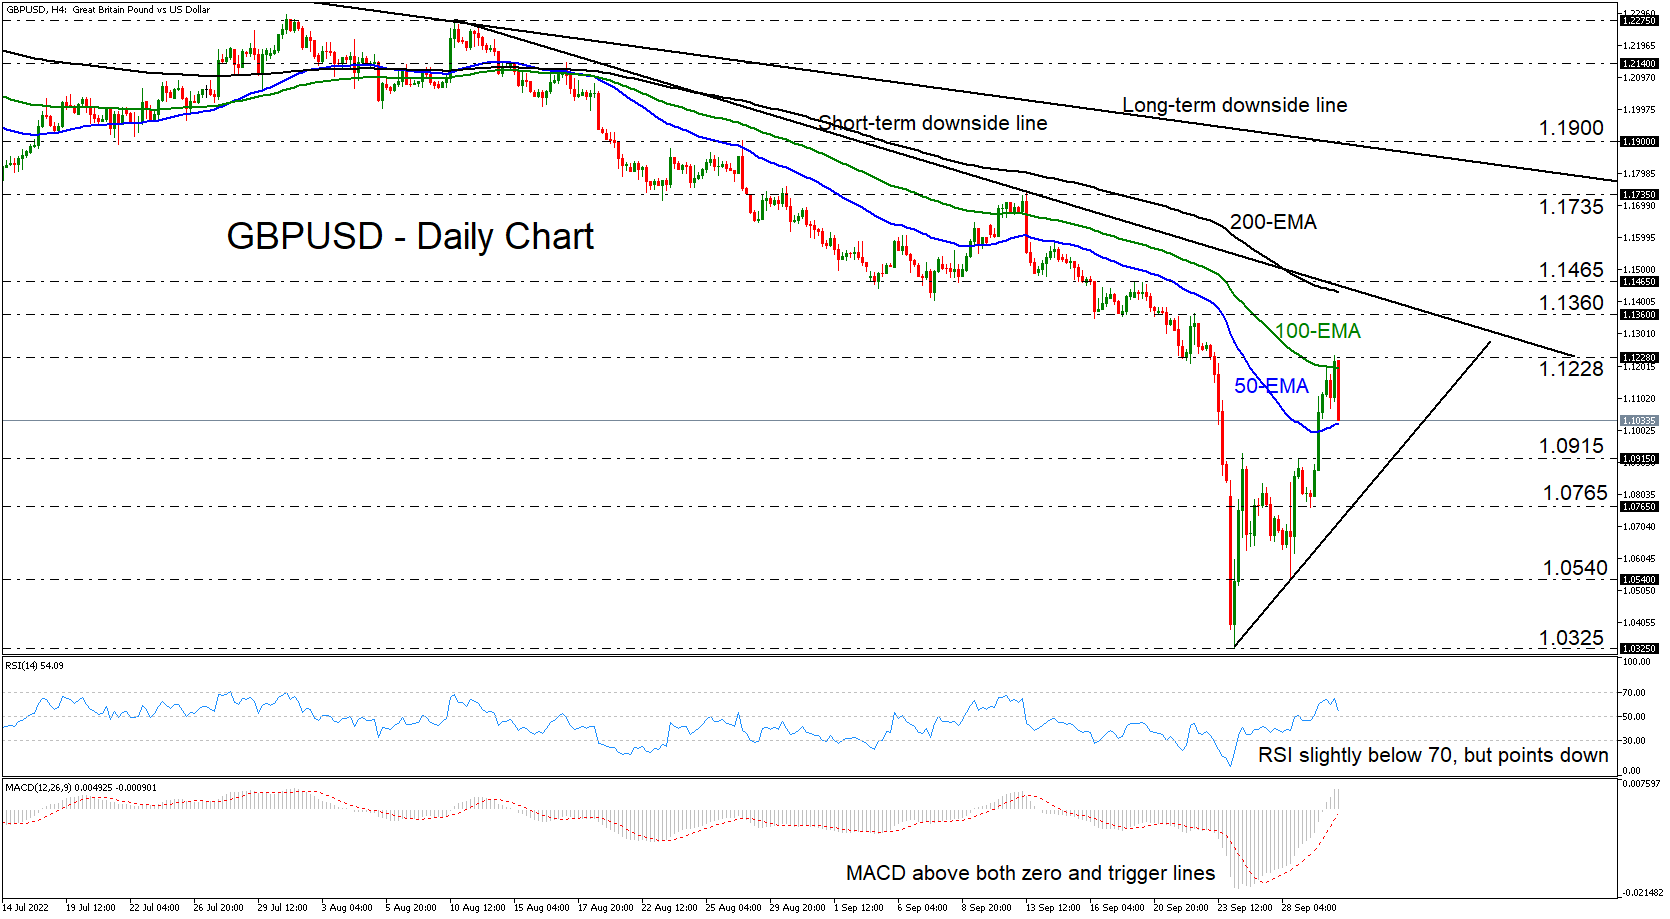
GBPUSD climbed higher on Thursday but met resistance today at 1.1228, still below the short-term downtrend line drawn from the high of August 10 as well as below the longer-term downside line taken from the high of March 23. This keeps the prevailing downtrend intact but given that the pair has been forming higher lows on the 4-hour chart this week, a break below 1.0765 may be needed to signal that the bears are back in full control.
The RSI lies near its 70 line but it has shifted down lately, while the MACD remains above both its zero and trigger lines, still pointing up. The mixed indications provided by the oscillators enhance the view that traders may need to wait for clearer signals before they become confident on a downtrend continuation.
A dip below 1.0765 could confirm the break below the line connecting the higher lows formed this week and may encourage the bears to dive towards Wednesday’s low of 1.0540. If they don’t exit the action from around there, a break lower could carry the losses towards Monday’s low of 1.0325.
On the upside, a break above 1.1465 could confirm the break above the 200-period exponential moving average (EMA) as well as the breach of the downtrend line drawn from the high of August 10. That said, this may only signal a larger upside correction, perhaps towards the high of September 13 at 1.1735 or the longer-term downside line taken from back in March. A trend reversal might be put on the table upon a decisive break above the 1.1900 area, marked by the high of August 26.
In brief, GBPUSD extended its latest recovery but remained below two important downside lines, something that keeps the prevailing downtrend intact. Nonetheless, the fact that the pair has been printing higher lows this week, likely paints a neutral picture in the short run.
Bitcoin Seems to be Regaining Defensive Status
Market picture
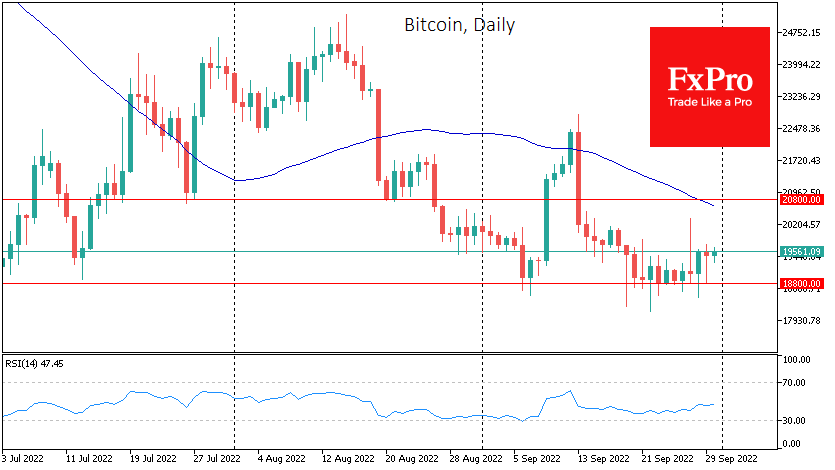
Bitcoin has remained in position for the past few days, trading at $19,500 on Friday morning. As in previous days, the attempt to sell the cryptocurrency following the stock market was met with buying.
This neat bottom-drawing by Bitcoin could show a wait-and-see stance and consolidation before the next move. However, crypto optimists are now siding with the positive momentum in gold and sector stocks. Investors have probably recalled them as a store of value amid the volatility in the currency market.
Among the closest key levels, the $20.8K where the 50-day moving average is located is worth mentioning. It has been active as resistance for more than a month. Local support is near $18.8K. A move outside this range could signal the end of the current consolidation.
News background
Billionaire Stanley Druckenmiller expects the US economy to deteriorate significantly by the end of next year. That’s when cryptocurrencies could make a resurgence.
Alexander Hoptner, CEO of cryptocurrency exchange BitMEX, said he does not see any decline in institutional investor interest in the crypto industry, despite the bearish trend.
Lastly, BlackRock has launched on Euronext, an exchange-traded fund (ETF) focusing on blockchain and cryptocurrency companies.
Japanese Yen Shrugs after Solid Data
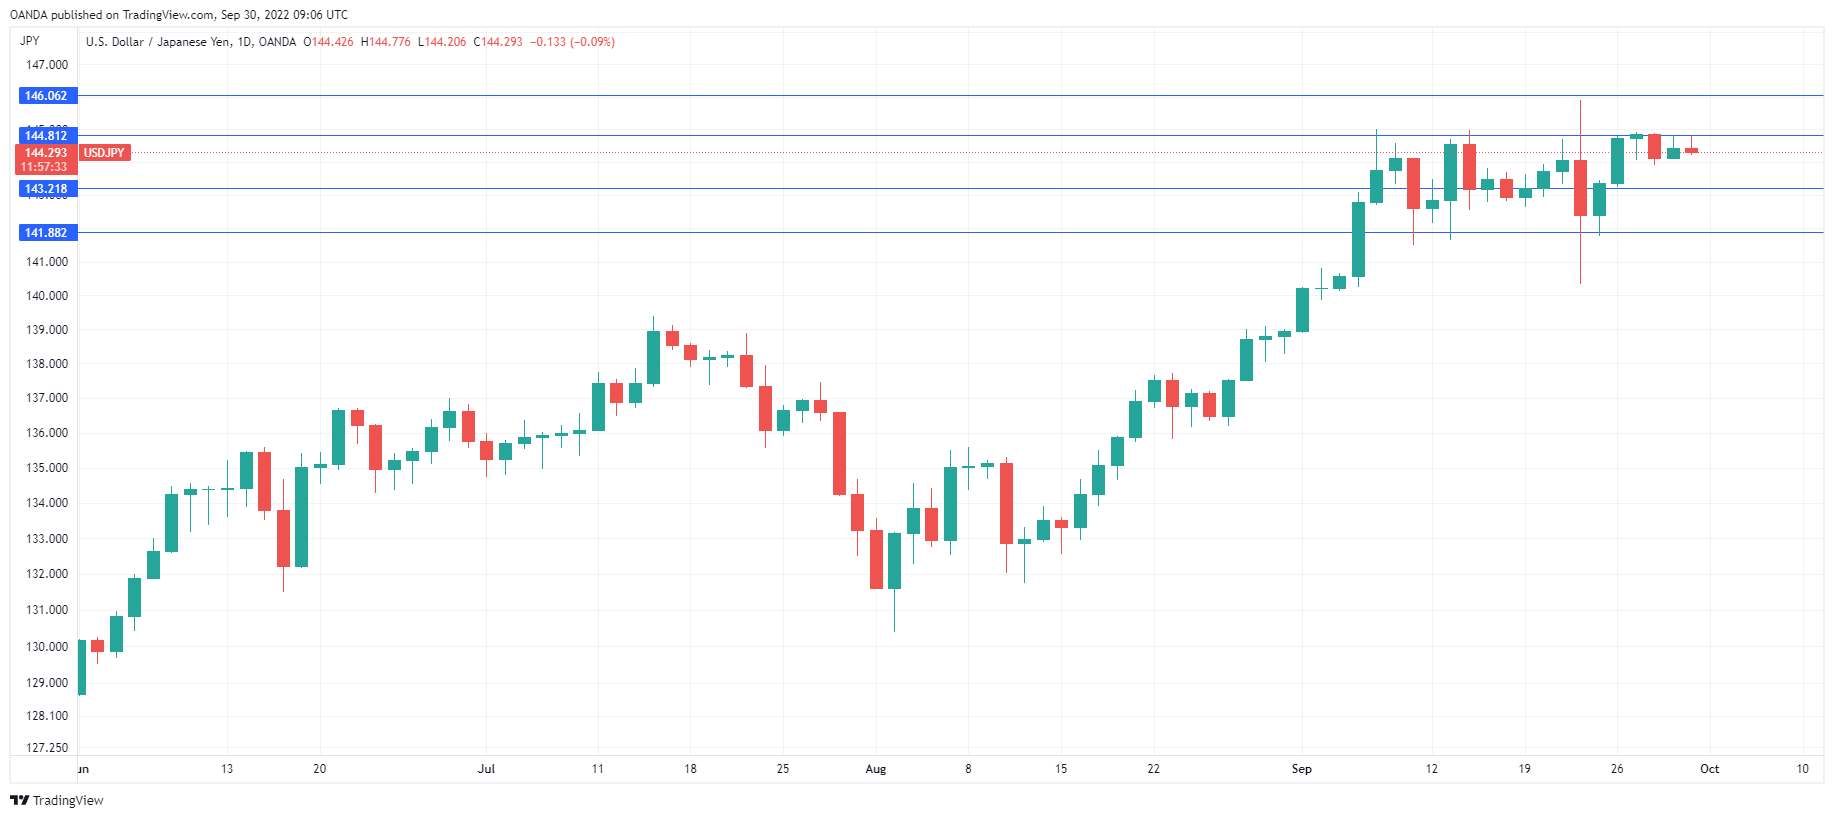
The yen has been drifting for most of the week and the trend is continuing today. USD/JPY is almost unchanged at 144.32.
Japanese data surprises on the upside
Japan has released strong industrial production and retail sales data, a further indication that the Japanese economy is improving. Industrial production rose for a third straight month in August, climbing 2.7% MoM. This was up from 0.8% in July and crushing the consensus of 0.2%. Retail sales for August jumped 4.1% YoY, above the consensus of 2.8% and higher than the 2.4% gain in July. Retail sales have posted 10 gains in the past 11 months, indicative of solid consumer spending, despite Japan’s weak economy and households grappling with relatively high inflation.
It was a wild week for most of the majors, but the Japanese yen has settled down after USD/JPY pushed close to the 145 line on Monday. Japan’s stunning currency intervention has kept the yen below the 145 line, but it’s difficult to imagine that unilateral action will succeed in stemming the yen’s prolonged descent, for two reasons.
First, the Federal Reserve is likely to deliver large rate increases in October and November. With the Bank of Japan showing no indication that it will ease up on yield curve control, the US/Japan rate differential will widen and send the yen lower. Second, the yen is caught in a tug-of-war between the MoF, which wants to see a stronger yen, and the BoJ, which is focused on maintaining an ultra-accommodative policy, which has kept JGB yields at low levels and weighed on the yen. If the yen does fall below 145, things will get very interesting, as the ball will be squarely in the court of the MoF, which will have to decide whether to balk or step in with another intervention.
USD/JPY Technical
- There is resistance at 144.81 and 146.06
- USD/JPY has support at 143.21 and 141.88
EUR/USD Pair Consolidating Gains Near $0.9820
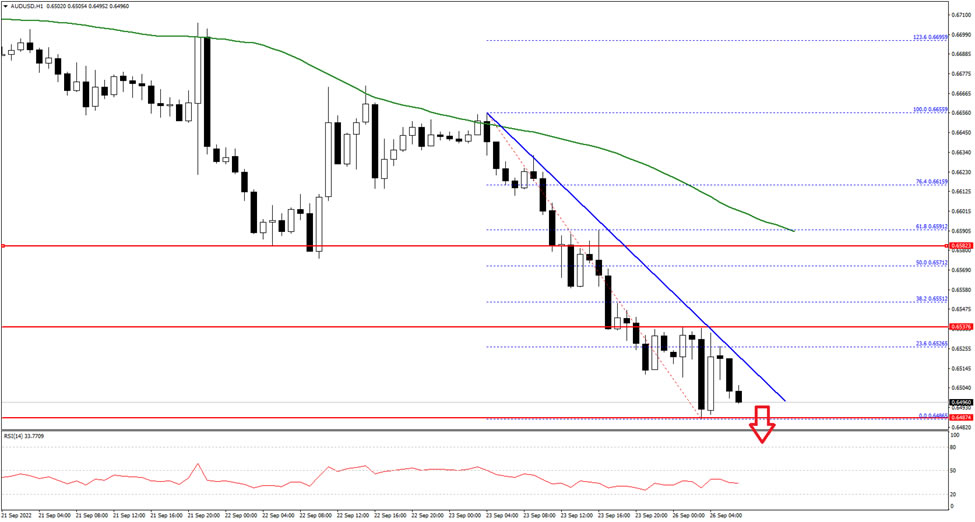
The Euro started a recovery wave from the 0.9550 zone against the US Dollar. The EUR/USD pair wave able to rise above the 0.9580 and 0.9600 resistance levels.
There was close above the 0.9700 level and the 50 hourly simple moving average. The pair is now consolidating gains near the 0.9820 zone. An immediate resistance on the upside is near 0.9815 and a connecting bearish trend line on the hourly chart. The first major resistance is near the 0.9840 level.
A break above the 0.9840 resistance level could start a decent upward move. In the stated case, it could even surpass 0.9900 on FXOpen.
Conversely, the pair might start another decline below 0.9780. The next key support is near 0.9760, below the pair could decline towards the 0.9720 level. Any more losses might send the pair towards the 0.9680 level.
Eurozone CPI rose to 10% yoy in Sep, energy up 40.8% yoy, food up 11.8% yoy
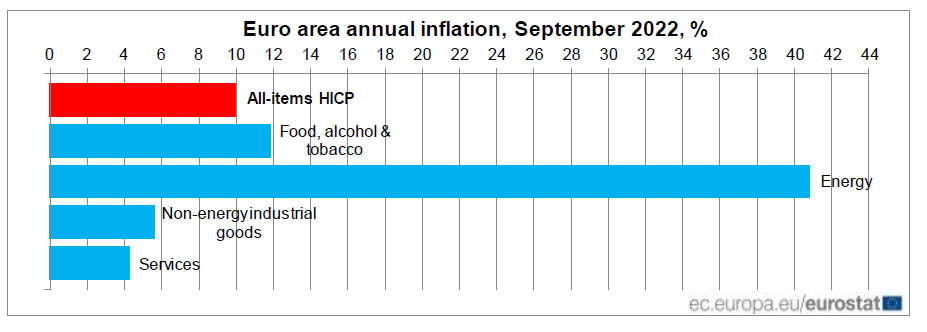
Eurozone CPI accelerated further from 9.1% yoy to 10.0% yoy in September, above expectation of 9.1% yoy. CPI core (ex-energy, food, alcohol & tobacco) also rose from 4.3% yoy to 4.8% yoy, above expectation of 4.7% yoy.
Looking at the main components , energy is expected to have the highest annual rate in September (40.8%, compared with 38.6% in August), followed by food, alcohol & tobacco (11.8%, compared with 10.6% in August), non-energy industrial goods (5.6%, compared with 5.1% in August) and services (4.3%, compared with 3.8% in August).
GBPJPY Rebounds Swiftly from its Sharp Drop as Bias Turns Bullish
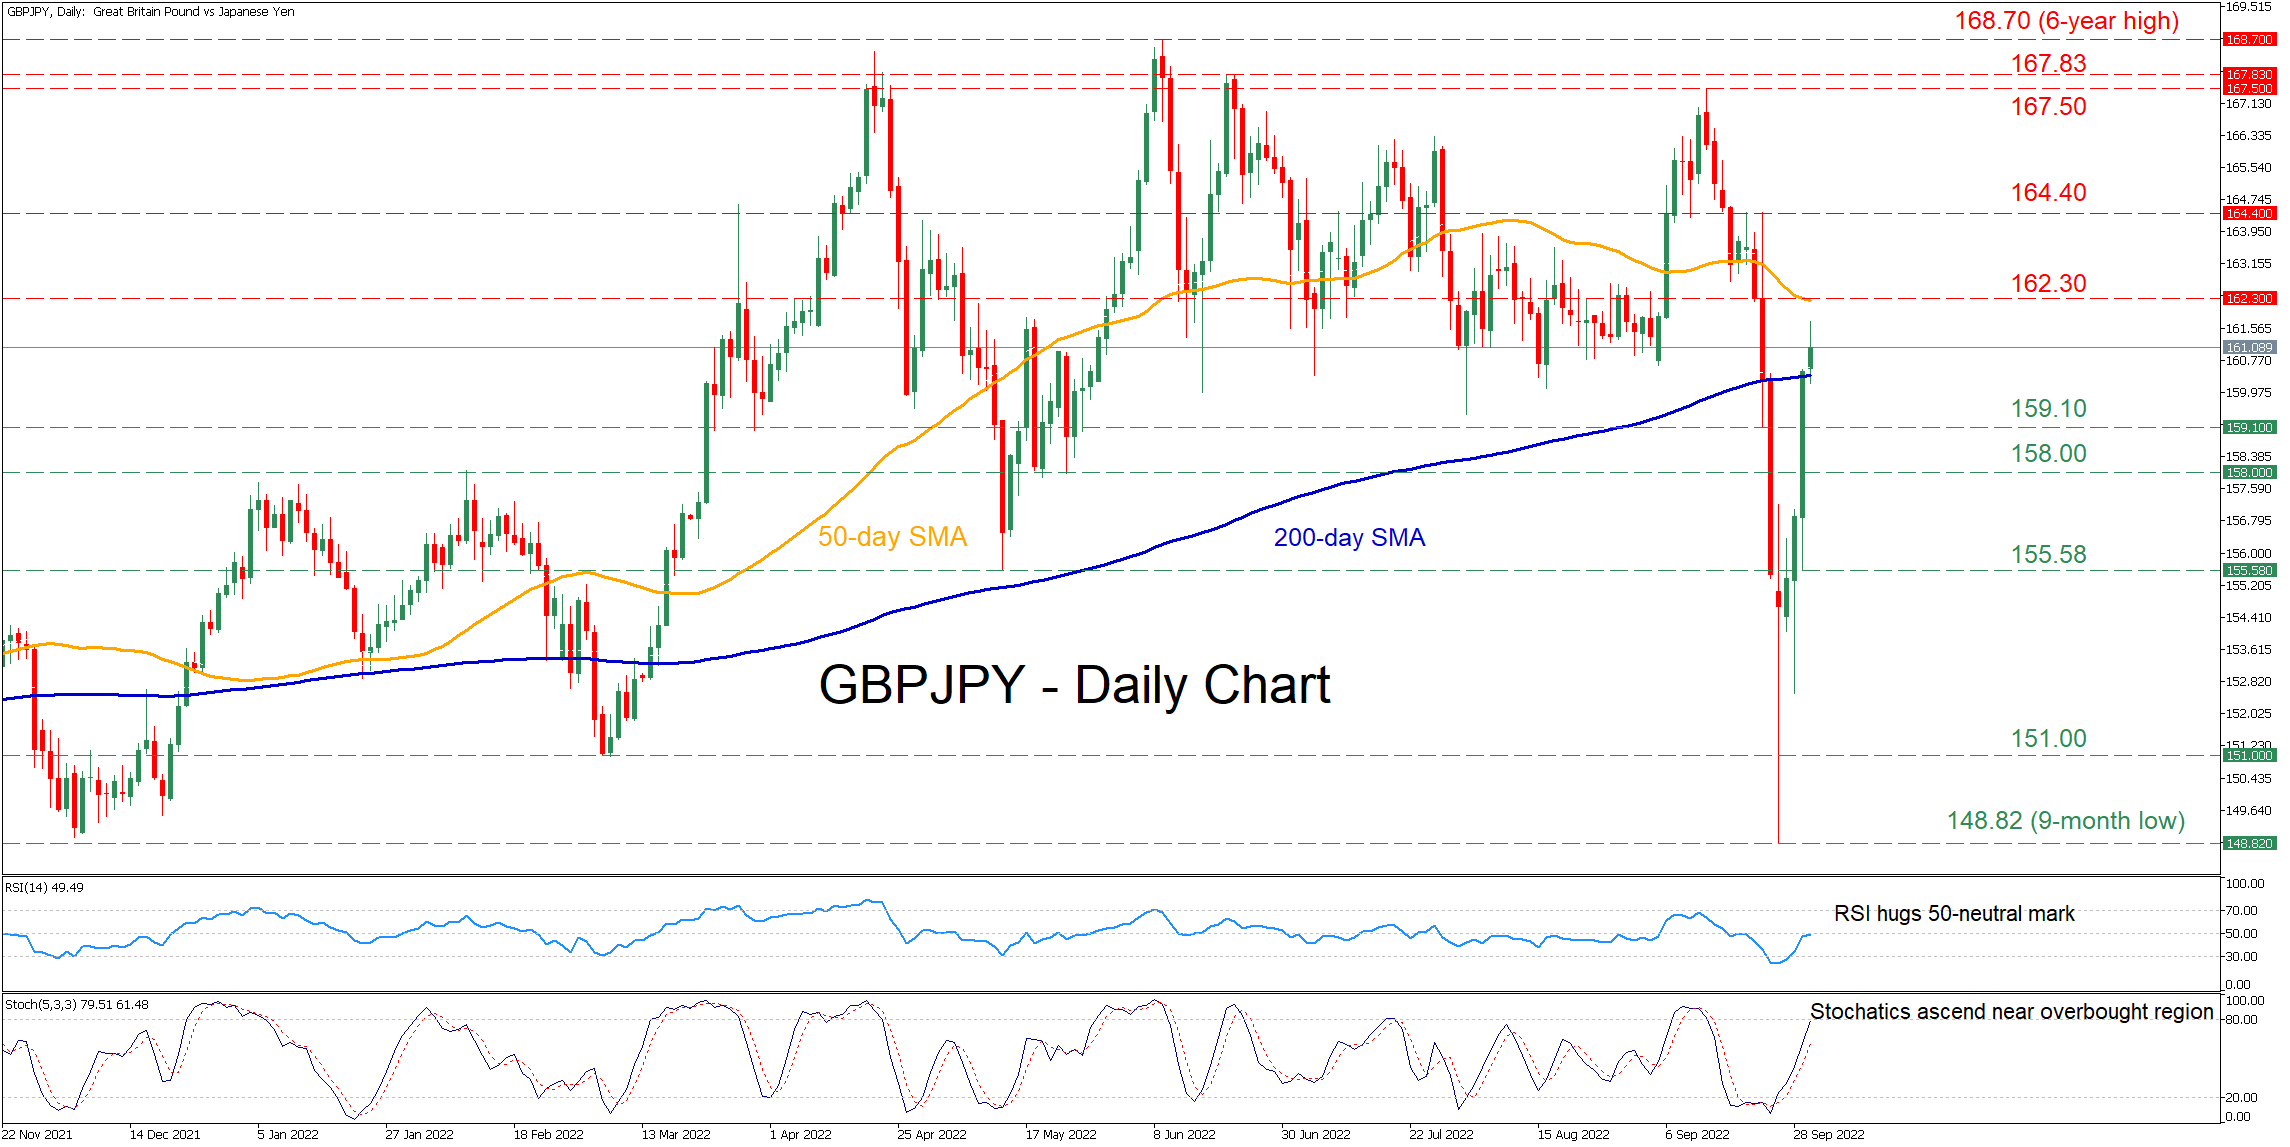
GBPJPY has experienced some large moves in the short term, with the price losing around 10% before it recovers back above the 160.00 mark. Moreover, the technical picture is currently endorsing the resumption of the rebound as the pair has forcefully crossed above the ascending 200-day simple moving average (SMA).
The momentum indicators suggest that near-term risks are tilted to the upside. Specifically, the stochastic oscillator is ascending near the 80-overbought region, while the RSI has rebounded from the oversold zone, currently touching the 50-neutral threshold.
If buying pressures persist, the pair could initially challenge the 50-day SMA, currently at 162.30. Surpassing this zone, the bulls might aim for the recent resistance region of 164.40 before the September peak of 167.50 appears on the radar. A break above the latter may bring the June high of 167.83 under examination.
To the downside, should the price decline below its 200-day SMA, the recent low of 159.10 could act as the first line of defense. Sliding beneath that floor, the pair might descend towards 158.00, which has acted both as support and resistance during 2022. Failing to halt there, the May low of 155.58 could then provide significant downside protection.
Overall, GBPJPY has been exhibiting huge volatility in the short term, with the pair managing to erase a huge chunk of its steep decline within four daily sessions. For the recovery to continue, the pair must decisively cross above its 50-day SMA.
Pound Takes a Breather after Wild Ride
British pound calm after tumultous week
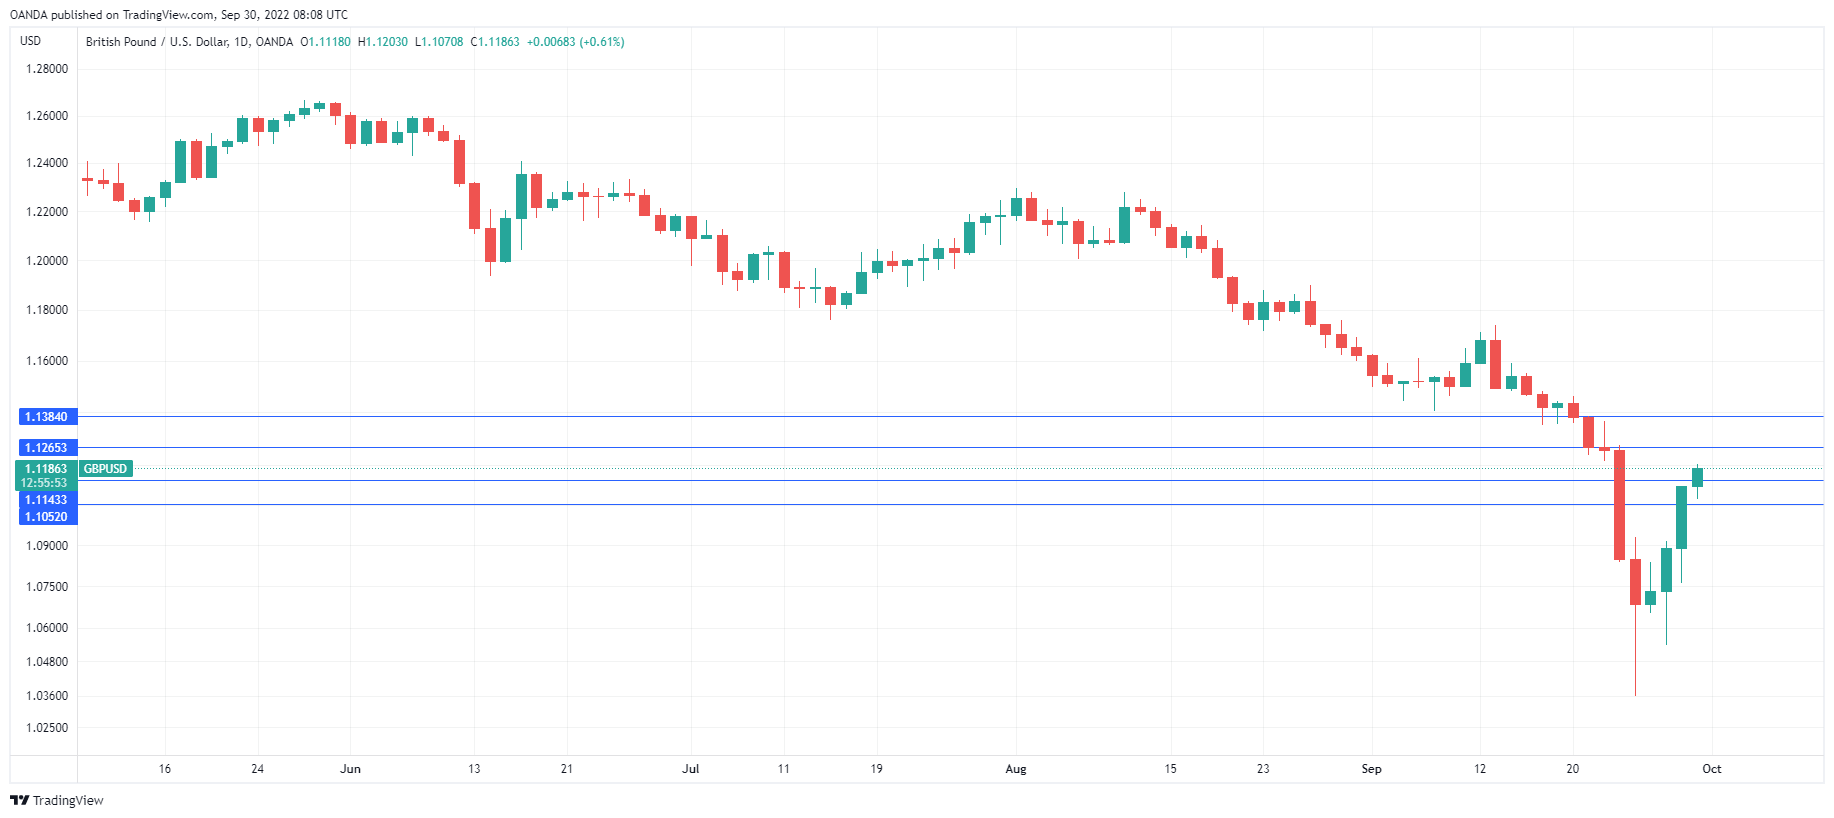
The British pound has posted slight gains, after a spectacular showing on Thursday. In the European session, GBP/USD is trading at 1.1145, up 0.26%.
For anyone looking for lots of volatility, look no further. The pound has taken riders on a wild ride, with GBP/USD surging 2.1% on Thursday. On Monday, the pound traded in a stunning 500-point range, which saw GBP/USD touch a record low of 1.0359. Since then, the pound has padded on 800 points, in what has been a truly remarkable week.
The driver behind the pound’s volatility was Chancellor Kwarteng’s mini-budget, which included tax cuts and increased borrowing. The package was roundly criticized, with even the IMF and US officials panning the plan. This led to a near-crash in the UK bond market, forcing the Bank of England to take emergency measures and pledge unlimited purchases of securities. The bailout will continue for over two weeks and could cost up to 60 billion pounds. The BoE’s intervention has reassured investors and stabilized the bond market. The pound continued to swing wildly, but it has recovered almost all of the losses triggered by the mini-budget.
What happens now? The government clearly was not expecting a financial tsunami after a mini-budget, which are usually tame affairs that don’t affect the financial markets. Prime Minister Truss is under pressure to shelve or at least make changes to the mini-budget, but so far Truss is holding firm and insisting that she will stick with the plan. If she does, we can expect inflation, which is running at a 9.9% clip, to climb even higher.
GBP/USD Technical
- GBP/USD has support at 1.1144 and 1.1052
- There is resistance at 1.1265 and 1.1384
USDCAD Curbs Exponential Growth; Support at 1.3600
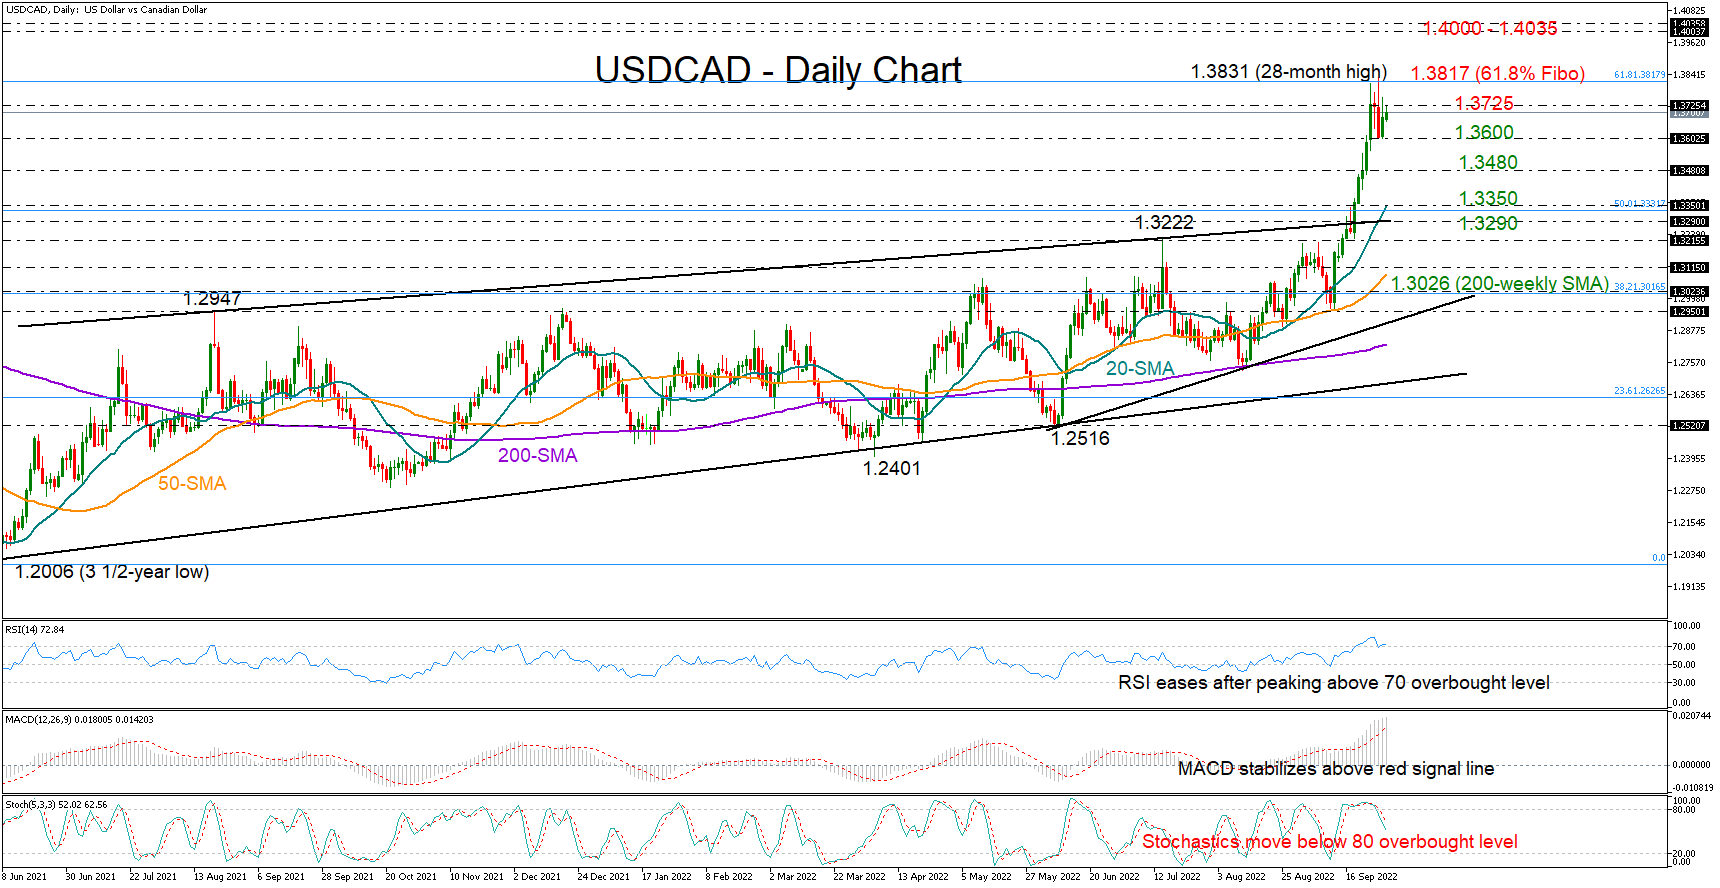
USDCAD switched to consolidation after its exponential advance above a bullish channel topped at 1.3831. Of note, the area coincides with the 61.8% Fibonacci retracement of the March 2020 – June 2021 downtrend.
Encouragingly, the 1.3600 region helped the market to retain some weekly gains, but with the RSI and the stochastics hovering in overbought waters, it’s questionable how far the rally could still go. Nevertheless, with the indicators remaining elevated within the bullish territory, there might be some room for further improvement before the next bearish wave starts.
Should the pair propel buying interest above the key resistance area of 1.3725–1.3831, the rally could pick up steam towards the 1.4000–1.4035 region taken from March-May 2020. Breaching that wall too, the next barricade could pop up around 1.4140.
Alternatively, a downside reversal may retest the support of 1.3600. If that proves easy to break this time, the sell-off may continue towards the 1.3500 round level. Moving lower, the 20-day simple moving average (SMA) at 1.3347 will attempt to keep the broad outlook positive above the channel.
In brief, USDCAD is preserving a bullish outlook in the short- and long-term picture, though with the price trading within overbought territory, fears that the uptrend has peaked may keep weighing on market sentiment.
US Oil: Price Adjustment Completed, Expect Formation of a Minor Zigzag
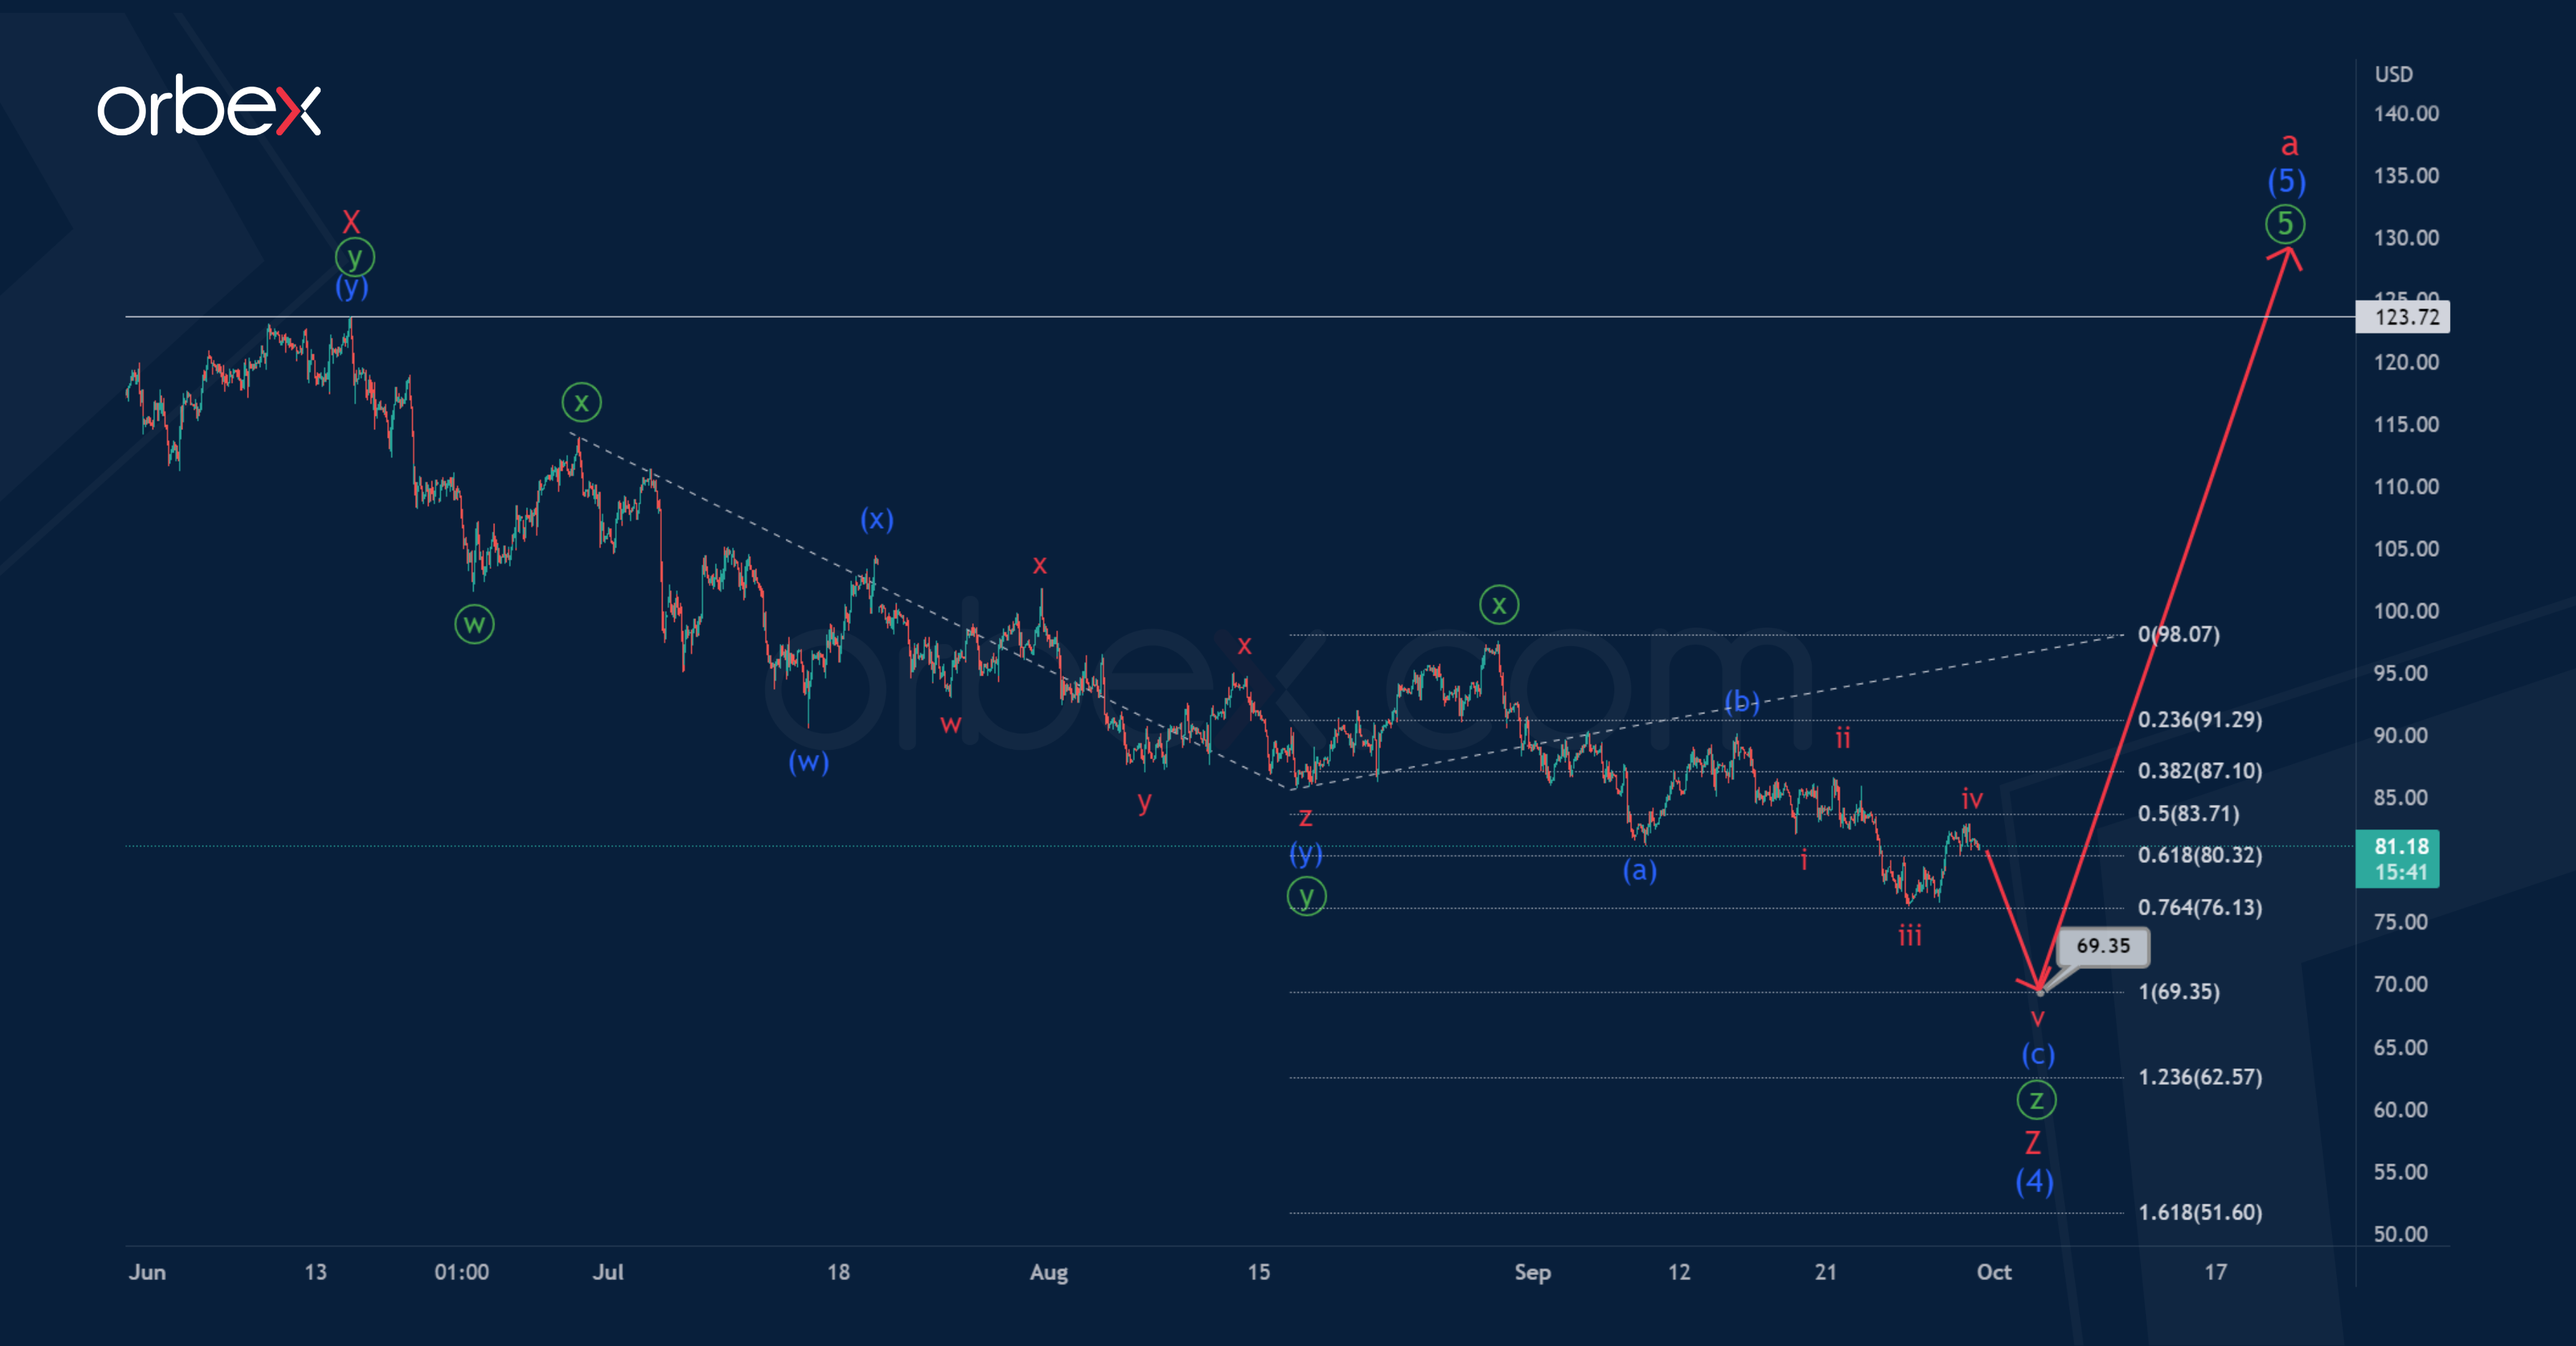
USOIL on the 1H time-frame shows the marking of the final primary wave ⑤, which takes the form of an intermediate ending diagonal. We see the second half.
An intermediate correction (4) in the form of a minor double zigzag may have been completed recently.
Thus, now we see that the price could start to rise in the intermediate wave (5). It is assumed that the intermediate wave (5) will take the form of a standard 3-wave zigzag A-B-C
The end of the specified construction is possible near 124.78. At that level, wave (5) will be at the 76.4% Fibonacci extension of impulse (3).
Alternatively, the construction of an intermediate correction (4) can be continued. It may have the form of a triple zigzag W-X-Y-X-Z.
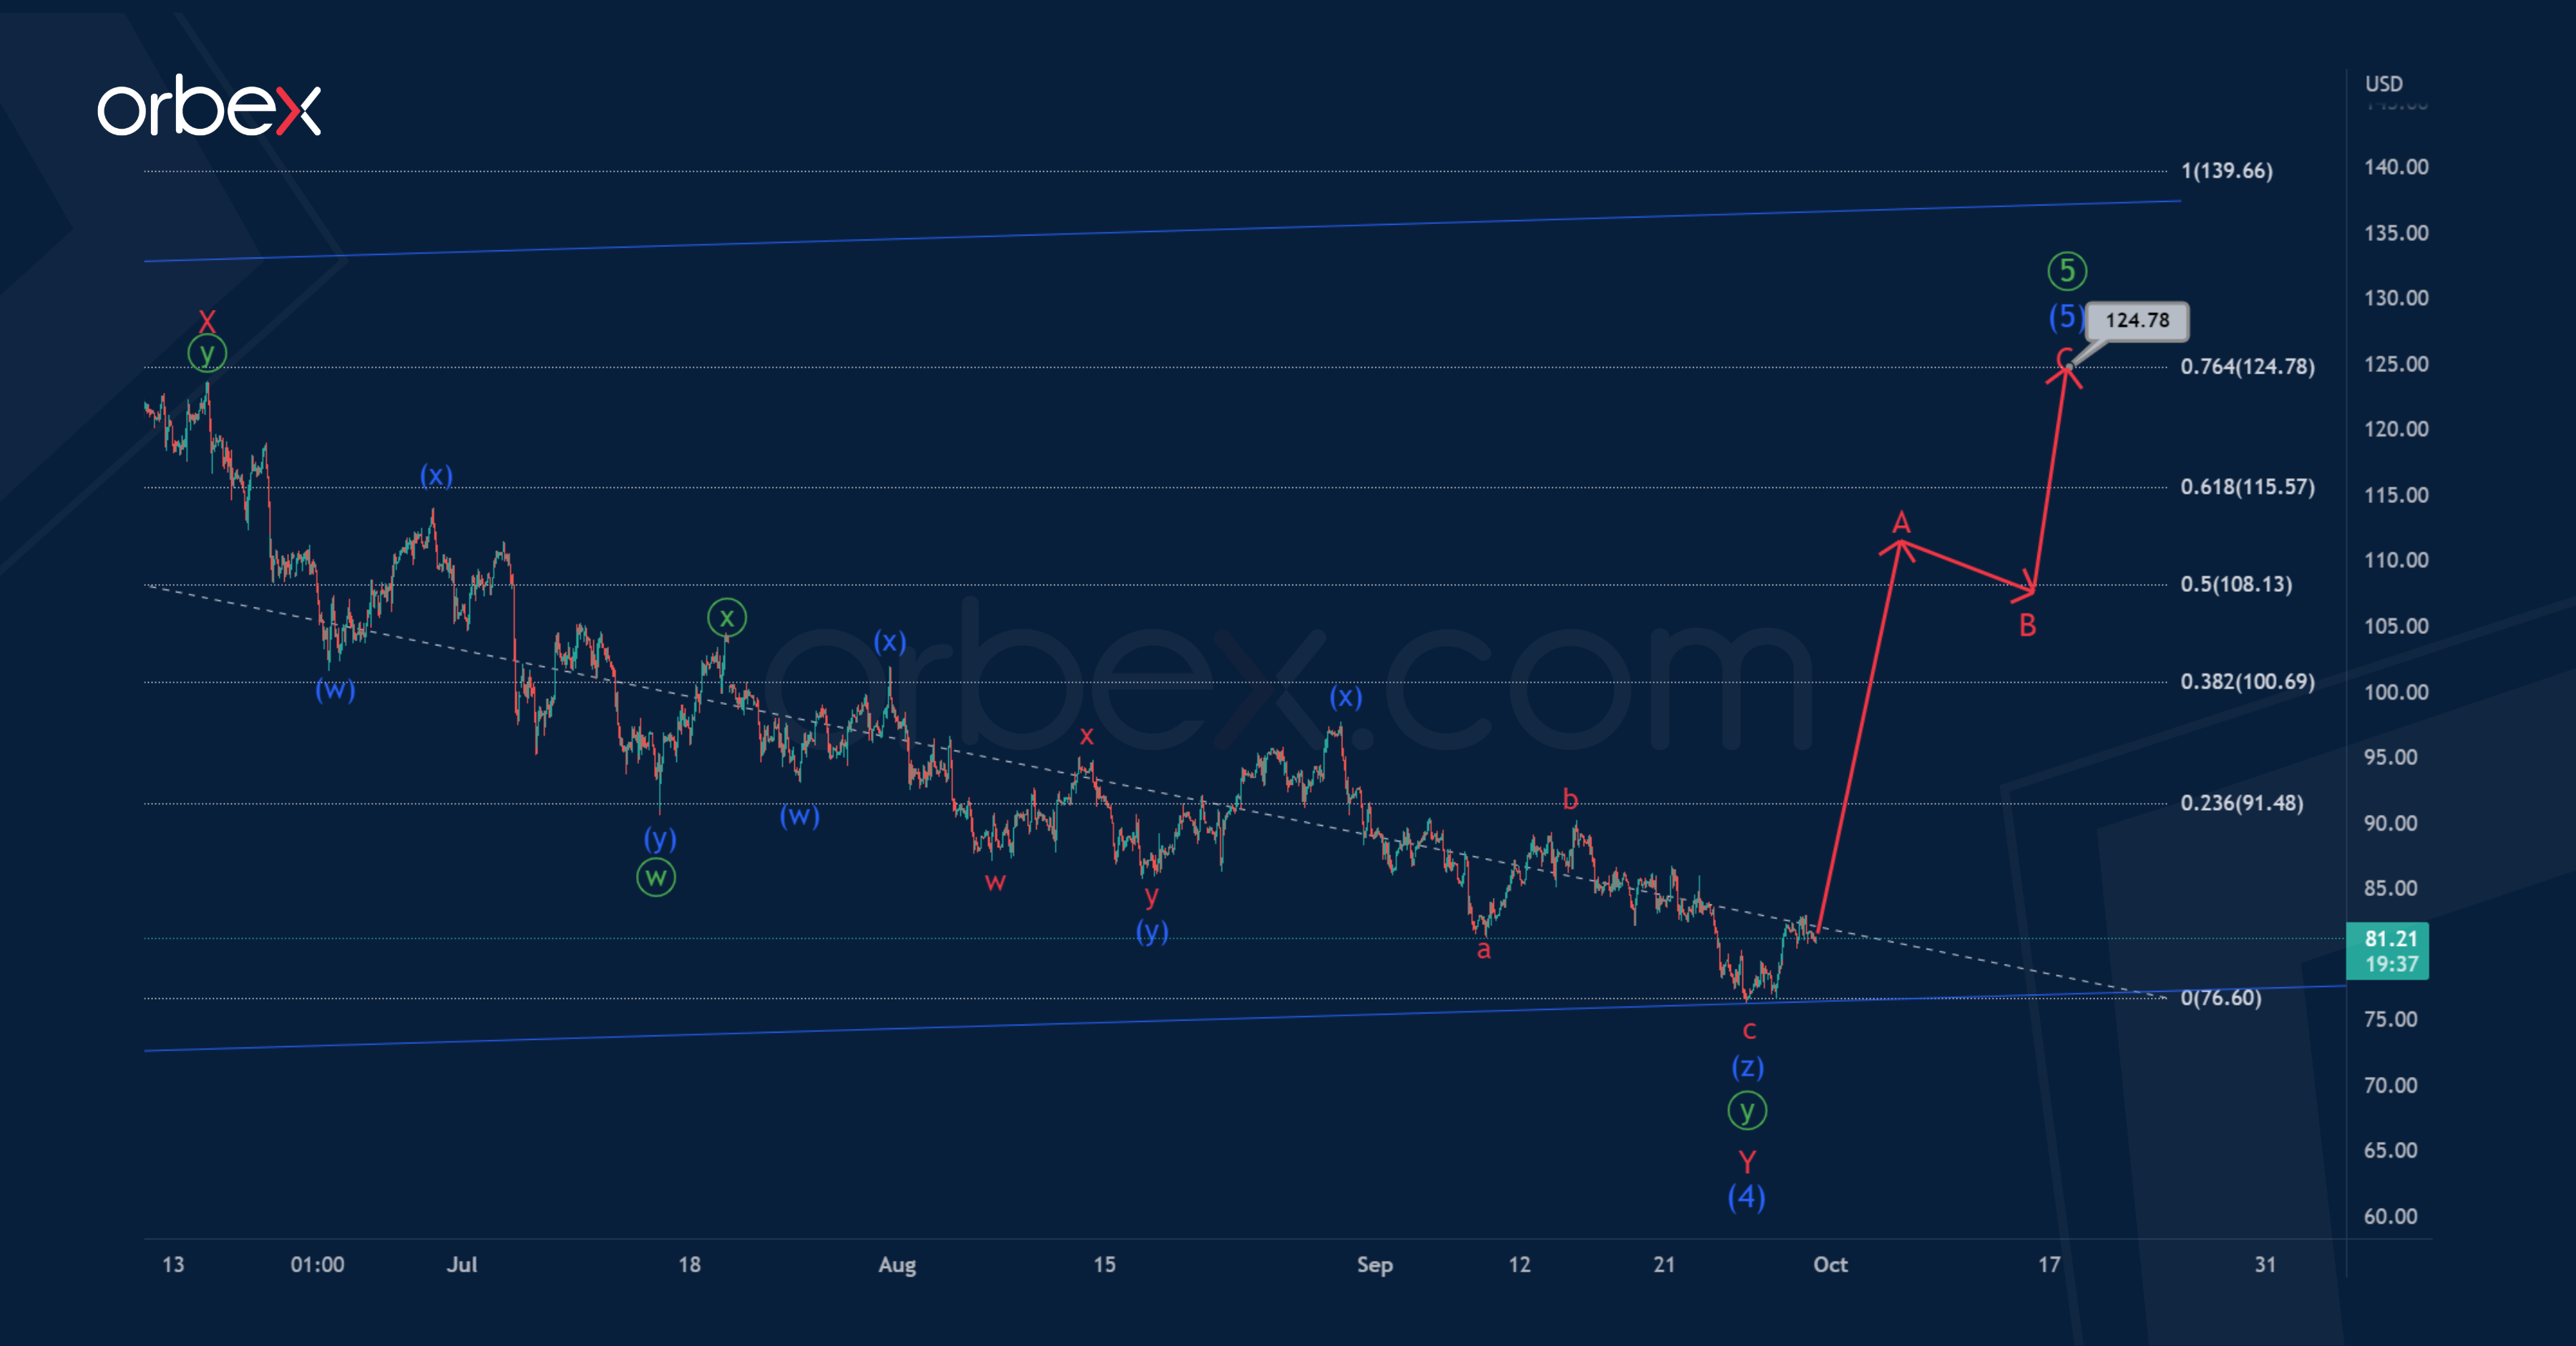
The minor sub-waves W-X-Y-X can be completed. Thus, in the near future, the downward movement is expected to continue in the final actionary sub-wave Z, which can be completed in the form of a minute triple zigzag ⓦ-ⓧ-ⓨ-ⓧ-ⓩ.
The oil price may fall to 69.35. At that level, minute waves ⓨ and ⓩ will be equal.
After reaching this level, the market is expected to grow above the maximum – 123.72.