
Sample Category Title
China’s Greatest Opportunity and Biggest Threat
To achieve its development ambitions, China's industrial might must pay off for households.
The first half of 2026 has highlighted China's industrial strength, the trade surplus widening back to near record highs and investment in high-tech manufacturing and services continuing at pace while authorities' strategic reserves and pro-active decision making offered robust protection against an extended loss of oil supply. Ahead, China's greatest opportunity is also its biggest threat – a recovery in the Chinese consumer.
Before we delve into the detail of the consumer outlook, it is important to dig deeper into recent industrial developments and their implications. Having narrowed sharply in March to USD51bn, China's monthly trade surplus snapped back to USD85bn in April and USD105bn in May. The average for the year-to-date is now USD91bn, just inside 2025's USD99bn and roughly triple 2019's USD35bn. May's 19% annual export growth is arguably outsized, but high single-digit gains are possible, if not probable, on a recurring basis. Note that it isn't just export demand that is buoying the surplus. Chinese production is also increasingly outcompeting imports when it comes to domestic demand, motor vehicles being a prime example. This is also contributing to the widening trade surplus year-on-year.
Total fixed asset investment has disappointed of late, year-to-date growth contracting 4.1% in May. While a loss of momentum in utilities and transport and mixed results within manufacturing allowed the headline contraction to occur, it was education, health and property that drove the decline. With respect to trade income generation, it is important to recognise that investment has only plateaued after years of rapid growth. Each year that new investment holds at this level, a wave of additional capacity and efficiency is unleashed. Strengthening relationships with neighbouring nations also hold considerable promise. Indonesia and Vietnam are prime examples, having youthful and driven populations of circa 300mn and 100mn and Governments open to large-scale foreign investment.
The compounding income returns China has received through trade post pandemic should have resulted in a strong and confident household sector with burgeoning wealth. Yet, highlighted by annual nominal retail sales growth of -0.6% y/y and entrenched weakness in property, this is not the case. In part this is due to the hyper-competitive behaviour of Chinese firms which has suppressed profitability – an issue authorities are now seeking to redress through their anti-involution initiatives. But the primary cause of consumer hardship is instead the disconnect that has emerged between aggregate household income and the growth of Chinese industry. If consumers are to find their feet, the benefits of trade must pass through.
We expect this to occur but as a multi-stage, likely multi-year, structural process beginning with pro-active stimulus later this year. Initial steps are likely to focus on additional support for the housing sector and renewed subsidies for discretionary consumption. These steps are critical not only to incentivise current demand but also to promote employment in related sectors. Hiring by high-tech manufacturing and service firms is, in contrast, unlikely to accelerate given these sectors' long-standing preferences for capital over labour as well as the efficiency benefits of automation and AI. To receive direct benefits from China's industrial development, the average household will arguably need to wait until the equity valuations of these titans of industry reflect their future promise. Households will also need to have the confidence to put their wealth 'at risk'. Authorities could accelerate the development of this linkage via incentives to directly invest in financial securities and/or by building trust in wealth and retirement solutions, but we suspect this will not be an immediate priority.
If authorities take the initiative in coming months and reset the consumer story, GDP growth can be sustained at or above 4.5%, even as the impetus from trade fades. But, if the Government only guards against the downside, growth is likely to slow to 4.0% and become increasingly fragile.
With respect to currency markets, success with the consumer through 2028 should be enough for the Renminbi to sustainably appreciate back to 2022 and 2018's, then short-lived, highs against the US dollar around USD6.30. Breaking through that level is entirely possible, albeit more likely outside our current forecast window once the Renminbi's growing share of global trade and financial flows are more widely accepted. For China's competitiveness and the long-term trajectory of the currency, it is important to emphasise that the nation's economic and financial development are not occurring in a vacuum but rather in concert with the rest of Asia. On a trade-weighted basis, the anticipated currency gains will be limited and most likely offset by continued productivity wins.
The implications for Australia and our dollar are difficult to discern at this juncture. China continues to expand not only its production chain but also its sourcing network across Asia, Africa and Latin America. As such, while commodity prices should remain supportive, Australia is unlikely to receive a material, lasting dividend from increased commodity export volumes. Very clearly though, not only in China but across Asia, a broad range of new opportunities are opening up. If, as a nation, we lean into this economic and financial development, our productivity and income prospects will grow, benefitting the dollar. For now at least, the market is likely to take a wait-and-see approach with respect to our prospects, the Australian dollar lagging the performance of the Renminbi and potentially other nations across Asia who are poised to outperform.
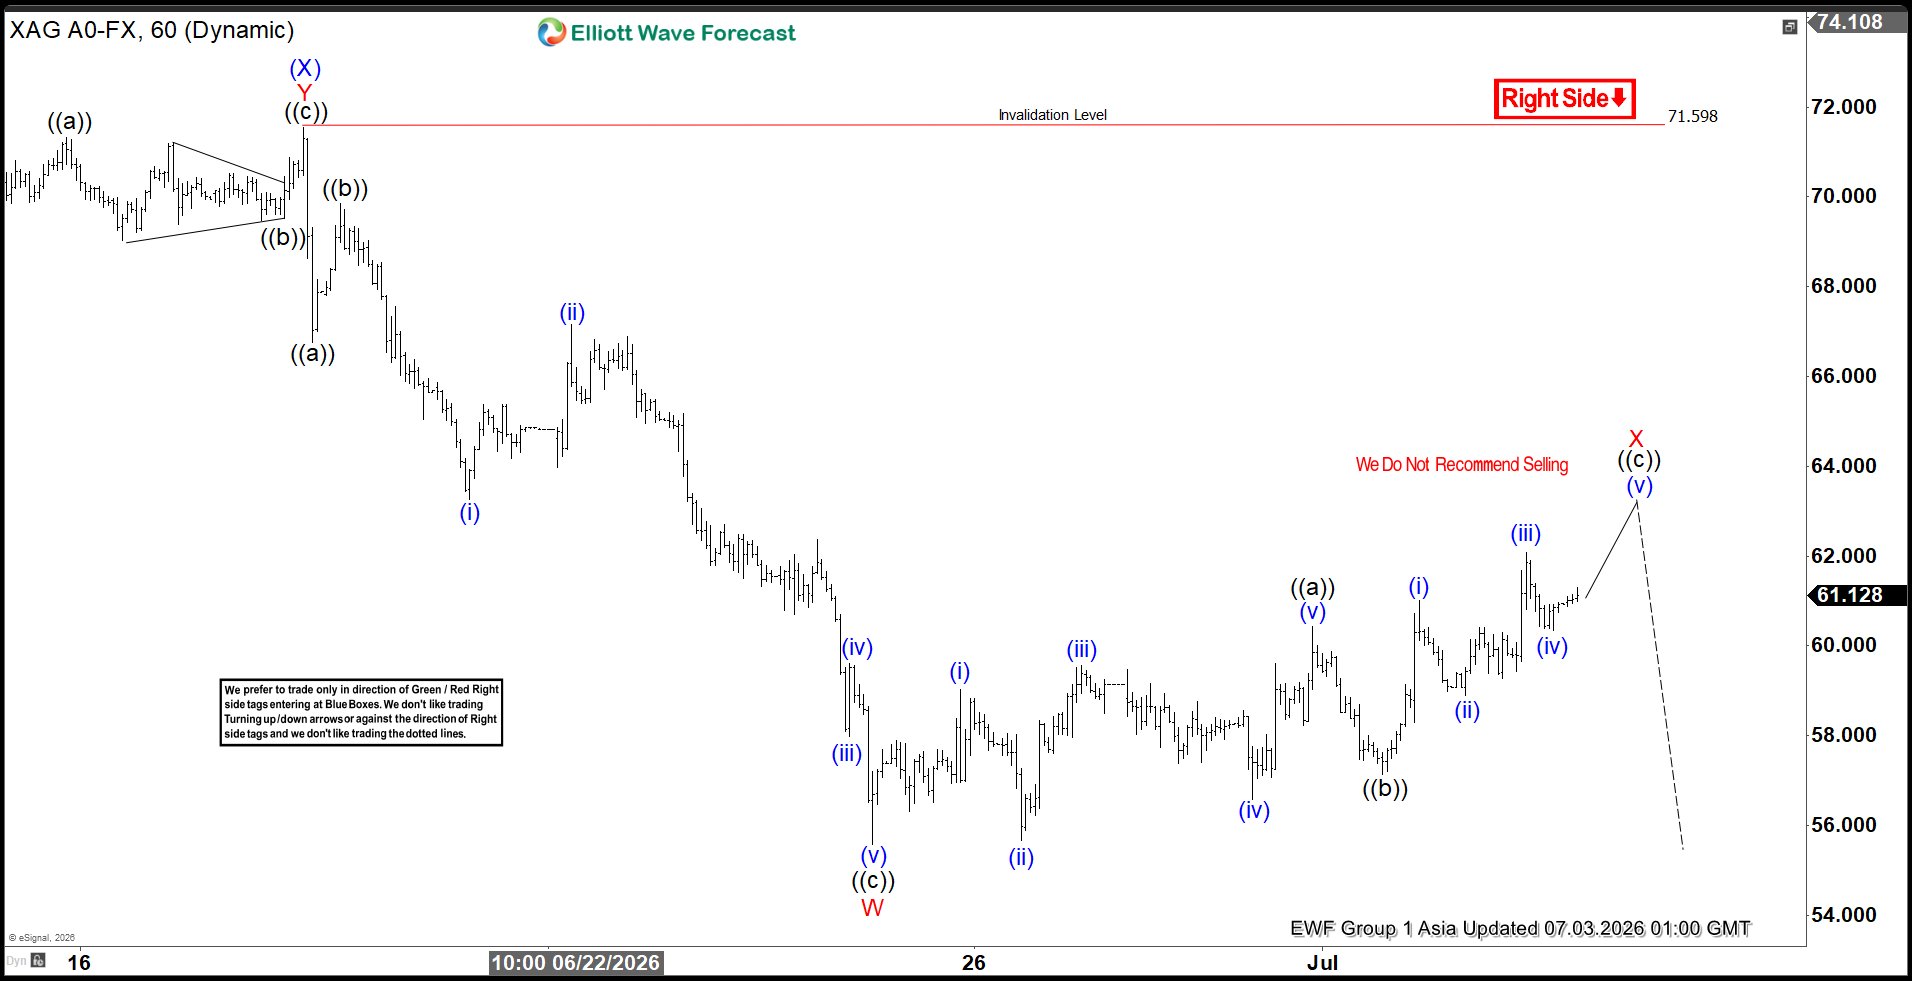
Elliott Wave Perspective: Silver (XAGUSD) Sequence Maintains Downside
Silver (XAGUSD) continues to exhibit an incomplete sequence from the January 29, 2026 high, suggesting that further downside remains possible. In the short term, the cycle from the May 14, 2026 high is unfolding as a double three Elliott Wave structure. From that peak, wave (W) concluded at 61.46, while the corrective rally in wave (X) terminated at 71.6. The market has since resumed lower in wave (Y), which is internally subdividing into another double three of lesser degree. This development underscores the persistence of bearish momentum within the broader corrective framework.
From wave (X), the initial wave W ended at 55.57. The subsequent rally in wave X is now advancing as a corrective move, designed to retrace the cycle from the June 18, 2026 high before the metal resumes its downward trajectory. As long as the pivot at 71.6 remains intact, rallies are expected to fail in either three or seven swings, reinforcing the case for continued weakness.
Resistance is projected within the 62–65 zone, defined by the 100% to 161.8% Fibonacci extension of wave ((a)). This area represents a critical inflection point where corrective strength may exhaust, paving the way for renewed selling pressure. Traders should monitor this region closely, as rejection from resistance would confirm the continuation of the larger bearish cycle.
Silver (XAGUSD) 60-Minute Elliott Wave Chart
XAGUSD Elliott Wave Video:
https://www.youtube.com/watch?v=bELKTwl-EsU
USD/JPY Hits a Speed Bump—Can Support Stop the Slide?
Key Highlights
- USD/JPY started a sharp downside correction from 162.85.
- It traded below a key bullish trend line with support at 161.85 on the 4-hour chart.
- Bitcoin started a recovery wave and climbed above $60,000.
- EUR/USD attempted a fresh increase but might face hurdles near 1.1500.
USD/JPY Technical Analysis
The US Dollar failed to continue higher against the Japanese Yen. USD/JPY peaked at 162.84 on TitanFX and started a sharp pullback.
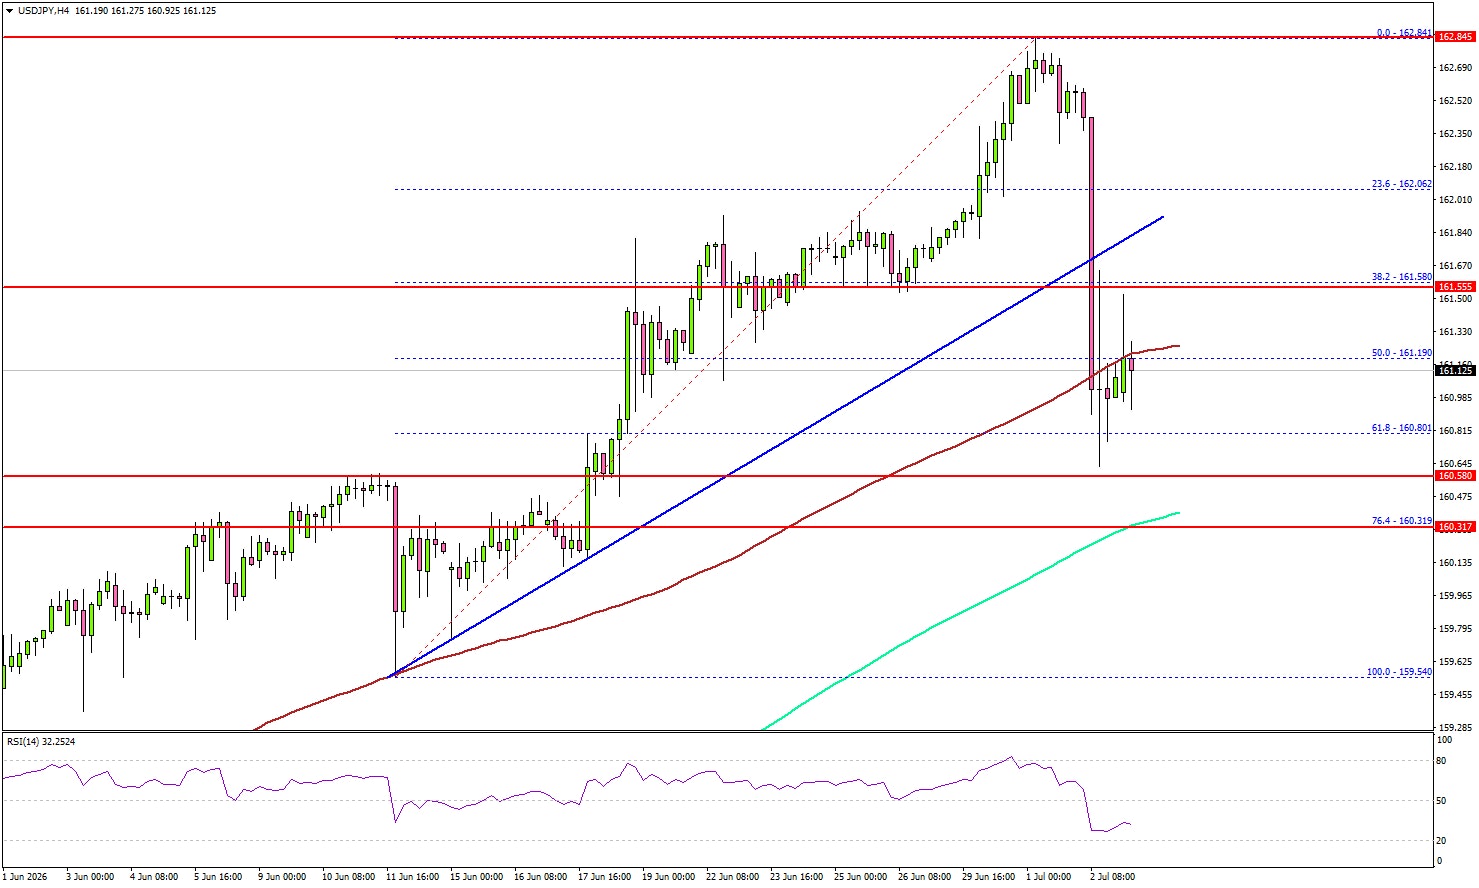
Looking at the 4-hour chart, the pair declined below the 162.00 and 161.20 support levels. There was a clear move below the 50% Fib retracement level of the upward move from the 159.54 swing low to the 162.84 high.
Moreover, it traded below a key bullish trend line with support at 161.85. If there are more losses, the pair could find bids near 160.60. The first major support could be near 160.30, the 200 simple moving average (green, 4-hour), and the 76.4% Fib retracement.
A downside break and close below 160.30 might send the pair toward 158.80. Any more losses could open the doors for a test of 156.50.
On the upside, the bears might remain active near 161.20. The next major resistance might be 162.50. A close above 162.50 could open the doors for a larger increase. In the stated case, the bulls could aim for a move to 163.20.
Looking at EUR/USD, the bulls attempted a recovery wave from 1.1350, but they could struggle near the 1.1500 resistance.
Upcoming Key Economic Events:
- Euro Zone Services PMI for June 2026 – Forecast 48.9, versus 48.9 previous.
- UK Services PMI for June 2026 – Forecast 48.7, versus 48.7 previous.
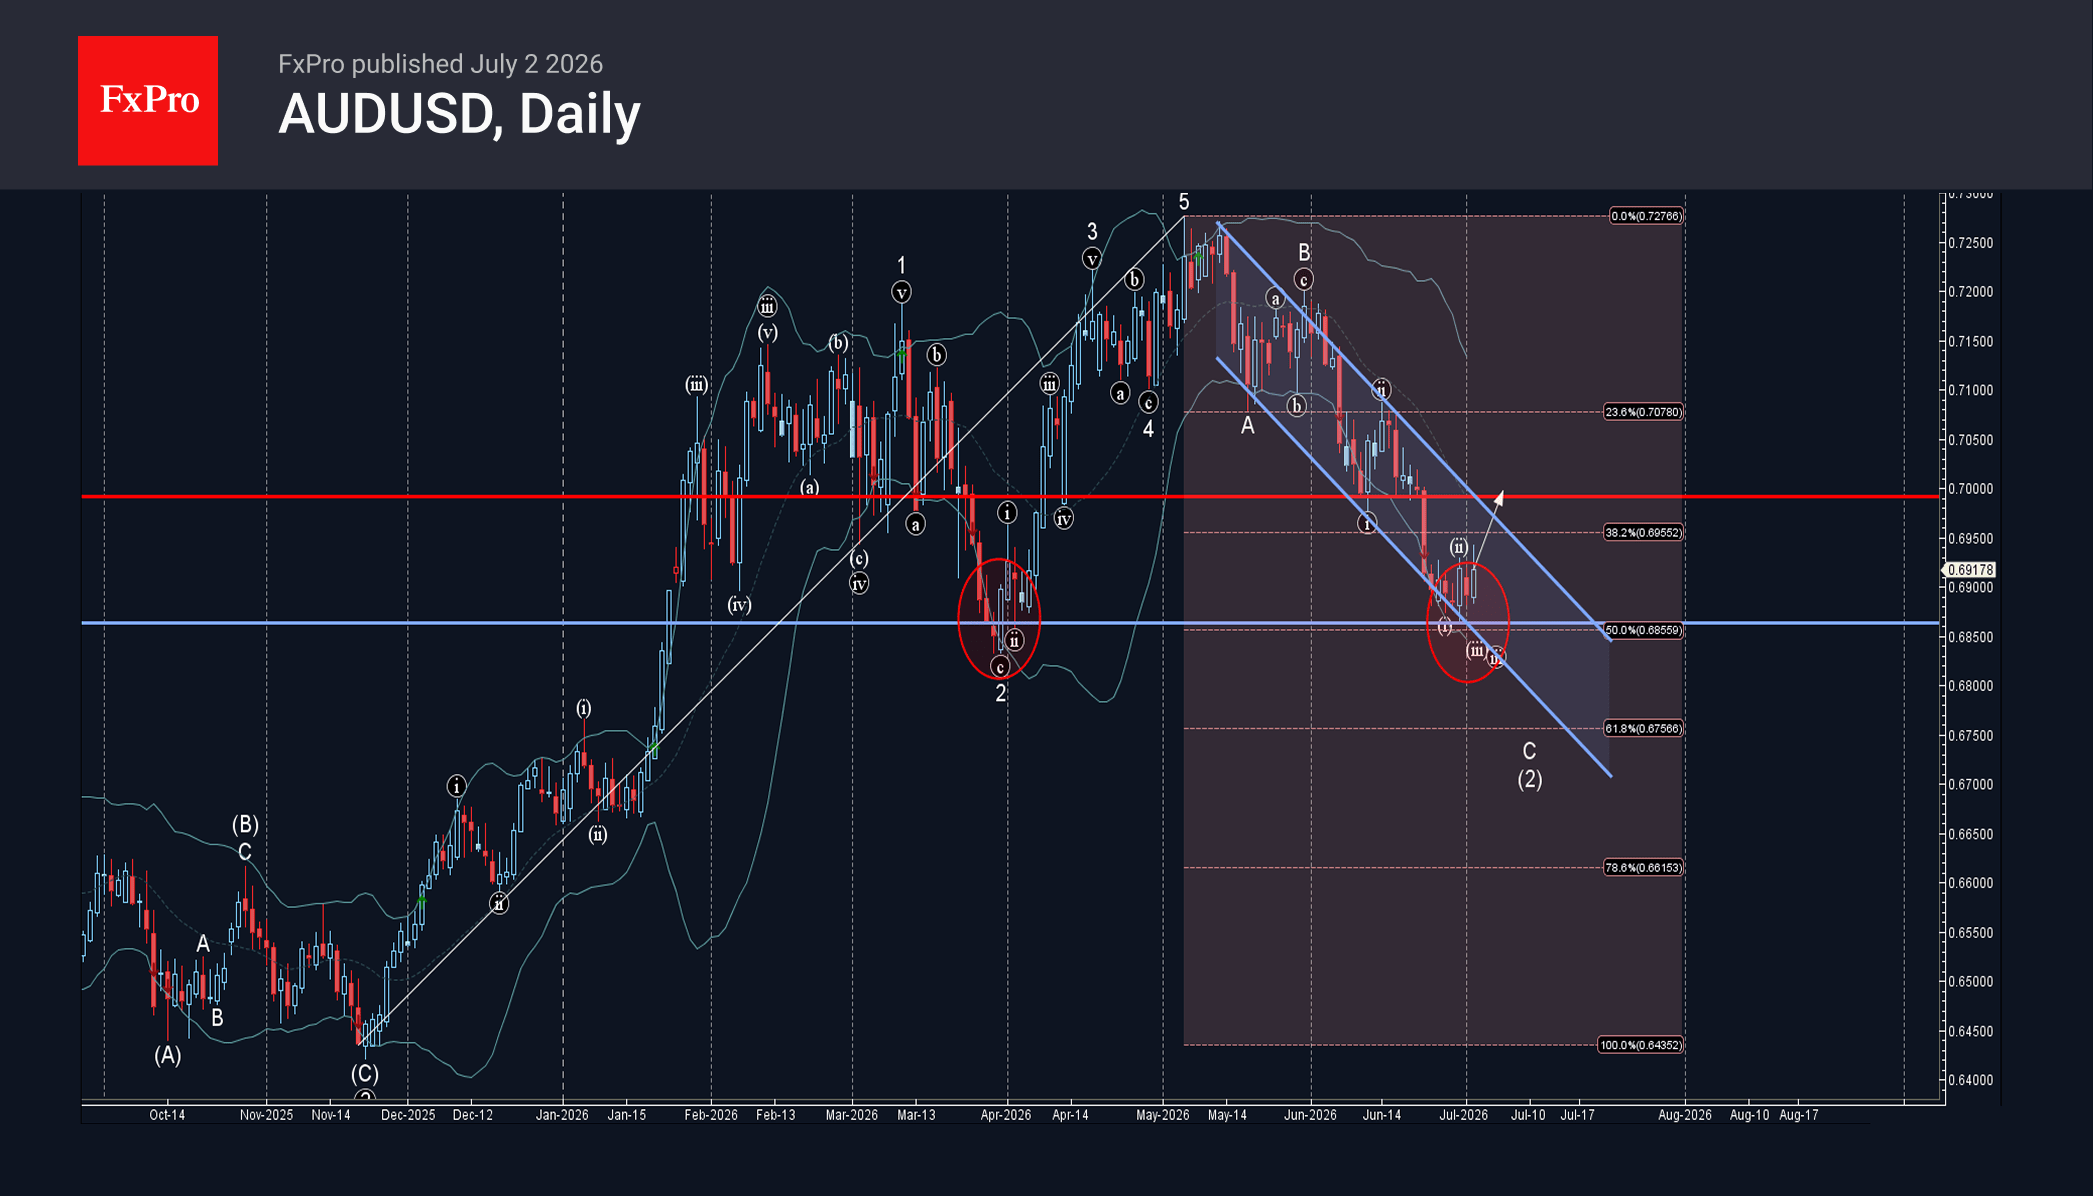
AUDUSD Wave Analysis
AUDUSD: ⬆️ Buy
– AUDUSD reversed from support zone
– Likely to rise to resistance level 0.7000
AUDUSD currency pair recently reversed from the support zone between the support level 0.6865 (which stopped wave 2 in March) and the lower daily Bollinger Band.
This support zone was further strengthened by the support trendline of the daily down channel from May and 50% Fibonacci correction of the upward impulse from November.
Given the strong daily uptrend and strong US dollar sales seen across FX markets today, AUDUSD currency pair can be expected to rise to the next resistance level 0.7000.
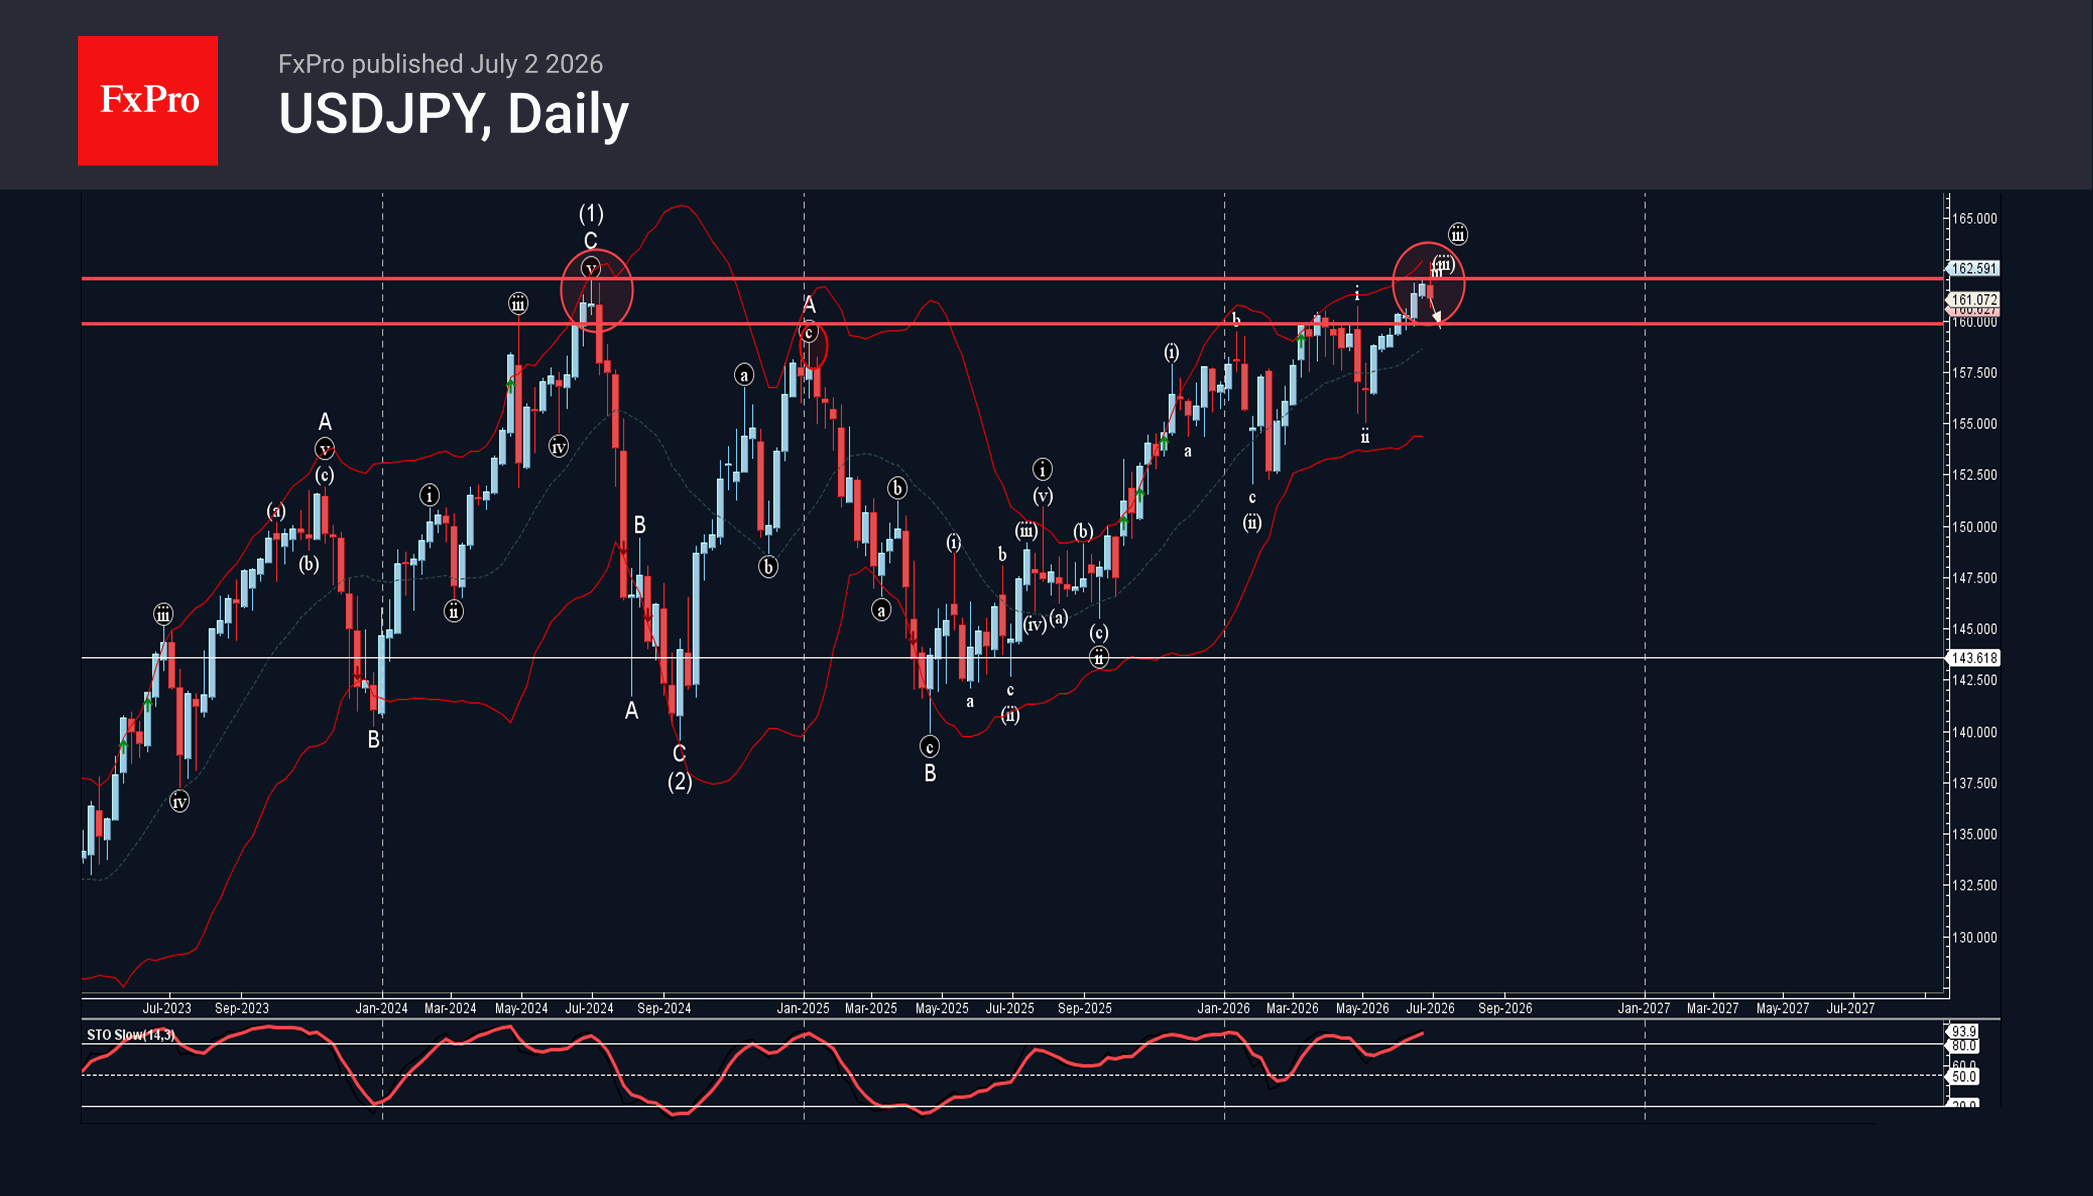
USDJPY Wave Analysis
USDJPY: ⬇️ Sell
– USDJPY reversed from the long-term resistance level 162.0
– Likely to fall to support level 160.00
USDJPY currency pair recently reversed from the resistance zone between the long-term resistance level 162.0 (which stopped the sharp weekly uptrend in 2024) and the upper weekly Bollinger Band.
The downward reversal from the resistance zone stopped the previous minor impulse wave iii – that belongs to wave B from 2025.
Given the strength of the resistance level 162.0 and the overbought weekly Stochastic, USDJPY currency pair can be expected to fall to the next support level 160.00.
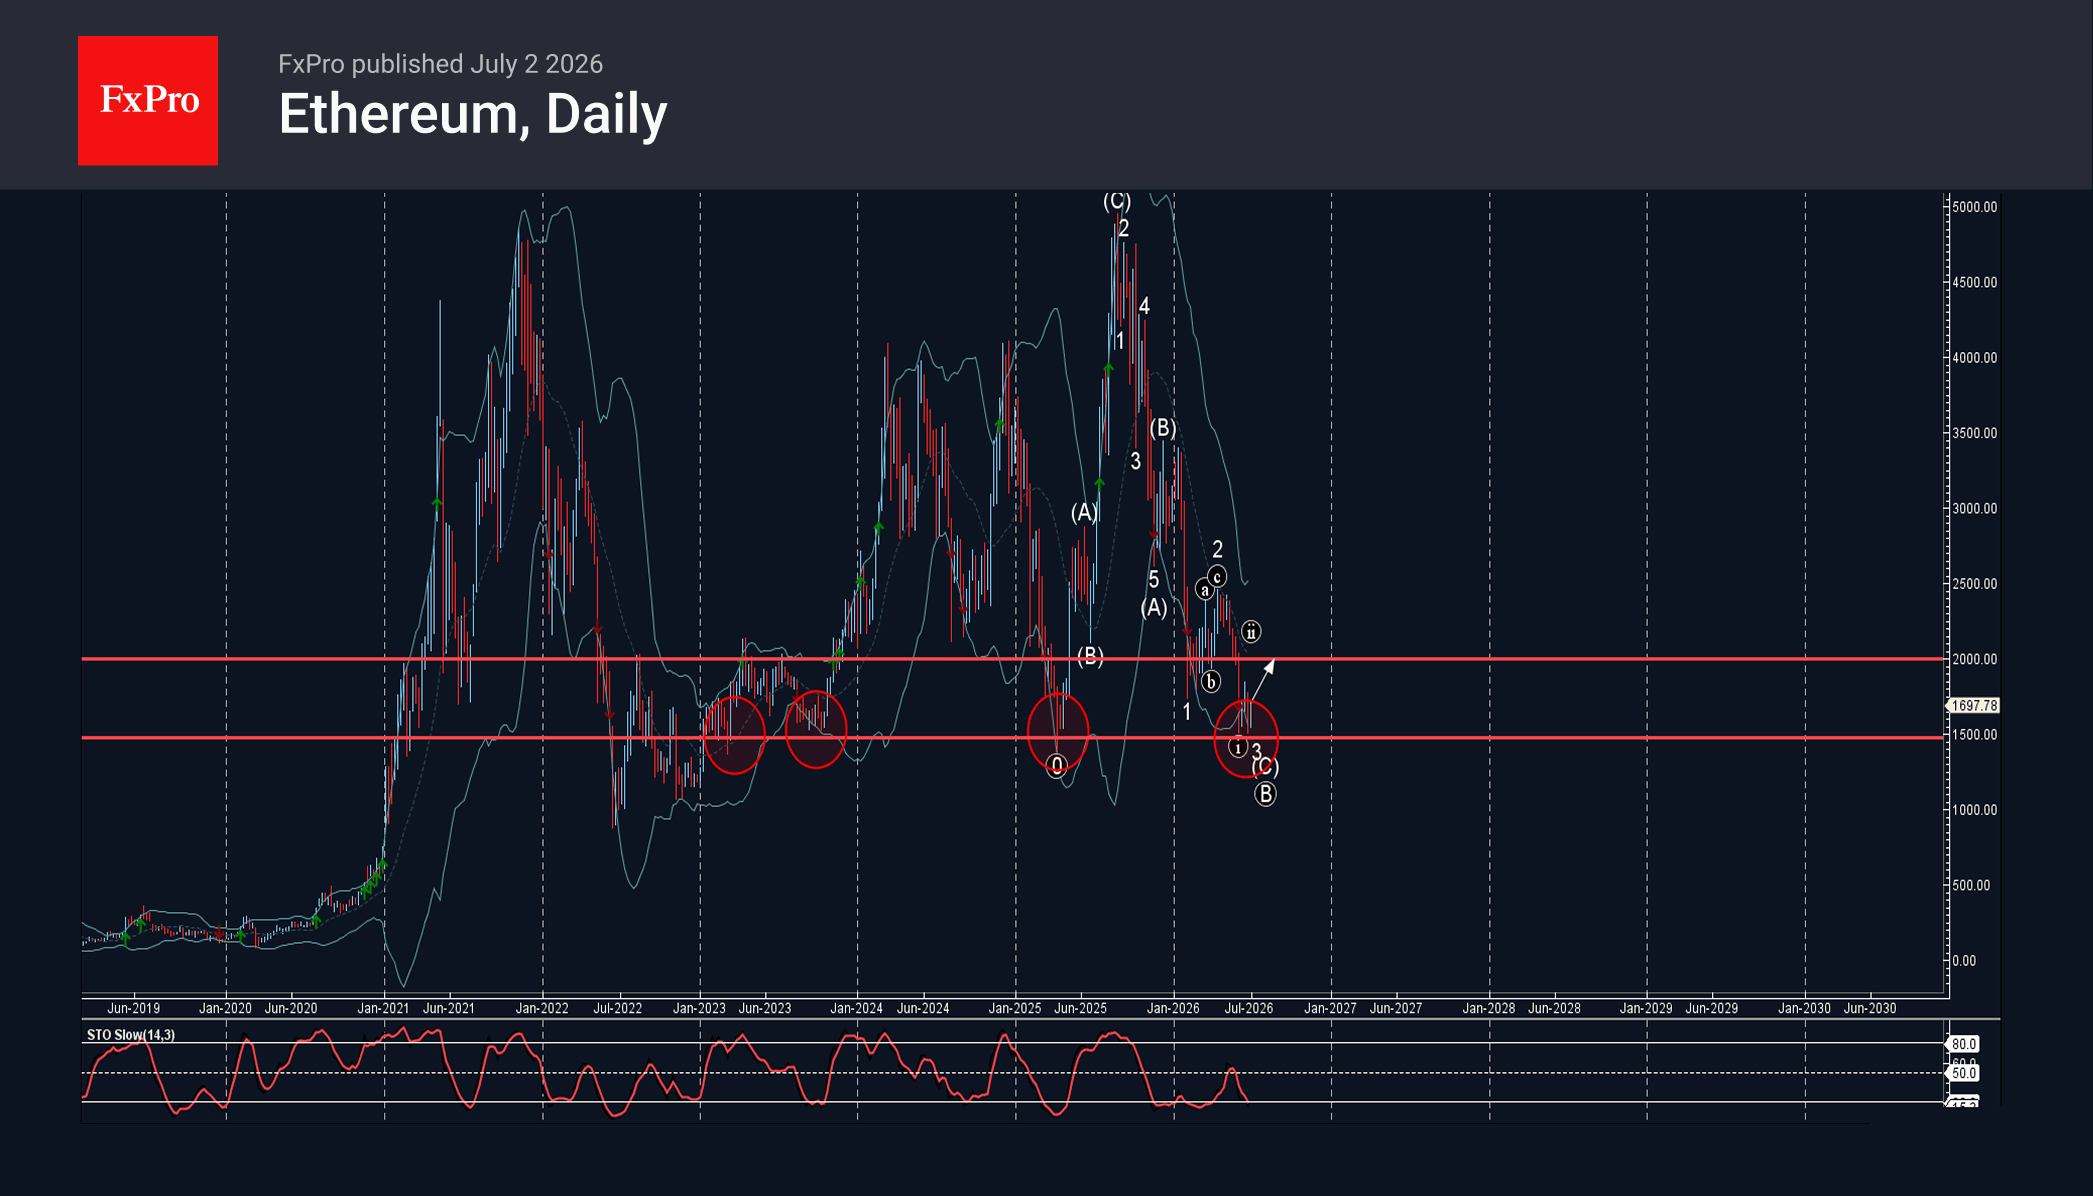
Ethereum Wave Analysis
Ethereum: ⬆️ Buy
– Ethereum reversed from long-term support level 1500.00
– Likely to rise to resistance level 2000.00
Ethereum cryptocurrency recently reversed up from the support zone between the long-term support level 1500.00 (which has been reversing the price from January) and the lower daily Bollinger Band.
The upward reversal from the support zone stopped the previous minor impulse wave 3.
Given the strength of the support level 1500.00 and the oversold daily Stochastic, Ethereum cryptocurrency can be expected to rise to the next resistance level 2000.00.
Eco Data 7/3/26
| GMT | Ccy | Events | Act | Cons | Prev | Rev |
|---|---|---|---|---|---|---|
| 23:00 | AUD | Services PMI Jun F | 50.5 | 49.9 | 49.9 | |
| 00:30 | JPY | Services PMI Jun F | 52.2 | 51.8 | 51.8 | |
| 01:45 | CNY | RatingDog Services PMI Jun | 54.1 | 53.6 | 54.4 | |
| 06:45 | EUR | France Industrial Output M/M May | -0.10% | -0.30% | 0.10% | 0.30% |
| 07:50 | EUR | France Services PMI Jun F | 46.8 | 47.4 | 47.4 | |
| 07:55 | EUR | Germany Services PMI Jun F | 48.6 | 46.8 | 46.8 | |
| 08:00 | EUR | Eurozone Services PMI Jun F | 49.4 | 48.9 | 48.9 | |
| 08:30 | GBP | Services PMI Jun F | 48.8 | 48.7 | 48.7 |
| 23:00 | AUD |
| Services PMI Jun F | |
| Actual | 50.5 |
| Consensus | 49.9 |
| Previous | 49.9 |
| 00:30 | JPY |
| Services PMI Jun F | |
| Actual | 52.2 |
| Consensus | 51.8 |
| Previous | 51.8 |
| 01:45 | CNY |
| RatingDog Services PMI Jun | |
| Actual | 54.1 |
| Consensus | 53.6 |
| Previous | 54.4 |
| 06:45 | EUR |
| France Industrial Output M/M May | |
| Actual | -0.10% |
| Consensus | -0.30% |
| Previous | 0.10% |
| Revised | 0.30% |
| 07:50 | EUR |
| France Services PMI Jun F | |
| Actual | 46.8 |
| Consensus | 47.4 |
| Previous | 47.4 |
| 07:55 | EUR |
| Germany Services PMI Jun F | |
| Actual | 48.6 |
| Consensus | 46.8 |
| Previous | 46.8 |
| 08:00 | EUR |
| Eurozone Services PMI Jun F | |
| Actual | 49.4 |
| Consensus | 48.9 |
| Previous | 48.9 |
| 08:30 | GBP |
| Services PMI Jun F | |
| Actual | 48.8 |
| Consensus | 48.7 |
| Previous | 48.7 |
Sunset Market Commentary
Markets
Markets were counting down to the June US payrolls as it could further shape expectations on Fed tightening and the implications for financial conditions globally. In the meantime, yield curves in Japan, the UK and Europe embarked on a steepening trend, a development that tentatively restarted over previous sessions. The short end of the curve apparently is 'better protected' as the comments from ECB and BoE policymakers of late suggest that the decline in the oil price is buying time to assess next policy steps. German yields rose between 2 bps (2-y) and 4.5 bps ahead of the US payrolls. For the UK and the Japanese yield curve this was respectively +2 bps (2-y) and 6 bps (30-y) and minus 0.6 bps and +5.7 bps (30-y). The move in JGBs was reinforced by an uninspiring 10-y JGB auction. Investors apparently still ask higher premia as the Japanese government aims for a supportive fiscal policy to propel (nominal) GDP growth. At the same time, it wants the BoJ to join (or at least not to counteract) this policy ambition. The rise in long-term bond risk premia this time didn't hurt the likes of sterling or the yen. After touching the highest level in 40 years (weakest for the yen) at USD/JPY 162.84 yesterday, the pair dropped to the 161.4 area ahead of the payrolls as markets apparently fear imminent interventions (e.g. in a context of thinner market liquidity when US markets are closed tomorrow). Sterling also gained further, extending yesterday's break below the 0.86 range bottom that marked the floor of a trading range at work for about a year. EUR/GBP traded near 0.856 ahead of the payrolls release. The euro also slightly outperformed the dollar but lost against the likes of the yen and sterling.
These moves evidently still had to be validated by the reaction to the US payrolls report. After three solid monthly reports, the US economy in June only created a net 57k jobs, with on top a negative revision of 74k for the previous two months. The miss was mainly due to a surprise decline in leisure and hospitality (-61k, potentially attributable to World Cup effects). Professional business services (+36k) and private education and health (+69k) contributed positively. There was also a marginal rise in manufacturing jobs (+3k). The unemployment rate (derived from the household survey) declined from 4.3% to 4.2%, but 'for the wrong reason'. Employment in this survey declined 507k, but less than the fall in the labour force (-720k), suggesting lower participation. Average hourly earnings printed as expected at 0.3% M/M and 3.5% Y/Y. The strong swings in the household survey probably won't go unnoticed by Fed Chair Warsh as the Fed is taking a look at data accuracy/reliability. Even so, the US yield curve steepens with the 2-y yield easing 4 bps. The 30-y still adds about 2 bp. Markets now only see about 20% probability of a July rate hike (from about 30%). A 25 bps step is now only fully discounted by December. Yields in EMU/Germany and the UK reacted only marginally compared to pre-payrolls levels (1-2 bps lower at the short end of the curve). The dollar faces a setback. DXY tumbles from the 101.2 area to currently trade near 100.8. EUR/USD rebounds to the 1.1445 area. Even the yen extends intraday gains against the dollar to trade near USD/JPY 161. Equities enjoy the 'diminishing chance' of tighter financial conditions. The Eurostoxx 500 gains 1.3%. The S&P escaped from a negative open (+0.3%).
News & Views
Germany's government coalition overcame weeks of friction to agree on a wide-ranging reform package aimed at reviving the economy's long-term growth potential and reforming social welfare, the pension system and the labour market. It also includes support for critical sectors such as AI, semiconductors and batteries. It also offers €10bn in annual income tax relief for small- to middle-earning households. Discussions about the eventual 34-point package got an important boost last week when coalition partners largely agreed on the pension overhaul while they were still apart on the tax cuts. CDU conservatives had long resisted financing it (partially) with a higher tax rate on top earners. The legislative blueprint is meant to evolve into a comprehensive plan by the parliamentary summer recess that begins at the end of next week.
Swiss inflation stagnated in June on a monthly basis, allowing the Y/Y figure to cool down from 0.6% to 0.5%. Core CPI defied an expected uptick to 0.4% by matching May's 0.3% y/y. Prices increased for fruiting vegetables, stem vegetables, hotels and other accommodation providers as well as for car rental and car sharing. These were offset by lower prices, mainly for energy-related products. Recent weakening of the franc doesn't appear to have filtered through yet with imported inflation falling by 0.4% m/m, to be up only 0.2% y/y. EUR/CHF traded unchanged on the release before slipping through 0.92, but the pair bounced back to trade slightly lower on the day around that big figure. Swiss money markets continue to lean toward a rate hike rather than a cut from zero. The implied probability for such a move this year is low (approximately 25%).
Dollar Falls on Disappointing US June NFP Numbers
The US dollar fell across the board on Thursday, hit by disappointing US labor data, (June NFP 57K vs 114K f/c and downwardly revised May result to 129K from 172K) reflecting significantly weaker than expected job growth last month.
The dollar Index, which tracks performance of dollar against the basket of six major currencies, fell 0.6% in immediate reaction to economic data and hit the lowest level in two weeks.
Softer than expected June labor data provide temporary relief to the Fed and fade expectations for rate hike in July, amid recent hawkish shift in the central bank’s narrative, although bets for September’s rate hike remain high.
Fresh weakness undermined larger bulls on completion of bearish failure swing pattern on daily chart and violation of initial Fibo support at 100.58 (23.6% retracement of 97.44/101.55 rally) though close below the latter will be needed to verify signal.
However, technical picture on daily chart remains bullish, with south-turning momentum indicators, still holding well in the positive territory, showing more space for correction.
Dips should ideally find firm ground at 100 zone (psychological / Fibo 38.2% retracement / bull-channel support line) to keep larger bulls in play and mark a healthy correction ahead of fresh extension of larger uptrend.
Res: 100.96; 101.55; 102.00; 102.40
Sup: 100.29; 100.00; 99.50; 99.24
US: Payrolls Cool in June, But Unemployment Rate Falls to 4.2%
Nonfarm payrolls rose by 57k in June, lower than the Bloomberg consensus forecast of 113k. Revisions to the two prior months were 74k lower.
- Smoothing through volatility, payrolls averaged 111k over the last three months, stronger than the 42k averaged over the last twelve months.
Private payrolls rose 49k, slower than the 97k recorded in May. Job gains were concentrated in professional & business services (+36k) and health care & social assistance (+46.6k). Leisure & hospitality shed 61k last month, following a large jump the month prior. Meanwhile, government added 8k new positions.
In the household survey, the labor force plummeted by 720k, larger than the still hefty decline in civilian employment (-507k). As a result, the unemployment rate fell 11 basis points to a twelve-month low of 4.2%.
Average hourly earnings rose 0.3% month-on-month (m/m), pushing the year-ago measure to 3.5% (from 3.4% the month prior).
Key Implications
Payrolls moderated in June, following a string of exceptionally strong gains in each of the prior three months. The pullback hardly came as a surprise, especially given the large gains in leisure & hospitality and local government the month prior. That said, job growth is still considerably stronger than a year ago, and is also running slightly above the estimated breakeven rate, which helped to push the unemployment rate to a twelve-month low of 4.2%.
While the labor market has clearly turned a corner, this morning's weaker headline print combined with the downward revisions suggests it's stopping short of a full-blown reacceleration. Market odds for a July hike were completely pushed back following the release (a hike was 30% priced ahead of payrolls), with all eyes now turning to the June CPI (scheduled for July 14th). While a hotter reading could swing odds back in favor of a summer hike, we still think the bar for policy tightening is high. Today's policy rate remains somewhat in restrictive territory and provided inflation cools as expected in H2-2026, it will lead to a natural tightening in the real fed funds rate.