Sample Category Title
EUR/CHF Weekly Outlook
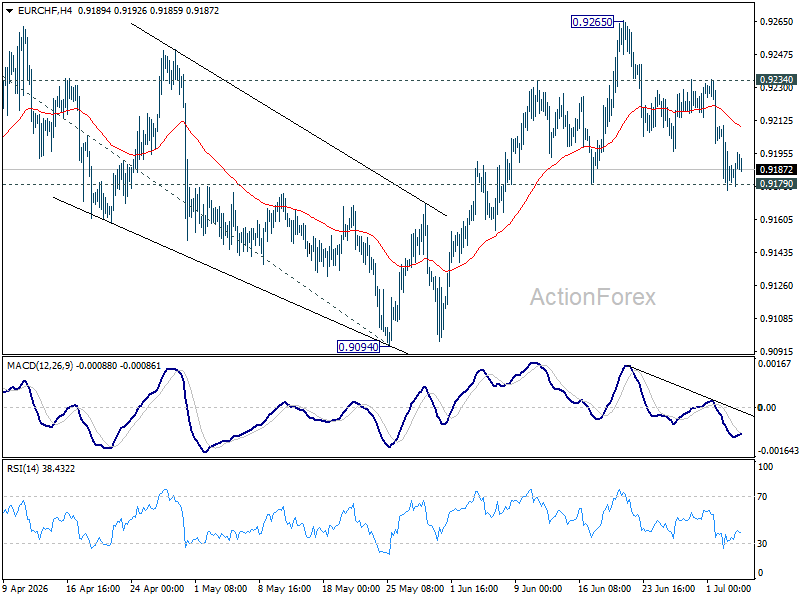
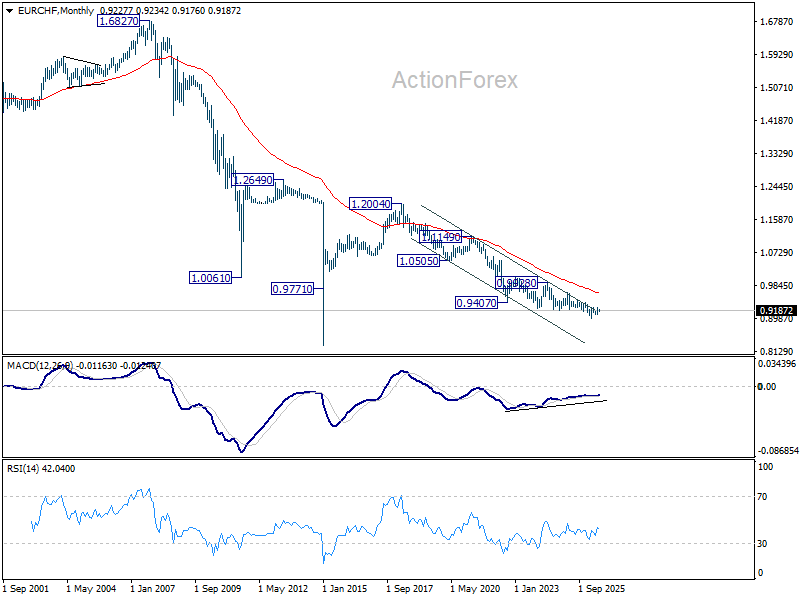
While EUR/CHF's pullback from 0.9265 extended lower last week, downside is still contained by 0.9179 support. Initial bias remains neutral this week and further rise is in favor. On the upside,a above 0.9234 will bring retest of 0.9265 resistance first. Firm break there will resume the rally from 0.8979 to 100% projection of 0.8979 to 0.9264 from 0.9094 at 0.9379. However, decisive break of 0.9179 will dampen this bullish view, and bring deeper fall back to 0.9094 support.
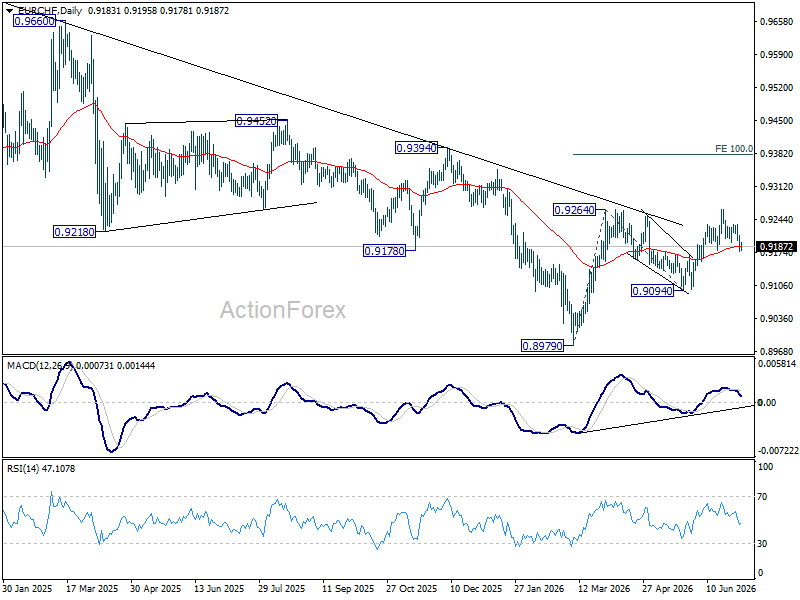
In the bigger picture, the break of medium term falling trend line resistance indicates that 0.8979 is already a medium term bottom. Considering bullish convergence condition in W MACD, rise from there should at least be reversing the fall from 0.9928, with prospect of developing into a medium term up trend. Firm break of 0.9394 resistance will add more credence to this case. For now risk will remain on the upside as long as 0.9094 support holds, in case of retreat.
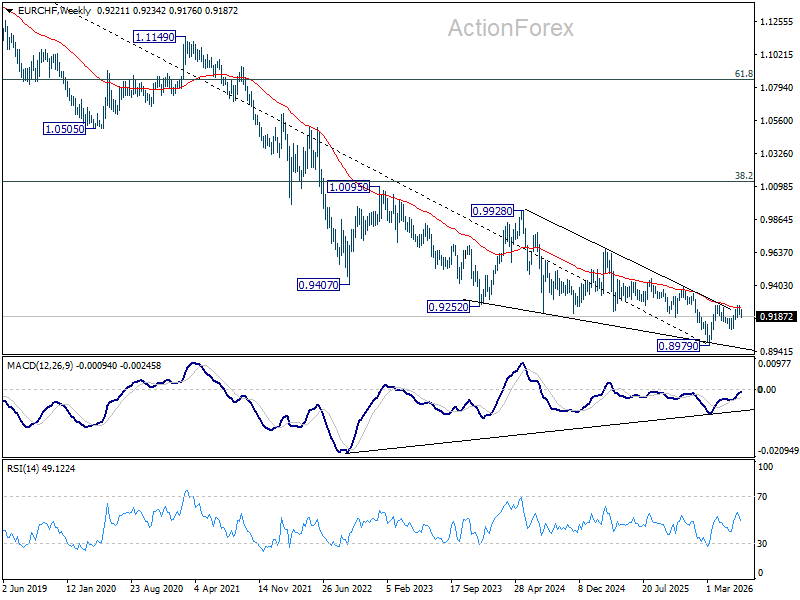
In the long term picture, outlook will stay bearish as long as 0.9407 support turned resistance (2022 low) holds. However, firm break of 0.9407 will argue that the down trend from 1.2004 (2018 high) has completed with five waves down to 0.8979. Stronger rebound should then be seen to 38.2% retracement of 1.2004 to 0.8979 at 1.0135 in the medium term.
EURGBP – Larger Bears to Take a Breather
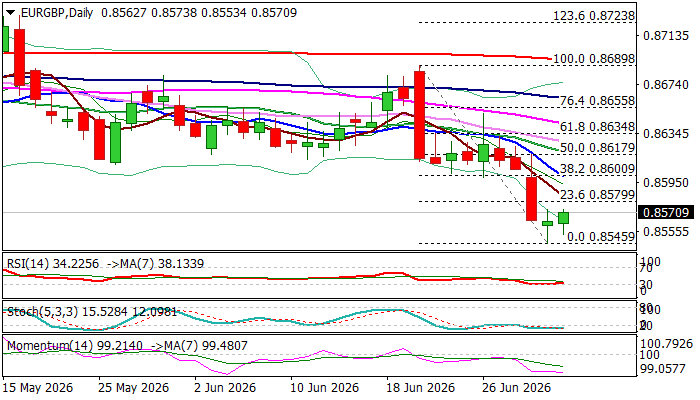
EURGBP edges higher on Friday after fresh acceleration lower in past three days failed to clearly break Fibo support at 0.8552 (50% retracement of 0.8239/0.8865 rally, also weekly Ichimoku cloud base) and formed a bear-trap pattern on daily chart that paves the way for recovery.
The Euro remained at the back foot due to significant slowdown in Eurozone economic growth, persisting geopolitical uncertainty and higher energy cost, while sterling received boost from easing political uncertainty and signals that the BoE may keep higher interest rates for some time as inflation remains elevated.
Reversal pattern is developing on daily chart, though still requiring verification on longer bullish daily candle on Friday and daily close minimum above 0.8580 Fibo 23.6% of 0.8689/0.8545 bear-leg).
Significant bullish developments can be seen on hourly chart that contribute to reversal scenario, while daily studies are still mixed (MAs in bearish configuration vs RSI reversing from oversold zone) that way obstruct recovery attempts.
Lift above 0.8580 to expose more significant barrier at 0.8600 (Fibo 38.2% / 10DMA), violation of which to generate stronger bullish signal.
On the other hand, recovery stall under 0.8600 to keep larger bears in play and provide better levels to re-enter bearish market.
Res: 0.8580; 0.8600; 0.8620; 0.8634
Sup: 0.8545; 0.8507; 0.8478; 0.8458
Labour Market and Business Sentiment in Focus as Canada’s Economy Stabilizes
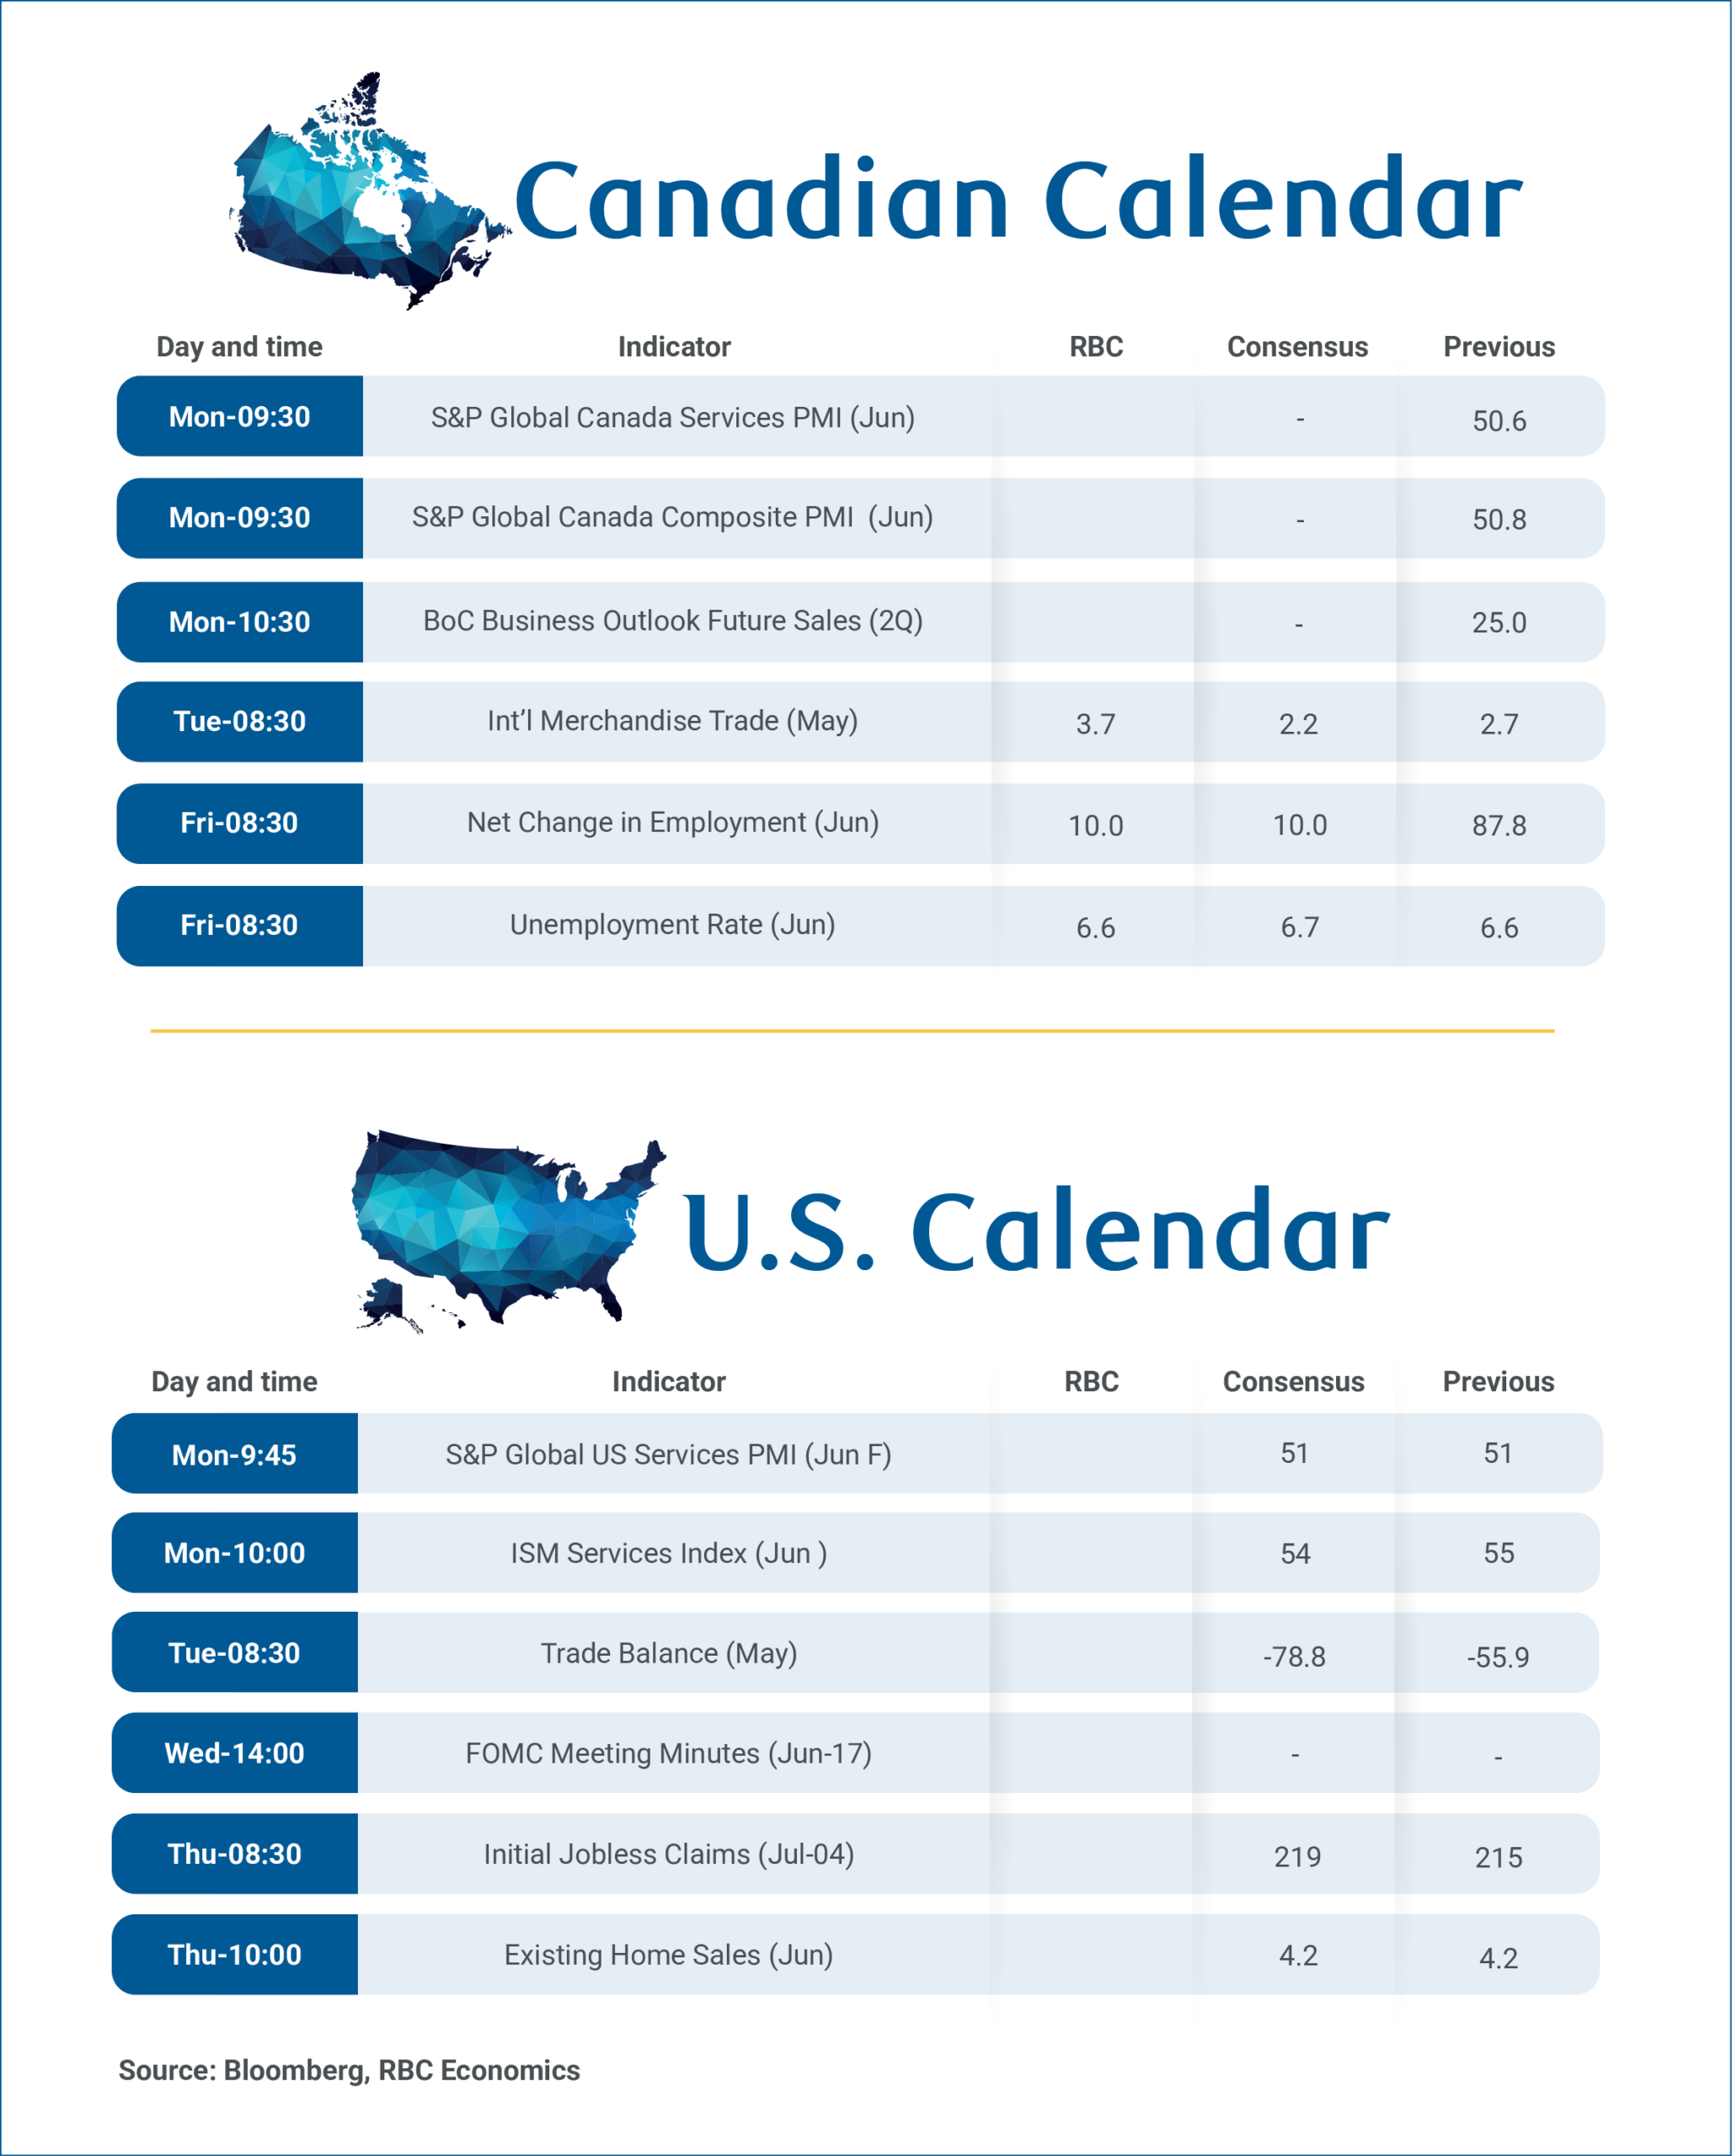
Canada’s employment report next Friday and the Bank of Canada’s Business Outlook Survey on Monday should provide important updates on the balance between labour market conditions, business confidence and inflation expectations.
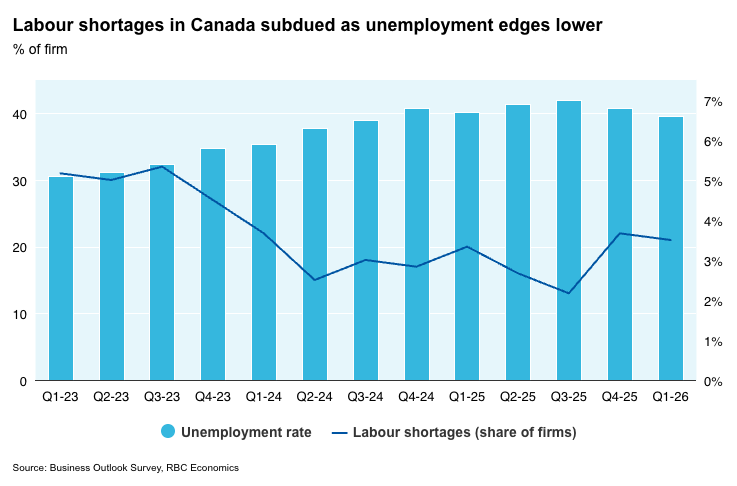
We expect June’s labour market to broadly hold onto gains in the prior month that retraced much of the weak data over the first four months of the year. We look for jobs to edge higher by 10,000, and the unemployment rate to remain at 6.6% in June, matching May’s reading and down from 6.9% in April.
Unemployment is still elevated by historical standards, and volatile from month-to-month, but has mostly edged gradually lower since hitting a peak of 7.1% in August/September last year. We continue to expect a gradual improvement over the remainder of 2026.
Wage growth will also remain on the radar after slowing sharply in May. Monthly readings can be volatile, but a still-elevated unemployment rate should continue to keep underlying wage pressures contained in the near term.
Looking ahead, job growth is expected to remain soft, but an unprecedented pullback in Canada’s population is shrinking the labour force with per-worker labour market conditions showing more signs of improvement.
Business Outlook Survey to hint at confidence during oil price shock
The Q2 Business Outlook Survey will provide an early look at how business sentiment was impacted by the surge in energy prices in recent months. Survey responses were (at least initially) likely collected largely in May when oil prices were higher (West Texas Intermediate oil prices averaged just under US$100/barrel compared to under $70/bbl recently).
Results will still be reviewed for signs on whether inflation pressures broadened. But longer-term inflation expectations should remain well anchored as underlying pressures have continued to track close to the BoC's 2% target.
Measures of expected future sales, employment, and business investment intentions will also be key after showing signs of improvement in the Q1.
Continued labour market stabilization alongside broadly steady business sentiment and well-anchored inflation expectations would reinforce the view that interest rate changes are not needed at this stage.
May trade data will also be released on Tuesday. We expect exports to rise 0.6%, slowing from 1.6% in April, while imports are expected to edge down 0.8%. Softer energy price growth in May should temper the energy trade balance, while softer motor vehicle shipments suggest some moderation in auto trade.
Summary 7/6 – 7/10
Monday, Jul 6, 2026
| GMT | Ccy | Events | Cons | Prev |
|---|---|---|---|---|
| 01:00 | AUD | TD-MI Inflation Gauge M/M Jun | -0.30% | |
| 06:00 | EUR | Germany Factory Orders M/M May | 1.10% | -3.80% |
| 08:00 | CHF | Unemployment Rate Jun | 3.10% | 3.10% |
| 08:30 | EUR | Eurozone Sentix Investor Confidence Jul | -8.9 | -13.4 |
| 08:30 | GBP | Construction PMI Jun | 40.1 | 38.2 |
| 09:00 | EUR | Eurozone Retail Sales M/M May | 0.20% | -0.40% |
| 09:00 | EUR | Eurozone PPI M/M May | 0.20% | 0.60% |
| 09:00 | EUR | Eurozone PPI Y/Y May | 5.70% | 4.90% |
| 13:45 | USD | Services PMI Jun F | 51.4 | 51.3 |
| 14:00 | USD | ISM Services PMI Jun | 54.2 | 54.5 |
| 14:00 | USD | ISM Services Prices Paid Jun | 71.3 | |
| 14:00 | USD | ISM Services Employment Index Jun | 47.9 |
| 01:00 | AUD |
| TD-MI Inflation Gauge M/M Jun | |
| Consensus | |
| Previous | -0.30% |
| 06:00 | EUR |
| Germany Factory Orders M/M May | |
| Consensus | 1.10% |
| Previous | -3.80% |
| 08:00 | CHF |
| Unemployment Rate Jun | |
| Consensus | 3.10% |
| Previous | 3.10% |
| 08:30 | EUR |
| Eurozone Sentix Investor Confidence Jul | |
| Consensus | -8.9 |
| Previous | -13.4 |
| 08:30 | GBP |
| Construction PMI Jun | |
| Consensus | 40.1 |
| Previous | 38.2 |
| 09:00 | EUR |
| Eurozone Retail Sales M/M May | |
| Consensus | 0.20% |
| Previous | -0.40% |
| 09:00 | EUR |
| Eurozone PPI M/M May | |
| Consensus | 0.20% |
| Previous | 0.60% |
| 09:00 | EUR |
| Eurozone PPI Y/Y May | |
| Consensus | 5.70% |
| Previous | 4.90% |
| 13:45 | USD |
| Services PMI Jun F | |
| Consensus | 51.4 |
| Previous | 51.3 |
| 14:00 | USD |
| ISM Services PMI Jun | |
| Consensus | 54.2 |
| Previous | 54.5 |
| 14:00 | USD |
| ISM Services Prices Paid Jun | |
| Consensus | |
| Previous | 71.3 |
| 14:00 | USD |
| ISM Services Employment Index Jun | |
| Consensus | |
| Previous | 47.9 |
Tuesday, Jul 7, 2026
| GMT | Ccy | Events | Cons | Prev |
|---|---|---|---|---|
| 23:30 | JPY | Labor Cash Earnings Y/Y May | 3.40% | 3.50% |
| 23:30 | JPY | Overall Household Spending Y/Y May | -2.20% | -0.50% |
| 05:00 | JPY | Leading Economic Index May P | 116.9 | 116.1 |
| 06:00 | EUR | Germany Industrial Production M/M May | 0.40% | 0.40% |
| 07:00 | CHF | Foreign Currency Reserves (CHF) Jun | 711B | |
| 12:30 | CAD | Trade Balance (CAD) May | 2.8B | 2.7B |
| 12:30 | USD | Trade Balance (USD) May | -78.8B | -55.9B |
| 14:00 | CAD | Ivey PMI Jun | 59.1 | 58.2 |
| 23:30 | JPY |
| Labor Cash Earnings Y/Y May | |
| Consensus | 3.40% |
| Previous | 3.50% |
| 23:30 | JPY |
| Overall Household Spending Y/Y May | |
| Consensus | -2.20% |
| Previous | -0.50% |
| 05:00 | JPY |
| Leading Economic Index May P | |
| Consensus | 116.9 |
| Previous | 116.1 |
| 06:00 | EUR |
| Germany Industrial Production M/M May | |
| Consensus | 0.40% |
| Previous | 0.40% |
| 07:00 | CHF |
| Foreign Currency Reserves (CHF) Jun | |
| Consensus | |
| Previous | 711B |
| 12:30 | CAD |
| Trade Balance (CAD) May | |
| Consensus | 2.8B |
| Previous | 2.7B |
| 12:30 | USD |
| Trade Balance (USD) May | |
| Consensus | -78.8B |
| Previous | -55.9B |
| 14:00 | CAD |
| Ivey PMI Jun | |
| Consensus | 59.1 |
| Previous | 58.2 |
Wednesday, Jul 8, 2026
| GMT | Ccy | Events | Cons | Prev |
|---|---|---|---|---|
| 23:50 | JPY | Bank Lending Y/Y Jun | 5.80% | 5.70% |
| 02:00 | NZD | RBNZ Interest Rate Decision | 2.25% | 2.25% |
| 05:00 | JPY | Eco Watchers Survey: Current Jun | 44.6 | 43.6 |
| 14:00 | USD | Wholesale Inventories May F | 0.30% | 0.30% |
| 14:30 | USD | Crude Oil Inventories (Jul 3) | -1.9M | -3.8M |
| 18:00 | USD | FOMC Minutes |
| 23:50 | JPY |
| Bank Lending Y/Y Jun | |
| Consensus | 5.80% |
| Previous | 5.70% |
| 02:00 | NZD |
| RBNZ Interest Rate Decision | |
| Consensus | 2.25% |
| Previous | 2.25% |
| 05:00 | JPY |
| Eco Watchers Survey: Current Jun | |
| Consensus | 44.6 |
| Previous | 43.6 |
| 14:00 | USD |
| Wholesale Inventories May F | |
| Consensus | 0.30% |
| Previous | 0.30% |
| 14:30 | USD |
| Crude Oil Inventories (Jul 3) | |
| Consensus | -1.9M |
| Previous | -3.8M |
| 18:00 | USD |
| FOMC Minutes | |
| Consensus | |
| Previous | |
Thursday, Jul 9, 2026
| GMT | Ccy | Events | Cons | Prev |
|---|---|---|---|---|
| 22:30 | NZD | BusinessNZ PMI Jun | 49.9 | |
| 23:01 | GBP | RICS Housing Price Balance Jun | -31% | -34% |
| 23:50 | JPY | Money Supply M2+CD Y/Y Jun | 2.40% | 2.50% |
| 01:30 | CNY | CPI M/M Jun | -0.20% | -0.10% |
| 01:30 | CNY | CPI Y/Y Jun | 1.10% | 1.20% |
| 01:30 | CNY | PPI Y/Y Jun | 4.10% | 3.90% |
| 06:00 | JPY | Machine Tool Orders Y/Y Jun | 37.40% | |
| 06:00 | EUR | Germany Trade Balance (EUR) May | 14.2B | 14.5B |
| 11:30 | EUR | ECB Monetary Policy Meeting Accounts | ||
| 12:30 | USD | Initial Jobless Claims (Jul 3) | 210K | 215K |
| 14:00 | USD | Existing Home Sales Jun | 4.20M | 4.17M |
| 14:30 | USD | Natural Gas Storage (Jul 3) | 87B |
| 22:30 | NZD |
| BusinessNZ PMI Jun | |
| Consensus | |
| Previous | 49.9 |
| 23:01 | GBP |
| RICS Housing Price Balance Jun | |
| Consensus | -31% |
| Previous | -34% |
| 23:50 | JPY |
| Money Supply M2+CD Y/Y Jun | |
| Consensus | 2.40% |
| Previous | 2.50% |
| 01:30 | CNY |
| CPI M/M Jun | |
| Consensus | -0.20% |
| Previous | -0.10% |
| 01:30 | CNY |
| CPI Y/Y Jun | |
| Consensus | 1.10% |
| Previous | 1.20% |
| 01:30 | CNY |
| PPI Y/Y Jun | |
| Consensus | 4.10% |
| Previous | 3.90% |
| 06:00 | JPY |
| Machine Tool Orders Y/Y Jun | |
| Consensus | |
| Previous | 37.40% |
| 06:00 | EUR |
| Germany Trade Balance (EUR) May | |
| Consensus | 14.2B |
| Previous | 14.5B |
| 11:30 | EUR |
| ECB Monetary Policy Meeting Accounts | |
| Consensus | |
| Previous | |
| 12:30 | USD |
| Initial Jobless Claims (Jul 3) | |
| Consensus | 210K |
| Previous | 215K |
| 14:00 | USD |
| Existing Home Sales Jun | |
| Consensus | 4.20M |
| Previous | 4.17M |
| 14:30 | USD |
| Natural Gas Storage (Jul 3) | |
| Consensus | |
| Previous | 87B |
Friday, Jul 10, 2026
| GMT | Ccy | Events | Cons | Prev |
|---|---|---|---|---|
| 23:50 | JPY | PPI M/M Jun | 0.30% | 0.90% |
| 23:50 | JPY | PPI Y/Y Jun | 6.80% | 6.30% |
| 06:00 | EUR | Germany CPI M/M Jun F | -0.30% | -0.30% |
| 06:00 | EUR | Germany CPI Y/Y Jun F | 2.30% | 2.30% |
| 12:30 | CAD | Net Change in Employment Jun | 10.0K | 87.8K |
| 12:30 | CAD | Unemployment Rate Jun | 6.60% | 6.60% |
| 12:30 | CAD | Building Permits M/M May | 1.00% | -7.60% |
| 23:50 | JPY |
| PPI M/M Jun | |
| Consensus | 0.30% |
| Previous | 0.90% |
| 23:50 | JPY |
| PPI Y/Y Jun | |
| Consensus | 6.80% |
| Previous | 6.30% |
| 06:00 | EUR |
| Germany CPI M/M Jun F | |
| Consensus | -0.30% |
| Previous | -0.30% |
| 06:00 | EUR |
| Germany CPI Y/Y Jun F | |
| Consensus | 2.30% |
| Previous | 2.30% |
| 12:30 | CAD |
| Net Change in Employment Jun | |
| Consensus | 10.0K |
| Previous | 87.8K |
| 12:30 | CAD |
| Unemployment Rate Jun | |
| Consensus | 6.60% |
| Previous | 6.60% |
| 12:30 | CAD |
| Building Permits M/M May | |
| Consensus | 1.00% |
| Previous | -7.60% |
The Dollar: Has the Trend Been Broken?
- The fall in the USD index could mark the beginning of the end.
- Rumours of currency interventions sent USDJPY tumbling.
The US dollar plummeted to a two-week low amid disappointing labour market figures. Non-farm payrolls rose by 57,000 in June and were revised downwards by 74,000 for April and May. The fall in the unemployment rate to 4.2% was due to a reduction in the labour force rather than an acceleration in hiring.
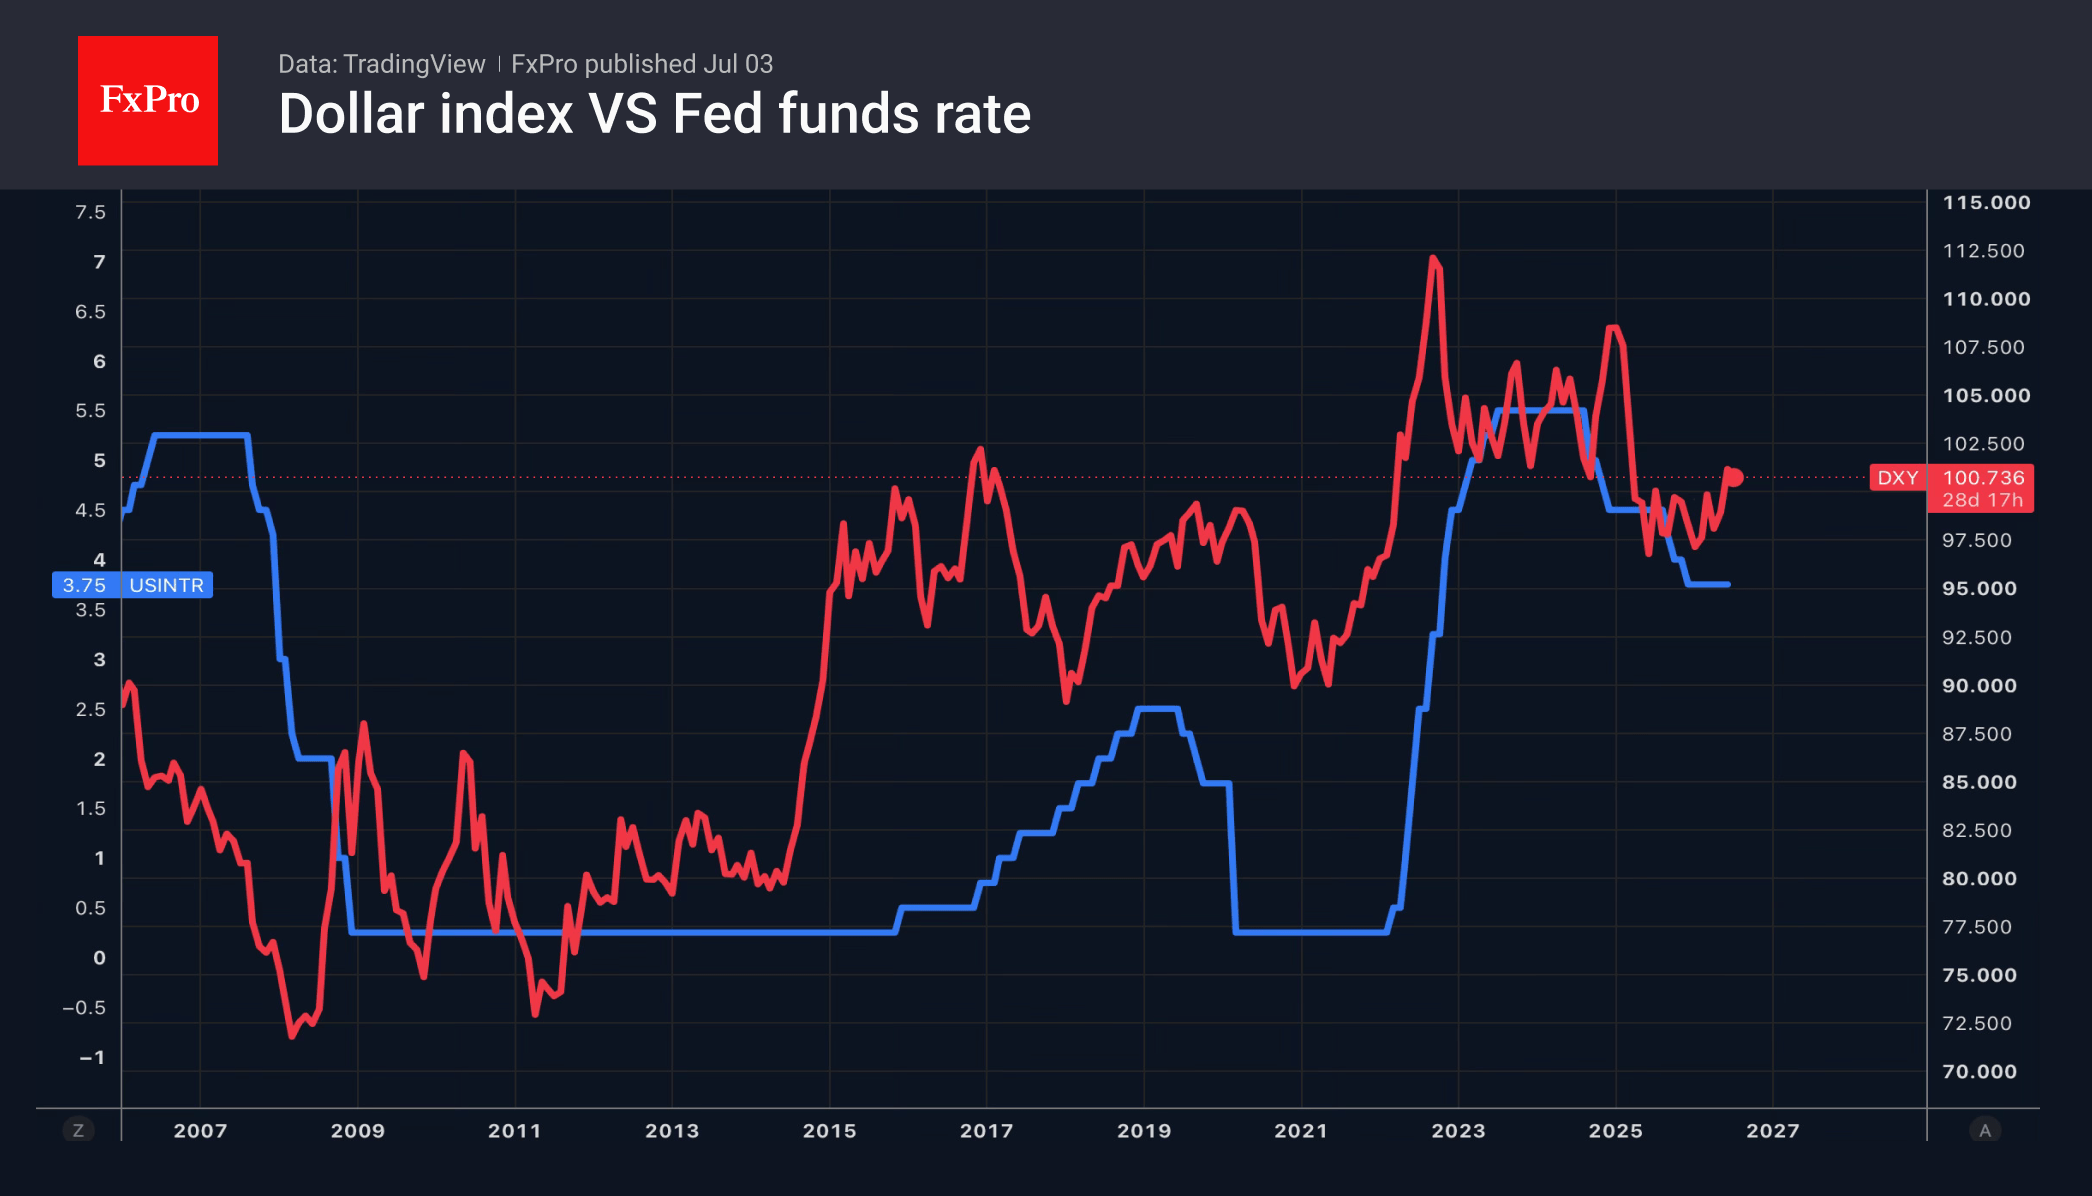
Against the backdrop of these figures, the probability of a rate rise in July fell from 30% to 20% in the markets; the probability of a rise by September fell from 64% to 53%; and the probability of a rise by the end of the year fell from 83% to 78%. This put pressure on the dollar. Earlier, speculators had increased their net long positions in the US currency to a one-and-a-half-year high, making this trade heavily concentrated. Profit-taking became the catalyst for the rise in EURUSD.
According to Credit Agricole, the US dollar appears overbought and overvalued. The Fed may, in fact, not be as ‘hawkish’ as the markets believe. Eurizon SLJ Capital maintains that investors have already squeezed everything they can out of the USD index rally. The positive sentiment has been fully priced in; it is now time to take profits.
TD Securities argues that as global GDP accelerates and risk premiums narrow, the interest rate differential between the US and the rest of the world will narrow, leading to a weakening of the greenback in the second half of the year. The stabilisation of the international situation following turmoil caused by tariffs and the conflict in the Middle East could also trigger a depreciation of the dollar’s exchange rate.
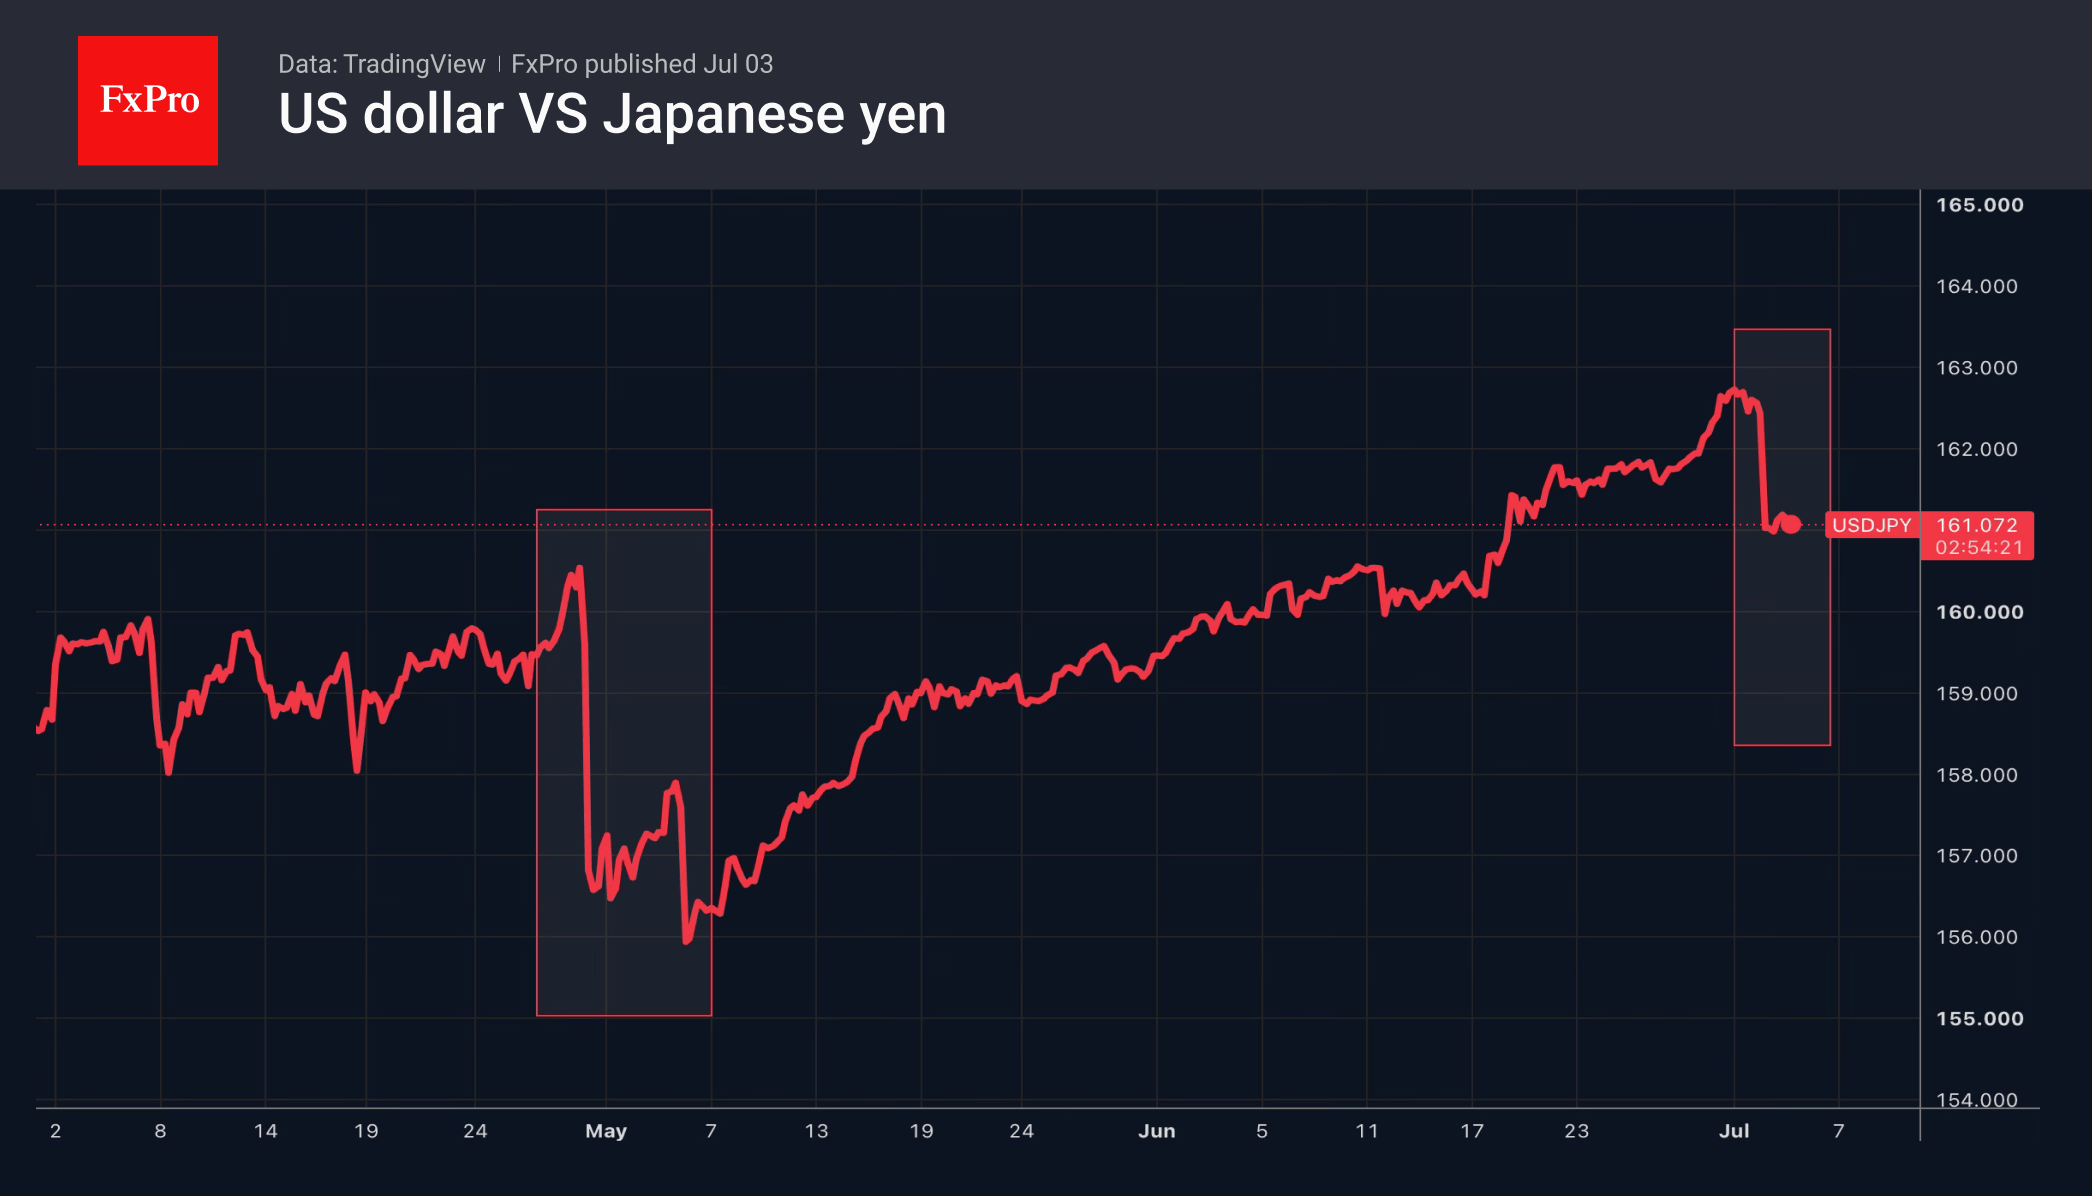
Meanwhile, the sharpest fall in USDJPY since Japan’s currency interventions in April and May has prompted speculation about whether the authorities have resumed such practices. Was there intervention in the forex market, or did speculators’ fears prompt them to close out the short positions of their own accord?
A Reuters report and a speech by Atsushi Mimura triggered the sell-off in USDJPY. The news agency claims that the government has adopted a new tactic: rather than giving a warning of currency interventions, as it did at the end of April, it will now rely on the element of surprise. The chief currency official, the Vice Minister of Finance for International Affairs, stated that the previous intervention was justified, and that the US does not object to, but rather supports, such actions.
The FxPro Analyst Team
Week Ahead – ISM Services PMI and Fed Minutes to Shake Fed Hike Bets
- Dollar drops on NFP, but rate hike still expected by year-end.
- ISM services PMI and Fed minutes are the greenback's next catalysts.
- RBNZ expected to raise rates, focus will be on forward guidance.
- ECB minutes, China CPI and Canada's jobs report also on the agenda.
Fed Hike Still on the Table After Disappointing Data
The US dollar is finishing the week on the back foot against most of its major counterparts this week, losing the most ground against the kiwi, the franc and the pound.
Despite the pullback, investors remained adamant in their view that the Fed may have to press the rate hike button before the turn of the year. Although oil prices have fallen back to their pre-war levels, the impact of the energy shock resulting from the war in Iran may not have yet been fully transmitted to the broader economy.
However, the softness in the ISM manufacturing PMI and the surprisingly weak nonfarm payrolls, both for the month of June, have prompted investors to slightly push back the timing of when they expect policymakers to press the rate-hike button. A quarter-point rate hike is now fully priced in for December, while the probability of it being delivered in July has slipped from around 35% to 18%.
What may have allowed investors to maintain some of their hawkish Fed bets despite the weakness in the data and the pullback of oil prices were remarks by Fed Chair Kevin Warsh at the ECB Forum in Sintra, Portugal. The new Fed chief said that he will "disappoint" anyone expecting him and his colleagues to tolerate above-target inflation.
Given that Warsh was appointed by President Trump on the premise that he will be more dovish than his predecessor, Jerome Powell, his remarks sounded as music to investors' ears. Indeed, when asked about whether Trump may be among those who will be disappointed, Warsh stressed and highlighted that the Fed have been and will continue to be an independent central bank.
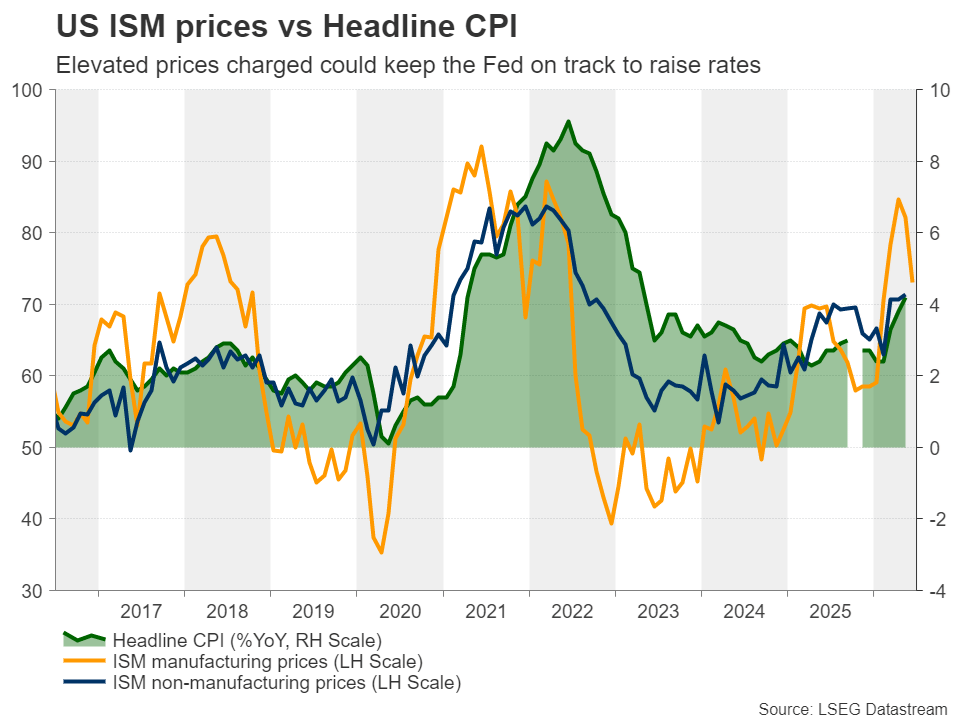
ISM Services PMI and Fed Minutes Enter the Limelight
With all that in mind, investors next week will closely monitor the ISM services PMI for June, due out on Monday, as well as the minutes of the latest FOMC meeting, scheduled for Wednesday.
This week, the ISM manufacturing PMI slipped to 53.3 from 54.0, with the prices subindex retreating to 73.0 from 82.1, still an elevated level, which, besides the period of the Middle East war, was last seen back in 2022, when the war in Ukraine erupted. Given that the non-manufacturing sector accounts for around 90% of US GDP, an elevated price subindex in the services survey could revive Fed rate hike bets.
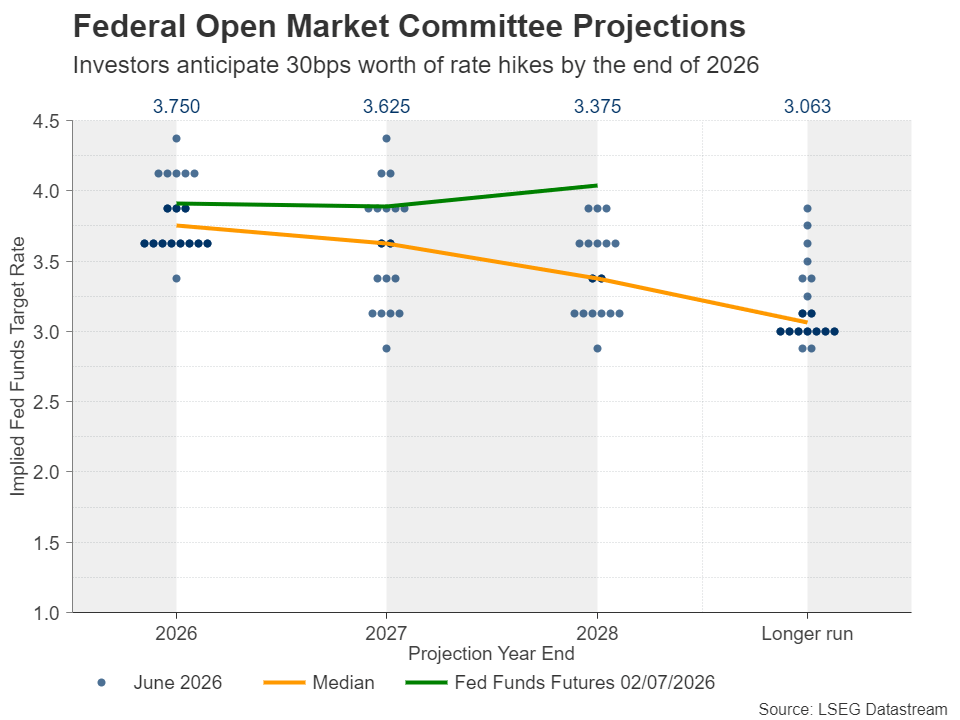
As for the minutes, bearing in mind that the forward guidance was removed from the meeting statement and that Kevin Warsh did not submit his interest rate projections, traders will be looking for clues as to whether he is supportive of a rate increase in the coming months.
With 9 members favoring at least one 25bps increase this year, with one voting for three and five members for two, a hawkish message from the minutes could help send Treasury yields and the US dollar up again. At the same time, gold could resume its slide amid a rising opportunity cost, while equities could pull back as a steeper implied Fed rate path could weigh on the present values of high-growth stocks. The opposite may be true if the data corroborates the notion that the Fed should wait a bit longer before deciding to raise interest rates.
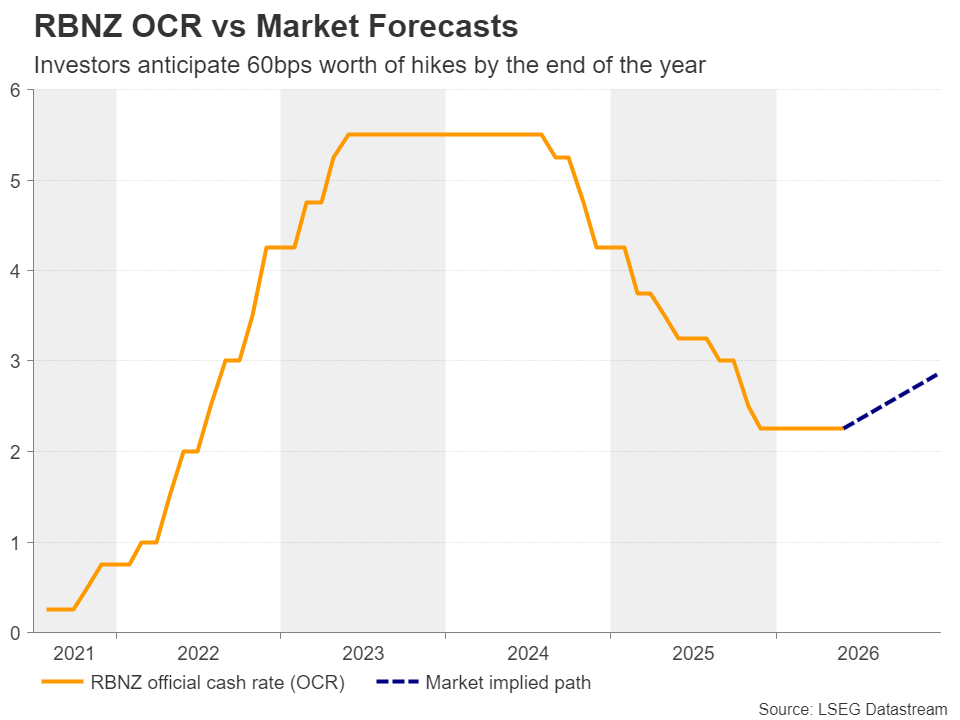
Will the RBNZ Opt for a Hawkish Hike?
Ahead of the FOMC minutes, during the Asian session on Wednesday, the RBNZ will announce its monetary policy decision. The latest gathering was held on May 27, with the central bank deciding to keep interest rates untouched.
However, the decision was far from unanimous. Three members voted for no changes and three for a rate hike, with Governor Breman's vote tilting the scale towards keeping rates on hold. That said, the accompanying statement was more hawkish than previously, indicating that rates would have to rise sooner and by more than previously expected due to the upside risks stemming from the Iran-related energy crisis.
Since then, although oil prices have pulled back amid a ceasefire deal between the US and Iran resulting in the reopening of the Strait of Hormuz, incoming data has reinforced the rate-hike case, with the GDP for Q1 coming in better than expected.
According to New Zealand's Overnight Index Swaps (OIS) market, there is a strong 80% chance of a quarter point rate increase at this gathering, while another two same-sized hikes are nearly fully priced in by February. Thus, for the kiwi to continue flexing its muscles, a 25bps hike on its own may not be enough. The Bank may also need to sound hawkish enough to satisfy market expectations of more increases in the months to come.
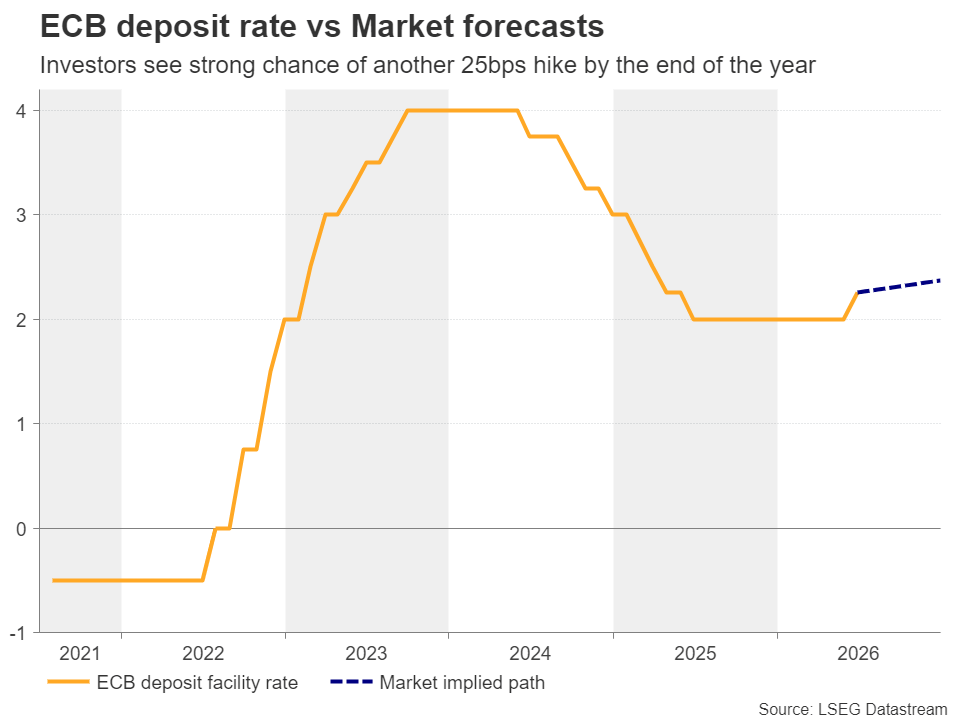
ECB Minutes, China CPI and Canada Jobs Data
On Thursday, the ECB will release the accounts of its latest meeting, when officials decided to raise interest rates by 25bps, taking the deposit rate up to 2.25%, and revised their inflation projections higher. Although the overall tone was hawkish, officials highlighted a data-dependent approach moving forward.
Market participants are now assigning a 30% chance of a rate hike at the upcoming meeting later this month, and thus, they may be eager to find out whether they are correct in doing so. Should the minutes reveal that officials had no reservations proceeding with a back-to-back hike if needed, that probability could go higher, providing some support to the euro.
Elsewhere, ahead of the ECB minutes, China's CPI and PPI data for June will come out, while on Friday, Canada will release its jobs report for the same month. The loonie has been suffering since the beginning of May, feeling the heat of falling oil prices and the BoC's neutral policy stance. It will be interesting to see whether a strong jobs report could allow for a relief bounce.
Dollar Losing Dominance as FX Markets Shift to Multiple Themes
The Dollar's decline paused on Friday as trading quietened ahead of the US Independence Day holiday, but the bigger story is not the day's price action. It is that the foreign exchange market is beginning to move beyond the one-dimensional narrative that dominated much of the second quarter. For weeks, almost every major currency traded as a reflection of one question: would the Federal Reserve tighten policy further? After this week's payrolls report, that monopoly is beginning to break.
Thursday's employment data did not paint the picture of a rapidly deteriorating labor market. Unemployment unexpectedly fell and wage growth remained firm. Yet payroll growth slowed much more than anticipated, reinforcing the view that the labor market is cooling rather than overheating. Combined with the sharp decline in oil prices following the US-Iran ceasefire, investors believe the Fed has time on its side. Futures markets have pared expectations for a September rate hike, while Treasury yields around 4.5% suggest markets are adjusting to a longer pause rather than pricing an imminent easing cycle.
That change in Fed expectations has not produced a classic "risk-on" response. Instead, it has encouraged investors to differentiate between sectors and currencies. The Dow Jones Industrial Average reached fresh record highs, while the NASDAQ retreated after reports that Meta Platforms intends to sell excess AI computing capacity fuelled concerns that the AI infrastructure spending boom could be approaching saturation. Rather than lifting all growth stocks, lower rate expectations triggered a rotation away from semiconductor names and into other parts of the market.
The same pattern is emerging in foreign exchange. Dollar is the week's weakest major currency, but selling has been selective rather than broad-based. Sterling continues to outperform as markets focus on the Bank of England's relatively restrictive policy outlook. Euro remains pressured by rapidly fading expectations of further ECB tightening after softer inflation data. Yen, meanwhile, has developed a story of its own. Reports that Tokyo is shifting toward surprise intervention rather than publicly defending exchange-rate levels have fundamentally changed how traders assess intervention risk.
That message was reinforced on Friday when Finance Minister Satsuki Katayama stressed that Japan's stance "has not changed at all" and that authorities "will respond appropriately at any time as needed." He also highlighted that Tokyo remains in regular contact with Washington on foreign exchange matters despite the US holiday. Whether intervention actually took place this week may ultimately matter less than the shift in strategy itself.
Markets are entering a period where local policy paths, intervention risks and domestic fundamentals drive currency performance. The Dollar remains central to global markets, but it is not the only story.
UK Services PMI Falls to Lowest Since 2023 as Demand Weakens Despite Cooling Cost Pressures
UK Services PMI fell to its lowest level since January 2023 in June as new orders declined for a fourth straight month, although easing cost pressures offered some relief.. Read More.
Eurozone PMI Services Stabilize While Cooling Inflation Supports ECB Pause
Lower oil prices are reshaping the Eurozone outlook. Discover why June's PMI survey points to stabilizing growth and fewer arguments for another ECB rate hike. Read More.
Japan Services PMI Rebounds While Rising Costs Keep Inflation Pressures Alive
Japan's Services PMI rebounded to 52.2 in June, lifting the Composite PMI to a three-month high as domestic demand strengthened despite weaker export business and persistent inflation pressures. Read More.
EUR/USD Daily Outlook
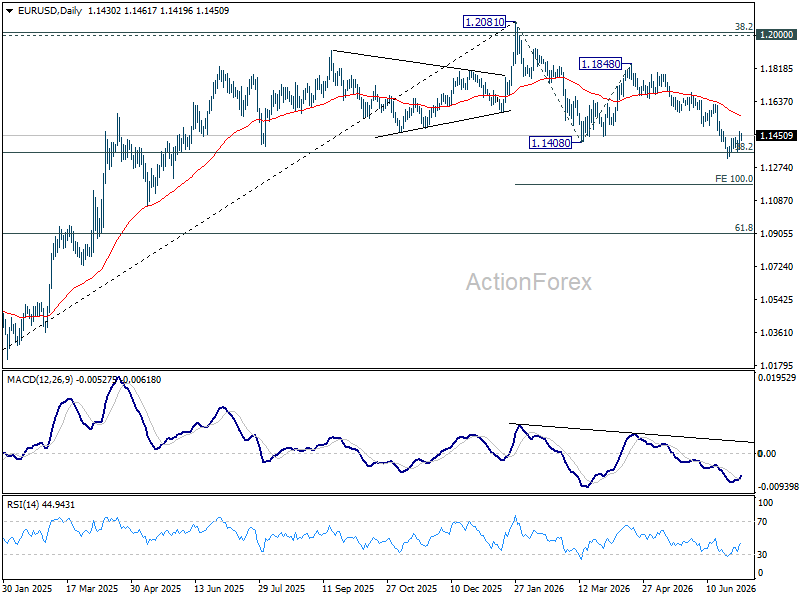
EUR/USD is staying below 1.1499 support turned resistance. Intraday bias remains neutral, and further decline is in favor. On the downside, break of 1.1323 will resume the fall from 1.2081 to 100% projection of 1.2081 to 1.1408 from 1.1848 at 1.1175. However, decisive break of 1.1499 will turn bias back to the upside for 55 D EMA (now at 1.1559) and above.
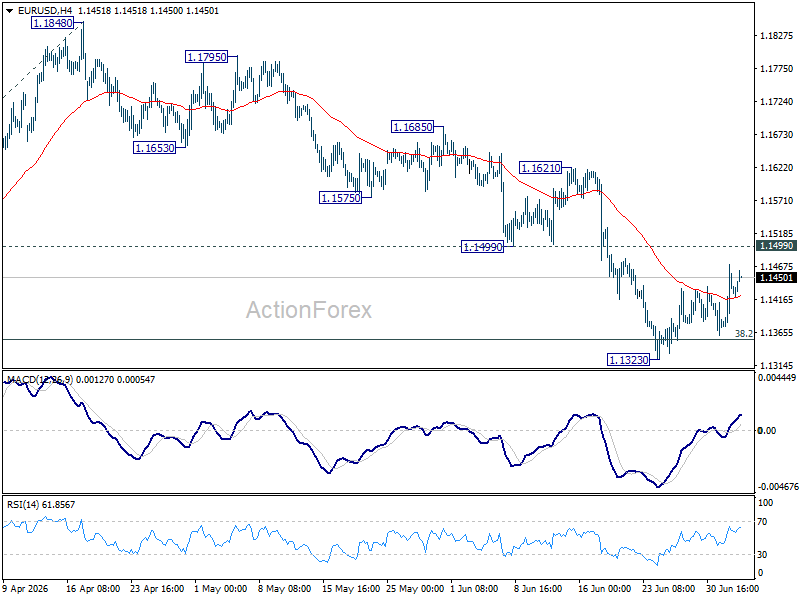
In the bigger picture, focus is back on 38.2% retracement of 1.0176 to 1.2081 at 1.1353. Decisive break there will revive the case of medium term bearish trend reversal after rejection by 1.2 key cluster resistance level. Further fall should be seen to 61.8% retracement at 1.0904. Nevertheless, strong rebound from 1.1353, followed by break of 1.1621 resistance, will retain medium term bullishness.
Gold Rises Sharply as Markets Reassess Fed Rate Outlook
Gold rose to 4,177 USD per troy ounce on Friday, having gained more than 2% in the previous session. The primary driver of the recovery was US labour market data, which came in weaker than expected, prompting investors to scale back expectations for further Federal Reserve interest rate hikes.
In June, the US economy added only 57,000 new jobs, falling well short of the 110,000 forecast – the weakest result in four months. The unemployment rate ticked up to 4.2%. Earlier in the week, the ADP report also pointed to slowing private-sector employment growth.
Following the data release, the probability of a Fed rate hike in September dropped to approximately 50%, down from 67% before the report. Additional support for the market came from comments by Fed Chair Kevin Warsh, who noted easing inflation expectations while reaffirming the regulator's commitment to price stability.
Reduced inflation risks remain a positive factor for gold. The restoration of commercial traffic through the Strait of Hormuz and progress in US–Iran negotiations have contributed to a further decline in oil prices, supporting sentiment towards the precious metals market.
Technical Analysis
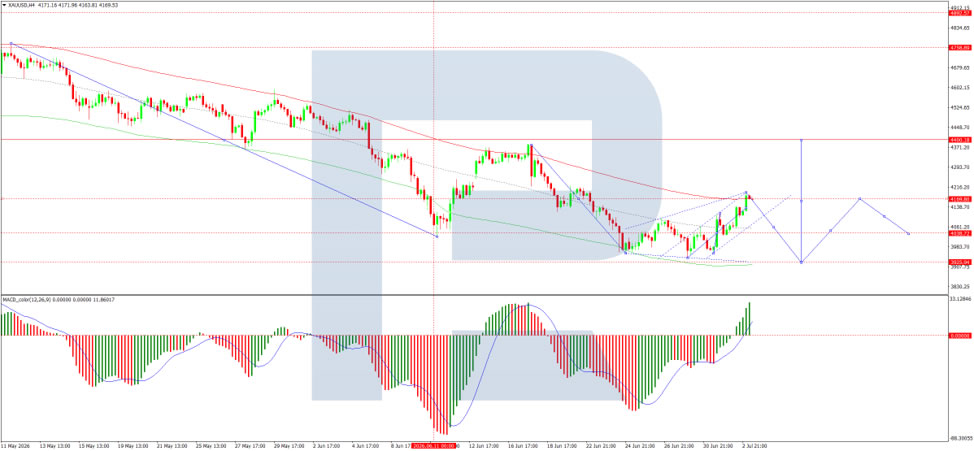
On the H4 XAU/USD chart, the market is trading within a consolidation range around the 4,038 USD level and has advanced to 4,190 USD. A move lower towards 3,929 USD is expected, followed by a potential rise to 4,170 USD, with scope for the trend to extend to 4,400 USD. The MACD indicator signals weakening upward momentum, with its signal line above the centre line but pointing firmly downwards.
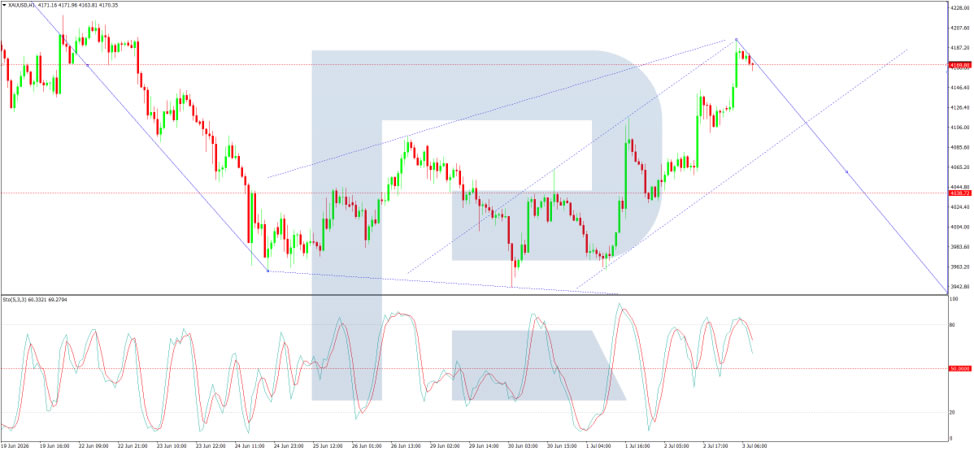
On the H1 chart, the market broke above the 4,141 USD level and moved higher to 4,190 USD. A decline towards 3,929 USD may follow, with a broad consolidation range forming around 4,060 USD. The Stochastic oscillator supports this scenario, with its signal line below 80 and pointing downwards towards 20, indicating increasing short-term downside pressure.
Conclusion
Gold has staged a sharp recovery following weaker-than-expected US labour market data, which significantly reduced expectations for further Fed rate hikes. The economy added just 57,000 jobs in June against a forecast of 110,000, while unemployment rose to 4.2%, reinforcing signs of a cooling labour market. Fed Chair Warsh's comments on easing inflation expectations have further supported the case for a more cautious rate outlook. At the same time, progress in US–Iran negotiations and the reopening of the Strait of Hormuz have helped lower oil prices, improving sentiment towards gold. Technically, gold appears poised for a near-term pullback towards 3,929 USD before potentially resuming its upward trajectory.
EUR/USD Daily Outlook
EUR/USD is staying below 1.1499 support turned resistance. Intraday bias remains neutral, and further decline is in favor. On the downside, break of 1.1323 will resume the fall from 1.2081 to 100% projection of 1.2081 to 1.1408 from 1.1848 at 1.1175. However, decisive break of 1.1499 will turn bias back to the upside for 55 D EMA (now at 1.1559) and above.
In the bigger picture, focus is back on 38.2% retracement of 1.0176 to 1.2081 at 1.1353. Decisive break there will revive the case of medium term bearish trend reversal after rejection by 1.2 key cluster resistance level. Further fall should be seen to 61.8% retracement at 1.0904. Nevertheless, strong rebound from 1.1353, followed by break of 1.1621 resistance, will retain medium term bullishness.
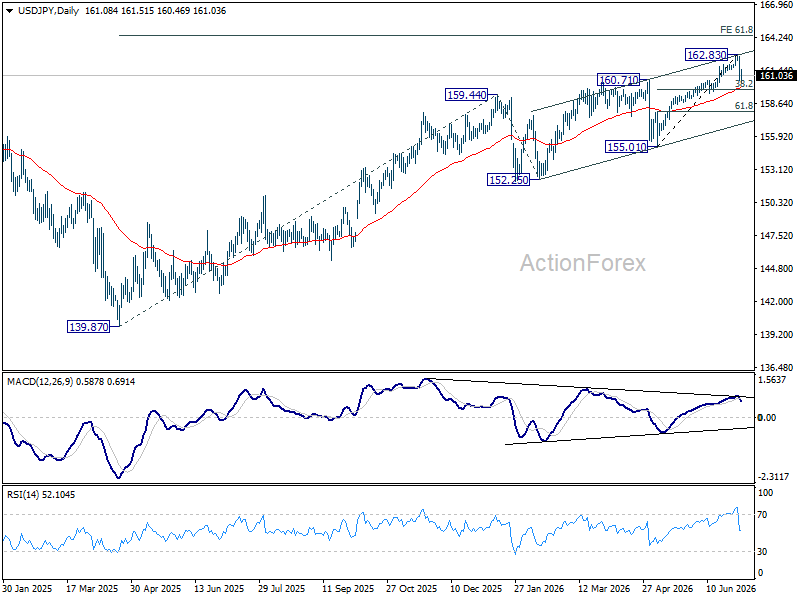
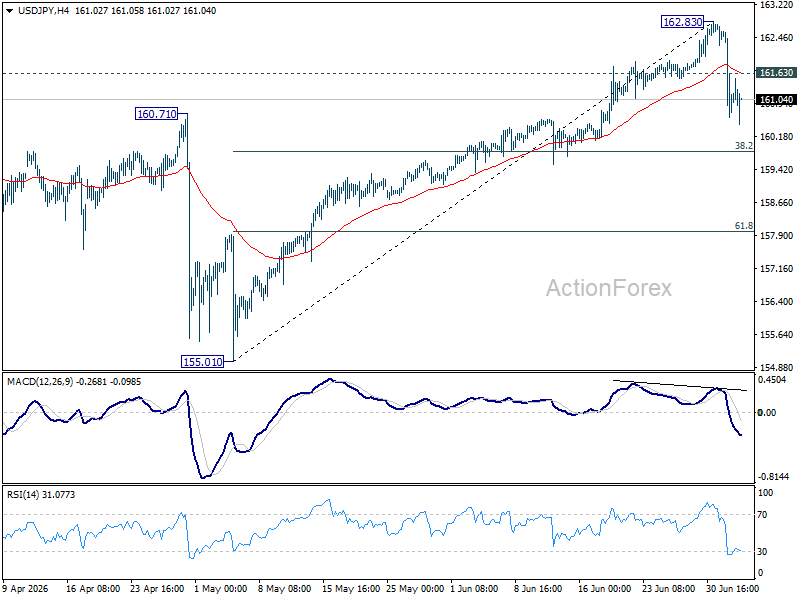
USD/JPY Daily Outlook
Intraday bias in USD/JPY remains mildly on the downside. Pullback from 162.83 short term top would extend to 38.2% retracement of 155.01 to 162.83 at 159.84. Since this level is close to 55 D EMA (now at 159.95), strong support should be seen from there to bring rebound. On the upside, above 161.63 minor resistance will turn intraday bias neutral. Overall, consolidations should continue below 162.83 for a while.
In the bigger picture, rise from 139.87 (2025 low) is seen as another rising leg of the long term up trend. Next target is 61.8% projection of 139.87 to 159.44 from 152.25 at 164.34. For now, outlook will remain bullish as long as 155.01 support holds, even in case of deep pullback.