
Sample Category Title
EUR/GBP Daily Outlook
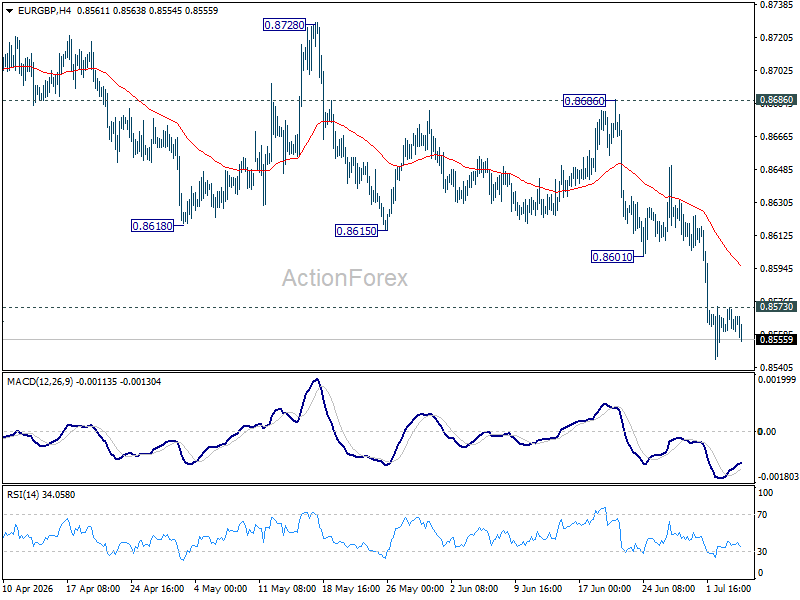
Intraday bias in EUR/GBP remains mildly on the downside for 61.8% retracement of 0.8221 to 0.8863 at 0.8466. On the upside, above 0.8573 minor resistance will turn bias neutral first. But risk will stay on the downside as long as 0.8686 resistance holds, in case of recovery.
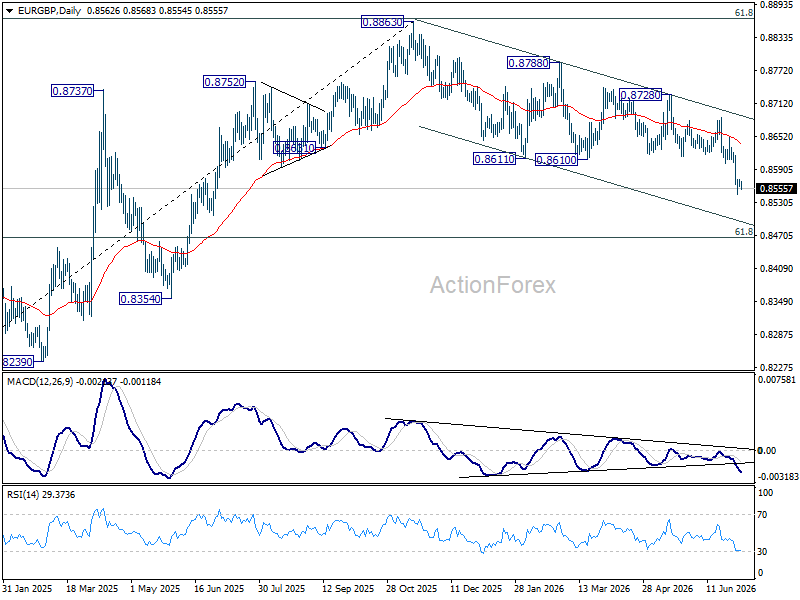
In the bigger picture, current development suggests that rise from 0.8221 (2024 low) has completed at 0.8863, just ahead of 38.2% retracement of 0.8221 (2024 low) to 0.8863 (2025 high) at 0.8618. Deeper fall would be seen back to 0.8201 (2022 low). For now, outlook will be neutral at best as long as 0.8863 hold.
EUR/AUD Daily Outlook
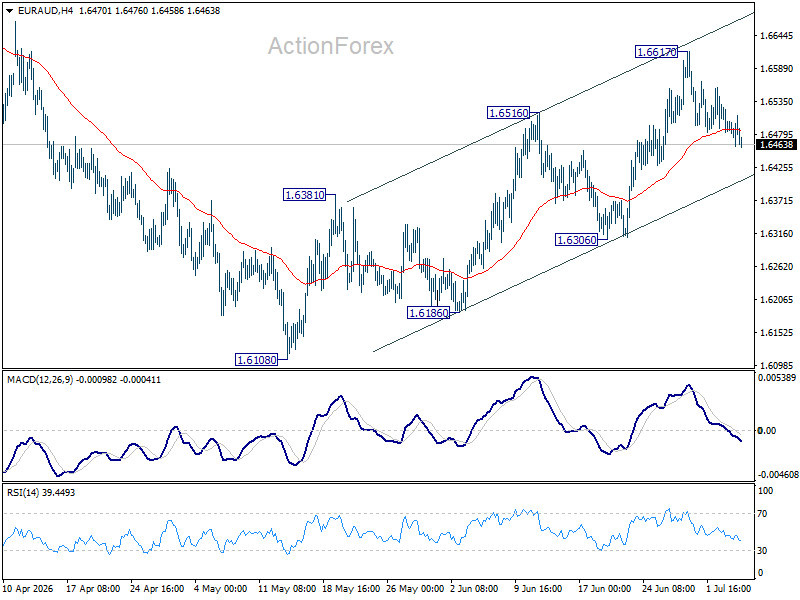
Intraday bias in EUR/AUD remains neutral as consolidations continues below 1.6617. Further rise is in favor as long as 1.6306 support holds. Above 1.6617 will extend the rebound from 1.6108 towards 1.6842 key structural resistance. However, firm break of 1.6306 will turn bias back to the downside for retesting 1.6108.
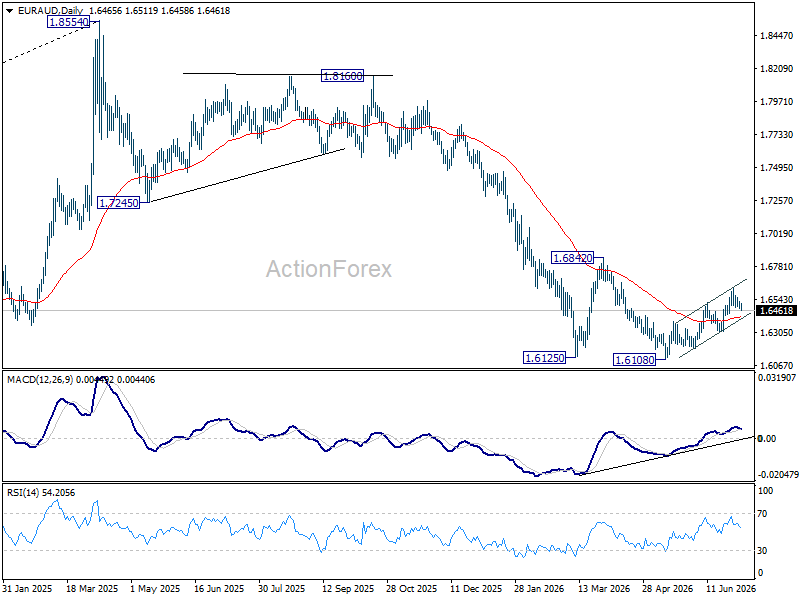
In the bigger picture, outlook will stay bearish as long as 1.6842 resistance holds. Fall from 1.8554 (2025 high) is expected to continue to 61.8% retracement of 1.4281 to 1.8554 at 1.5913. Decisive break there will pave the way back to 1.4281 (2022 low). However, firm break of 1.6842 should confirm medium term bottoming, and bring stronger rally.
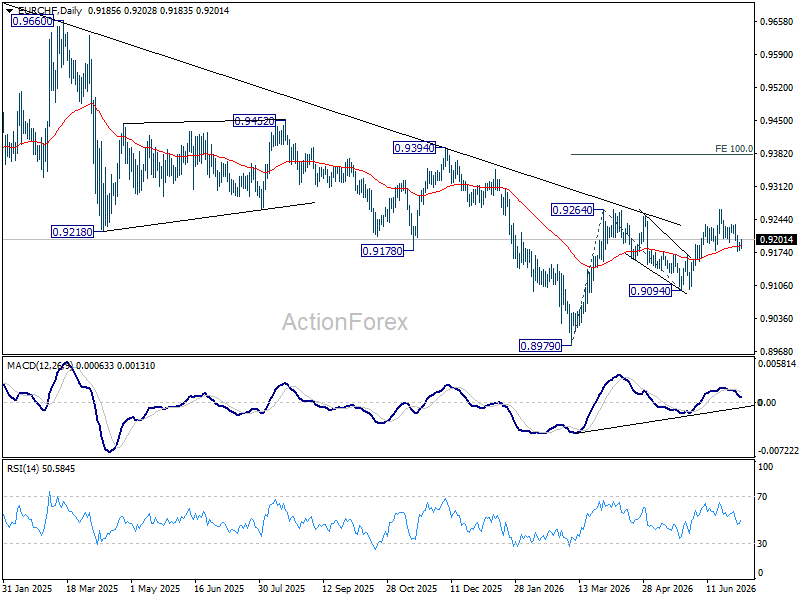
EUR/CHF Daily Outlook
EUR/CHF recovered after drawing support from 0.9179. Intraday bias remains neutral first. With 0.9179 intact, further rise remains in favor. On the upside,a above 0.9234 will bring retest of 0.9265 resistance first. Firm break there will resume the rally from 0.8979 to 100% projection of 0.8979 to 0.9264 from 0.9094 at 0.9379. However, decisive break of 0.9179 will dampen this bullish view, and bring deeper fall back to 0.9094 support.
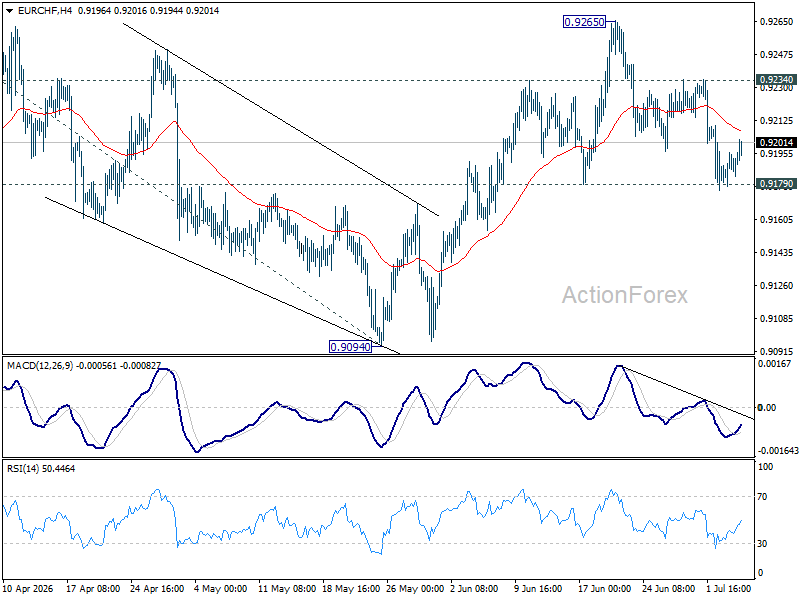
In the bigger picture, the break of medium term falling trend line resistance indicates that 0.8979 is already a medium term bottom. Considering bullish convergence condition in W MACD, rise from there should at least be reversing the fall from 0.9928, with prospect of developing into a medium term up trend. Firm break of 0.9394 resistance will add more credence to this case. For now risk will remain on the upside as long as 0.9094 support holds, in case of retreat.
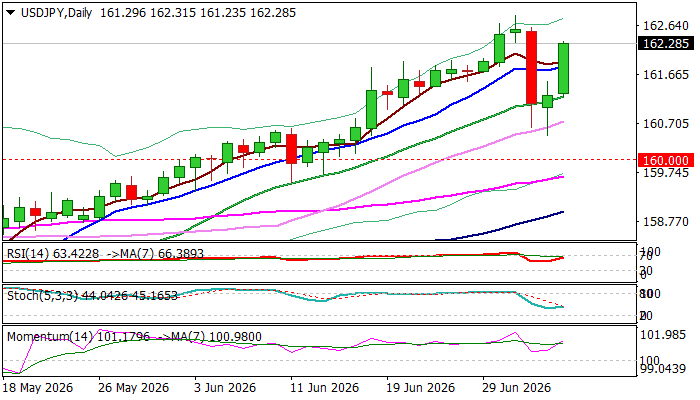
USDJPY – Bulls Regain Control After Limited Correction, Eye Multi-Decade Peak
Strong rise in early Monday trading is about to fully reverse last week’s 162.84/160.47 pullback, which marked a healthy correction (contained by Fibo 23.6% of 155.02/162.84 upleg) of larger uptrend.
Completion of reversal pattern on daily chart confirms scenario as traders entered fresh longs at better levels, encouraged by absence of real action from Japan’s authorities, although they kept expressing their readiness to intervene, almost daily.
The latest correction has improved technical picture, as daily studies returned to full bullish setup and opened space for fresh advance and possible retest of multi-decade peak at 162.84, hit last week and possible extension into the zone, last traded in 1986.
However, traders remain cautious on persisting intervention threats and await release of FOMC minutes (due on Wednesday) for more details about Fed’s stance on interest rates, following recent dovish steer from Fed Chair, as well as waning rate hike bets (especially after soft NFP) that may further overshadow bets for September rate hike.
Res: 162.84; 163.57; 164.24; 164.50
Sup: 161.83; 161.24; 161.00; 160.47
The Pound: Politics Comes to the Rescue
- The stabilisation of the political situation in Britain is driving the GBPUSD rally.
- Traders are wondering: Were there currency interventions in Japan? Or is fear to blame?
The US dollar managed to recover towards the end of its worst week since April, as US equity markets closed ahead of Independence Day. Investors continue to reassess the likelihood of the Fed tightening monetary policy and are preparing to analyse the minutes of the June FOMC meeting. It will be more difficult to identify divisions within the Committee this time round due to the document’s reduced length. Concision is Kevin Warsh’s hallmark.
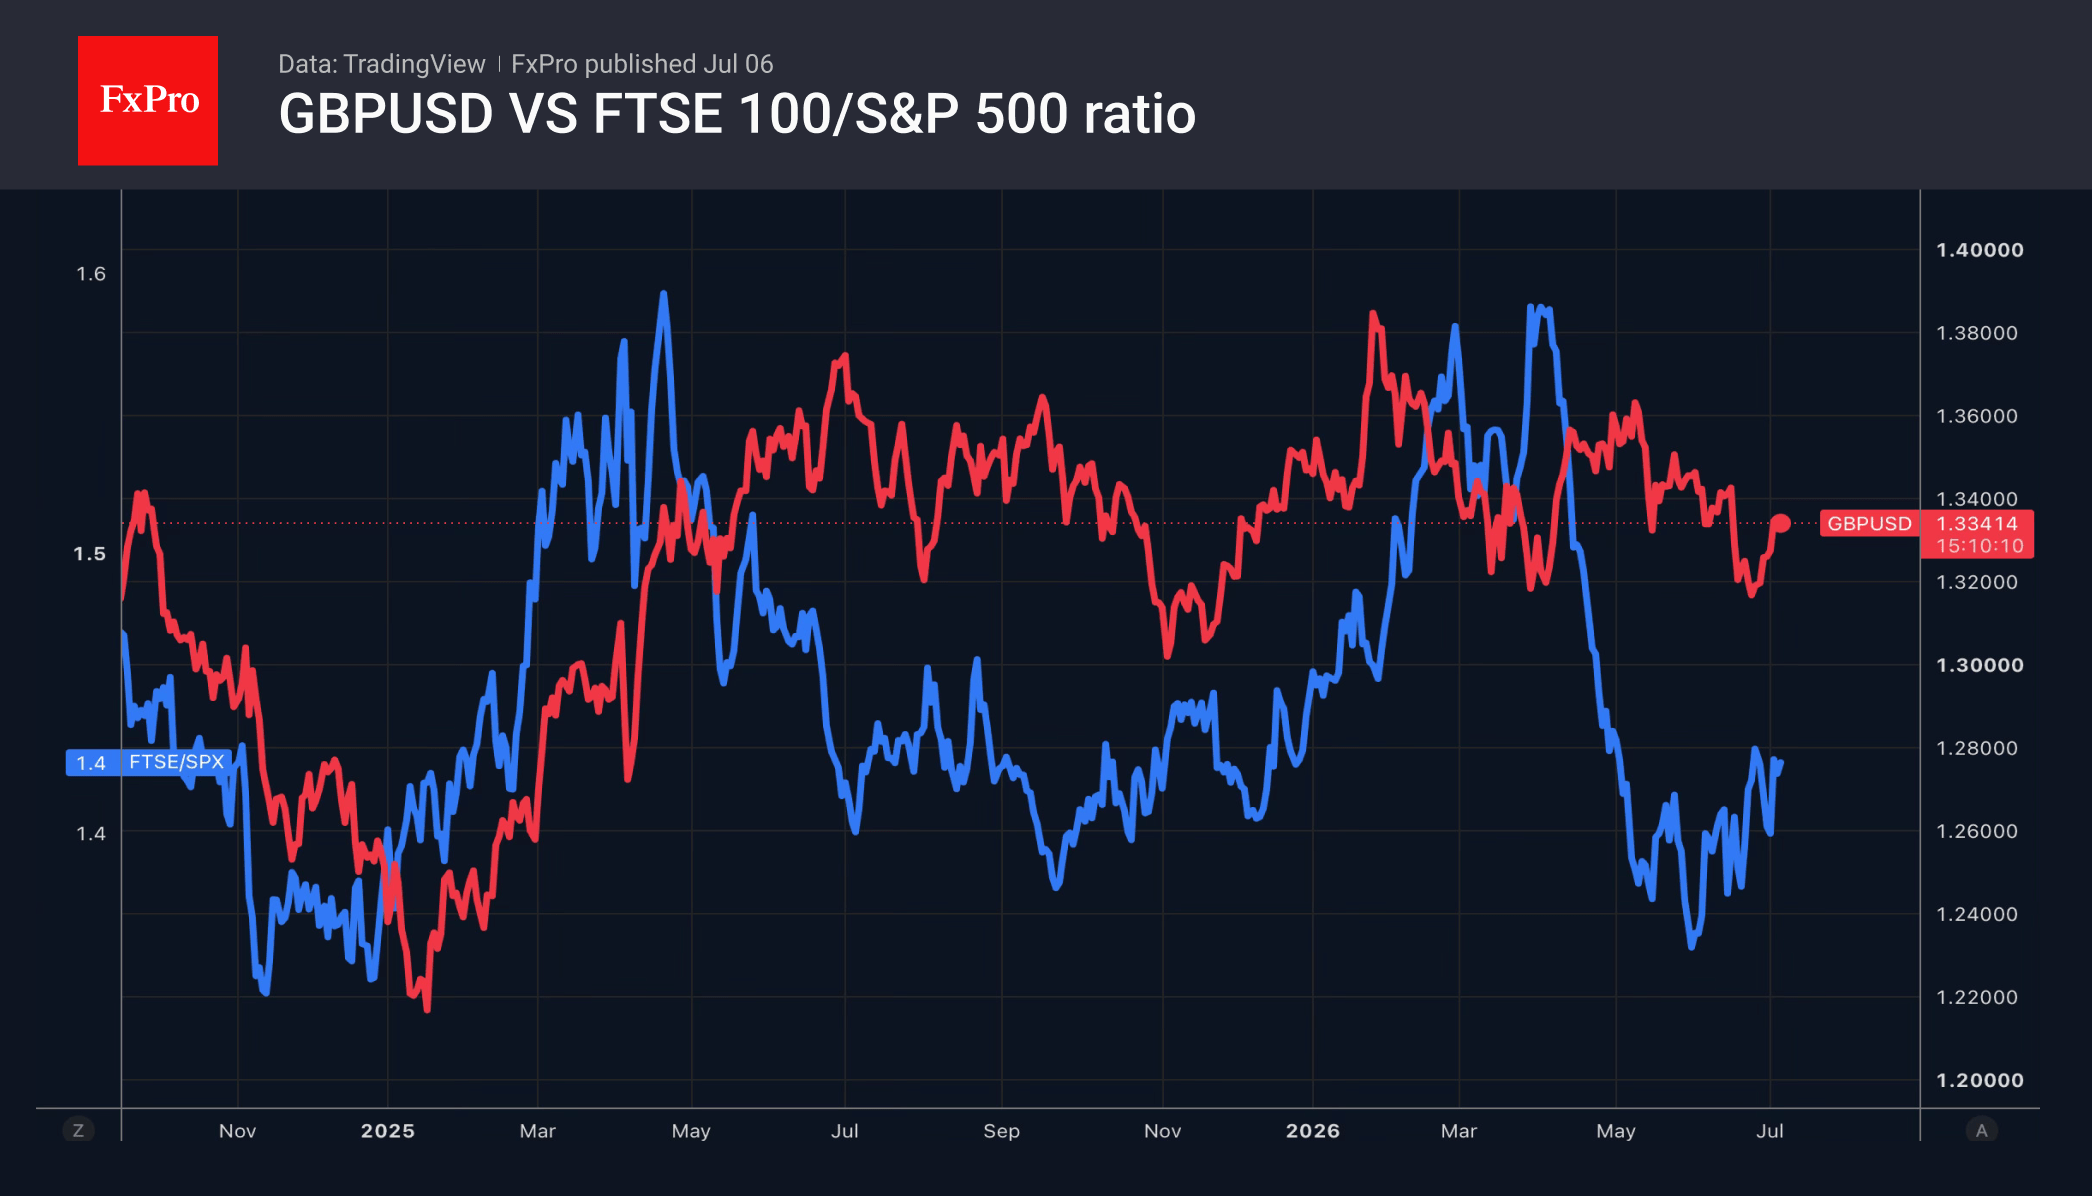
The greenback’s retreat has given other currencies a chance to shine. The pound has posted its best performance in the last 12 weeks against the backdrop of a stabilising political situation in Britain. In the run-up to his appointment, the incoming Prime Minister, Andy Burnham, is set to adhere to existing fiscal requirements, which reduces the risk premium demanded by investors and boosts demand for domestic assets.
The yen has strengthened at its fastest pace since the currency interventions at the turn of April and May. This has led traders to wonder whether Japan intervened or if speculators were so frightened that they began unwinding their long positions in USDJPY themselves. These positions had reached their highest level since 2017. In such conditions, the triggering of stop-loss orders turns the pair’s decline into an avalanche.
Goldman Sachs has raised its USDJPY forecast from 155 to 165 by mid-2027. The bank believes that the Bank of Japan’s reluctance to tighten monetary policy, high Fed rates and Treasury yields, and the active use of the yen in carry trades will contribute to further weakness in the yen. The 3-month and 6-month forecasts stand at 162 and 163, respectively. US interest rate markets are pricing in a 72% chance that the US dollar will trade at ¥165 by mid next year.
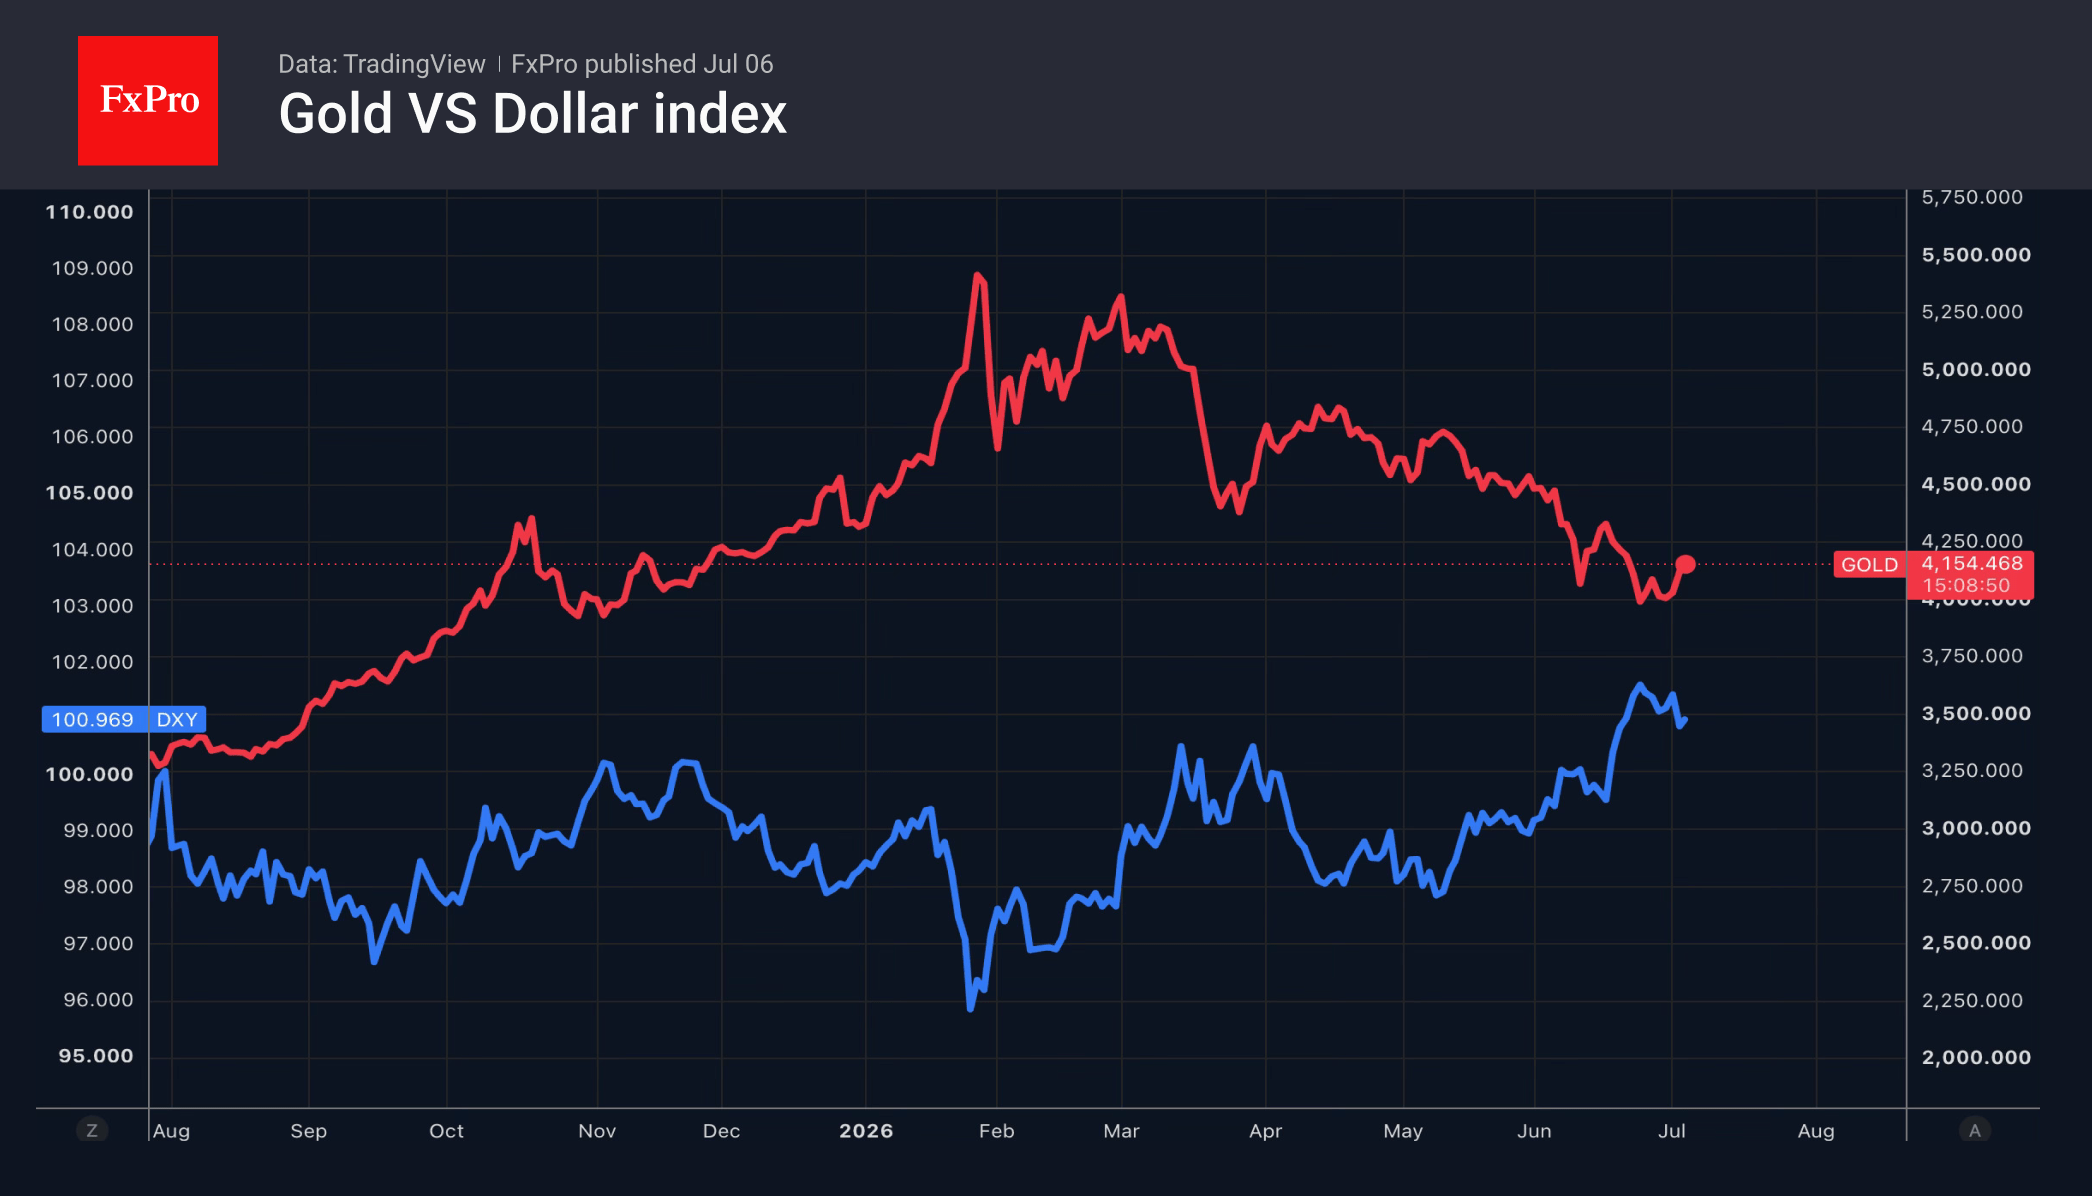
The fall in the USD index and Treasury yields has shifted the balance of power in the gold market. The precious metal briefly returned above $4,200 per ounce but was unable to hold. Bloomberg’s updated forecast suggests that central banks will keep interest rates at high levels for longer than expected due to the delayed impact of the conflict in the Middle East on inflation. Under these circumstances, it will be difficult for Gold to return to the record highs seen at the start of the year.
The FxPro Analyst Team
EUR/USD in a Narrow Range: Focus on Fed Minutes
EUR/USD is trading around 1.1432 on Monday. At the end of last week, the main currency pair posted modest gains. Weaker-than-expected US labour market data and lower oil prices have weighed on the US dollar, prompting investors to reconsider expectations for further Federal Reserve policy tightening.
The Non-Farm Payrolls report released last week showed that the US economy added only 57,000 new jobs in June, falling well short of the 110,000 forecast – the weakest result in four months. This outcome has reduced the likelihood of a Fed rate hike as early as September.
An additional factor weighing on the dollar was the decline in oil prices. The restoration of supplies through the Strait of Hormuz, along with expectations of increased OPEC+ production, has raised concerns about a potential global oversupply. This dynamic is helping to reduce inflation risks and the need for further rate increases.
The market's focus this week is on the release of the June Federal Reserve meeting minutes. Investors are hoping for additional signals on the future trajectory of US monetary policy and the outlook for interest rates.
Technical Analysis
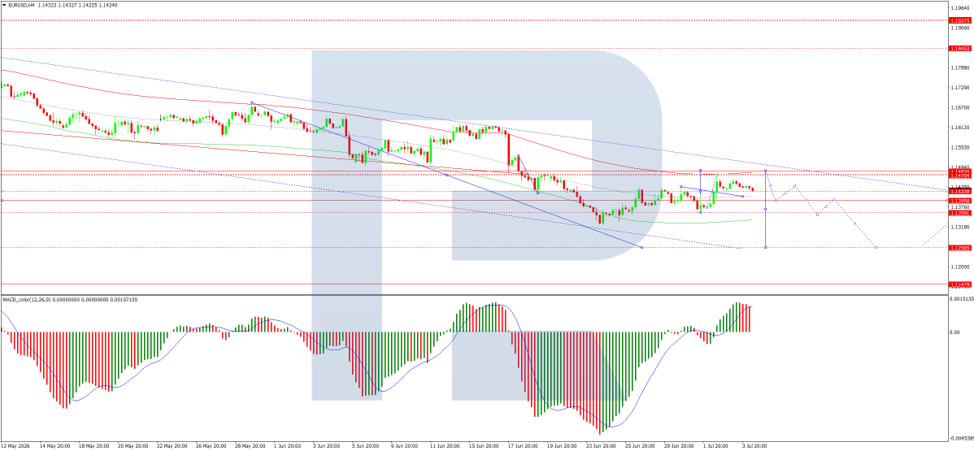
On the H4 chart of EUR/USD, the pair is trading within a consolidation range around 1.1422, currently extending between 1.1422 and 1.1470. An upside breakout from this range would suggest a corrective move towards 1.1480, followed by a decline to 1.1260. A downside breakout would open the way for a direct move to 1.1260. The MACD indicator supports this scenario, with its signal line above zero but pointing firmly downwards, reflecting continued bearish momentum.
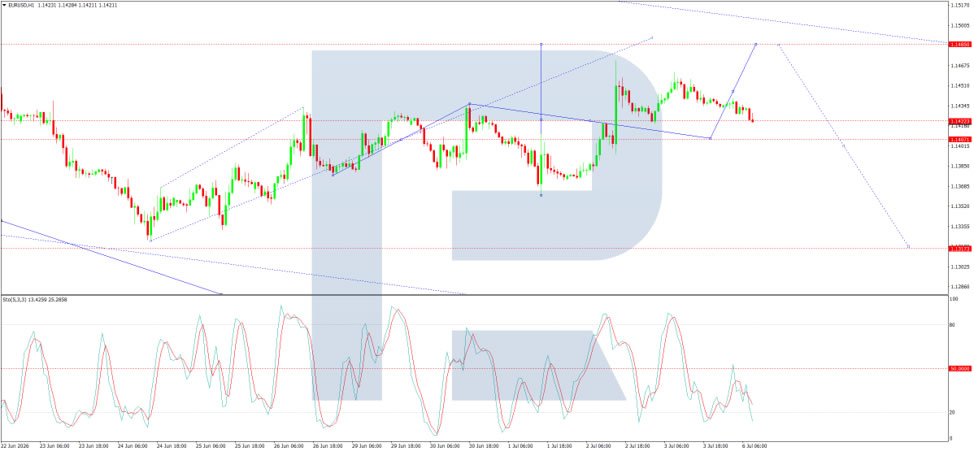
On the H1 chart, EUR/USD has reached 1.1470 and is now forming a consolidation range below this level. A range expansion down to 1.1408 and up to 1.1480 is expected, followed by a decline to 1.1260. The Stochastic oscillator confirms this scenario, with its signal line at 50 and pointing downwards towards 20.
Conclusion
EUR/USD remains in a narrow range as markets await fresh catalysts, with focus turning to the release of the Fed minutes later this week. Last week's weaker-than-expected US jobs data and falling oil prices have eased pressure on the euro, reducing the likelihood of a September rate hike. The restoration of Hormuz shipments and potential OPEC+ supply increases have further dampened inflation concerns. However, the broader technical picture remains bearish, with indicators pointing towards a potential decline to 1.1260 in the medium term. The Fed minutes will be closely scrutinised for any shifts in the policy outlook that could determine the pair's next directional move.
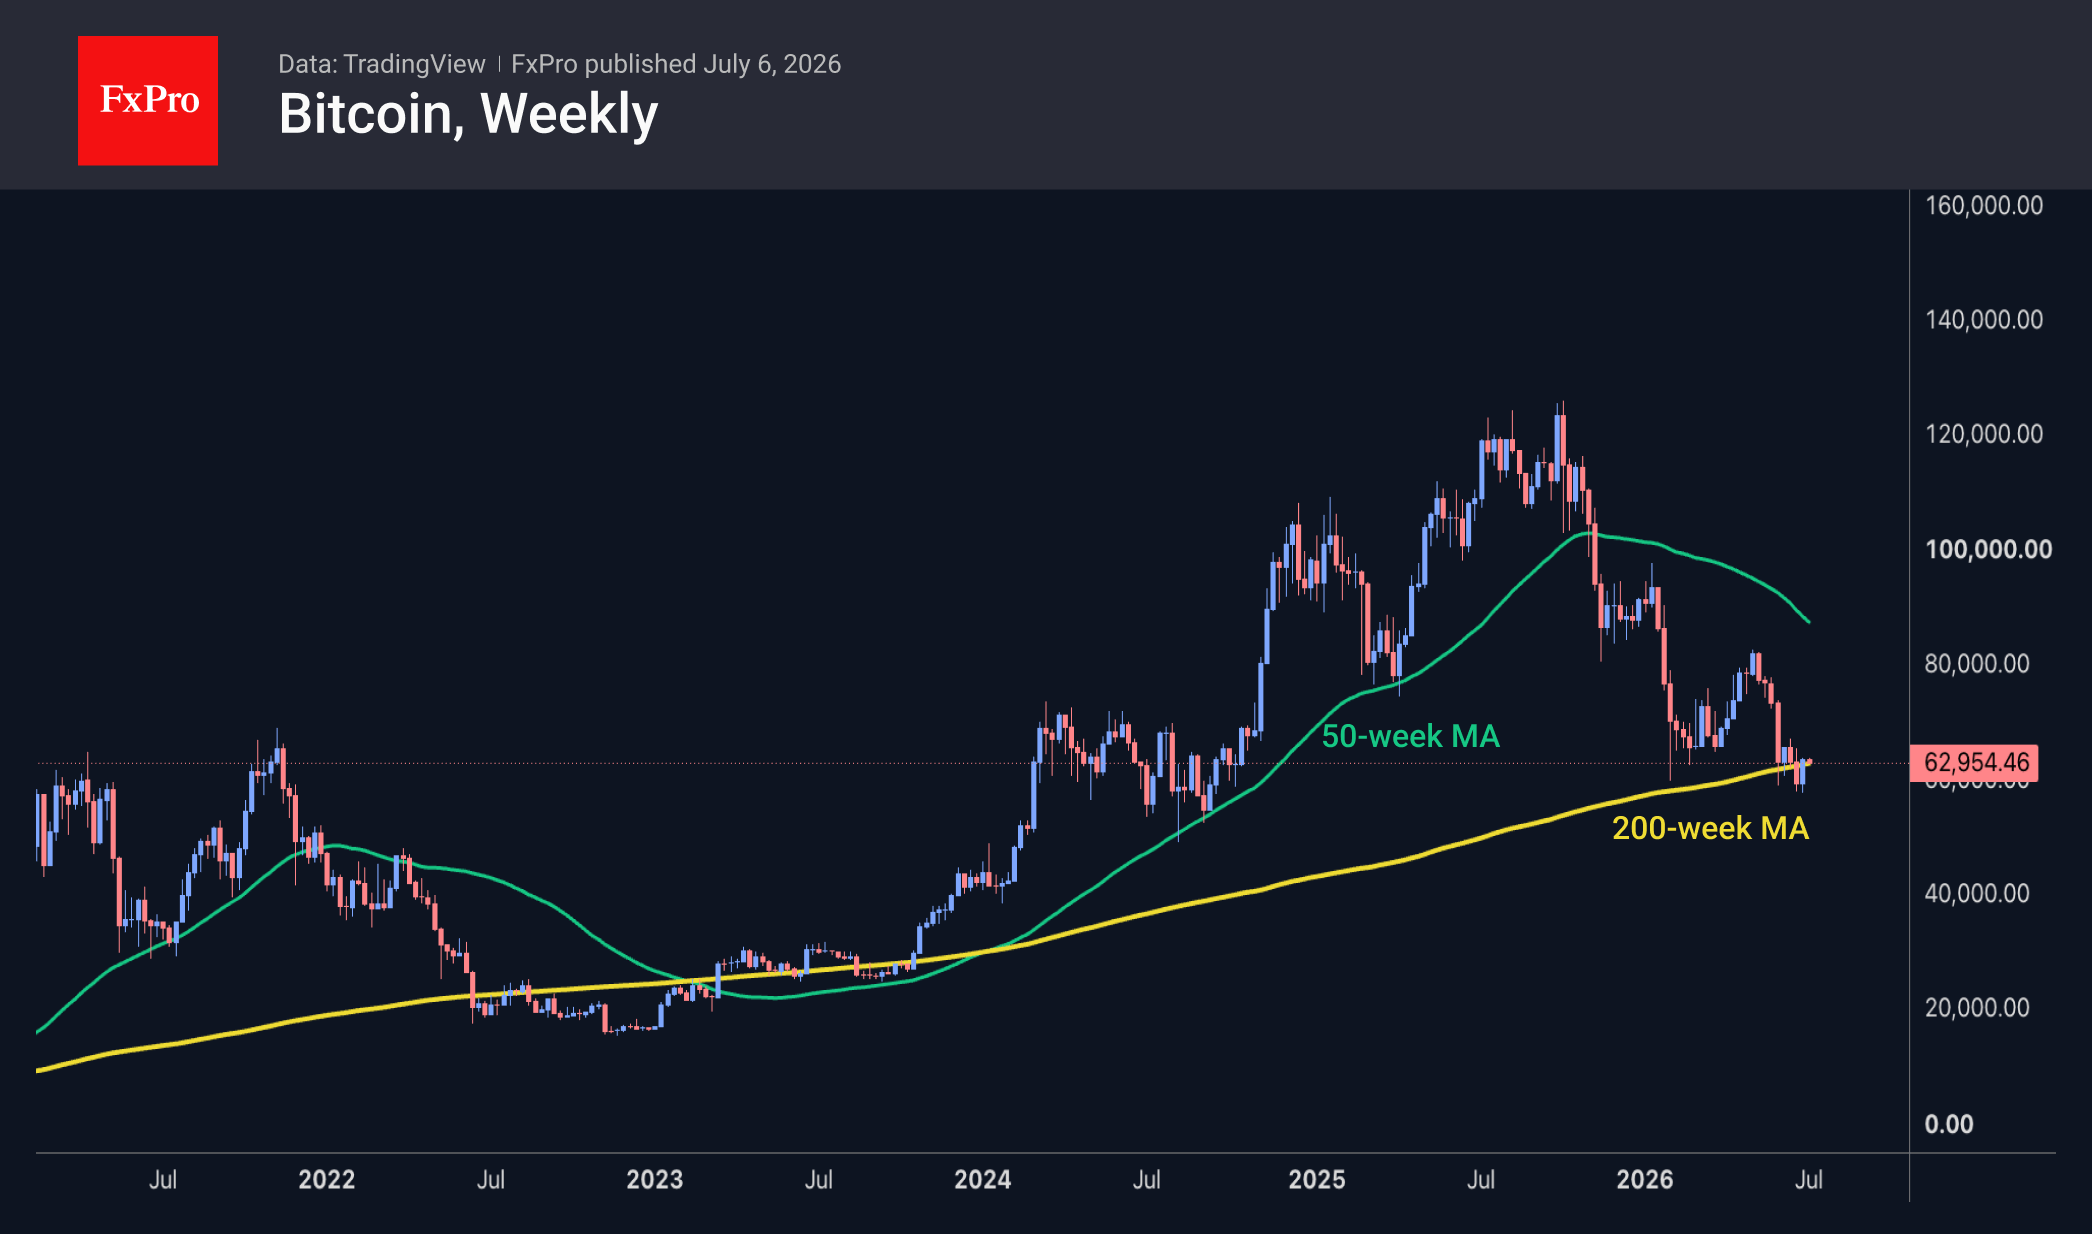
Bitcoin Returns to $63K: Eight Weeks of Outflows from ETFs Are Weighing on
Market Overview
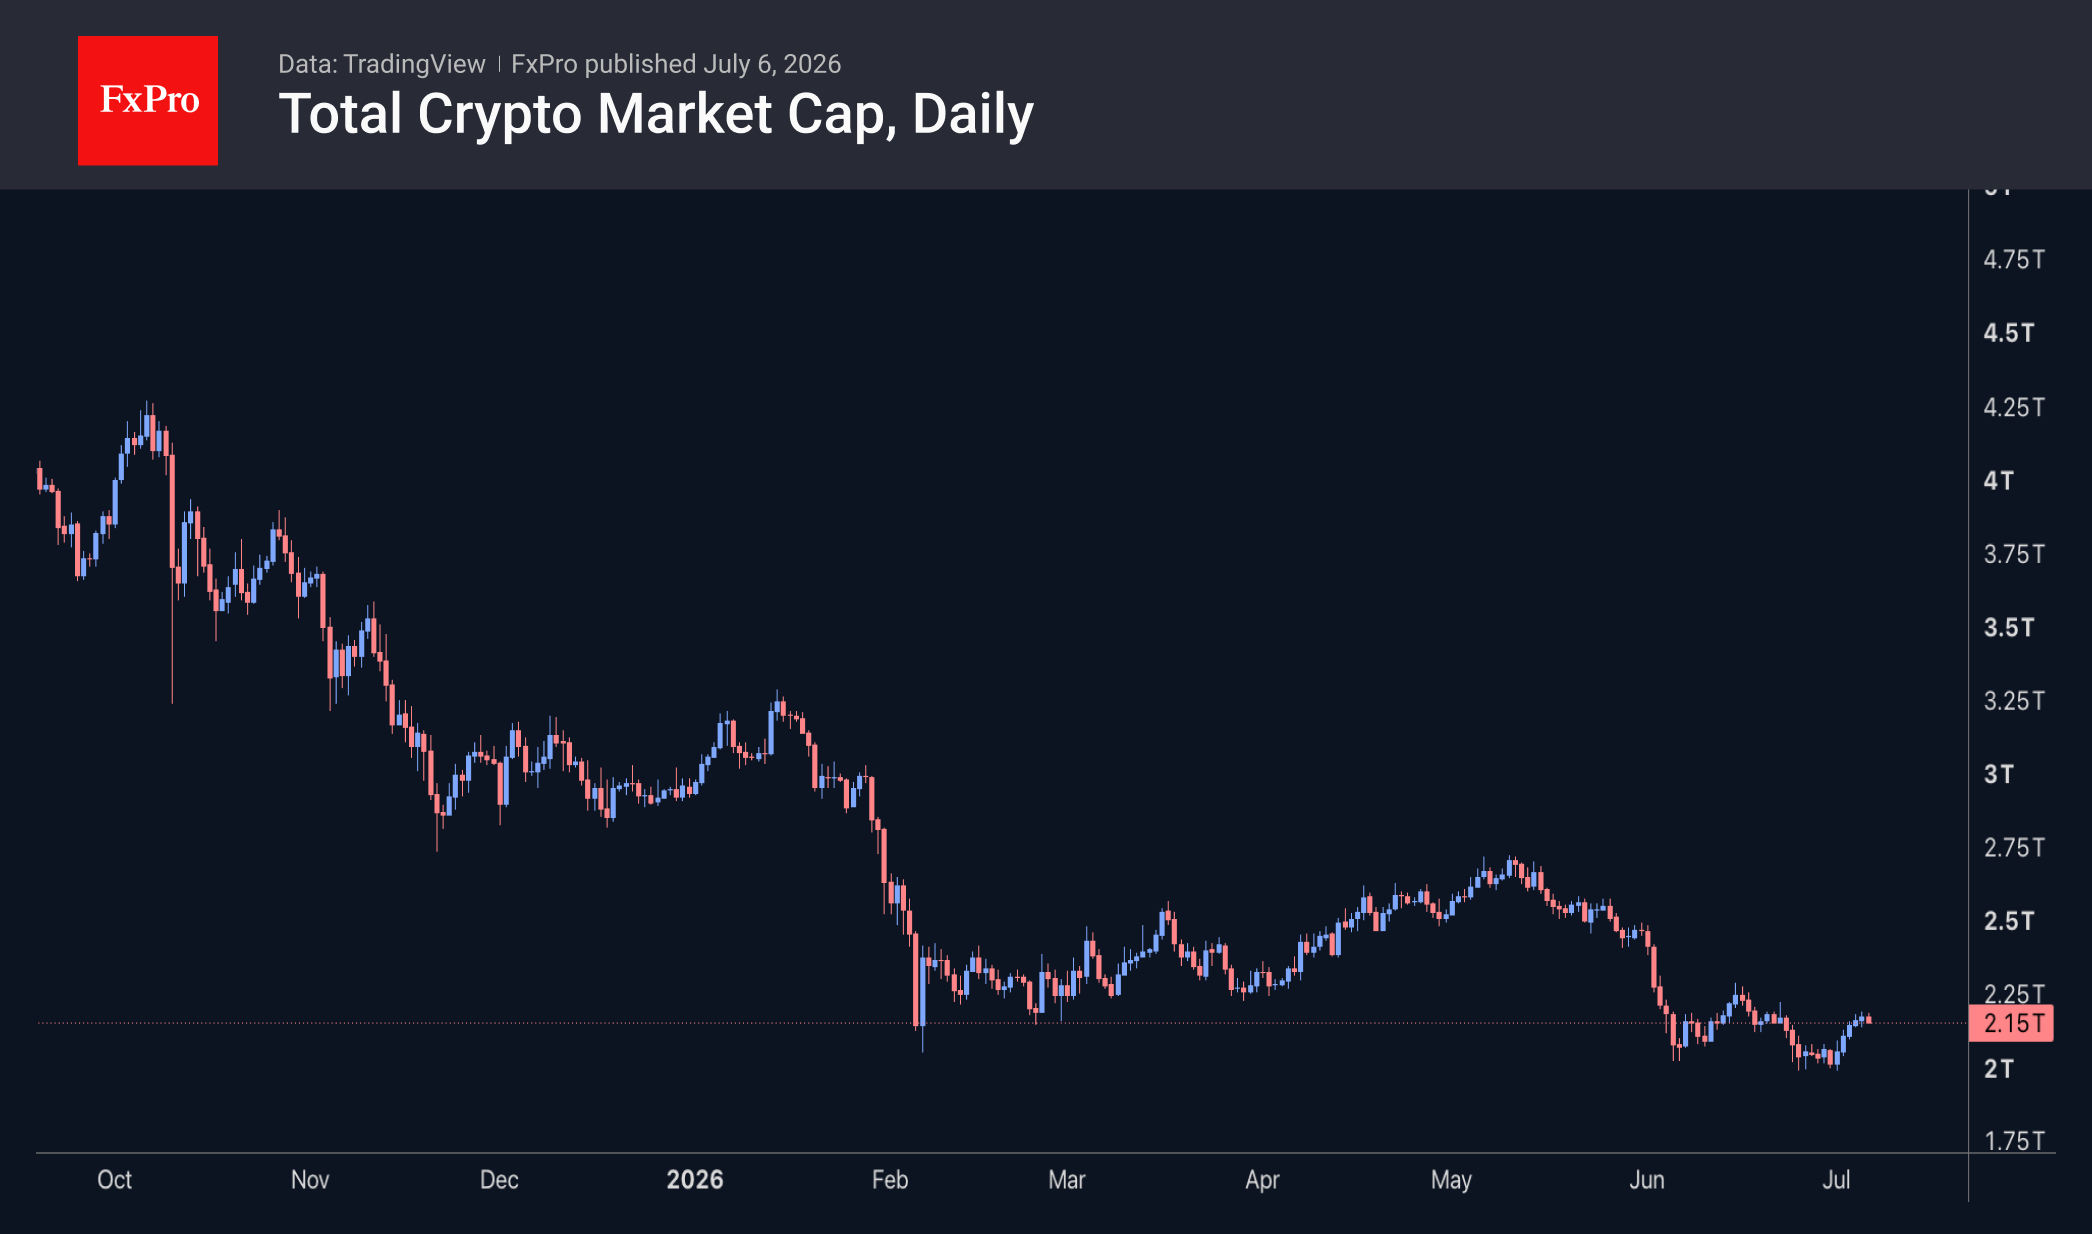
The crypto market capitalisation rose to $2.21T at the start of trading on Monday, but soon corrected to $2.18T, while still up by over 5% from the previous week’s levels. Despite the positive momentum, the situation remains within the bounds of a corrective rebound, having failed to climb even above the region of previous local highs at $2.27T. Without consolidating above this level, the market remains in a downtrend characterised by a sequence of lower highs and lower lows.
The sentiment index has been rising by 1 point per day since 3 July, reaching 24 by the start of 6 July. Remaining in the ‘extreme fear’ zone, the index is now at its highest level in over a month, clearly reflecting the gloomy sentiment.
Bitcoin closed last week near $63K, having recovered to the 200-week moving average, a key historical support level. At its peak on Sunday, the price approached $64K. However, by Monday, the bulls had run out of steam, and the market came under selling pressure once again, pushing the price back by about $1K.
News Background
According to SoSoValue, net outflows from spot BTC ETFs totalled $526.6 million over the shortened week. The negative trend has continued for eight consecutive weeks. Net outflows from ETH-ETFs amounted to a modest $13.7 million for the week.
The volume of deposits in Bitcoin and altcoins on exchanges has risen sharply, which historically signals periods of heightened volatility in the crypto market, CryptoQuant warns. A similar surge was observed before BTC’s decline from $82K in early May to levels below $58K by the end of June.
The current situation in Bitcoin is similar to that of 2022, according to an analyst at Rekt Capital, who expects BTC’s decline to continue. In past crypto cycles, the market bottom was reached approximately one year after the last peak.
The launch of Strategy’s Bitcoin reserve sell-off mechanism has created an “avoidable two-way risk” for the market, according to JPMorgan. The very possibility of such trades increases uncertainty and volatility.
Japanese financial conglomerate SBI has announced the closure of its mining pool. The SBI Crypto platform, which accounts for 2 per cent of the Bitcoin network’s hash rate, will cease operations on 31 July.
Ethereum co-founder Vitalik Buterin outlined the project’s key development areas as part of the Lean Ethereum concept. The focus is on quantum resilience, privacy, scalability and the restructuring of key protocol elements.
The FxPro Analyst Team
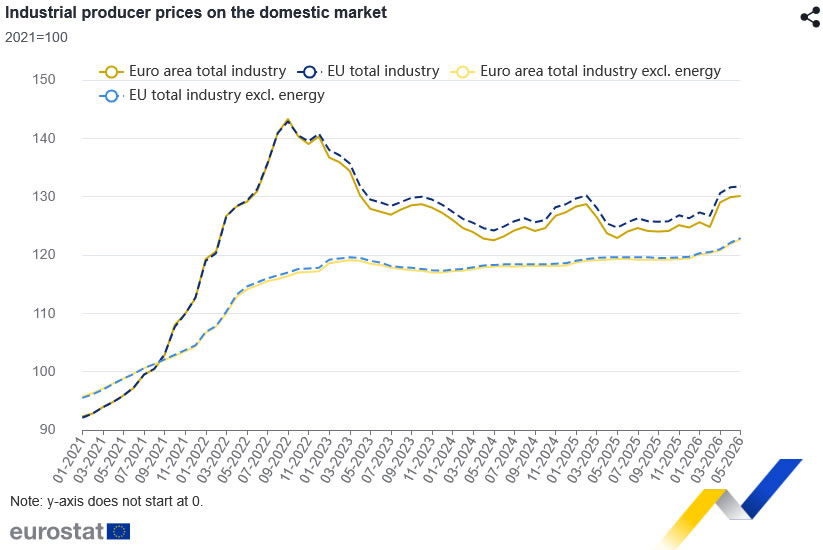
Eurozone Producer Inflation Holds Firm as Core Factory Prices Continue to Rise
Eurozone PPI rose 0.2% mom in May, matching market expectations, while annual producer inflation accelerated from 5.0% yoy to 5.9% yoy, slightly above the 5.7% yoy consensus. The data suggest producer price pressures remained elevated even as monthly price growth moderated from April's 0.7% increase.
The monthly increase reflected diverging trends across sectors. Prices for intermediate goods rose 1.4% mom, providing the strongest upward contribution, while capital goods and durable consumer goods increased 0.2% mom and 0.3% mom, respectively. These gains were partly offset by a -1.0% mom decline in energy prices and a -0.1% mom fall in non-durable consumer goods. Excluding energy, industrial producer prices rose a solid 0.7% mom, pointing to continued underlying pipeline inflation.
Across the broader EU, producer prices also increased 0.2% mom and 5.7% yoy. Cyprus, Ireland and the Netherlands recorded the largest monthly increases, while Croatia, Hungary and Italy posted the biggest declines. On an annual basis, Bulgaria, Romania and Lithuania saw the strongest producer price growth, with Luxembourg the only member state to record a year-on-year decline.
Eurozone Producer Price Index (PPI) — May 2026
| Indicator | Previous | Latest | Expectation |
|---|---|---|---|
| PPI (MoM) | 0.7% | 0.2% | 0.2% |
| PPI (YoY) | 5.0% | 5.9% | 5.7% |
Eurozone PPI Breakdown (Month-on-Month)
| Category | Monthly Change |
|---|---|
| Intermediate Goods | 1.4% |
| Capital Goods | 0.2% |
| Durable Consumer Goods | 0.3% |
| Non-durable Consumer Goods | -0.1% |
| Energy | -1.0% |
| PPI Excluding Energy | 0.7% |
Eurozone PPI Breakdown (Year-on-Year)
| Category | Annual Change |
|---|---|
| Energy | 14.0% |
| Intermediate Goods | 5.5% |
| Durable Consumer Goods | 2.8% |
| PPI Excluding Energy | 2.8% |
| Capital Goods | 2.2% |
| Non-durable Consumer Goods | -0.5% |
EU Member States
| Largest Monthly Increases | MoM | Largest Monthly Declines | MoM |
|---|---|---|---|
| Cyprus | 3.6% | Croatia | -2.1% |
| Ireland | 2.8% | Hungary | -1.3% |
| Netherlands | 1.9% | Italy | -0.5% |
| Highest Annual Increases | YoY | Annual Decline | YoY |
|---|---|---|---|
| Bulgaria | 19.3% | Luxembourg | -3.2% |
| Romania | 13.5% | ||
| Lithuania | 12.3% |
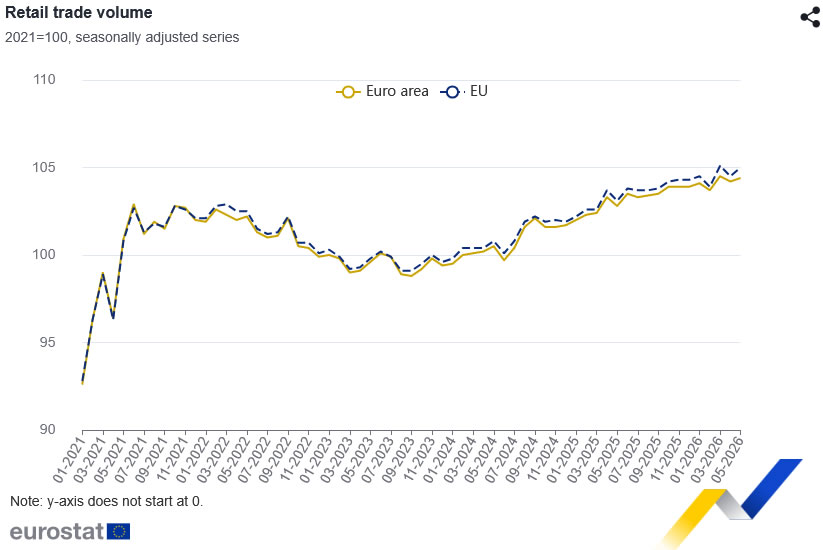
Eurozone Retail Sales Rise 0.2% mom in May as Food Spending Leads Growth
Eurozone retail sales rose 0.2% mom in May, matching market expectations and pointing to continued resilience in consumer spending despite a mixed performance across retail categories. Across the broader EU, retail sales increased a stronger 0.5% mom, suggesting consumer demand remained relatively firm in several member states.
The monthly increase in the Eurozone was driven primarily by food, drinks and tobacco sales, which rose 0.6% mom. Sales of non-food products, excluding automotive fuel, also edged up 0.1% mom. However, purchases of automotive fuel fell -.5% mom, partially offsetting gains elsewhere.
Among EU member states, Cyprus recorded the strongest monthly increase in retail trade at 3.7%, followed by Luxembourg at 3.6% and Poland at 2.4%. In contrast, Estonia posted the largest decline at -2.2%, ahead of Croatia at -2.0%, while Belgium and Lithuania both recorded falls of -0.7%.
| Indicator | Latest | Market Expectation |
|---|---|---|
| Retail Sales (MoM) | 0.2% | 0.2% |
| EU Retail Sales (MoM) | 0.5% | N/A |
Retail Sales Breakdown (Eurozone)
| Eurozone Category | Monthly Change |
|---|---|
| Food, Drinks & Tobacco | 0.6% |
| Non-food Products (ex. Automotive Fuel) | 0.1% |
| Automotive Fuel | -0.5% |
Best & Worst Performing EU Member States
| Strongest Growth | MoM | Largest Declines | MoM |
|---|---|---|---|
| Cyprus | 3.7% | Estonia | -2.2% |
| Luxembourg | 3.6% | Croatia | -2.0% |
| Poland | 2.4% | Belgium | -0.7% |
| Lithuania | -0.7% |
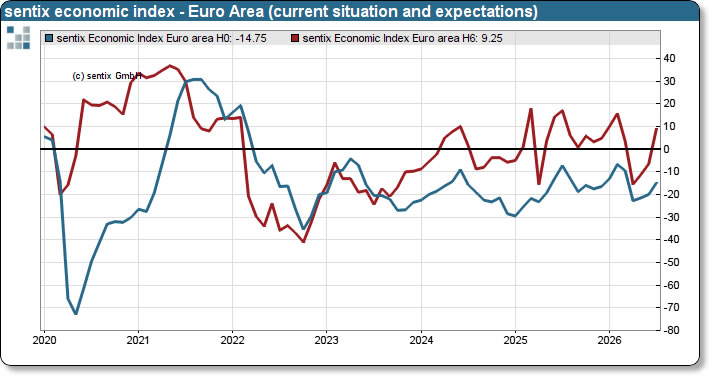
Eurozone Sentix Investor Confidence Surges to -3.1 as Germany’s Recovery Gains Traction
Eurozone investor confidence improved sharply in July, with the Sentix Investor Confidence Index rising from -13.4 to -3.1, marking a third consecutive monthly gain. The improvement was broad-based, with the Current Situation Index climbing from -20.0 to -14.8, while the Expectations Index jumped from -6.5 to 9.3, returning to positive territory as optimism over the region's economic outlook continued to build.
According to Sentix, the recovery is increasingly being driven by Germany, where recently announced policy measures have helped restore investor confidence after months of weak sentiment. While assessments of current conditions remain subdued, expectations improved markedly and turned positive for the first time since March, suggesting investors are becoming more confident that Germany is joining the broader global recovery already underway.
The survey also pointed to easing inflation concerns as falling oil prices following the de-escalation of the Iran conflict reduced pressure on prices. Sentix's inflation barometer improved sharply from -38.0 to -13.75, while its central bank policy gauge also strengthened, indicating investors see less urgency for additional policy tightening. The combination of improving growth expectations and moderating inflation could give the ECB greater flexibility in the months ahead.
| Indicator | Previous | Latest | Comments |
|---|---|---|---|
| Sentix Investor Confidence | -13.4 | -3.1 | Third consecutive increase |
| Current Situation Index | -20.0 | -14.8 | Third consecutive increase |
| Expectations Index | -6.5 | 9.3 | Third consecutive increase; back in positive territory |