Sample Category Title
USD/CHF Weekly Outlook
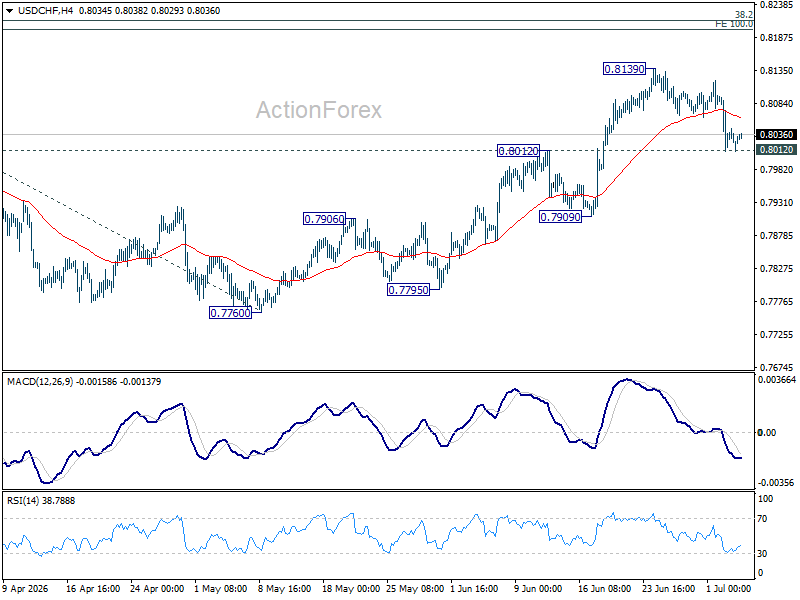
USD/CHF's pull back from 0.8139 extended lower last week but 0.8012 resistance turned support remains intact. Initial bias remains neutral and another rise is still mildly in favor. Above 0.8139 will extend the rally from 0.7760 to 100% projection 0.7603 to 0.8041 from 0.7600 at 0.8198 next. However, sustained break of 0.8012 will bring deeper fall to 55 D EMA (now at 0.7951) and below.
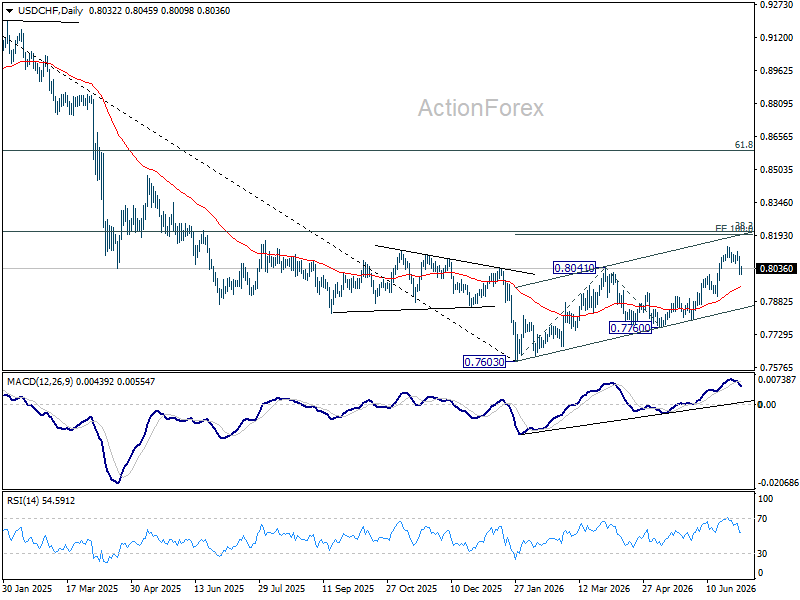
In the bigger picture, while a medium term bottom was formed at 0.7603, it's still early to call for bullish trend reversal. As long as 38.2% retracement of 0.9200 (2025 high) to 0.7603 at 0.8213 holds, the larger down trend could still continue through 0.7603 at a later stage. However, firm break of 0.7603 will argue that the trend has reversed and turn focus to 0.8332 support turned resistance (2023 low) for confirmation.
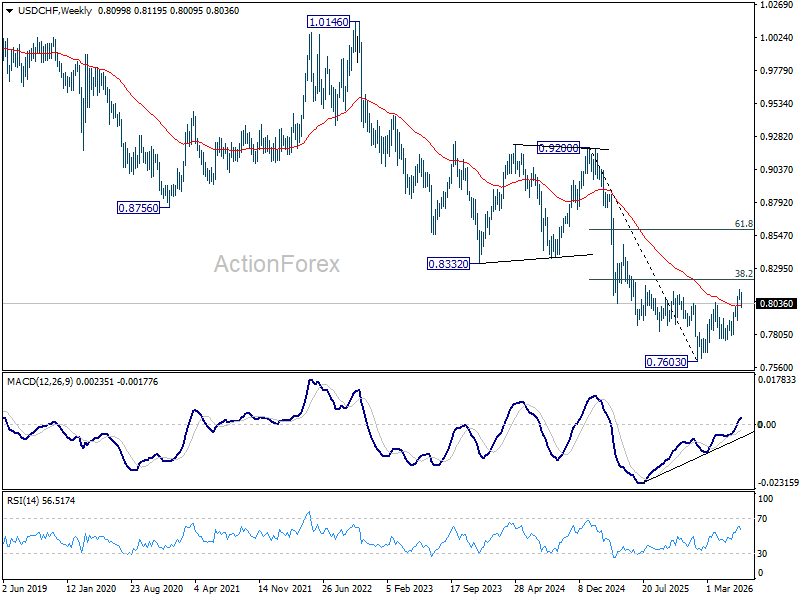
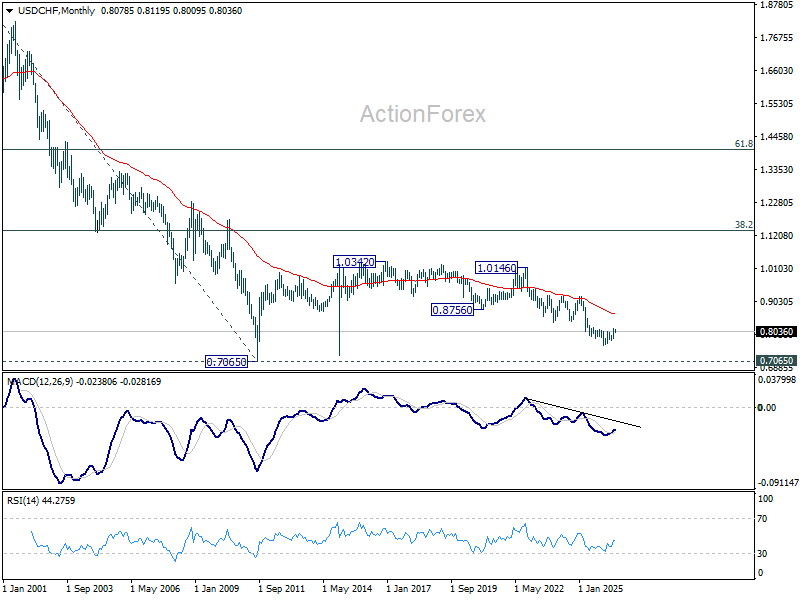
In the long term picture, price action from 0.7065 (2011 low) are seen as a corrective pattern to the multi-decade down trend from 1.8305 (2000 high). It's uncertain if the fall from 1.0342 is the second leg of the pattern, or resumption of the downtrend. But in either case, outlook will stay bearish as long as 0.8756 support turned resistance holds (2021 low). Retest of 0.7065 should be seen next.
AUD/USD Weekly Report
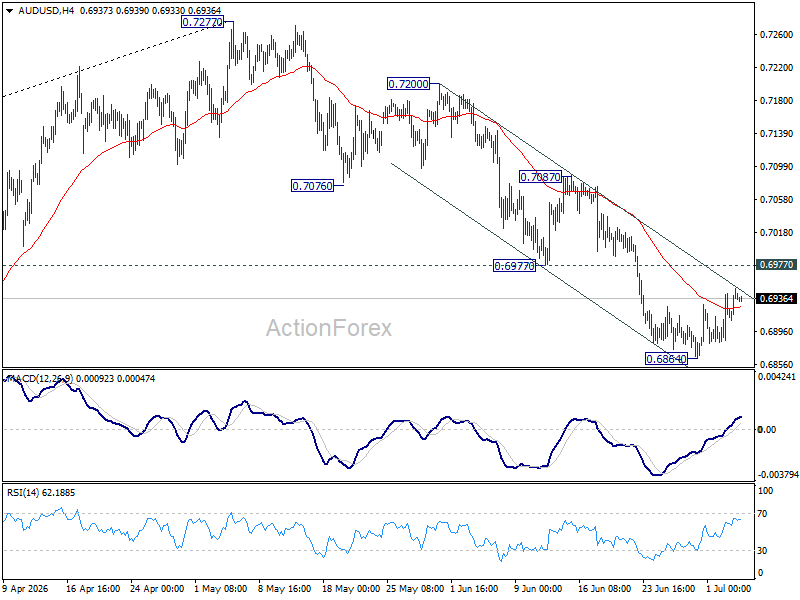
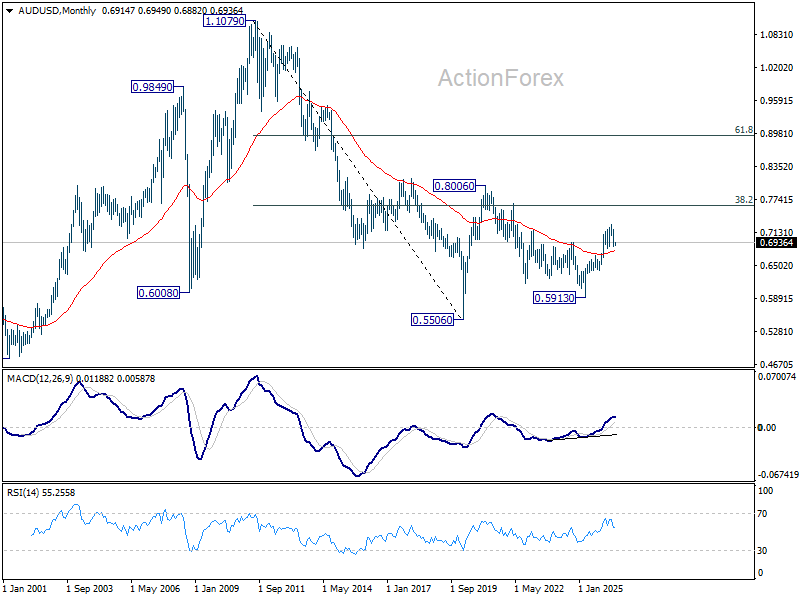
AUD/USD edged lower to 0.6864 last week but recovered since then. Initial bias remains neutral this week for consolidations first. Further fall is expected as long as 0.6977 support turned resistance holds. Below 0.6864 will target 0.6832 support. Firm break there will target 0.6756 fibonacci level. However, sustained break of 0.6977 will bring stronger rebound to 0.7087 resistance instead.
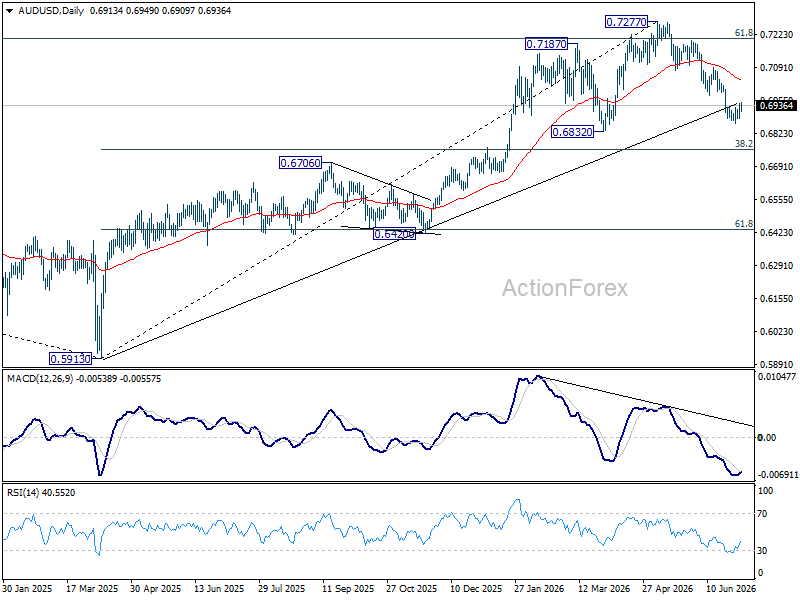
In the bigger picture, considering bearish divergence condition in D MACD, a medium term top could be formed at 0.7277 after failing to sustain above 61.8% retracement of 0.8006 (2021 high) to 0.5913 (2024 low) at 0.7206. Deeper fall could be seen to 38.2% retracement of 0.5913 to 0.7277 at 0.6756 as a correction. But strong support should be seen there to bring rebound. Consolidations would continue below 0.7277 for a while.
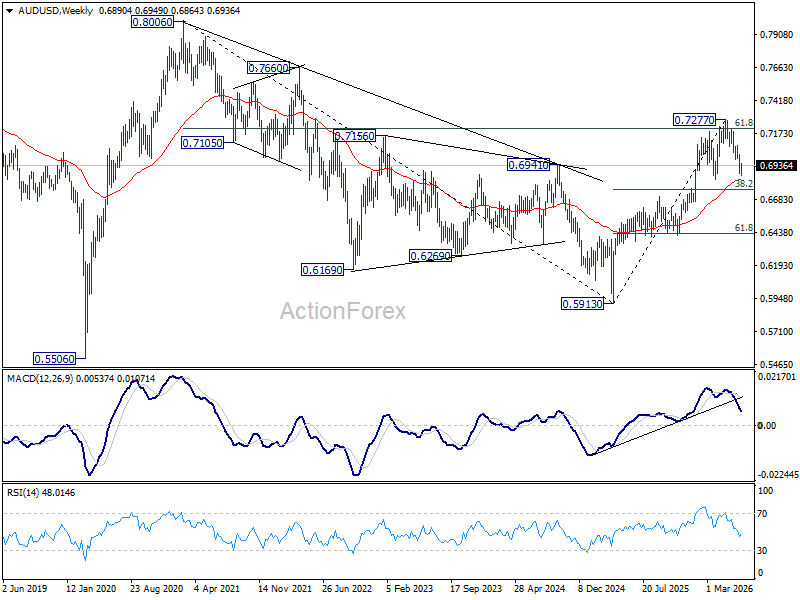
In the long term picture, rise from 0.5913 is seen as the third leg of the whole pattern from 0.5506 (2020 low). It's still early to judge if this is an impulsive or corrective pattern. But in either case, further rise should be seen back to 0.8006 and possibly above. This will remain the favored case as long as 55 W EMA (now at 0.6828) holds.
USD/CAD Weekly Outlook
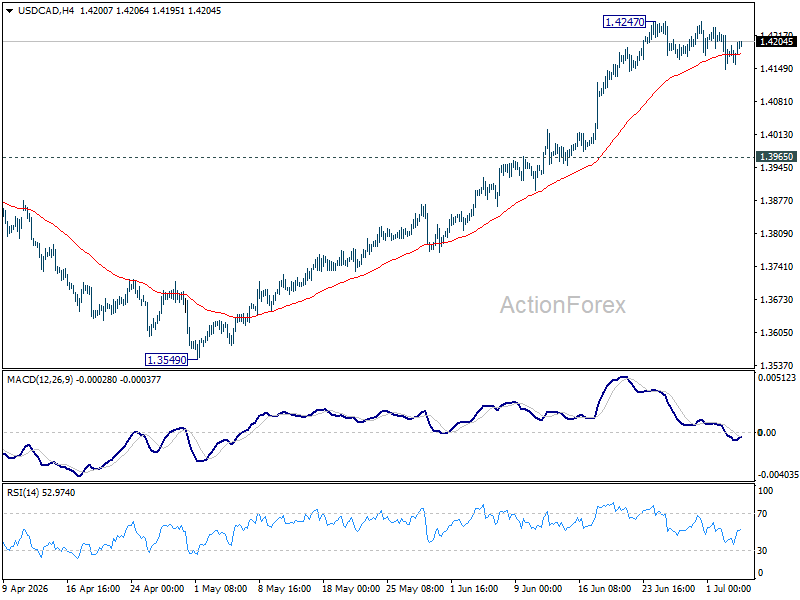
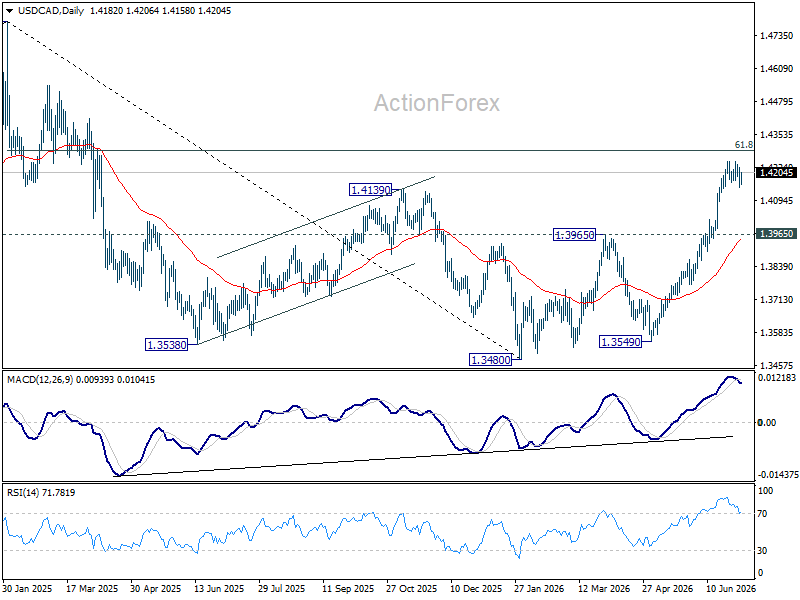
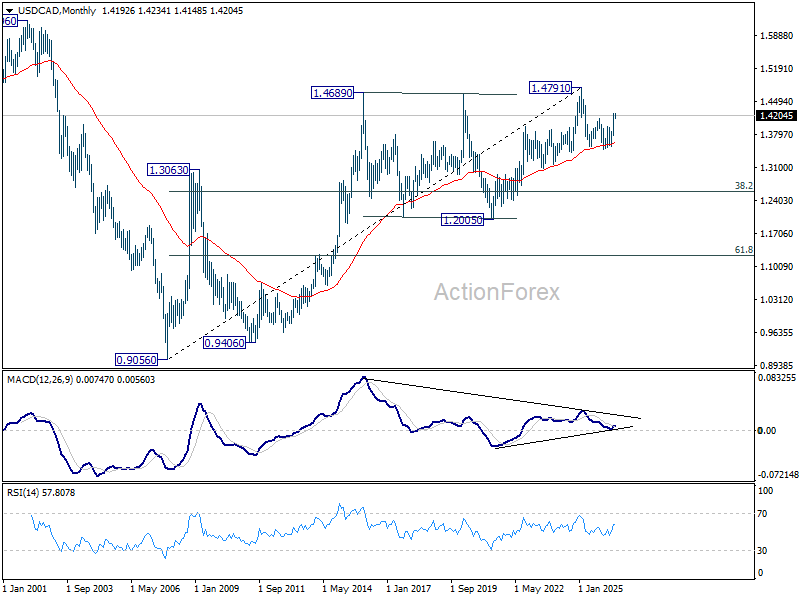
USD/CAD stayed in consolidations below 1.4247 last week and outlook is unchanged. Initial bias remains neutral this week first. While deeper pullback cannot be ruled out, downside should be contained above 1.3965 resistance turned support. Above 1.4247 will resume the rally from 1.3480 to 61.8% retracement of 1.4791 to 1.3480 at 1.4290. Firm break there will pave the way back to 1.4791 high.
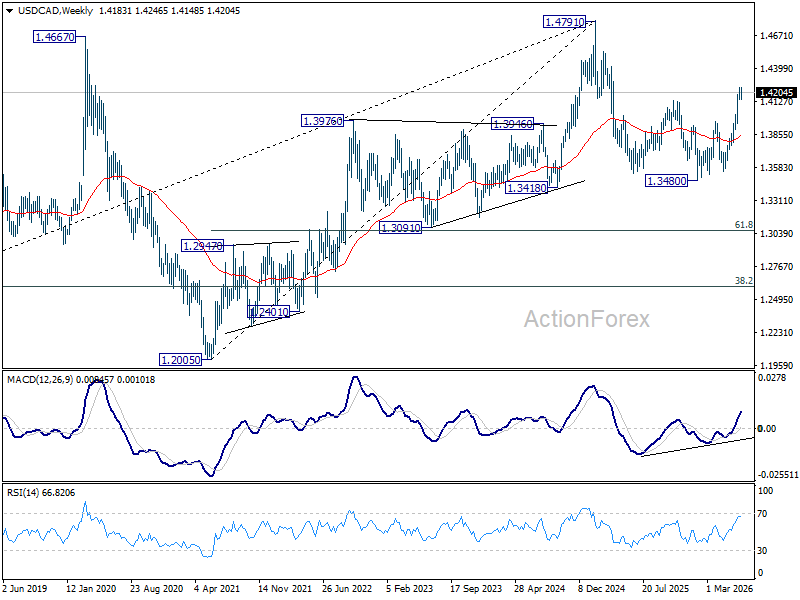
In the bigger picture, current development suggests that fall from 1.4791 has completed as a three wave correction to 1.3480. It's still early to judge if rise from there a corrective bounce, or resumption of the larger up trend from 1.2005 (2021 low). But in either case, retest of 1.4791 high should be seen next.
In the long term picture, rising 55 M EMA (now at 1.3631) remains intact. Thus, up trend from 0.9056 (2007 low) could still be in progress. However, considering bearish divergence condition M MACD, sustained trading below 55 M EMA will argue that the up trend has completed with five waves up to 1.4791, and turn medium term outlook bearish for correction to 38.2% retracement of 0.9056 to 1.4791 at 1.2600.
GBP/JPY Weekly Outlook
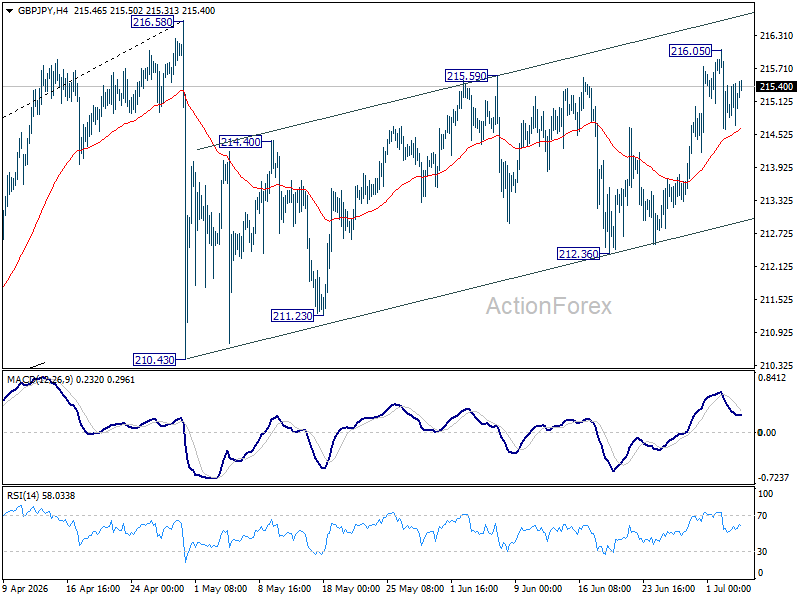
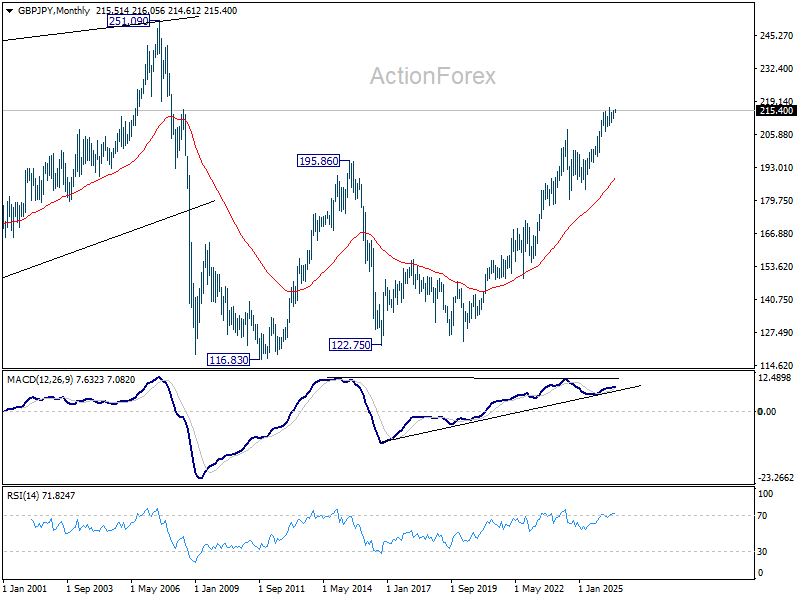
GBP/JPY edged higher to 216.05 last week but retreated since then. Initial bias remains neutral this week first. On the upside, above 216.05 will extend the rebound from 210.43 to retest 216.58 high. On the downside, break of 212.36 will bring deeper fall back towards 210.43 instead.
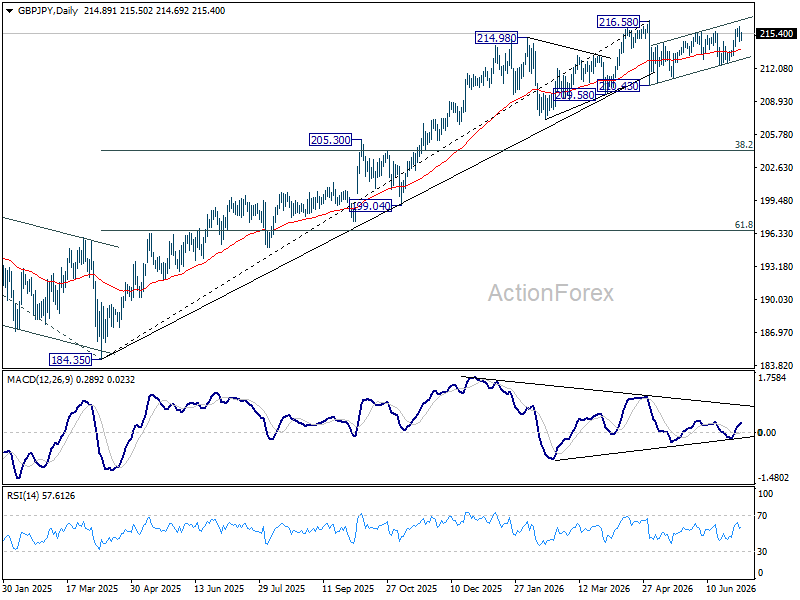
In the bigger picture, there is no clear sign of trend reversal yet. The long term up trend could still extend to 61.8% projection of 148.93 (2022 low) to 208.09 (2024 high) from 184.35 at 220.90 on resumption. However, sustained break of 55 W EMA (now at 207.57) will argue that it's already in medium term down trend for 184.35 support.
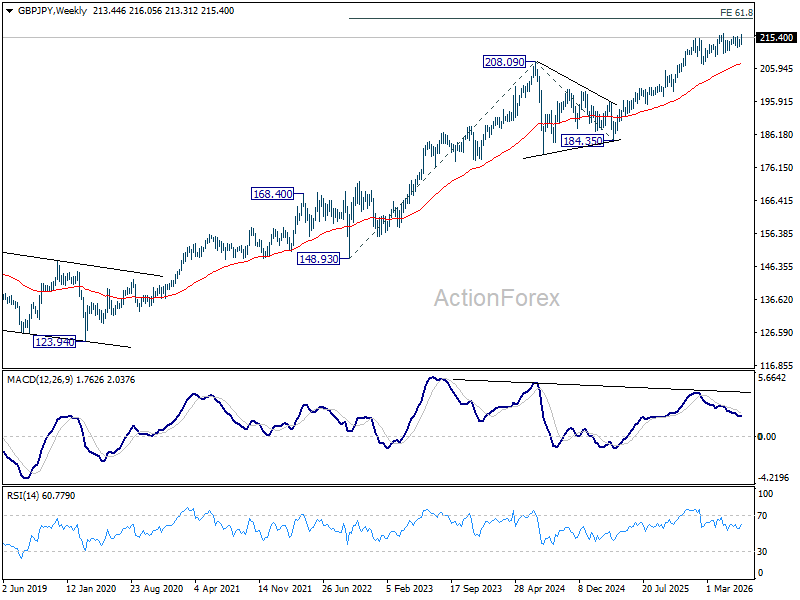
In the long term picture, up trend from 116.83 (2011 low) is in progress. Next target is 251.09 (2007 high). This will remain the favored case as long as 55 M EMA (now at 188.85) holds.
EUR/JPY Weekly Outlook
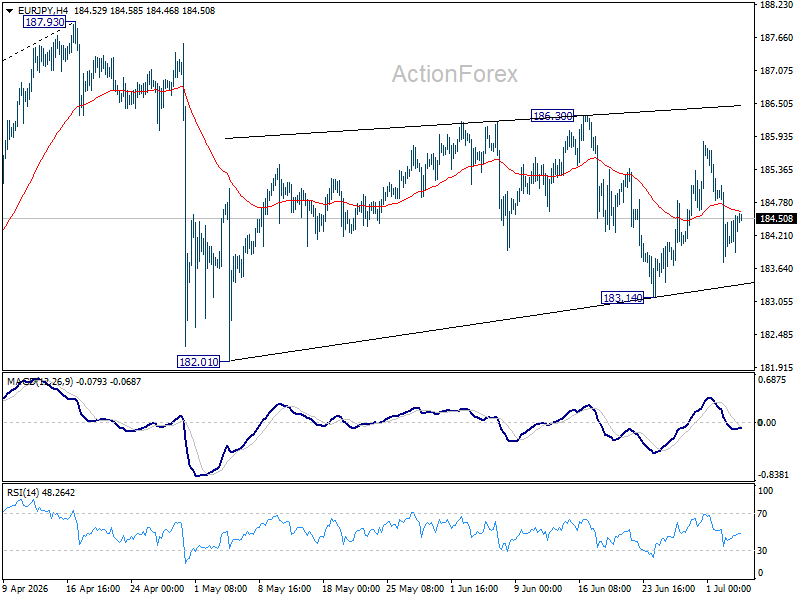
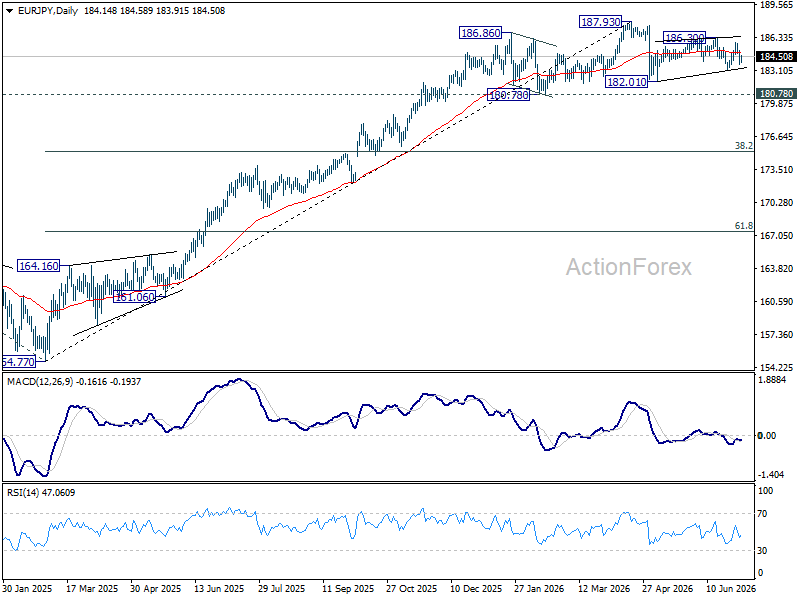
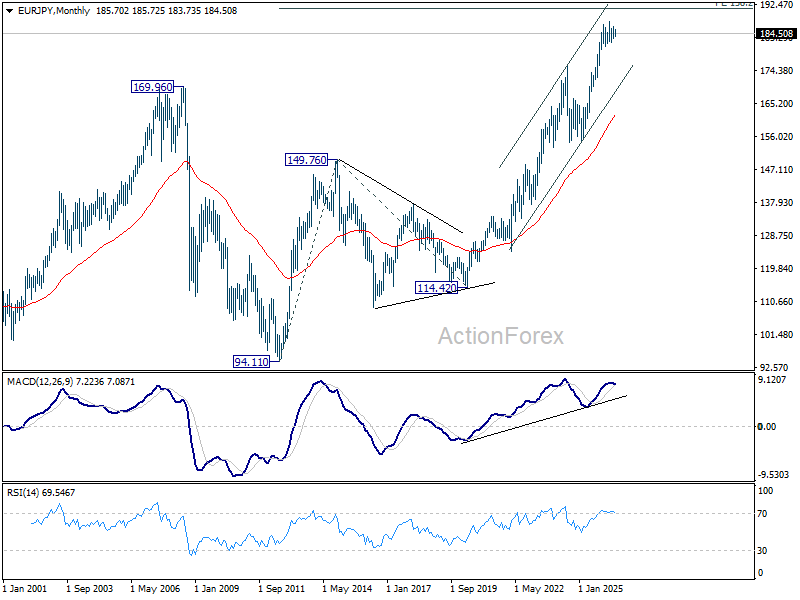
EUR/JPY stayed in range of 183.14/186.30 last week. Initial bias remains neutral this week first. Risk will stay mildly on the downside as long as 186.30 holds. Below 183.14 will target 182.10 support next. Nevertheless, break of 186.30 will extend the rebound from 182.10 towards 187.93 high.
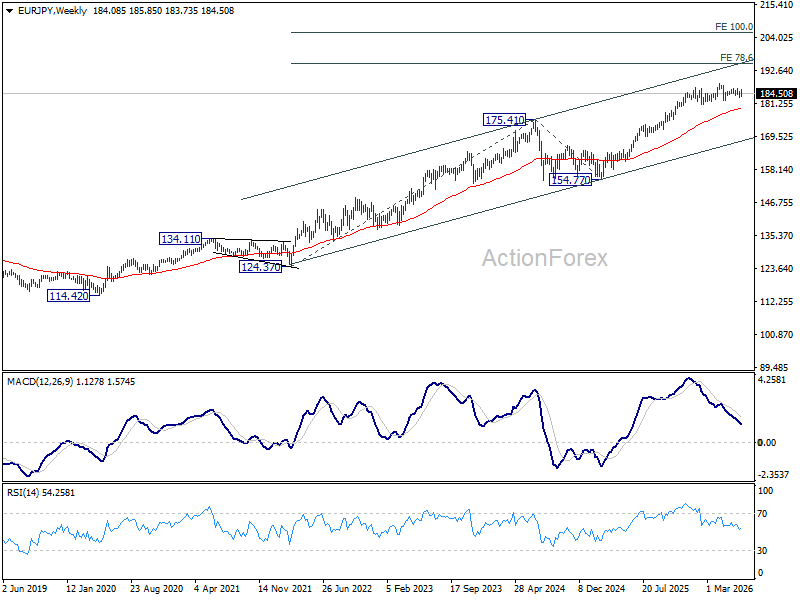
In the bigger picture, there is no sign of reversal yet. Uptrend from 114.42 (2020 low) is still expected to resume at a later stage to 78.6% projection of 124.37 (2022 low) to 175.41 (2025 high) from 154.77 at 194.88. However, sustained break of 55 W EMA (now at 179.55) will argue that it's already in a medium term down trend to 175.41 resistance turned support and below.
In the long term picture, up trend from 94.11 (2021 low) is in progress. Next target is 138.2% projection of 94.11 to 149.76 (2014 high) from 114.42 (2020 low) at 191.32. This will remain the favored case as long 55 W EMA holds.
EUR/GBP Weekly Outlook
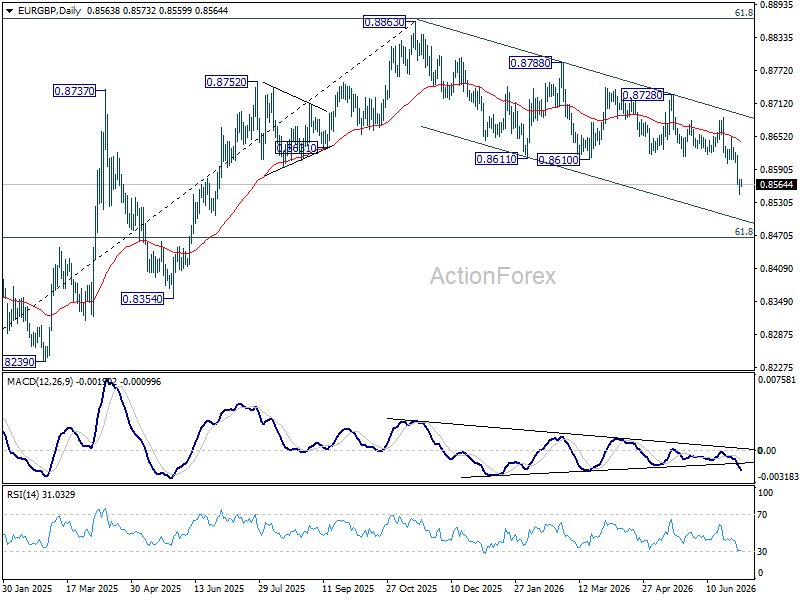
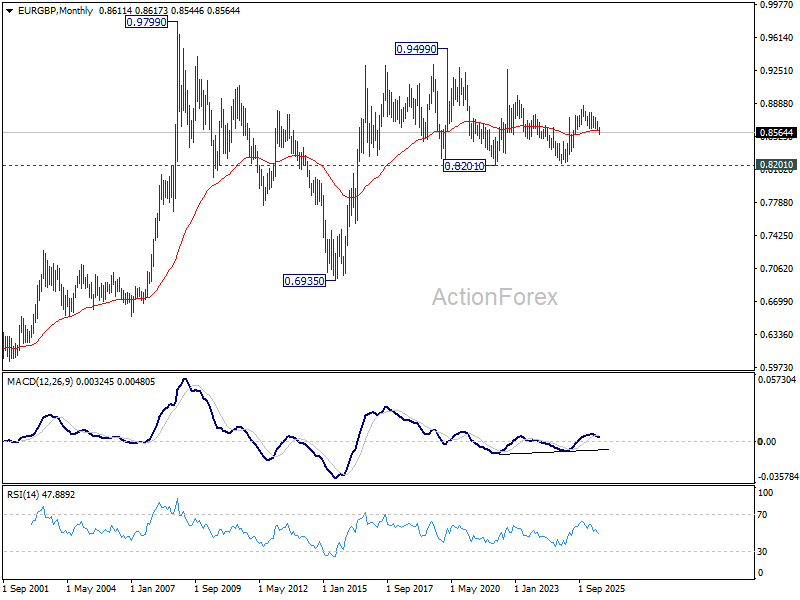
EUR/GBP's extended decline last week indicate that fall from 0.8663 is reversing whole up trend from 0.8221. Initial remains on the downside this week for 61.8% retracement of 0.8221 to 0.8863 at 0.8466 at next. On the upside, above 0.8573 minor resistance will turn bias neutral first. But risk will stay on the downside as long as 0.8686 resistance holds, in case of recovery.
In the bigger picture, current development suggests that rise from 0.8221 (2024 low) has completed at 0.8863, just ahead of 38.2% retracement of 0.8221 (2024 low) to 0.8863 (2025 high) at 0.8618. Deeper fall would be seen back to 0.8201 (2022 low). For now, outlook will be neutral at best as long as 0.8863 hold.
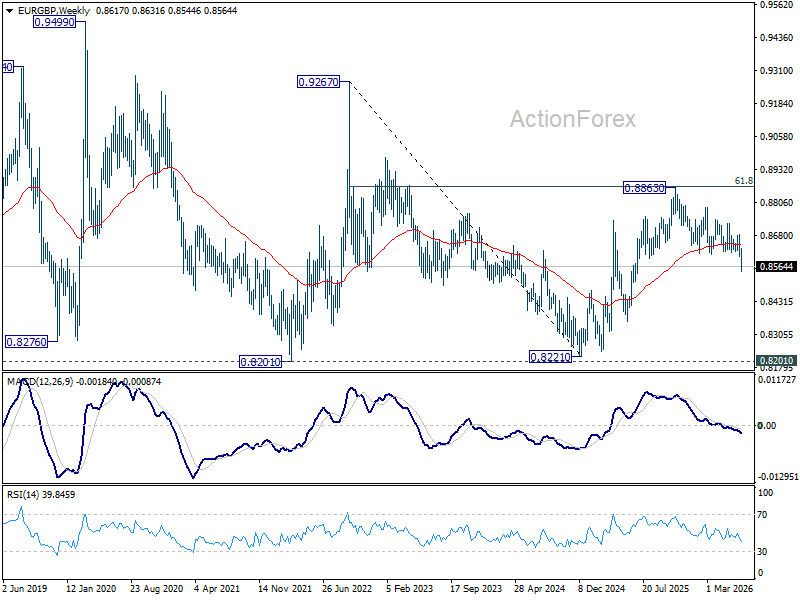
In the long term picture, price action from 0.9499 (2020 high) is seen as part of the long term range pattern from 0.9799 (2008 high). Range trading should continue between 0.8201 and 0.9499, until there is clear signal of imminent breakout.
EUR/AUD Weekly Outlook
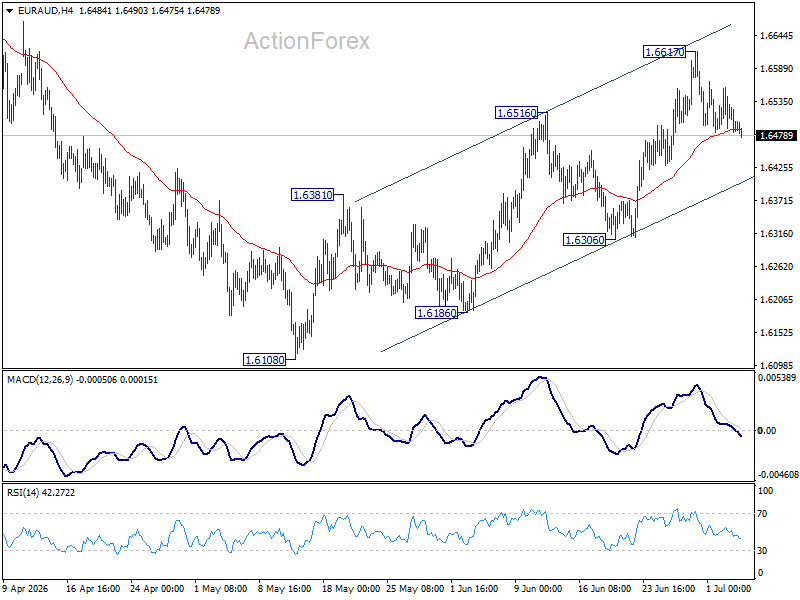
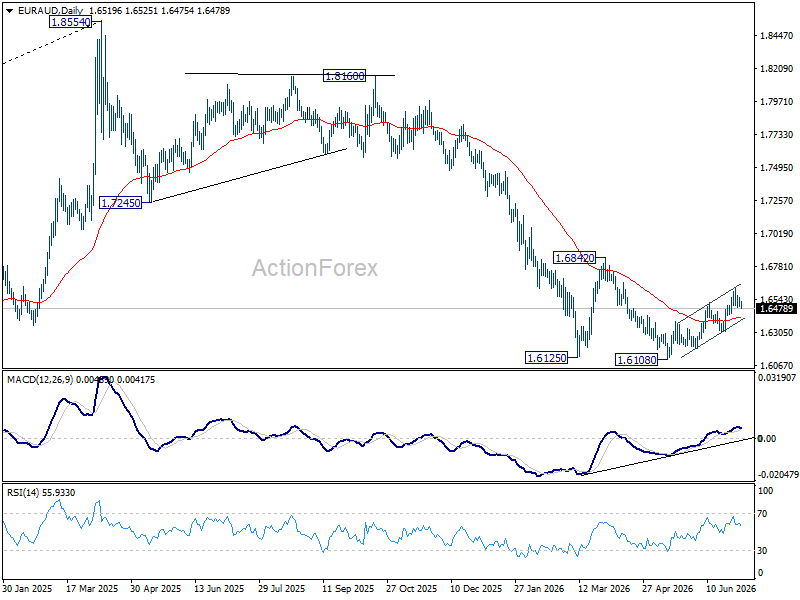
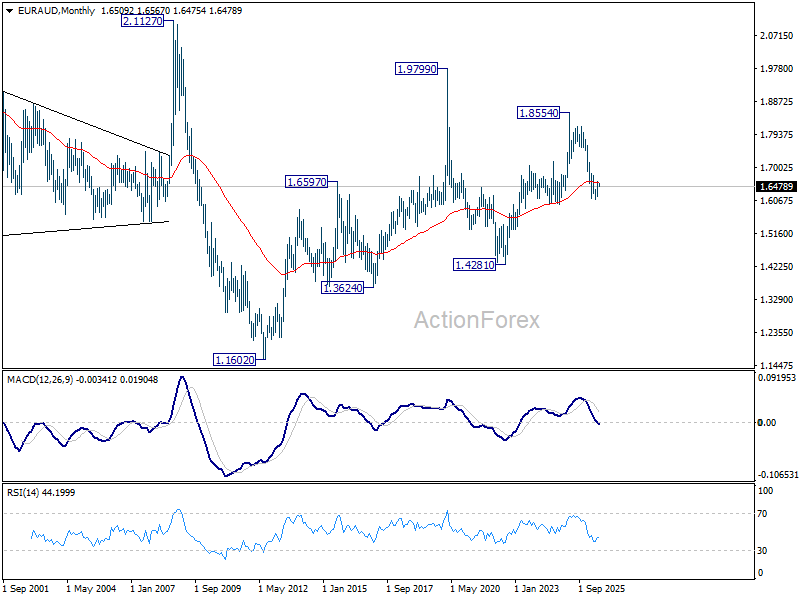
EUR/AUD edged higher to 1.6617 last week but retreated again. Initial bias remains neutral this week for some consolidations. Further rise is in favor as long as 1.6306 support holds. Above 1.6617 will extend the rebound from 1.6108 towards 1.6842 key structural resistance. However, firm break of 1.6306 will turn bias back to the downside for retesting 1.6108.
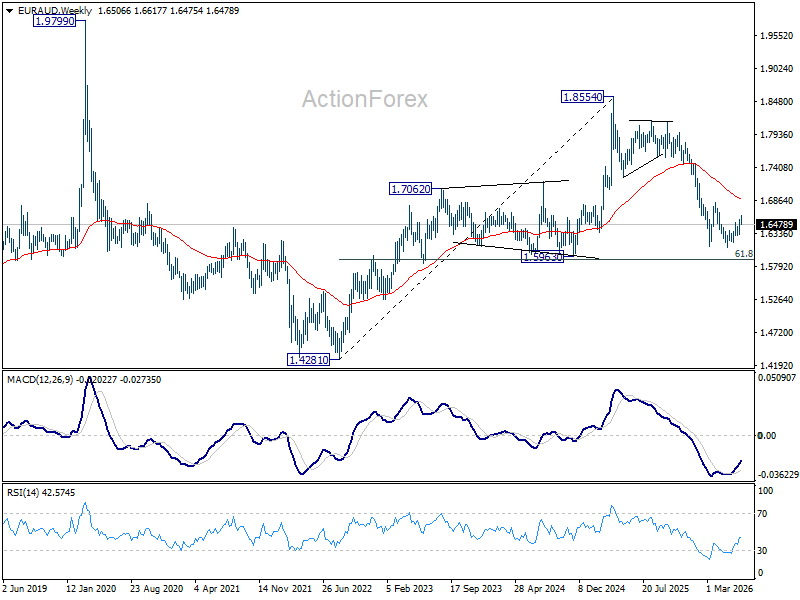
In the bigger picture, outlook will stay bearish as long as 1.6842 resistance holds. Fall from 1.8554 (2025 high) is expected to continue to 61.8% retracement of 1.4281 to 1.8554 at 1.5913. Decisive break there will pave the way back to 1.4281 (2022 low). However, firm break of 1.6842 should confirm medium term bottoming, and bring stronger rally.
In the longer term picture, fall from 1.8554 is seen as the third leg of the pattern from 1.9799 (2020 high), which is part of the pattern from 2.1127 (2008 high). Sustained trading below 55 M EMA (now at 1.6577) will confirm this bearish case, and pave the way back towards 1.4281.
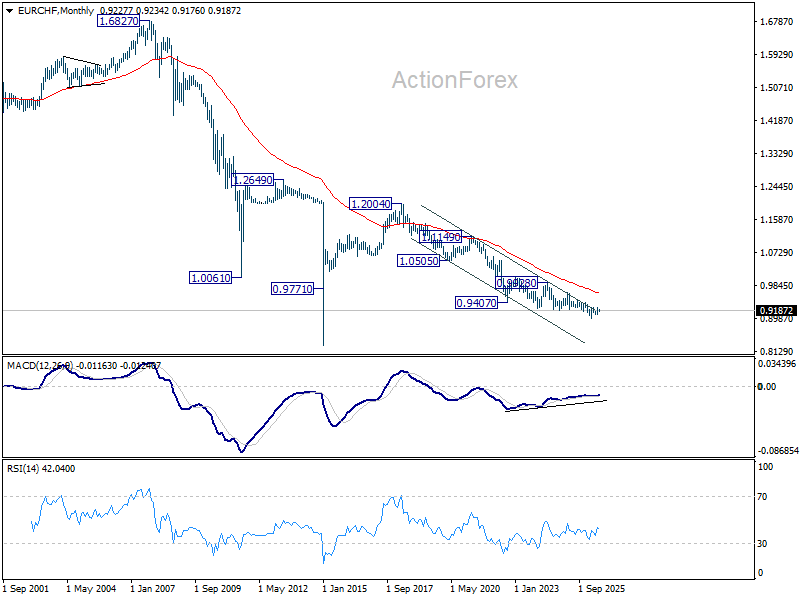
EUR/CHF Weekly Outlook
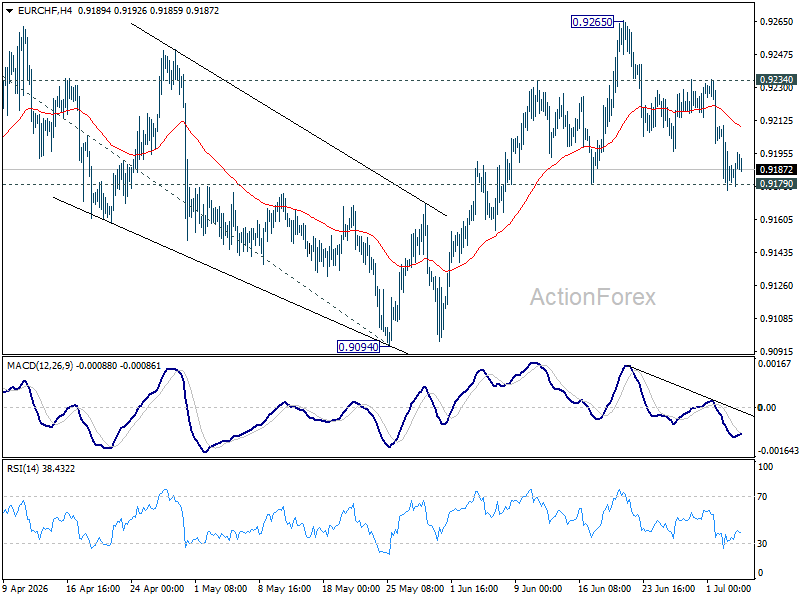
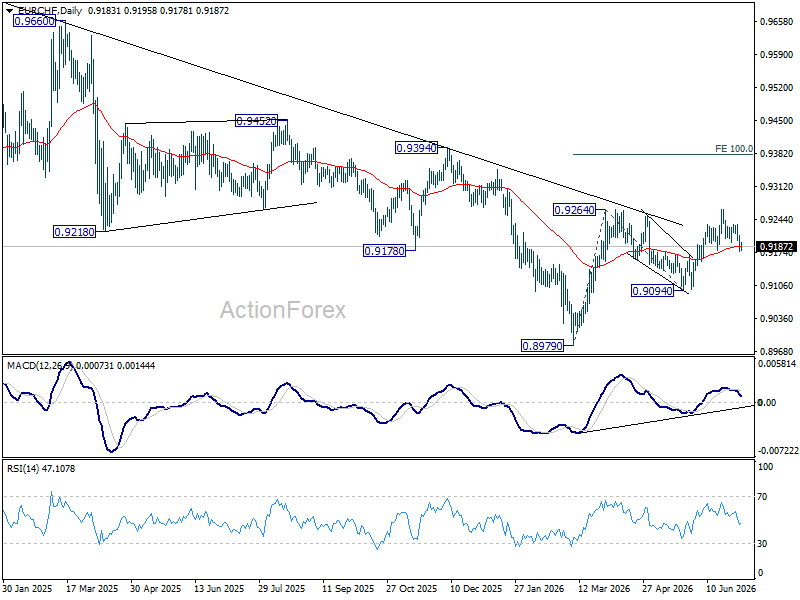
While EUR/CHF's pullback from 0.9265 extended lower last week, downside is still contained by 0.9179 support. Initial bias remains neutral this week and further rise is in favor. On the upside,a above 0.9234 will bring retest of 0.9265 resistance first. Firm break there will resume the rally from 0.8979 to 100% projection of 0.8979 to 0.9264 from 0.9094 at 0.9379. However, decisive break of 0.9179 will dampen this bullish view, and bring deeper fall back to 0.9094 support.
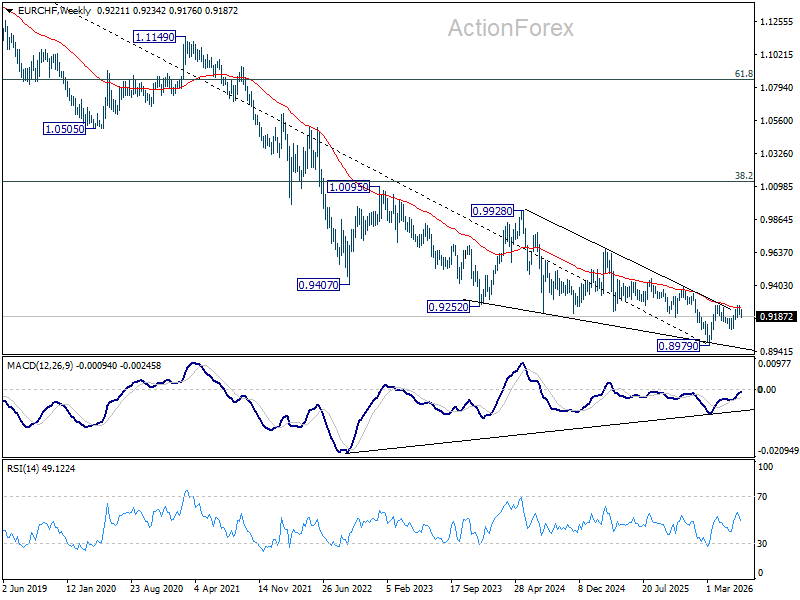
In the bigger picture, the break of medium term falling trend line resistance indicates that 0.8979 is already a medium term bottom. Considering bullish convergence condition in W MACD, rise from there should at least be reversing the fall from 0.9928, with prospect of developing into a medium term up trend. Firm break of 0.9394 resistance will add more credence to this case. For now risk will remain on the upside as long as 0.9094 support holds, in case of retreat.
In the long term picture, outlook will stay bearish as long as 0.9407 support turned resistance (2022 low) holds. However, firm break of 0.9407 will argue that the down trend from 1.2004 (2018 high) has completed with five waves down to 0.8979. Stronger rebound should then be seen to 38.2% retracement of 1.2004 to 0.8979 at 1.0135 in the medium term.
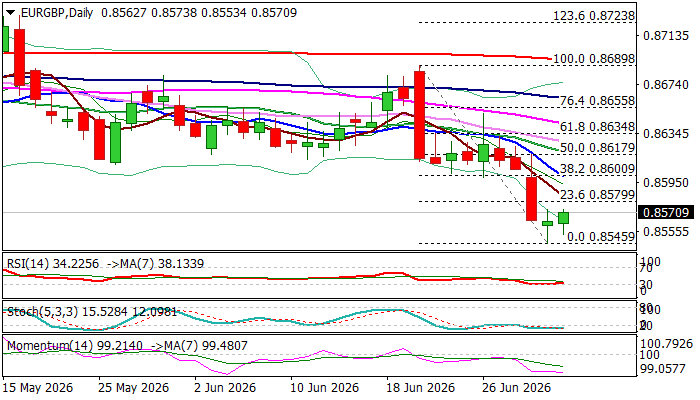
EURGBP – Larger Bears to Take a Breather
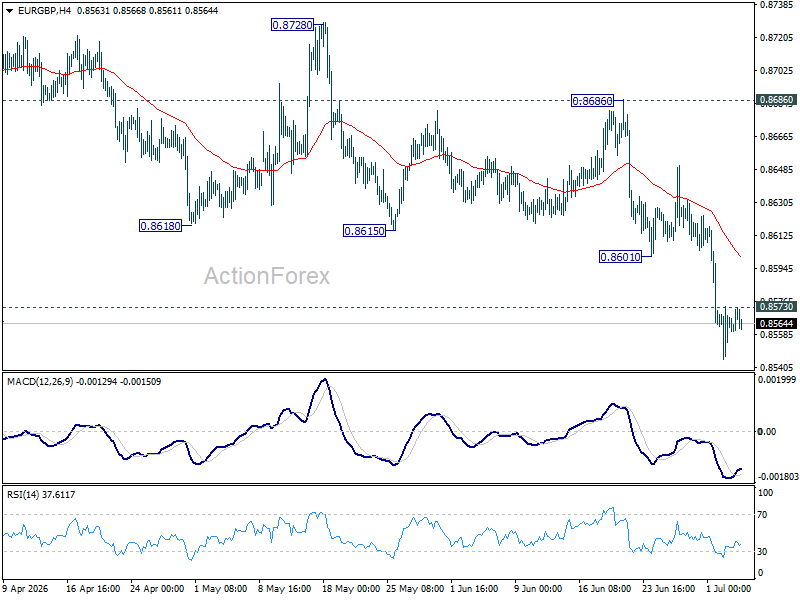
EURGBP edges higher on Friday after fresh acceleration lower in past three days failed to clearly break Fibo support at 0.8552 (50% retracement of 0.8239/0.8865 rally, also weekly Ichimoku cloud base) and formed a bear-trap pattern on daily chart that paves the way for recovery.
The Euro remained at the back foot due to significant slowdown in Eurozone economic growth, persisting geopolitical uncertainty and higher energy cost, while sterling received boost from easing political uncertainty and signals that the BoE may keep higher interest rates for some time as inflation remains elevated.
Reversal pattern is developing on daily chart, though still requiring verification on longer bullish daily candle on Friday and daily close minimum above 0.8580 Fibo 23.6% of 0.8689/0.8545 bear-leg).
Significant bullish developments can be seen on hourly chart that contribute to reversal scenario, while daily studies are still mixed (MAs in bearish configuration vs RSI reversing from oversold zone) that way obstruct recovery attempts.
Lift above 0.8580 to expose more significant barrier at 0.8600 (Fibo 38.2% / 10DMA), violation of which to generate stronger bullish signal.
On the other hand, recovery stall under 0.8600 to keep larger bears in play and provide better levels to re-enter bearish market.
Res: 0.8580; 0.8600; 0.8620; 0.8634
Sup: 0.8545; 0.8507; 0.8478; 0.8458
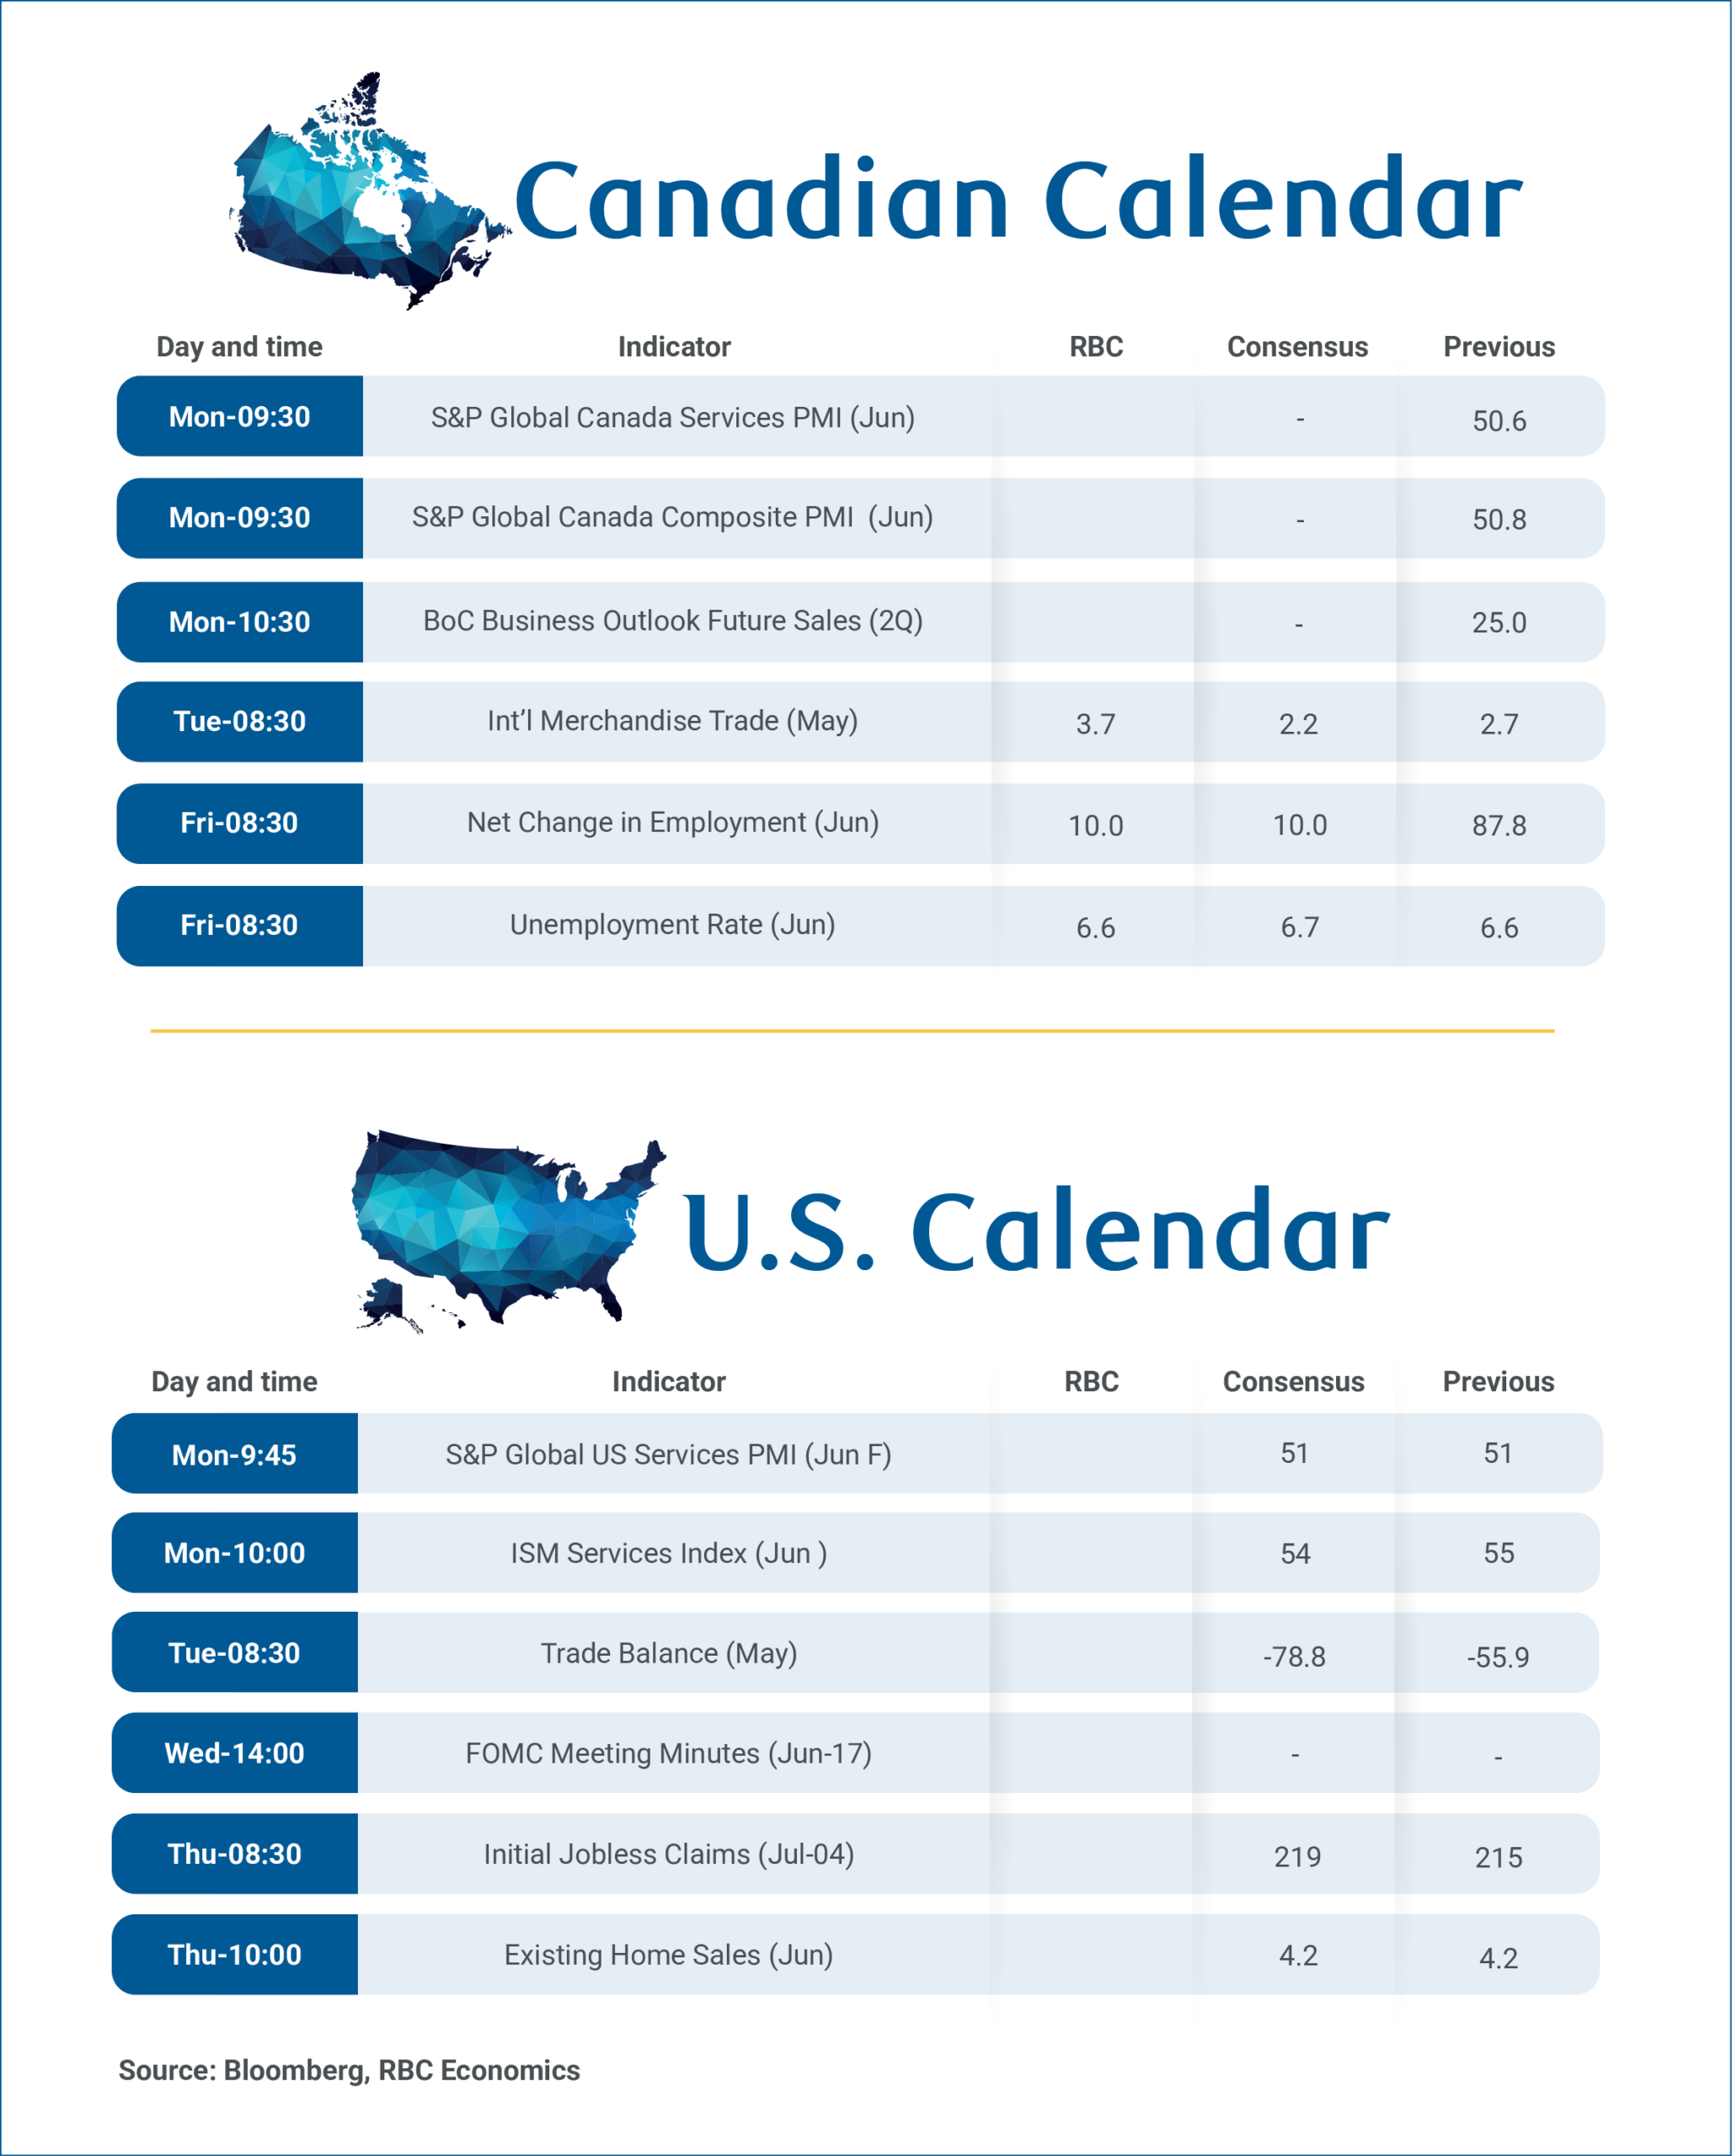
Labour Market and Business Sentiment in Focus as Canada’s Economy Stabilizes
Canada’s employment report next Friday and the Bank of Canada’s Business Outlook Survey on Monday should provide important updates on the balance between labour market conditions, business confidence and inflation expectations.
We expect June’s labour market to broadly hold onto gains in the prior month that retraced much of the weak data over the first four months of the year. We look for jobs to edge higher by 10,000, and the unemployment rate to remain at 6.6% in June, matching May’s reading and down from 6.9% in April.
Unemployment is still elevated by historical standards, and volatile from month-to-month, but has mostly edged gradually lower since hitting a peak of 7.1% in August/September last year. We continue to expect a gradual improvement over the remainder of 2026.
Wage growth will also remain on the radar after slowing sharply in May. Monthly readings can be volatile, but a still-elevated unemployment rate should continue to keep underlying wage pressures contained in the near term.
Looking ahead, job growth is expected to remain soft, but an unprecedented pullback in Canada’s population is shrinking the labour force with per-worker labour market conditions showing more signs of improvement.
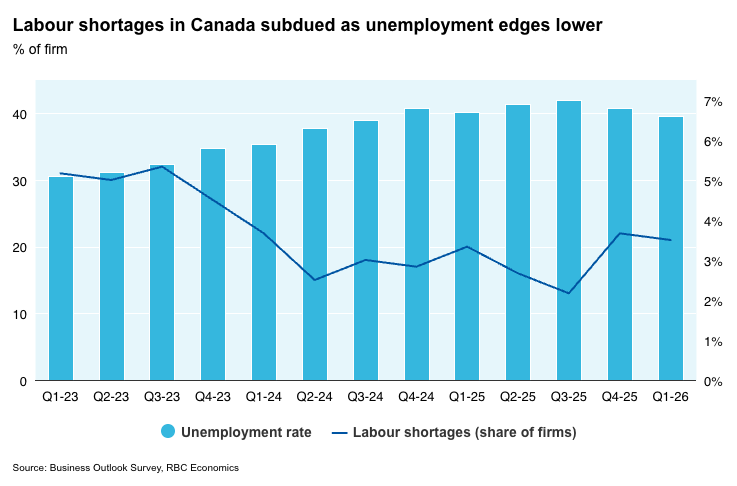
Business Outlook Survey to hint at confidence during oil price shock
The Q2 Business Outlook Survey will provide an early look at how business sentiment was impacted by the surge in energy prices in recent months. Survey responses were (at least initially) likely collected largely in May when oil prices were higher (West Texas Intermediate oil prices averaged just under US$100/barrel compared to under $70/bbl recently).
Results will still be reviewed for signs on whether inflation pressures broadened. But longer-term inflation expectations should remain well anchored as underlying pressures have continued to track close to the BoC's 2% target.
Measures of expected future sales, employment, and business investment intentions will also be key after showing signs of improvement in the Q1.
Continued labour market stabilization alongside broadly steady business sentiment and well-anchored inflation expectations would reinforce the view that interest rate changes are not needed at this stage.
May trade data will also be released on Tuesday. We expect exports to rise 0.6%, slowing from 1.6% in April, while imports are expected to edge down 0.8%. Softer energy price growth in May should temper the energy trade balance, while softer motor vehicle shipments suggest some moderation in auto trade.