Sample Category Title
S&P 500: Index Narrows Its Range as the Labour Market Cools
The broad US market index, the S&P 500, has entered July against a backdrop of mixed signals from the labour market. The Bureau of Labor Statistics report released on 2 July showed that just 57,000 jobs were added in June, well below market expectations, while the unemployment rate stood at 4.2%. Following the release, markets scaled back expectations of a Federal Reserve rate hike in September, although the possibility of an October increase remains. At the same time, the current 10% global tariff is due to expire at the end of July, and markets are gradually pricing in uncertainty surrounding future trade policy decisions.
Technical Outlook
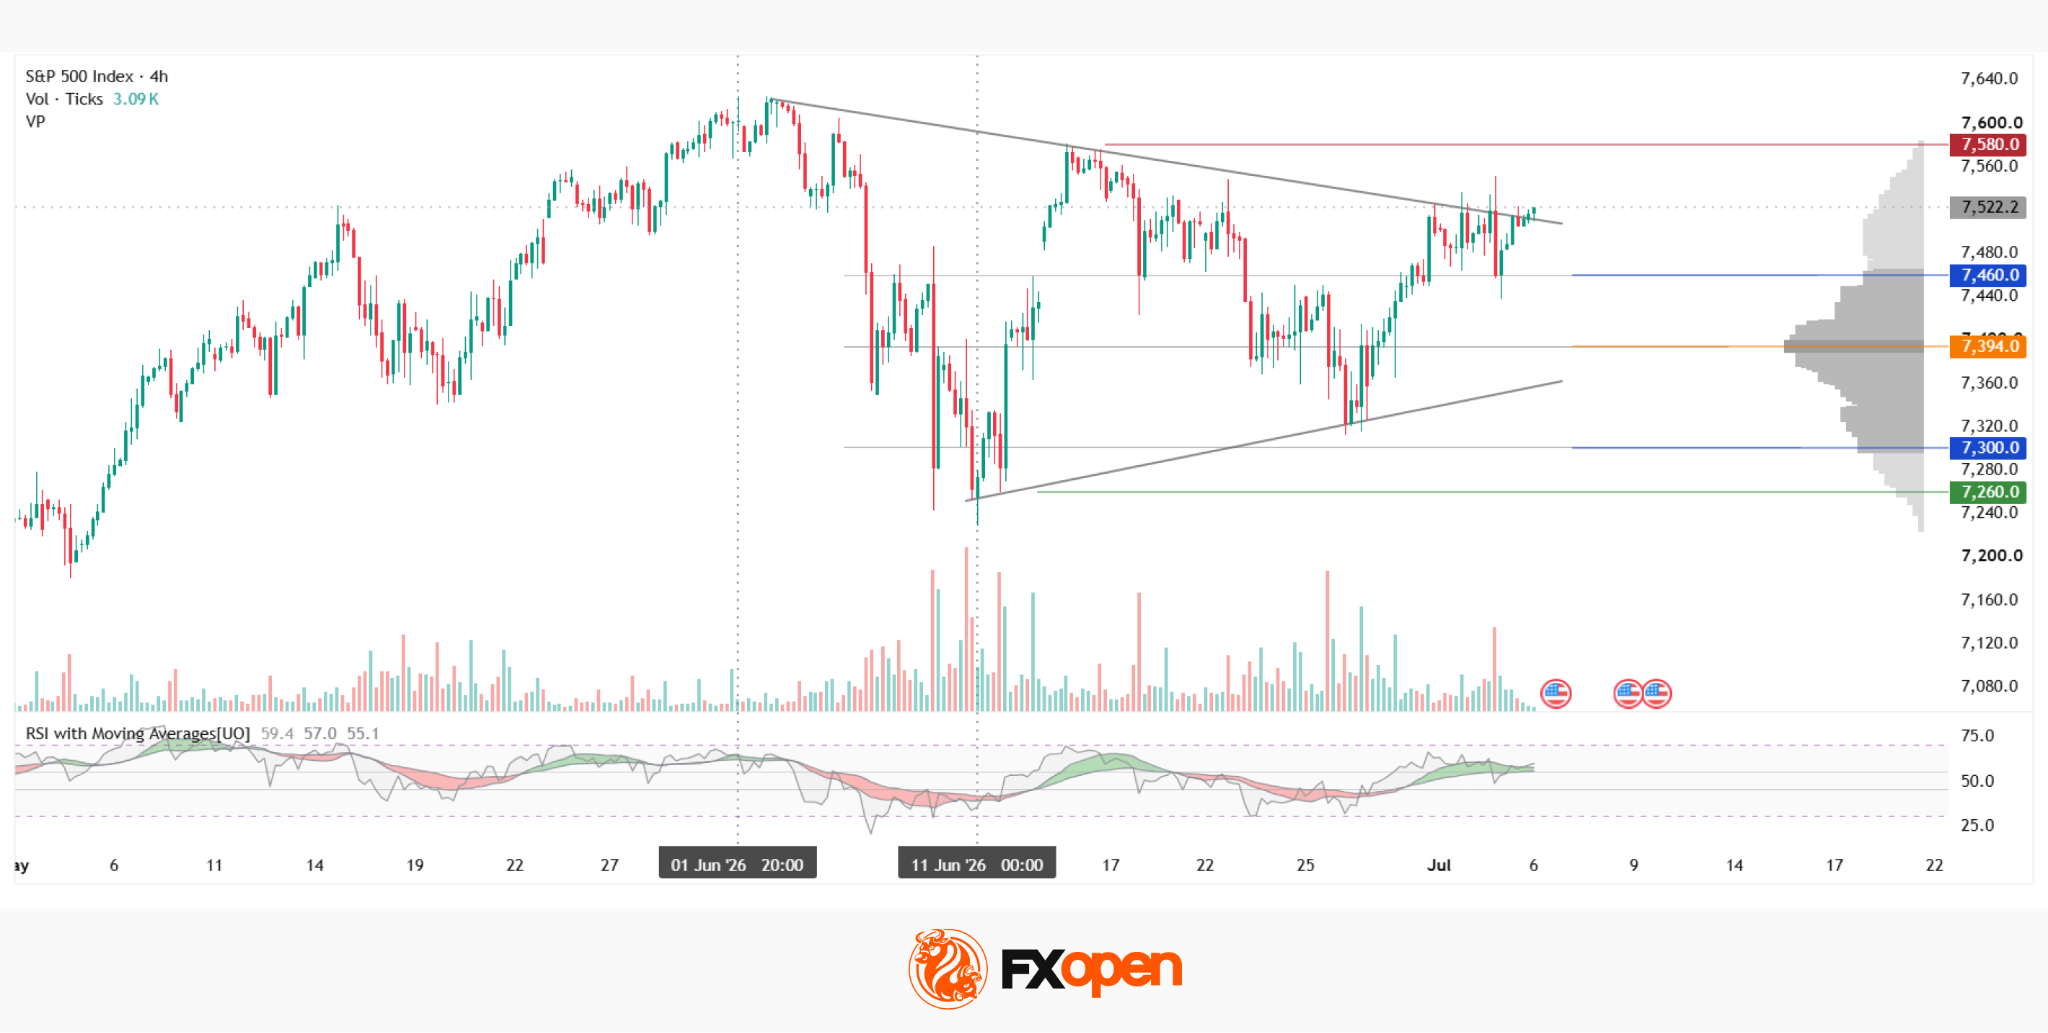
On the four-hour chart, the S&P 500 (SPXm on FXOpen) remains in a consolidation phase following the uptrend that began on 31 March. After peaking near 7,600, the index declined to around 7,250 before forming a symmetrical triangle, with the descending upper trendline and the ascending lower trendline gradually converging. Since the beginning of July, the price has remained above the upper boundary of the current market profile at 7,460, repeatedly testing the triangle's descending trendline but failing to break above it. Resistance is located around 7,580.
The narrowing range has been accompanied by declining volume, with the latest wave of the triangle noticeably quieter than the previous one, a typical feature of a maturing consolidation pattern. The highest concentration of horizontal volume (POC) is located near 7,394, while the lower boundary of the current profile sits around 7,300. Should the index move lower, these areas could provide support before any attempt to break below the ascending side of the triangle and potentially reach the 7,260 support level. The RSI + MAs indicator currently reads 59, 57 and 55. Although all three values remain above the neutral zone, they do not yet indicate a clear directional bias.
Summary
The POC zone remains the key reference point if the rejection from the triangle boundary develops into a broader decline. Meanwhile, the RSI + MAs indicator continues to hold above neutral without showing a strong trend. Looking ahead, tariff-related uncertainty may become the more significant driver for the index over the coming weeks, as the expiry of the current 10% global tariff at the end of July could trigger a shift in market sentiment.
Trade global index CFDs with zero commission and tight spreads (additional fees may apply). Open your FXOpen account now or learn more about trading index CFDs with FXOpen.
This article represents the opinion of the Companies operating under the FXOpen brand only. It is not to be construed as an offer, solicitation, or recommendation with respect to products and services provided by the Companies operating under the FXOpen brand, nor is it to be considered financial advice.
Gold Finds Support at $4,000, but Only Softer Inflation Can Fuel the Next Rally
Gold found its footing above $4,000 after June's disappointing US payrolls report triggered broad-based Dollar selling and eased expectations for a near-term Fed rate hike. But the rebound is already losing momentum this week. The reason is simple: while payrolls surprised on the downside, the Fed's bigger concern is not employment—it's inflation.
The post-NFP rally illustrated that tension perfectly. Dollar Index slipped to a two-week low near 100.75 after the jobs report, allowing Gold to climb back above $4,200. Yet the move quickly stalled. By Monday, the Dollar was already recovering. Rather than extending higher, Gold struggled to capitalize on last week's softer labor data, suggesting the market has already moved beyond the initial payroll-driven reaction.
The bigger story lies in the Fed's June policy projections. Two weeks before the payroll report, policymakers delivered a meaningful hawkish shift by raising the median 2026 federal funds rate projection from 3.4% to 3.8%. That was more than a routine adjustment. It transformed the committee's central outlook from one additional rate cut to one additional hike. Nine officials now expect rates to rise further, eight see policy staying unchanged, and only one continues to project another cut.
Against that backdrop, one weak employment report was never likely to overturn the Fed's broader inflation narrative. Markets have delayed expectations for the next hike from September toward December, but they have not abandoned the idea altogether. As long as investors continue to believe the next policy move is more likely to be another hike than a cut, Gold will struggle to build a sustained rally.
That is why this week's ISM Services PMI and Wednesday's FOMC minutes may have only limited influence. They can shape short-term sentiment, but neither is likely to change the market's broader view of Fed policy. The more important event arrives on July 14, when the June CPI report will provide the clearest evidence yet of whether the Fed's inflation concerns are justified.
The stakes are unusually high. The June Summary of Economic Projections lifted the Fed's forecasts for 2026 headline and core PCE inflation sharply higher, while May CPI had already accelerated to 4.2%. If June inflation surprises to the upside, policymakers will have fresh evidence that inflation pressures are proving more persistent than hoped. That would reinforce expectations for another rate hike, supporting the Dollar and Treasury yields while limiting Gold's upside. On the other hand, a softer CPI report would undermine the Fed's inflation thesis and could finally give Gold the catalyst needed to break convincingly above recent resistance.
Until that verdict arrives, Gold may struggle to escape its current range. The market appears caught between two competing narratives: a labor market that is gradually cooling and a central bank that is still more worried about inflation than growth. Without clearer evidence that inflation is easing, the recent rebound risks becoming little more than a pause within a broader decline.
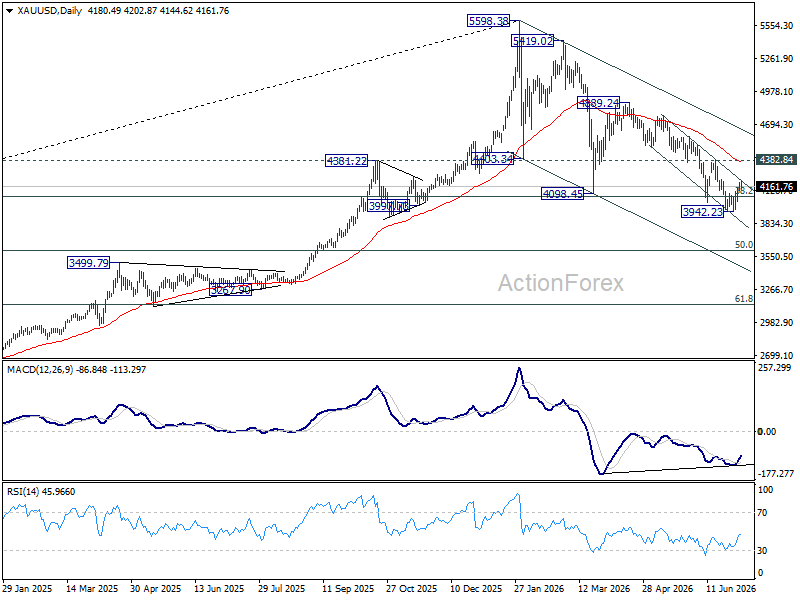
Technically, Gold appears to have established a short-term floor at 3942.23, supported by bullish convergence on 4H MACD. Additional consolidation is possible in the near term, but the broader outlook remains bearish while 4,382.84 caps the recovery. Failure there would keep the downtrend from 5,598.38 intact and maintain the risk of another decline through 3,942.23 toward the 50% retracement of 1,614.60 to 5,998.38 at 3,606.49.
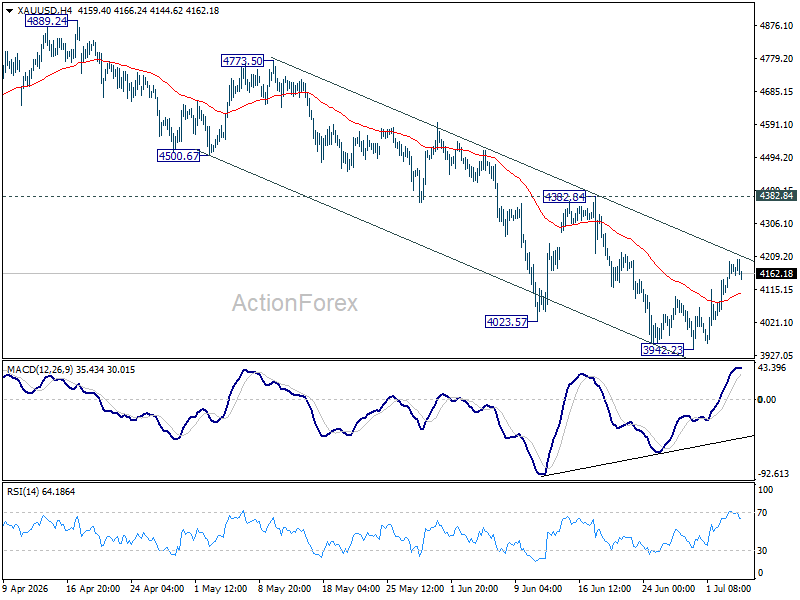
Even so, the daily chart also shows bullish convergence developing on the MACD, suggesting downside momentum is gradually fading. Decisive break above 4382.84, followed by sustained trading above the 55 D EMA, now at 4364.94, would provide the first meaningful evidence that a medium-term trend reversal is underway, opening the way toward the descending trend line near 4,630.
Sunrise Market Commentary
Markets
The US was busy on Friday observing the Fourth of July so doors were shut. Moves during the European session deserve little more than a nutshell recap: stocks up (0.8%), yields up (2–3.8 bps) and the dollar mostly flat. USD/JPY was an exception with initial yen gains evaporating throughout the day. The Japanese currency is extending losses further this morning, pushing USD/JPY back towards the 162 area. So much for the payrolls-driven relief for JPY. EUR/GBP finished the week (well) below the 0.86 support zone. The technical picture as such has deteriorated (improved for GBP) with the next levels to watch now being around the 0.85 big figure. In the core bond space, our attention for the time being is shifting from the front- to the long end of the curve. ECB policymakers downplayed the probability for a back-to-back rate hike in July, citing the ceasefire and coinciding oil price drop as removing the urgency of such a move. Yet it is interesting to see how long-term inflation expectations (e.g. 10-yr) have recently found a bottom around 2%. It suggests the room for further oil-price-driven declines is limited. Add the public finances narrative and there's enough reason to believe the downside in long-term yields is well protected.
US Treasuries reopen little changed this morning after the weekend festivities. There is little market-relevant news to begin the new week with. The contentious reversal of USA Balogun's suspension appearing on virtually all financial media front pages serves as a case in point. We do note the ongoing rise in long-term Japanese yields. It's pushing the likes of the 10-yr and 20-yr to new multi-decade highs. We'll be looking for this steepening trend to spill over to Europe and the US as well. The US dollar inches higher in technically insignificant trading. The risk backdrop is mixed with some rotation out of the AI sphere. The economic calendar centers around the US services ISM for June. Consensus expects more or less stable sentiment (54.1 from 54.5). Risks, if any, are tilted to the upside with the oil price drop and World Cup potentially causing a boost. A research policy panel in Rome featuring Fed's Waller, ECB's Wunsch and Schnabel is worth mentioning too.
News & Views
According to a budget draft seen by Reuters at the end of last week, Germany plans to lift 2027 net borrowing to more than €203 bn. This compares to a €196.5 bn estimate signaled in April. The previous government in 2024 only borrowed €50.5 bn. The 2027 draft budget reportedly allocates total spending of €555.4 billion, more than the €543.3 billion approved in April. Total investment will be €117.5 bn, about €40 bn more than originally planned. New borrowing in the core budget is reported to increase to €118.7 billion, with €54.9 billion borrowed on top through the infrastructure fund and €30 billion through the special fund for defence approved by former Chancellor Scholz. Core defence spending is set to climb to €109 billion in 2027 from €82 billion in 2026 in the core budget. Adding €11.6 billion in funds for Ukraine and €9.4 billion in other security-related spending, such as civil protection, intelligence and IT security, defence spending rises to €130.1 billion. Reuters reports that the approval of this first draft might take place as soon as today.
At the virtual meeting on Sunday, OPEC+ reviewed the global oil market conditions and outlook. The group decided to further raise output/reduce production restrictions decided in 2023 by 188,000 barrels per day. The production hike will start on August 1. The seven countries of the cartel will again meet on August 2. The impact of the decision on global oil supply still remains highly uncertain, dependent on how much oil regional exporters can ship through the Strait of Hormuz as the US and Iran signed a memorandum of understanding that should lead to a permanent halt of the war in the region. After a protracted decline in the oil price since end of April, the price of a barrel of Brent oil currently stabilizes near $72/b.
NZD/USD Bears Await RBNZ Verdict After Relief Rally
Last week's post-US NFP rebound has given NZD/USD some breathing room, but it has done little to convince traders that the recent downtrend has run its course. With the Reserve Bank of New Zealand set to announce its policy decision this week, the Kiwi now faces a catalyst that could determine whether the recovery develops into something more durable or simply marks another pause before sellers return.
The challenge for the RBNZ is that the arguments for both holding and hiking have become increasingly compelling. Inflation has stayed uncomfortably high after this year's oil shock, supporting the case for pushing interest rates back toward neutral sooner rather than later. Yet domestic demand is still subdued, unemployment remains elevated and geopolitical risks have eased following the US-Iran ceasefire, reducing some of the urgency for another immediate tightening move.
That dilemma is reflected across the policy debate. The NZIER Monetary Policy Shadow Board marginally favors leaving the Official Cash Rate unchanged at 2.25%, but characterizes the July meeting as an exceptionally close call. Members supporting a hike cited persistent inflation pressures, while others argued the economic effects of the earlier energy shock and slowing domestic activity justify waiting for greater clarity. Importantly, there is little disagreement over the medium-term direction of policy, with most members expecting the OCR to climb toward 3.00%-3.25% over the next year.
Forecasts from New Zealand's major banks tell a similar story. ANZ and BNZ expect a 25 basis point increase this week, though ANZ believes any move should be accompanied by balanced guidance to avoid boxing policymakers into an overly aggressive tightening path if economic data weakens. BNZ likewise argues inflation risks have not disappeared despite the improvement in global geopolitical conditions.
ASB and Westpac instead expect the RBNZ to stay on hold. ASB reversed its previous forecast for a July increase after the easing of Middle East tensions, while Westpac believes policymakers are now more likely to reach a consensus in favor of waiting than they were at the May meeting. In both cases, the emphasis is on allowing more time to assess whether inflation pressures continue to broaden after the energy shock.
As a result, markets may focus less on the headline decision than on what comes next. A hold that signals another hike is only being delayed could limit downside in the Kiwi. Equally, a 25 basis point increase accompanied by softer forward guidance may fail to generate lasting gains. Investors will be looking for clues on how quickly the RBNZ expects policy to move back toward neutral rather than treating this week's decision in isolation.
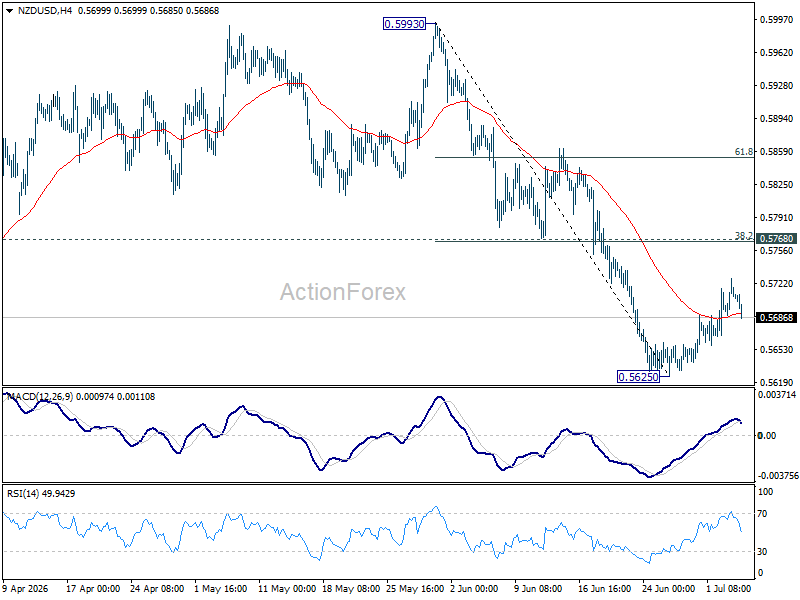
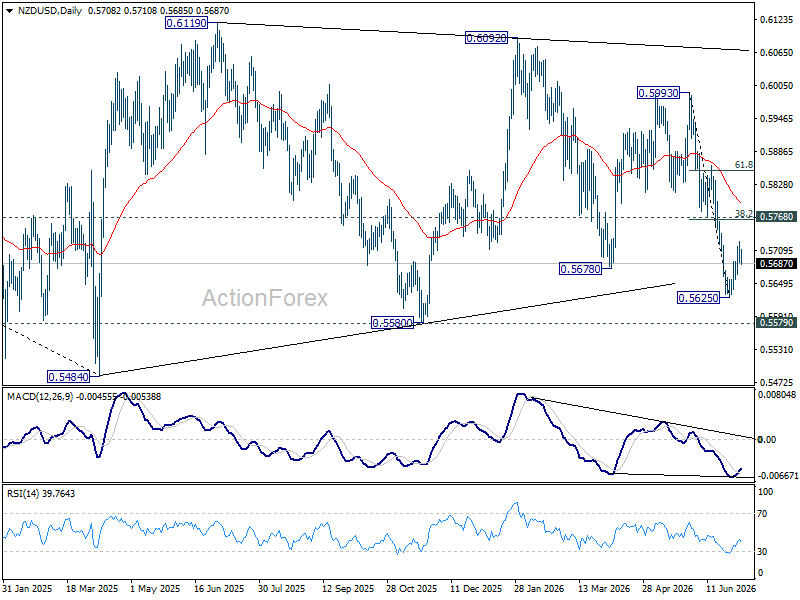
Technically, NZD/USD still looks vulnerable. The recovery from last week's lows was driven largely by broad-based Dollar weakness after the softer US employment report rather than a meaningful improvement in New Zealand's outlook. As long as 0.5768 cluster resistance (38.2% retracement of 0.5993 to 0.5625 at 0.5766) continues to cap rallies, the near-term bias stays tilted to the downside. A break below 0.5625 would resume the decline from 0.6092 towards 0.5579 structural support.
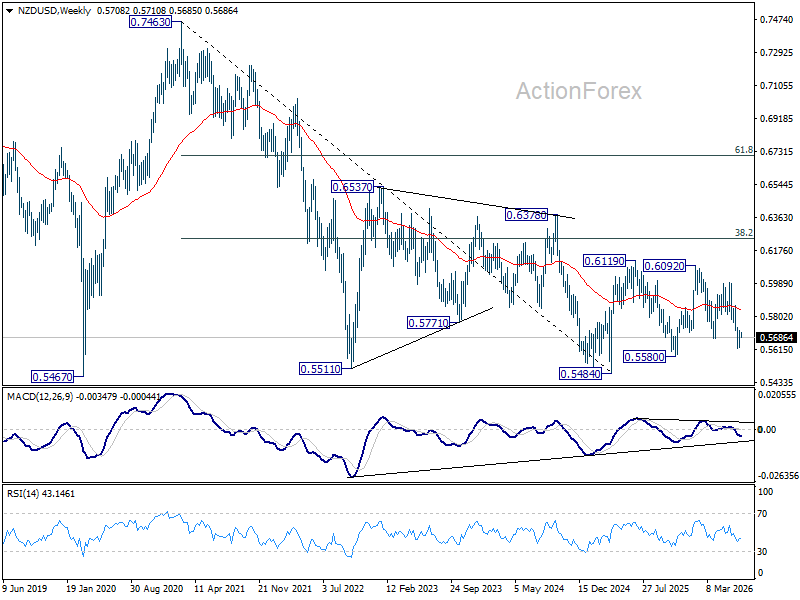
The longer-term chart tells a similar story. The price action from the 2025 low at 0.5484 continues to look corrective within the broader downtrend from the 2021 peak at 0.7463. While momentum has not yet confirmed a decisive bearish breakout, sustained trading below 0.5625 would suggest that correction has run its course and increase the likelihood of another test of the 2025 lows.
EUR/USD Recovery Faces a Tough Climb from Current Levels
Key Highlights
- EUR/USD started a recovery wave and tested the 1.1475 resistance.
- A rising channel is forming with support at 1.1395 on the 4-hour chart.
- GBP/USD started a recovery wave and climbed above 1.3300.
- USD/JPY found support near 160.60 and started a fresh increase.
EUR/USD Technical Analysis
The Euro found support near 1.1325 against the US Dollar. EUR/USD started a recovery wave above 1.1350 but faced many hurdles.
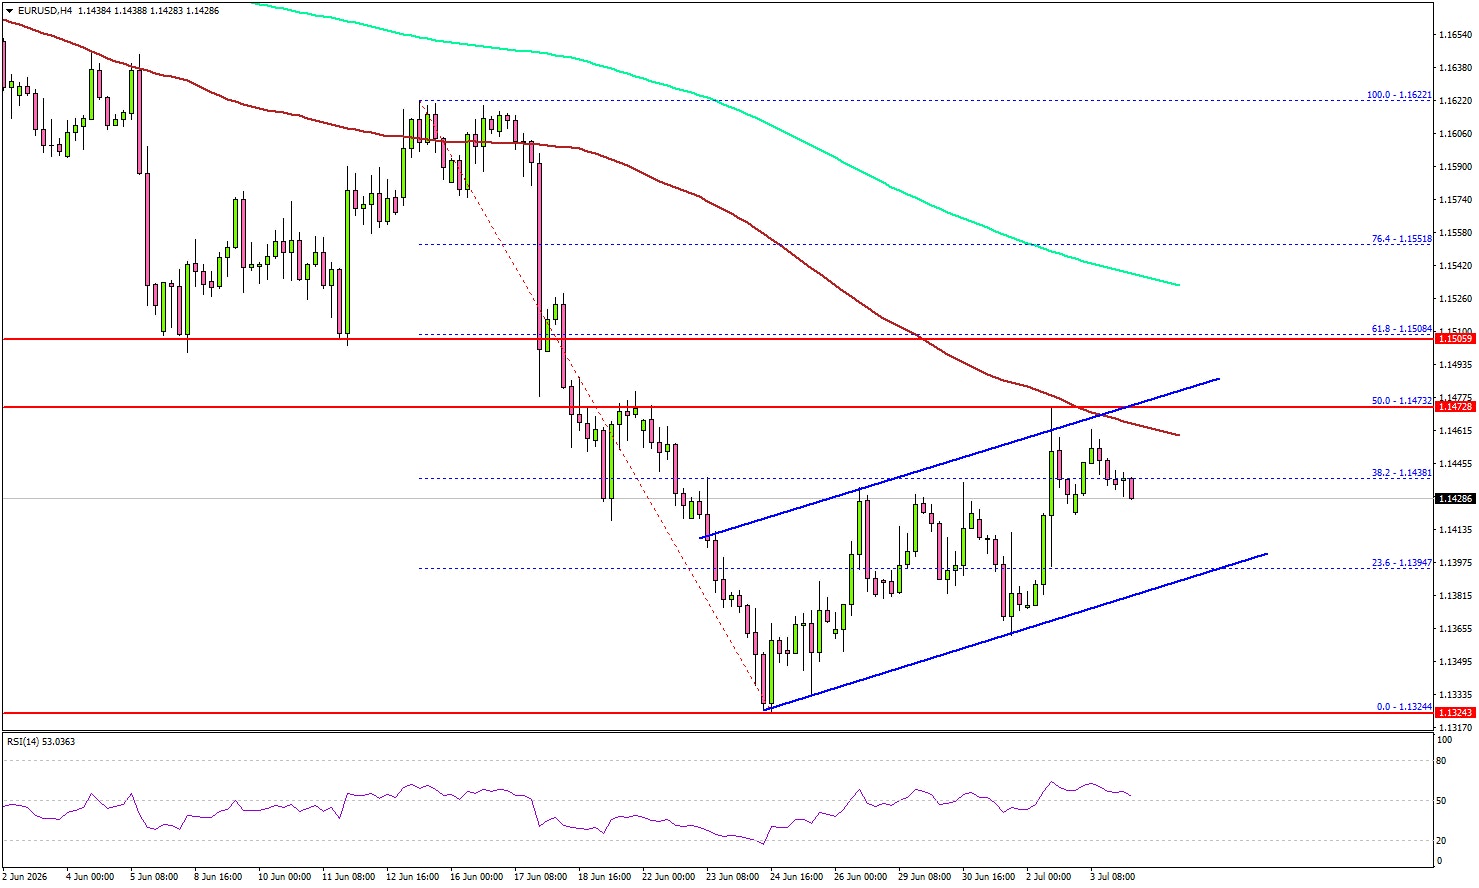
Looking at the 4-hour chart, the pair was able to surpass the 38.2% Fibonacci retracement level of the downward move from the 1.1672 swing high to the 1.1324 low. However, the bears remained active near the 1.1675 resistance and the 100 simple moving average (red, 4-hour).
The pair also faced rejection near the 50% Fib retracement level and started a fresh pullback. If there is another decline, the pair might find support near 1.1400.
Besides, there is a rising channel forming with support at 1.1395. The first major support could be near 1.1365. A downside break and close below 1.1365 might send the pair toward 1.1320. Any more losses could open the doors for a test of 1.1250.
On the upside, the bears might remain active near 1.1475. The next major resistance might be 1.1500. A close above 1.1500 could open the doors for a larger increase. In the stated case, the bulls could aim for a move to the 200 simple moving average (green, 4-hour) at 1.1540.
Looking at GBP/USD, the bulls attempted a recovery wave above 1.3300, but they could struggle near the 1.3385 resistance.
Upcoming Key Economic Events:
- Euro Zone Retail Sales for May 2026 (YoY) - Forecast +1.5%, versus +1.0% previous.
- Euro Zone Retail Sales for May 2026 (MoM) - Forecast +0.2%, versus -0.4% previous.
- US ISM Services Index for June 2026 – Forecast 54.2, versus 54.5 previous.
Following Weak U.S. Employment Data USD/JPY Volatility Rises
USD/JPY was the main focus for many traders last week, moving above 162 as markets tested the Japanese government’s willingness to intervene. Intervention warnings from Japanese officials, together with rumors that intervention may have started, triggered a quick retracement, although actual intervention was not confirmed.
The key economic data highlight of the week was the U.S. employment report, which came in weaker than expected, with the economy adding only 57,000 jobs in June. This marked a reversal from the recent trend of strong U.S. data, causing the U.S. dollar to weaken and gold to rise. The weaker jobs data also reduced expectations that the Fed may need to raise interest rates again, helping U.S. equities move higher.
In Japan, there was positive economic news as the Tankan survey showed sentiment among large manufacturers improved for a fifth consecutive quarter. The index rose to 22 from 17, its strongest reading since 2018. WTI crude oil was relatively quiet, continuing to test lower as there were no significant headlines to drive prices in either direction.
Markets This Week
U.S. Stocks
Although it was a quieter week due to the U.S. holiday on Friday, the Dow still managed to reach a fresh record high. Weaker-than-expected U.S. employment data lowered interest rate expectations, making stocks more attractive to investors. This week may also remain relatively quiet, but with the market still holding above the 10-day moving average, following the short-term uptrend appears to be the preferred strategy. Resistance levels are at 53,000 and 54,000. Support is seen at 52,000, 51,000, 50,000, 49,500 and 49,000.
Japanese Stocks
The Nikkei came under profit-taking pressure last week, moving back below the important 70,000 level. This was not unexpected given how strongly the market has rallied this year. USD/JPY was supportive at the start of the week as it moved higher, but when the pair later pulled back on fears of possible Japanese intervention, this also weighed on Japanese stocks. The outlook for Japanese equities remains broadly positive, but with the market now below the 10-day moving average, range-trading strategies may be more suitable this week. Resistance is seen at 70,000, 71,000, 72,000, 73,000, 74,000 and 75,000, while support is at 67,500, 66,500 and 65,000.
USD/JPY
USD/JPY started the week strongly, continuing its uptrend as traders focused on the interest rate gap between the U.S. and Japan. However, weaker U.S. employment data and signs that Japanese authorities may intervene without warning caused the pair to turn lower, breaking below the 10-day moving average and triggering a sharp move down on Thursday. Buyers returned near the lower levels, with support holding above 160, but the risks of buying USD/JPY have increased now that the pair is below the 10-day moving average and intervention concerns remain high. At the same time, the interest rate spread still supports the upside, so range trading may be the best approach this week in potentially volatile conditions. Resistance is at 162.00, 163.00 and 165.00, while support is seen at 161.00, 160.50, 160.00, 159.00, 158.00, 157.00, 156.00, 155.50 and 155.00.
Gold
Gold moved lower at the start of last week, once again testing below the $4,000 level as the recent downtrend continued on a stronger U.S. dollar and higher interest rate expectations. However, support held near $4,000 for the second time, forming a double bottom. Weaker-than-expected U.S. employment data then reduced rate hike expectations, which supported gold and pushed the market back above the 10-day moving average. The rebound from the lows was sharp, so some consolidation is possible this week. However, with support holding at $4,000, medium-term traders may look to focus on buying on weakness. Resistance is at $4,200, $4,300, $4,400, $4,500, $4,600 and $4,665, while support is at $4,100, $4,000, $3,900, and $3,800.
Crude Oil
Crude oil remained weak last week, with prices continuing to move lower in quiet market conditions. Traders still expect the Iran conflict to move toward a resolution, and there were no major headlines to support oil prices. The 10-day moving average is still moving lower, so the short-term trend remains bearish. Selling while prices stay below this level may remain the better strategy, but a move back above the 10-day moving average could lead to a quick rebound if new risks from Iran appear. Resistance is at $75, $85, $90, $95 and $100, while support is at $67.50, $65, and $60.
Bitcoin
Bitcoin held recent support early last week before moving higher after weaker-than-expected U.S. employment data lowered interest rate expectations. This was positive for Bitcoin and helped prices move back above the 10-day moving average, breaking the recent short-term downtrend. Overall, the market remains in a range between $55,000 and $65,000, so range trading still appears to be the preferred strategy. However, given how far prices have fallen over the past couple of months, medium-term traders may also look to buy on weakness. Resistance is at $65,000, $75,000, $80,000, $85,000, and $90,000, while support is at $60,000, $55,000 and $50,000.
This Week’s Focus
- Monday: E.U. HCOB Eurozone Construction PMI, U.K. S&P Global Construction PMI, E.U. PPI and Retail Sales, U.S. S&P Global Services PMI and ISM Non-Manufacturing PMI
- Tuesday: Japan Household Spending, U.K. Halifax House Price Index and BoE MPC Meeting Minutes, U.S. Trade Balance
- Wednesday: Japan Current Account, Australia Building Approvals, U.S. FOMC Meeting Minutes
- Thursday: China CPI and PPI, U.S. Existing Home Sales
- Friday: Japan PPI
The week after U.S. employment data is usually quieter, with fewer important data releases. This week, traders may focus on the latest Federal Reserve meeting minutes for clues about future interest rate policy under the new Fed chairman. USD/JPY may also remain volatile as the risk of Japanese intervention to support the yen stays high.
Eco Data 7/6/26
| GMT | Ccy | Events | Act | Cons | Prev | Rev |
|---|---|---|---|---|---|---|
| 01:00 | AUD | TD-MI Inflation Gauge M/M Jun | -0.40% | -0.30% | ||
| 06:00 | EUR | Germany Factory Orders M/M May | 1.90% | 1.10% | -3.80% | |
| 08:00 | CHF | Unemployment Rate Jun | 3.10% | 3.10% | 3.10% | |
| 08:30 | EUR | Eurozone Sentix Investor Confidence Jul | -3.1 | -8.9 | -13.4 | |
| 08:30 | GBP | Construction PMI Jun | 38.4 | 40.1 | 38.2 | |
| 09:00 | EUR | Eurozone Retail Sales M/M May | 0.20% | 0.20% | -0.40% | |
| 09:00 | EUR | Eurozone PPI M/M May | 0.20% | 0.20% | 0.60% | 0.70% |
| 09:00 | EUR | Eurozone PPI Y/Y May | 5.90% | 5.70% | 4.90% | 5.00% |
| 13:45 | USD | Services PMI Jun F | 51.2 | 51.4 | 51.3 | |
| 14:00 | USD | ISM Services PMI Jun | 54 | 54.2 | 54.5 | |
| 14:00 | USD | ISM Services Prices Paid Jun | 67.7 | 71.3 | ||
| 14:00 | USD | ISM Services Employment Index Jun | 51.2 | 47.9 |
| 01:00 | AUD |
| TD-MI Inflation Gauge M/M Jun | |
| Actual | -0.40% |
| Consensus | |
| Previous | -0.30% |
| 06:00 | EUR |
| Germany Factory Orders M/M May | |
| Actual | 1.90% |
| Consensus | 1.10% |
| Previous | -3.80% |
| 08:00 | CHF |
| Unemployment Rate Jun | |
| Actual | 3.10% |
| Consensus | 3.10% |
| Previous | 3.10% |
| 08:30 | EUR |
| Eurozone Sentix Investor Confidence Jul | |
| Actual | -3.1 |
| Consensus | -8.9 |
| Previous | -13.4 |
| 08:30 | GBP |
| Construction PMI Jun | |
| Actual | 38.4 |
| Consensus | 40.1 |
| Previous | 38.2 |
| 09:00 | EUR |
| Eurozone Retail Sales M/M May | |
| Actual | 0.20% |
| Consensus | 0.20% |
| Previous | -0.40% |
| 09:00 | EUR |
| Eurozone PPI M/M May | |
| Actual | 0.20% |
| Consensus | 0.20% |
| Previous | 0.60% |
| Revised | 0.70% |
| 09:00 | EUR |
| Eurozone PPI Y/Y May | |
| Actual | 5.90% |
| Consensus | 5.70% |
| Previous | 4.90% |
| Revised | 5.00% |
| 13:45 | USD |
| Services PMI Jun F | |
| Actual | 51.2 |
| Consensus | 51.4 |
| Previous | 51.3 |
| 14:00 | USD |
| ISM Services PMI Jun | |
| Actual | 54 |
| Consensus | 54.2 |
| Previous | 54.5 |
| 14:00 | USD |
| ISM Services Prices Paid Jun | |
| Actual | 67.7 |
| Consensus | |
| Previous | 71.3 |
| 14:00 | USD |
| ISM Services Employment Index Jun | |
| Actual | 51.2 |
| Consensus | |
| Previous | 47.9 |
EUR/USD Weekly Outlook
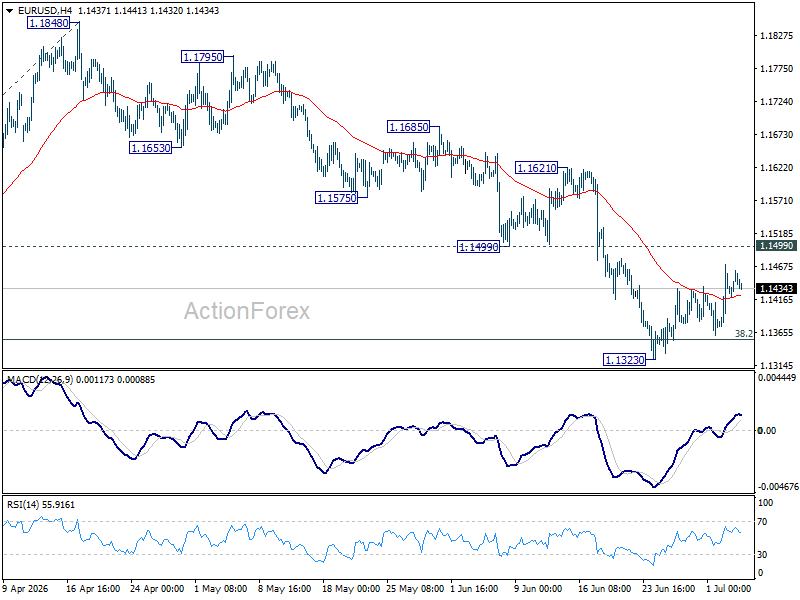
EUR/USD stayed in consolidations above 1.1323 last week and outlook is unchanged. Initial bias remains neutral this week. With 1.1499 support turned resistance intact, further decline is expected. On the downside, break of 1.1323 will resume the fall from 1.2081 to 100% projection of 1.2081 to 1.1408 from 1.1848 at 1.1175. However, decisive break of 1.1499 will turn bias back to the upside for 55 D EMA (now at 1.1559) and above.
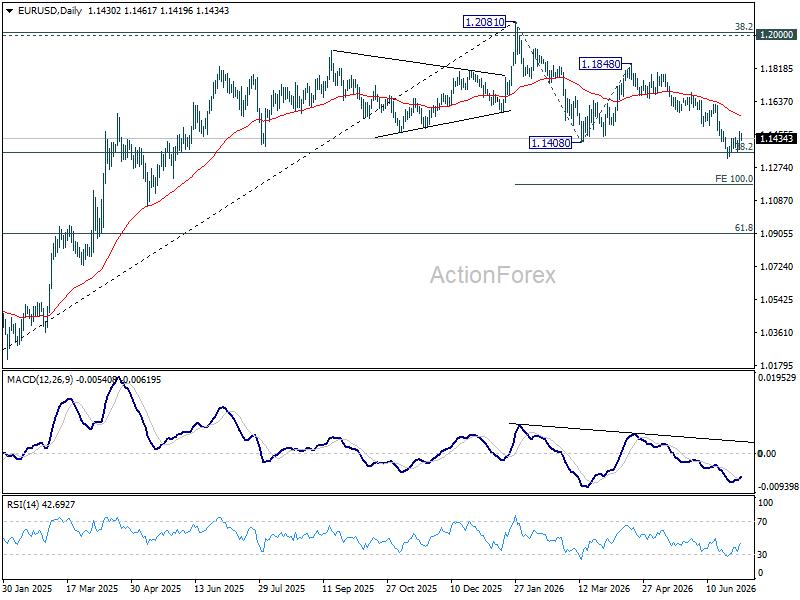
In the bigger picture, focus is back on 38.2% retracement of 1.0176 to 1.2081 at 1.1353. Decisive break there will revive the case of medium term bearish trend reversal after rejection by 1.2 key cluster resistance level. Further fall should be seen to 61.8% retracement at 1.0904. Nevertheless, strong rebound from 1.1353, followed by break of 1.1621 resistance, will retain medium term bullishness.
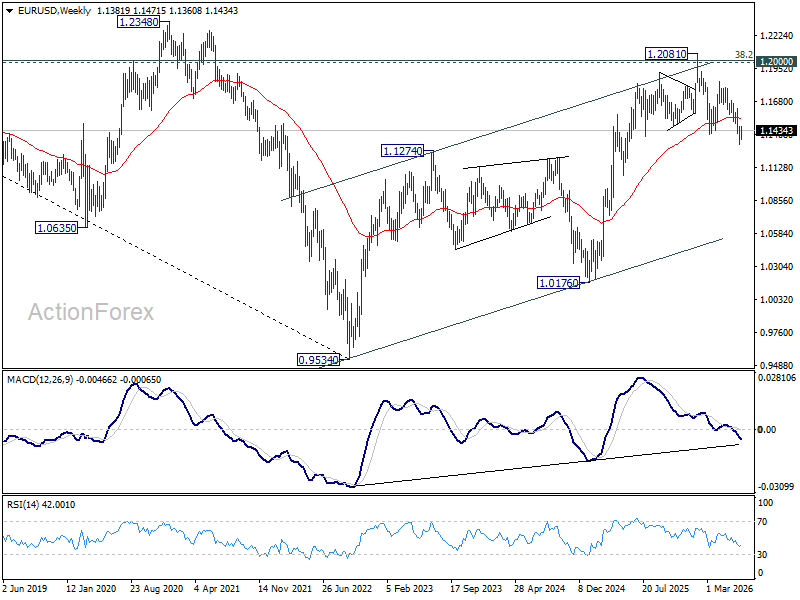
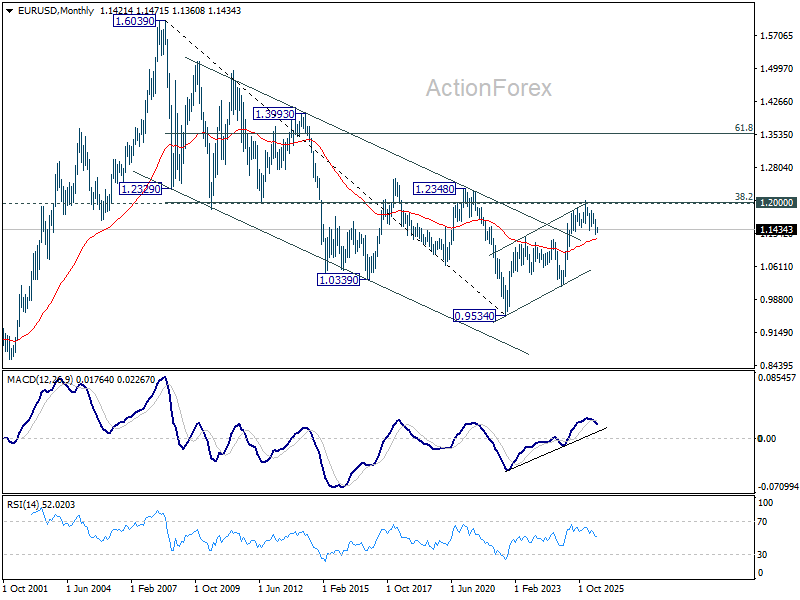
In the long term picture, 38.2% retracement of 1.6039 to 0.9534 at 1.2019, which is close to 1.2000 psychological level is the key for the outlook. Rejection by this level will keep the multi decade down trend from 1.6039 (2008 high) intact, and keep outlook neutral at best. However, decisive break of 1.2000/19, will suggest long term bullish trend reversal, and target 61.8% retracement at 1.3554.
USD/JPY Weekly Outlook
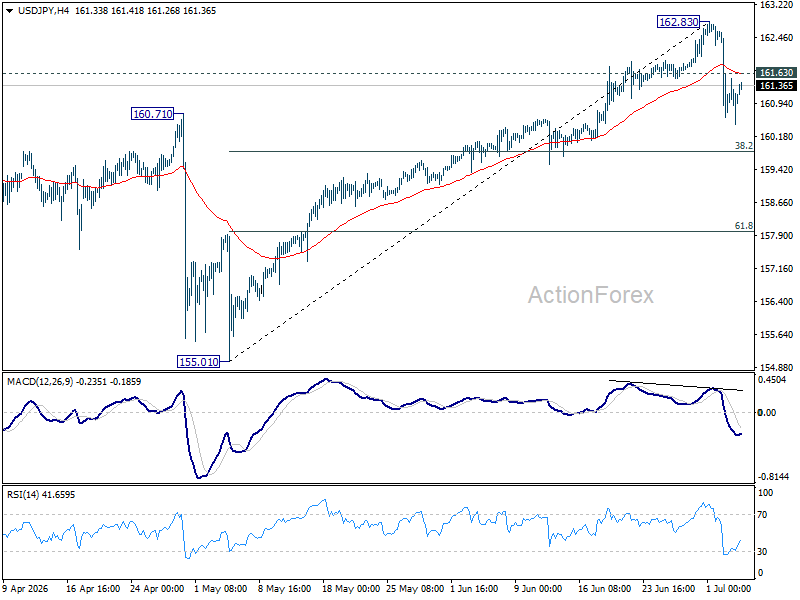
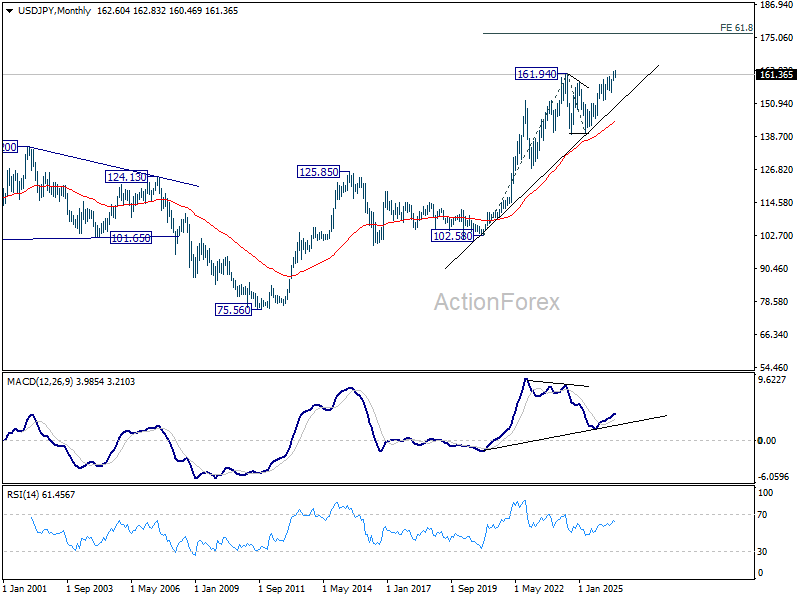
USD/JPY's steep pullback last week confirms short term topping at 162.83. Initial bias stays mildly on downside this week for 38.2% retracement of 155.01 to 162.83 at 159.84. Since this level is close to 55 D EMA (now at 160.00), strong support should be seen from there to bring rebound. On the upside, above 161.63 minor resistance will turn intraday bias neutral. Overall, consolidations should continue below 162.83 for a while.
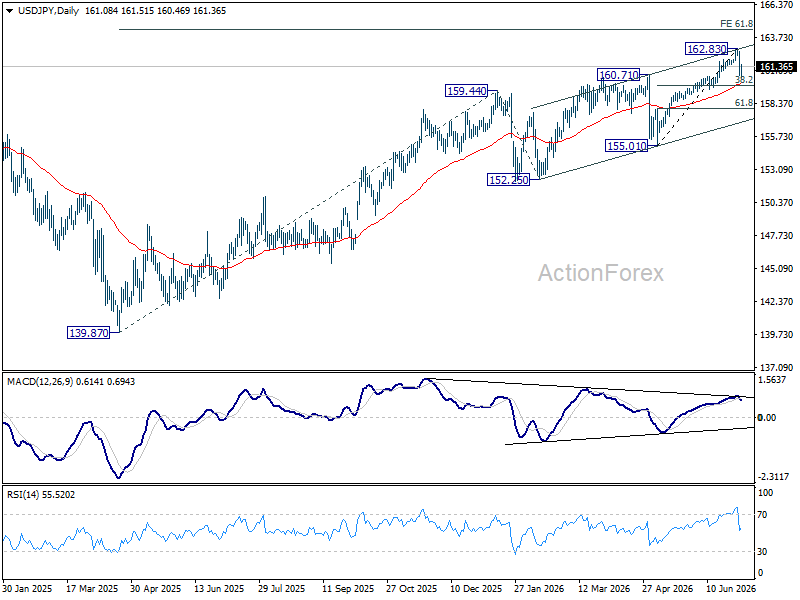
In the bigger picture, rise from 139.87 (2025 low) is seen as another rising leg of the long term up trend. Next target is 61.8% projection of 139.87 to 159.44 from 152.25 at 164.34. For now, outlook will remain bullish as long as 155.01 support holds, even in case of deep pullback.
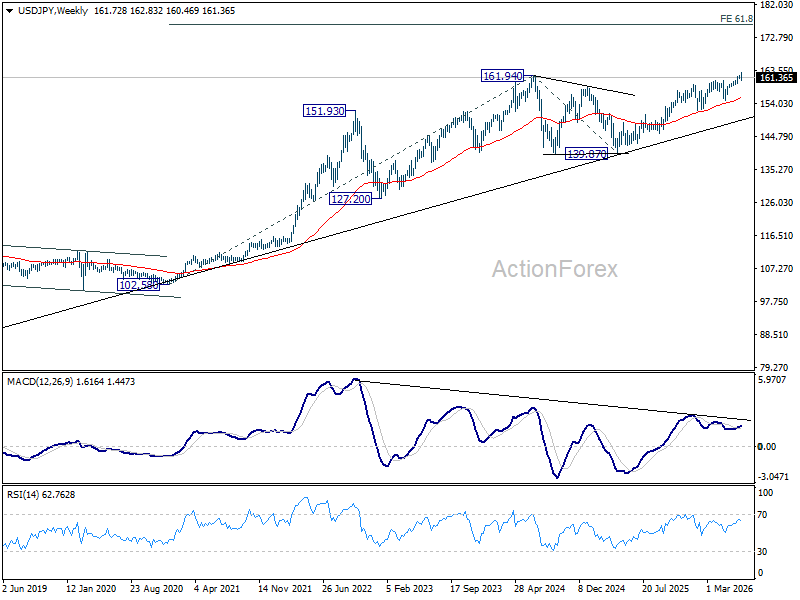
In the long term picture, up trend from 75.56 (2011 low) is still in progress and might be ready to resume. Firm break of 161.94 will target 61.8% projection of 102.58 (2020 low) to 161.94 (2024 high) from 139.87 at 176.55 in the medium term. Long term outlook will stay bullish as long as 139.87 support holds, even in case of deep pullback.
GBP/USD Weekly Outlook
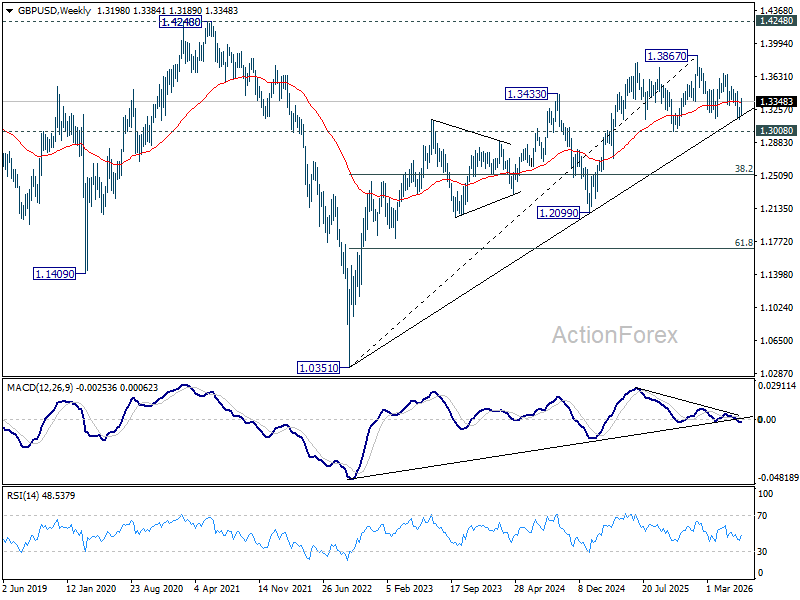
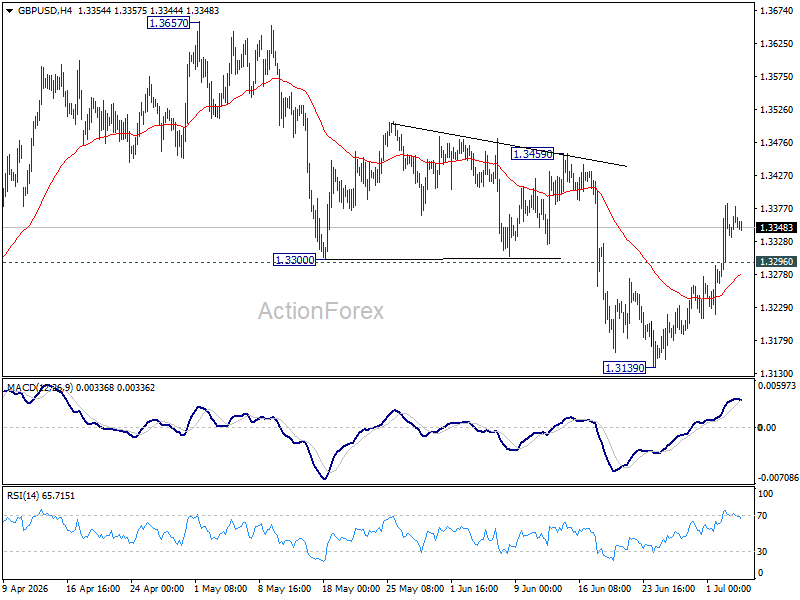
GBP/USD's strong rally last week confirms short term bottoming at 1.3139. Initial bias stays on the upside this week for 1.3459 resistance. Firm break there will argue that whole correction from 1.3867 has completed, and target 1.3657 resistance for confirmation. On the downside, below 1.3296 minor support will turn intraday bias neutral again first.
In the bigger picture, price actions from 1.3867 are a corrective pattern within the broader up trend from 1.0351 (2022 low). With 1.3008 support intact, medium term bullishness is maintained and break of 1.3867 is in favor for a later stage, towards 1.4248 key resistance (2021 high). However, firm break of 1.3008 will at least bring deeper fall to 38.2% retracement of 1.0351 to 1.3867 at 1.2524, with increased risk of bearish reversal.
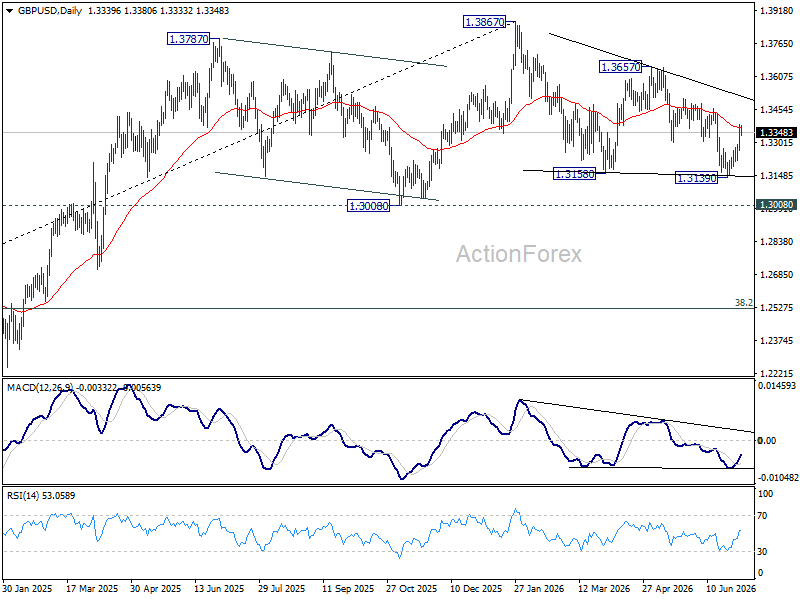
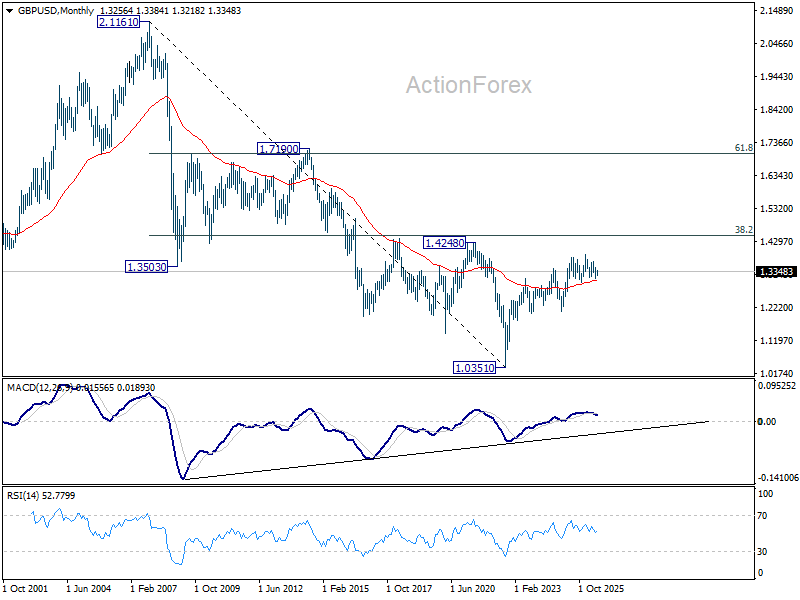
In the long term picture, as long as 1.4248/4480 resistance zone holds (38.2% retracement of 2.1161 to 1.0351 at 1.4480), the long term outlook will remain bearish. That is, price actions from 1.0351 are seen as a corrective pattern to down trend from 2.1161 (2007 high) only. Nevertheless, decisive break of 1.4248/4480 will be a strong sign of long term bullish reversal.