
Sample Category Title
EUR/USD Analysis: Who Is in Control?
Two central banks, two hawkish tones — but only one dollar just took a hit. The ECB delivered a 25bp hike in June, its first since 2023, lifting the deposit rate to 2.25% as Middle East-driven energy costs pushed headline inflation to 3.2% in May before easing to 2.8% in June, with growth downgraded to 0.8% amid weaker confidence.
The Fed, under new Chair Kevin Warsh, held rates at 3.50%-3.75% for a fourth straight meeting, with a hawkish dot-plot shift initially fueling hike expectations. However, the June employment report—released on July 3rd—showed nonfarm payrolls rising by just 57K against 110K expected, the weakest reading in four months, while the unemployment rate dipped to 4.2% only due to a labor force participation rate falling to 61.5%, its lowest level in five years.
The result: both central banks' communications currently lean hawkish, but with the Fed's data now sending mixed signals. Which side ultimately prevails could well set the tone for EUR/USD's trend into year-end.
EUR/USD Technical Analysis
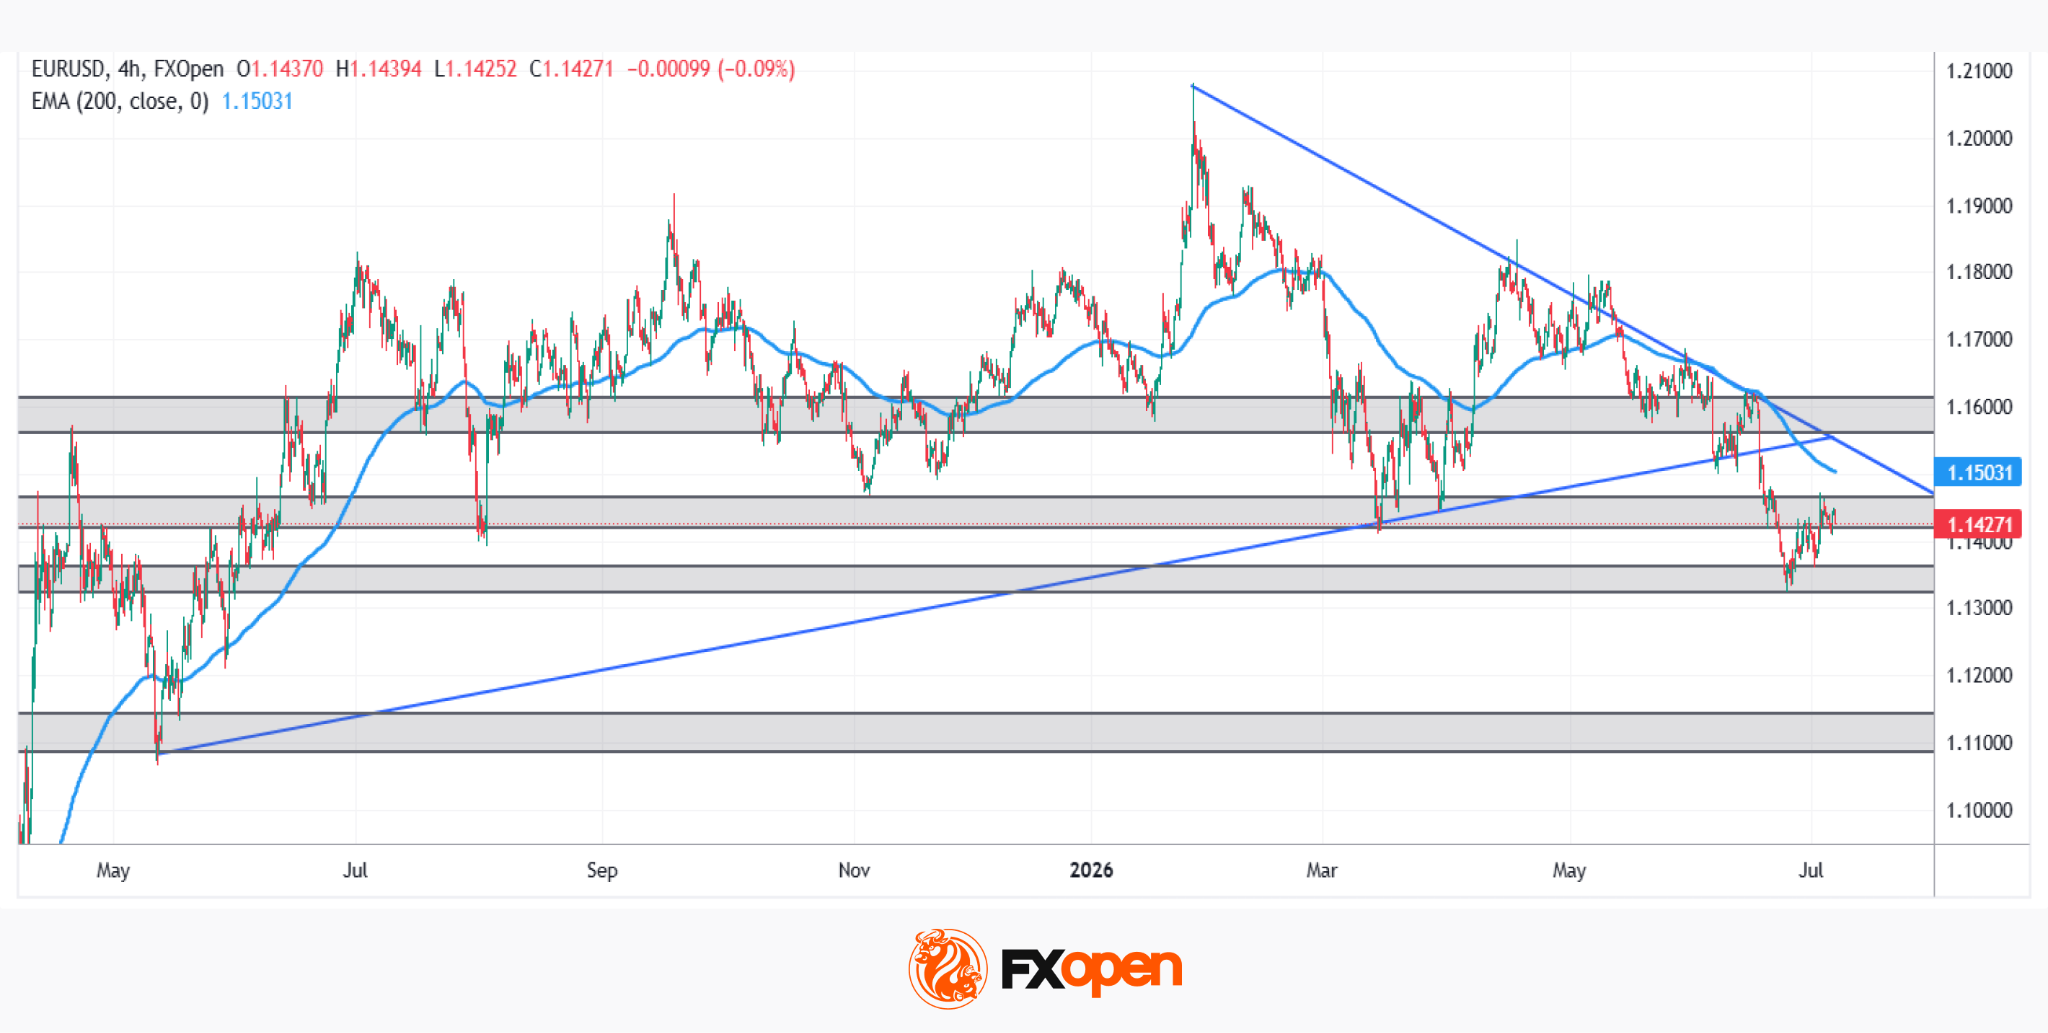
EUR/USD has spent roughly the past year confined within a broad consolidation range, as the chart illustrates, with price repeatedly oscillating between well-defined boundaries and no decisive breakout sustained in either direction.
Bullish Scenario
After briefly breaking below the range's base support, price snapped back quickly, reclaiming the range almost as fast as it left it. For renewed bullish momentum to take hold, EUR/USD first needs to hold above the 1.1420-1.1460 support zone. The next, more decisive test lies with the descending trendline originating from January's highs, which has been respected consistently throughout the year. This same area also converges with the 200-period EMA and the long-term ascending trendline broken to the downside in June. This confluence makes 1.1500-1.1550 the pivotal zone: a clean break above it would open the door for the euro to regain sustained strength against the dollar.
Bearish Scenario
The alternative reading is that price is currently only retesting the previously broken key support at 1.1420-1.1460. A decisive break below the low formed near 1.1320-1.1350 would confirm renewed downside momentum, clearing the path to resume the broader medium-term downtrend, where the next significant support comes into play around 1.1100-1.1150.
Either scenario will likely require confluence between technical structure and fundamentals, with central bank rhetoric and action remaining the key driver. ECB or Fed — which one becomes the catalyst for EUR/USD's next major trend?
Trade over 50 forex markets 24 hours a day with FXOpen. Take advantage of low commissions, deep liquidity, and spreads from 0.0 pips (additional fees may apply). Open your FXOpen account now or learn more about trading forex with FXOpen.
This article represents the opinion of the Companies operating under the FXOpen brand only. It is not to be construed as an offer, solicitation, or recommendation with respect to products and services provided by the Companies operating under the FXOpen brand, nor is it to be considered financial advice.
ECB’s Panetta: Fragile Outlook Means No Predetermined Path for Rates
European Central Bank Governing Council member Fabio Panetta said the Eurozone economy continues to face a delicate balance between persistent inflation risks and weakening growth, arguing that policymakers should avoid committing to any predetermined path for interest rates. "The outlook remains fragile. Upside risks to inflation continue to coexist with downside risks to growth," he said, underscoring the high degree of uncertainty surrounding the policy outlook.
Panetta argued that such an environment requires policymakers to remain flexible and closely monitor a broad range of indicators. He said the ECB must keep a close watch on geopolitical developments, energy markets, supply chains, wage growth and inflation expectations, adding that monetary policy should "avoid committing to a predetermined path." While acknowledging that the recent easing in oil prices following US-Iran negotiations could prove more favorable than the ECB assumed in its June projections, he stressed that the overall outlook remains too uncertain to justify firm forward guidance.
Looking beyond the immediate outlook, Panetta described the global economy as entering a "Great Reconfiguration," driven by geopolitical fragmentation, artificial intelligence, digital finance, demographic change and climate risks. Against that backdrop, he defended the ECB's June rate decision as "robust across a range of scenarios," suggesting policymakers believe flexibility rather than pre-commitment will remain the most appropriate approach as they assess incoming data ahead of future meetings.
Gold: Does It Have the Momentum to Set New Records?
- The Fed’s rate hike expectations limit gold’s rally potential.
- Capital inflows into ETFs and central bank purchases are supporting the gold price.
The US dollar failed to capitalise on the escalation of the conflict in the Middle East. Reports of a tanker incident in the Strait of Hormuz are putting US-Iran negotiations at risk. Nevertheless, Brent crude rose only slightly, while the resumption of the S&P 500 rally and the associated improvement in global risk appetite are undermining the greenback’s position.
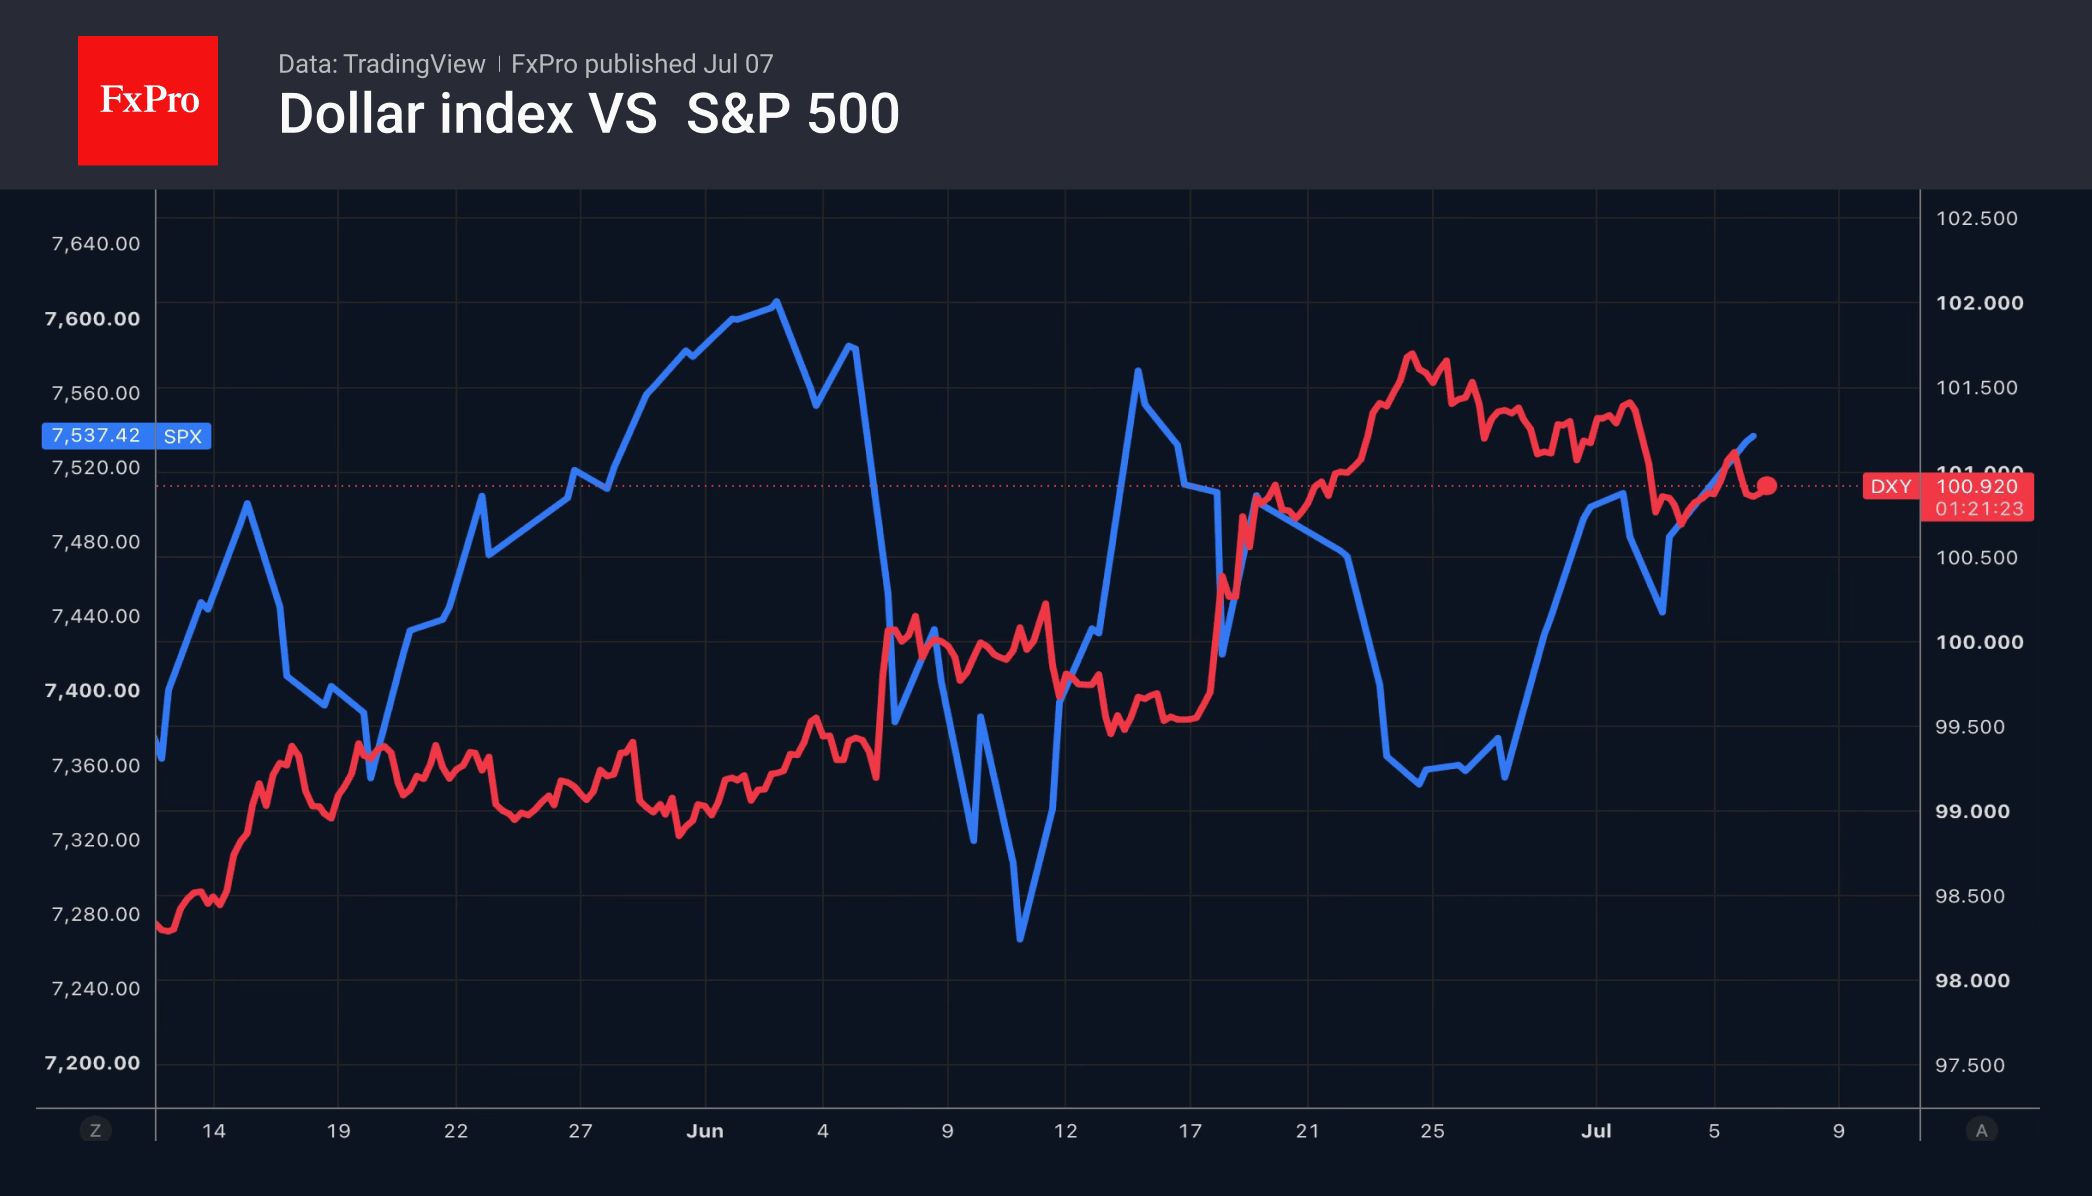
The futures market is pricing in a 3-in-4 chance of a Fed rate hike in 2026. This is allowing speculators to build up net long positions in the US dollar to their highest levels since 2015, leaving the US currency’s positions vulnerable. No sooner had Kevin Warsh adopted less hawkish rhetoric in Sintra than the markets had anticipated, and the employment figures disappointed, than the EURUSD soared sharply.
Lower chances of a Fed rate hike have allowed gold to find its footing. However, the Sword of Damocles (a potential federal funds rate hike due to persistent inflation) continues to hang over the precious metal. As the risks of an energy shock have receded, the inflationary nature of massive investments in artificial intelligence and weather-related supply chain disruptions remains a reality.
Fears that the Federal Reserve will tighten monetary policy are unlikely to allow gold to return to its record highs in 2026. However, HSBC remains optimistic, expecting that medium-term demand for gold as a means of diversifying investment portfolios, capital inflows into ETFs and increased purchases of bullion by central banks will allow the precious metal to rise.
Indeed, according to the World Gold Council, central banks increased their reserves by 41 tonnes in May, stepping up their bullion purchases. Poland and China were the most active. Since the start of the year, Poland has bought 64 tonnes, Uzbekistan 33 tonnes, China 25 tonnes and Kazakhstan 20 tonnes.
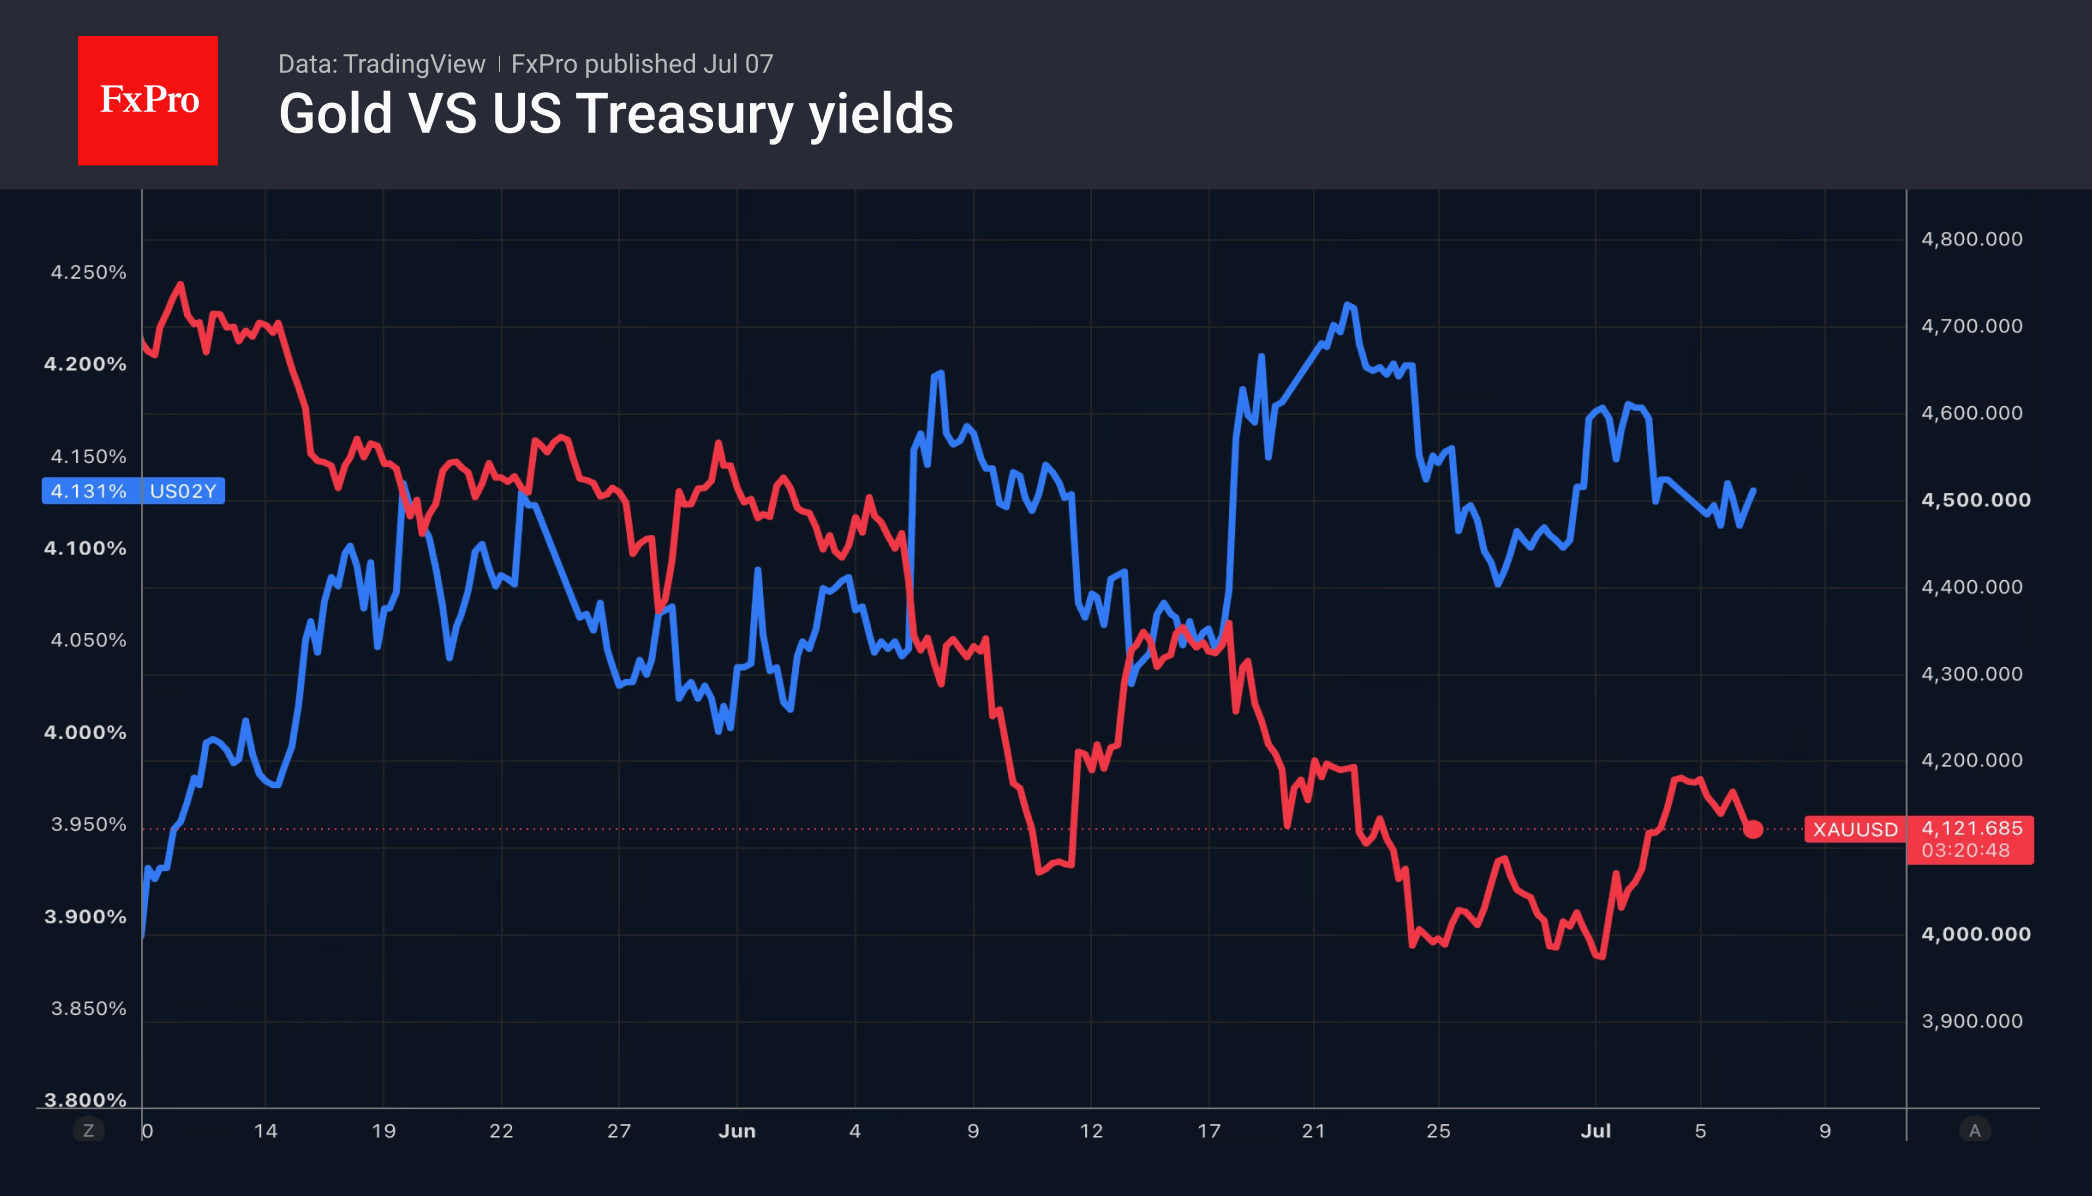
HSBC believes that, in the short term, gold will come under pressure due to the strong US dollar and high yields on US Treasury bonds. In reality, its fate depends on the futures market’s reassessment of the trajectory of the federal funds rate. In this regard, clues from the minutes of the June FOMC meeting are certain to influence gold.
The FxPro Analyst Team
Yen Still Under Pressure: Markets Await Action from Authorities
USD/JPY is holding near 161.84 on Tuesday, with the yen close to 40-year lows. Pressure on the Japanese currency remains as market participants continue to bet against it, with no visible currency interventions from Japanese authorities having materialised.
At the same time, investors are closely monitoring potential action from Tokyo. Japanese Finance Minister Satsuki Katayama reiterated that authorities stand ready to enter the foreign exchange market if necessary. She also noted that Tokyo and Washington maintain close consultations on currency policy matters. However, the market remains sceptical that interventions alone – without a shift in monetary policy – can provide lasting support for the yen.
Additional pressure on the Japanese currency comes from expectations of further expansion in budget spending and the Bank of Japan's slow pace of policy normalisation.
Published economic data were mixed. Nominal wages rose 3.2% year-on-year in May, but household spending fell 0.4%, pointing to continued weakness in domestic demand.
Technical Analysis
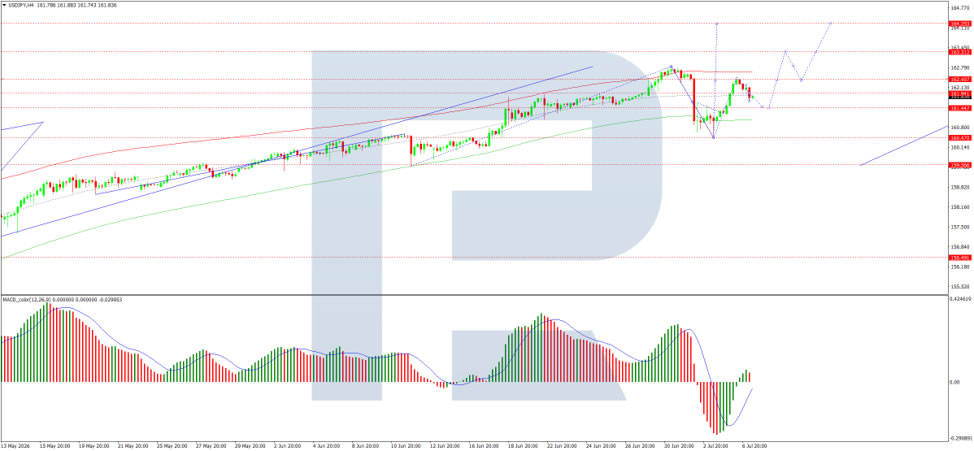
On the H4 chart, USD/JPY is trading within a consolidation range around 161.92 and, following a downside breakout, is moving lower towards 161.44. This level is expected to be reached today, followed by a rebound towards 162.55. The MACD indicator supports this scenario, with its signal line below zero and pointing firmly downwards, reflecting continued bearish momentum.
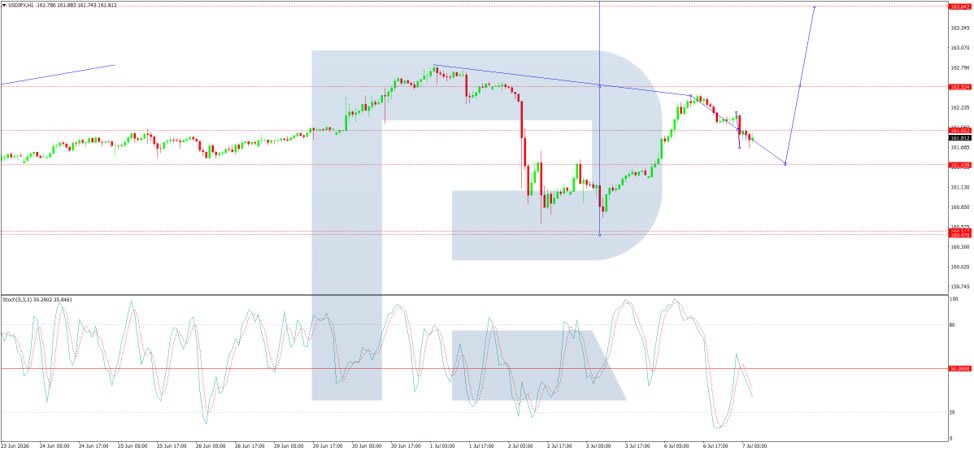
On the H4 chart, USD/JPY is trading within a consolidation range around 161.92 and, following a downside breakout, is moving lower towards 161.44. This level is expected to be reached today, followed by a rebound towards 162.55. The MACD indicator supports this scenario, with its signal line below zero and pointing firmly downwards, reflecting continued bearish momentum.
Conclusion
The yen remains under pressure, trading near 40-year lows as markets continue to bet against the currency in the absence of actual intervention from Japanese authorities. While Finance Minister Katayama has reiterated readiness to act and confirmed close coordination with Washington, market participants remain doubtful that intervention alone can reverse the yen's trajectory without accompanying monetary policy shifts. Mixed domestic data – rising nominal wages but falling household spending – highlight ongoing weakness in demand. Technically, USD/JPY may see a modest pullback towards 161.44 in the near term. However, the broader outlook for the yen remains negative, with further expansion in fiscal spending and the Bank of Japan's gradual approach likely to keep the currency under pressure.
Bitcoin Passed a Key Stress Test, Now Comes the Hard Part
Bitcoin may have delivered one of its most encouraging signals in weeks, but it was not the rebound itself that mattered. Instead, it was the market's ability to absorb heavy institutional selling without extending its decline. After briefly falling below USD 58,000 last week, Bitcoin quickly reclaimed the USD 60,000 level and still finished the week higher despite one of its largest corporate holders reducing its position.
The key event came from Strategy, which disclosed that it sold 3,588 Bitcoin for net proceeds of approximately USD 216 million, reducing its holdings to 843,775 BTC. Under normal circumstances, a sale of that magnitude would be expected to weigh on market sentiment and prices. Instead, Bitcoin stabilized and recovered, suggesting demand was sufficient to absorb the additional supply.
That resilience offers an important message about market positioning. If a large, well-telegraphed institutional sale cannot push prices materially lower, it suggests the pool of marginal sellers below current levels has become much smaller. Much of the forced liquidation and leverage-driven selling that dominated recent weeks may already have been flushed out, allowing the market to begin establishing a near-term base around the USD 58,000 area.
However, that should not be confused with confirmation of a durable market bottom. On-chain analysis of long-term holder realized losses indicates that supply held at a loss has reached levels typically associated with deep bear markets, but not yet the degree of capitulation historically seen near major cycle lows. In other words, the market may have exhausted its short-term selling pressure without completing the broader cleansing process that often accompanies the end of a bear cycle.
That distinction suggests Bitcoin could enter a period of consolidation rather than a new up trend. With forced selling appearing to ease and large institutional supply being absorbed, downside momentum may slow. But without stronger evidence of renewed long-term accumulation, buyers may also struggle to generate the conviction needed for a lasting breakout.
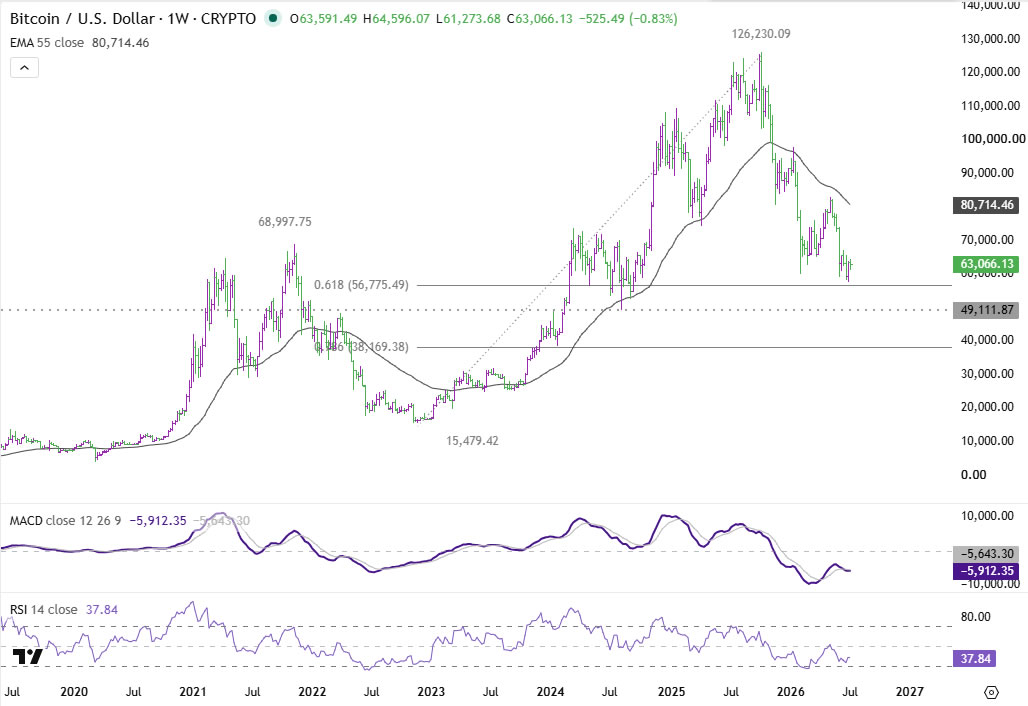
Technically, the long term Fibonacci level, 61.8% retracement of 15,479 (2022 low) to 126230 (2025 high) at 56,775 is providing the needed support for Bitcoin to prevent deeper selloff for now. The market's ability to defend that area reinforces the view that downside momentum is fading, at least in the near term.
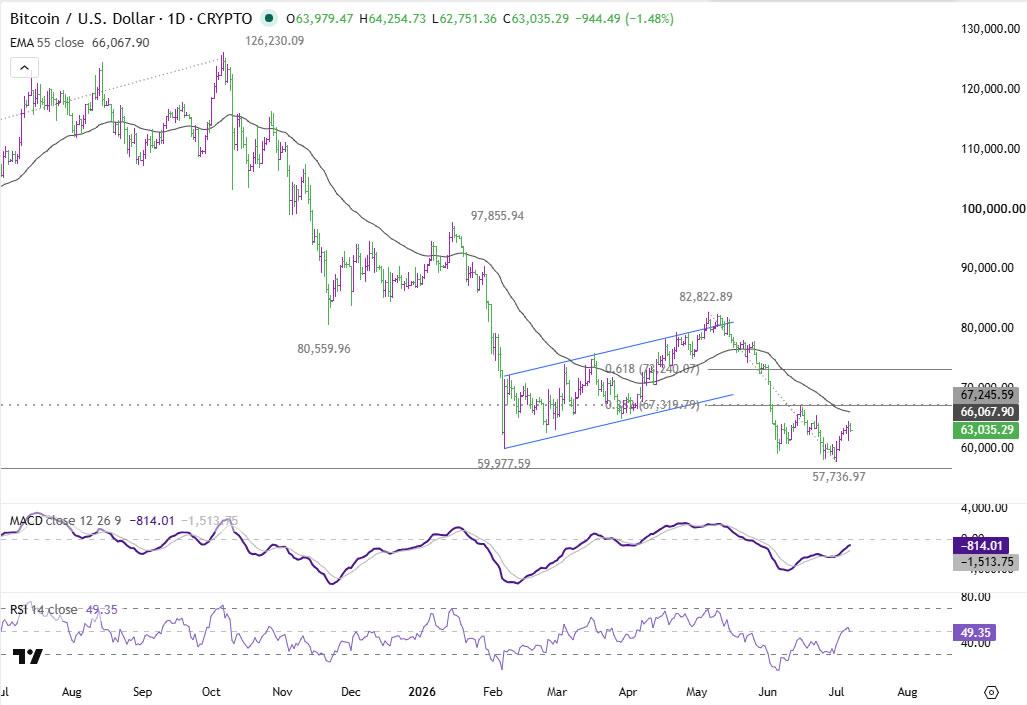
However, for the recovery to become technically more convincing, Bitcoin would need to break decisively above the 66,069 resistance zone, which also coincides with the 38.2% retracement of 82,822 to 57,736 at 67,319. Such a move would provide the first meaningful indication that a near-term bullish reversal is developing.
Until then, price action is more likely to represent a broad consolidation phase before another test of the 56,775 support later in the cycle.
Gold Resumes Its Advance Following the US Labour Market Report
Gold is attempting to break its medium-term trend, with the latest US labour market data acting as the main catalyst. The US employment report released on 2 July came in noticeably weaker than expected, with the pace of hiring slowing to its lowest level in several months. This may have dampened expectations of a near-term Federal Reserve rate hike, while the minutes of the Fed's June meeting, due to be released on 8 July, could provide further insight into how long this pause in the central bank's rhetoric is likely to last. For now, markets are pricing in a more dovish scenario, supporting safe-haven assets such as gold.
Technical Analysis
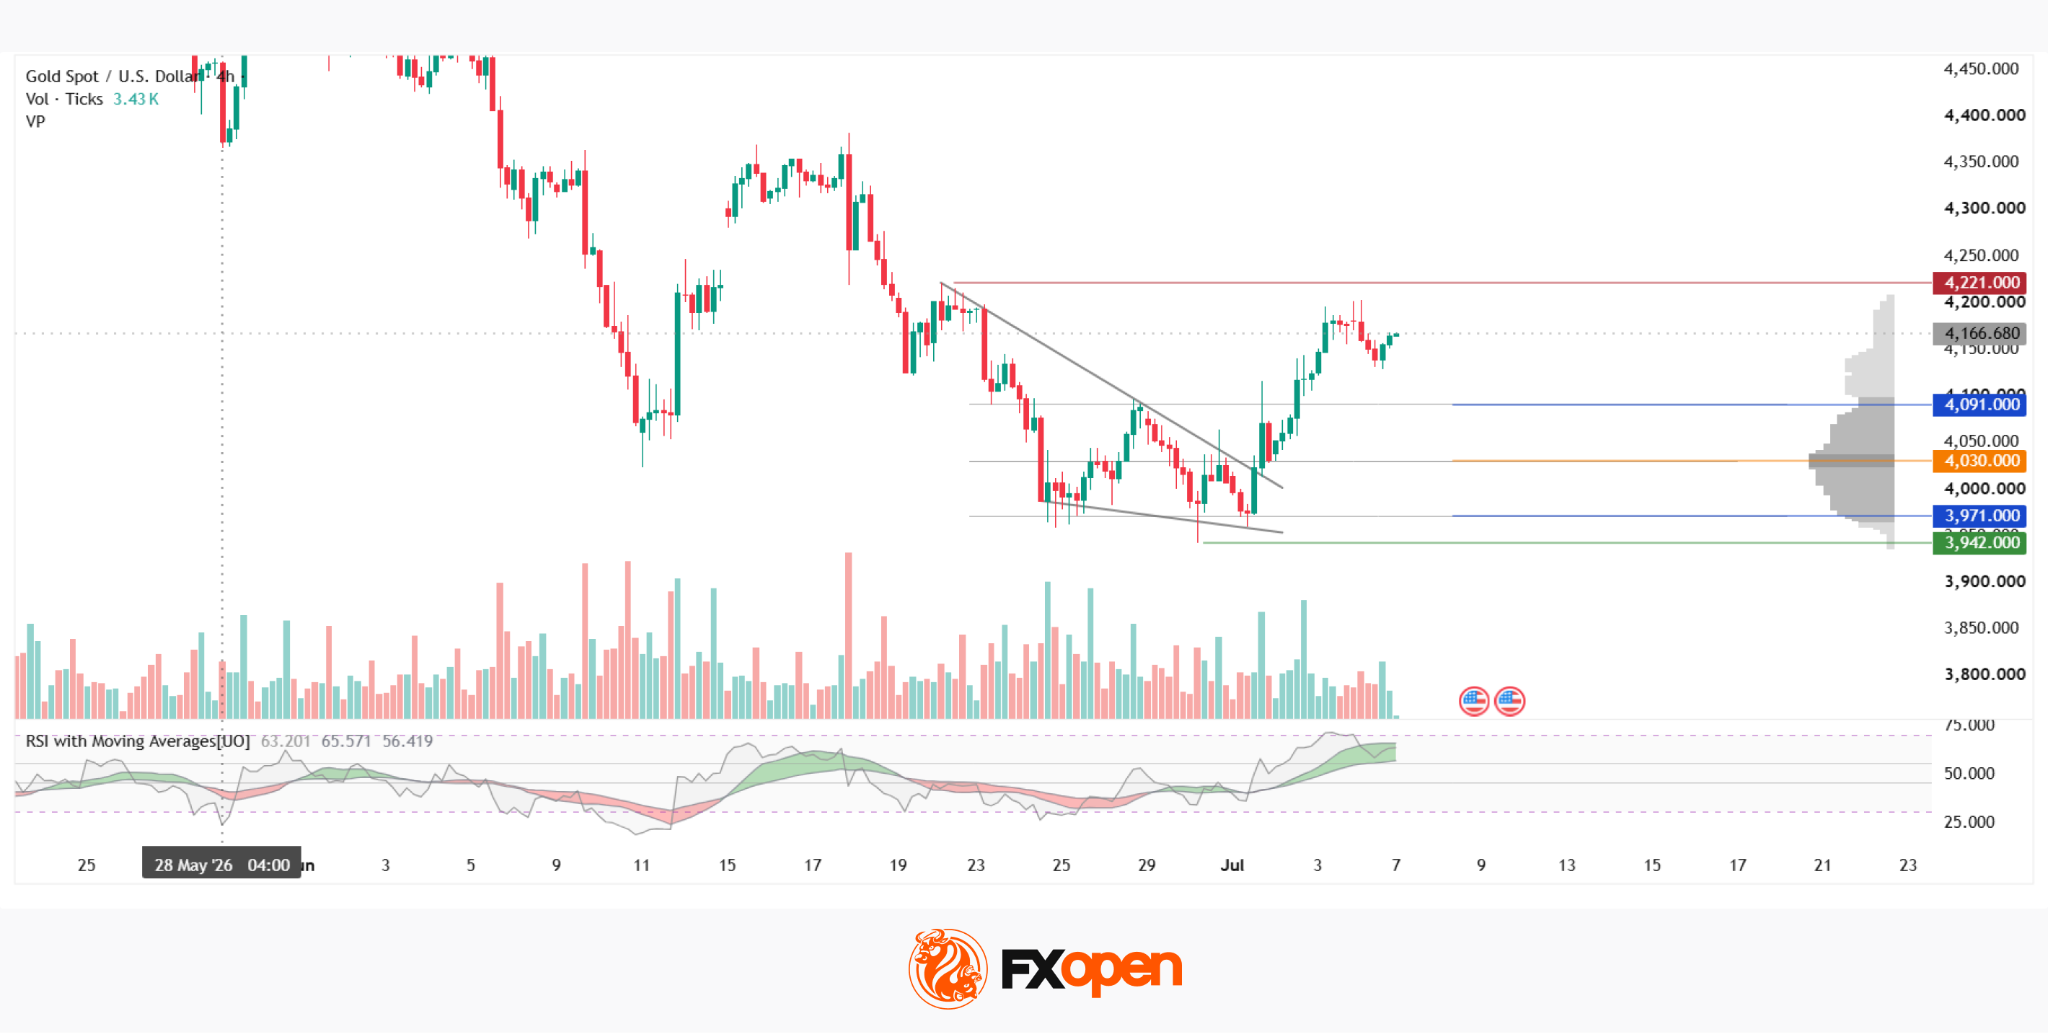
On the four-hour chart, XAU/USD declined from the $4,221 area in late June to around $3,942, where a recovery began. The decline formed a descending wedge, with its lower boundary attracting strong buying interest. This resulted in a sharp rebound, accompanied by a decisive breakout above both the pattern and the current market profile.
On 2 July, price closed above the upper boundary of the market profile at $4,091 and, if the rally continues, could target the base of the wedge. Should the market reverse, price is likely to retest the profile's high-volume area, while the Point of Control (POC) at $4,030 and the lower profile boundary at $3,971 could provide support for buyers.
The RSI + MAs indicator currently stands at 62, 65 and 55. All three lines remain above the neutral level and continue to point higher, while the moving averages are still signalling bullish momentum. However, it is worth noting that the RSI has already entered overbought territory, suggesting that expectations for a substantial continuation of the rally should remain cautious.
Key Takeaways
The breakout from the descending wedge may have been interpreted by market participants as the beginning of a local trend reversal. However, a move towards the red resistance zone and a test of that area remain highly uncertain, particularly ahead of the release of the Federal Reserve's June meeting minutes, which could significantly reshape market expectations.
Trade over 50 forex markets 24 hours a day with FXOpen. Take advantage of low commissions, deep liquidity, and spreads from 0.0 pips (additional fees may apply). Open your FXOpen account now or learn more about trading forex with FXOpen.
This article represents the opinion of the Companies operating under the FXOpen brand only. It is not to be construed as an offer, solicitation, or recommendation with respect to products and services provided by the Companies operating under the FXOpen brand, nor is it to be considered financial advice.
Sunrise Market Commentary
Markets
Wall Street returned well rested from the long weekend. The tech-heavy Nasdaq rose more than a percent while the Dow Jones overcame initial weakness to close with another record high. Choppy trading in Treasury yields ended with net daily changes varying between 0.1 bps (30-yr) to −3.1 bps (3-yr). The July services ISM printed at a solid 54 vs June's 54.5. Details suggest growth momentum to carry on next month with new orders coming in at 55.1. Employment printed its first 50+ reading since February. The prices paid gauge eased from a post-war high of 71.3 to 67.7. Fed's Waller in a panel discussion with amongst others ECB's Schnabel noted that risks have completely flipped around, i.e. from the labour market to inflation. "That changes how you might want to think about policy." US money markets price in a full rate hike by end of this year. ECB governor Schnabel warned that despite the oil price decline, we're not back at the pre-war situation. "Markets continue to point to higher oil prices over longer horizons. Gas prices are still around 40% higher than before the war." Schnabel warned of still-elevated pipeline and supply-chain pressures while adding that energy and inventories will need to be refilled. Others, including Belgium's Wunsch sounded more relaxed. He's not excluding another rate hike but with second-round effects not in evidence so far and wage developments quite benign, policy tightening would not have to be significant. German yields finished the day between 0.9 (2-yr) and 2.5 bps (30-yr) higher. We hold to the view that further bear steepening is in store. Oil prices are reluctant to really drop below the pre-war levels, limiting how much further inflation expectations and risk premia can compress. In addition we pick up signs of public finances returning to the fore with next year's budgets being prepared. Belgium serves as a case in point. The Monitoring Committee said it needs to find another €7.7bn by 2029 to meet the EC's public expenditure norm. This rises further to €9.8bn by 2031. France's finance minister last week said he's aiming for a 5% deficit next year. A huge gap that already seems ambitious given presidential elections in April. Germany meanwhile will see 4% budget deficits through 2030. Japan sees a further rise in longer-term bond yields with the 10-yr and 20-yr hitting another multi-decade high after doing the same just yesterday. The 30-yr yield dropped 7 bps this morning after a solid auction before paring virtually all losses. This week's beginning-of-the-month US refinancing operations deserve some attention. It starts off with a $58bn 3-yr sale today with a 10-yr and 30-yr one following later this week. Currency markets were stoic yesterday. Listless trading is keeping EUR/USD locked in a tight trading range around 1.14 and DXY around 101. Sterling steamrolls ahead with EUR/GBP now breaking through 0.855. 0.8544 serves as intermediate GBP resistance on the way to the 0.85 big figure.
News & Views
The Japanese Ministry of Health, Labour and Welfare today reported wage data for the month of May. Labour cash earnings rose 3.2% y/y, an easing from the 3.6% y/y rise recorded in April and also slightly below expectations. Base pay (ex-bonuses and overtime payments) also rose 3%. Real cash earnings eased to 1.4% compared to April (2% y/y), vs 1.7% expected, the fifth consecutive positive real growth rate. Last week the Rengo union said it negotiated average wage increases of 5.01% for its members. A continuation of virtuous wage growth is a key factor for the Bank of Japan in its process of normalizing monetary policy. Even so, the BoJ is cautious in further policy tightening while the government prefers a stimulative (fiscal and monetary) policy. At its June meeting, the BoJ raised its policy rate by 25 bps to 1%. Markets discount an 85% probability of a next hike by end-2026.
In the Bank of Canada's Q2 survey, overall business sentiment has deteriorated after improving over the past three quarters. Sales outlooks softened slightly as higher (fuel-related) costs bite into spending. Export outlooks improved, amongst others on strong commodity demand. Most firms did not report binding capacity constraints or labour shortages. The signing of the interim agreement between the United States and Iran has lowered the previously elevated inflation expectations of firms. On the consumer side, a slightly larger share of consumers than in the previous quarter expect inflation to be above 3% over the next 12 months. Two- and five-year-ahead inflation expectations edged up on tariffs and energy prices. Consumers' perceptions of the labour market improved modestly from the low levels in the previous quarter. The survey is final input for the Bank of Canada next week. The BoC is expected to keep the policy rate at 2.25%. An end-of-year hike is discounted at 50%.
GBP/CHF Nears Trend-Reversal Zone as Political Risk Fades and Sterling Shorts Unwind
Sterling's rally has been about more than better sentiment toward the UK. It has been driven by the disappearance of one of the market's biggest bearish trades. As political uncertainty faded following the resolution of Labour's leadership transition, investors who had built sizeable short Sterling positions found themselves on the wrong side of the market. That process is still unfolding, helping explain why Sterling has outperformed most clearly in the crosses rather than against the Dollar alone.
Before UK Prime Minister Keir Starmer's resignation, political uncertainty encouraged investors to build substantial bearish positions against Sterling. The decisive outcome of the Makerfield by-election on June 18 removed much of that uncertainty far more quickly than markets had anticipated. For traders who had sold Sterling on expectations of a prolonged political transition, the rationale for the trade weakened almost overnight.
What followed was not necessarily a wave of fresh optimism toward the UK economy but a mechanical process of buying Sterling back. Société Générale estimates speculative accounts were still holding short positions equivalent to 35.5% of open interest as of late June. Although some of those positions have already been unwound, the bank argues the remaining short base is still large enough to support further gains as investors continue to close bearish trades.
At the same time, the fundamental backdrop has quietly become more supportive. Bank of England Governor Andrew Bailey has pushed back against expectations for early policy easing, suggesting interest rates may need to stay restrictive to ensure the inflationary effects of this year's oil shock fully dissipate. With Bank Rate still at 3.75%, Sterling retains a sizeable yield advantage over the Swiss Franc (0.00%), Euro (2.25%) and Japanese Yen (1.00%), providing an additional incentive for investors to hold the currency.
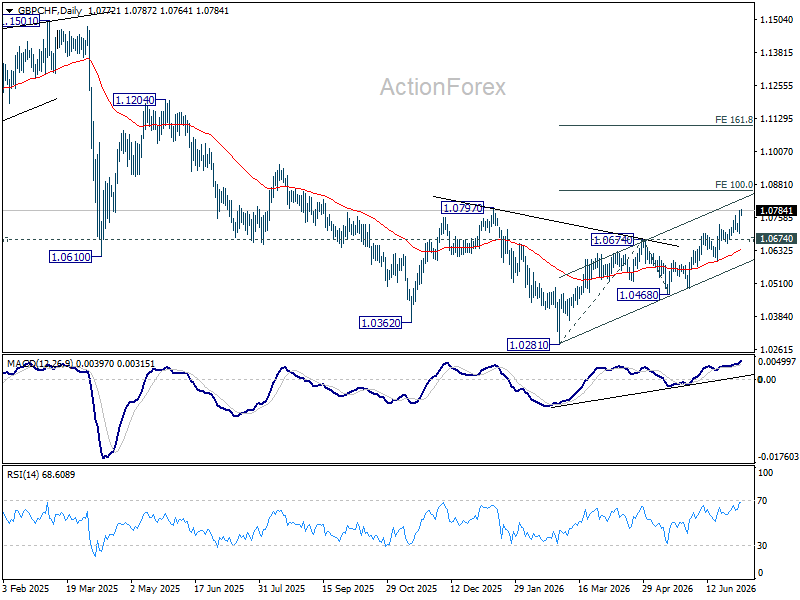
Those macro and positioning forces are now converging at a technically significant moment. GBP/CHF has resumed its advance from the March low at 1.0281 and is approaching the important resistance zone around 1.08. Provided support at 1.0674 holds, the path of least resistance continues to point higher.
The importance of this zone extends well beyond a simple breakout. A decisive move above 1.0797 would break the medium-term downtrend that has been in place since the 2024 peak at 1.1675. A subsequent break above 100% projection of 1.0821 to 1.0674 from 1.0468 at 1.0861 would reinforce the view that the recovery has transitioned from a corrective rebound into a new impulsive advance, increasing the likelihood of an acceleration toward 161.8% projection at 1.1104.
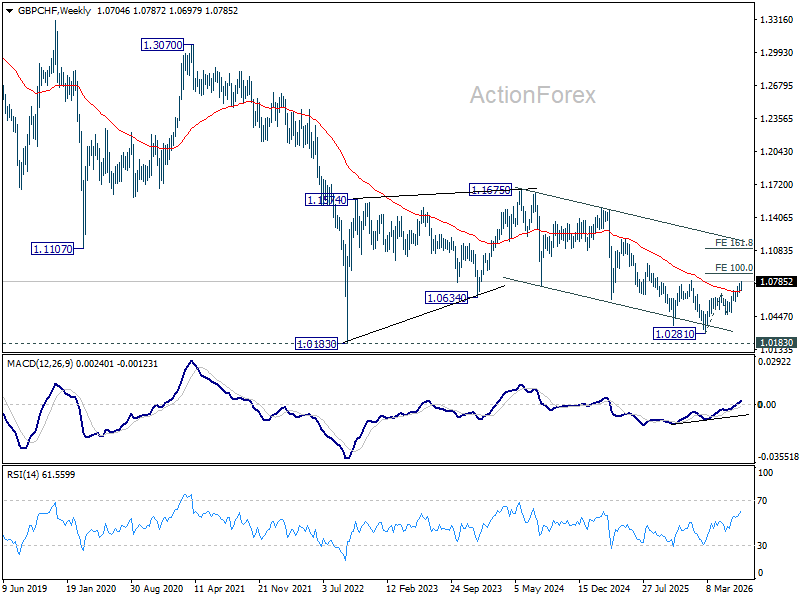
The longer-term technical backdrop is also improving. GBP/CHF has reclaimed its 55 W EMA (now at 1.0689) and successfully defended the major low at 1.0183 established in 2022. Combined with the ongoing unwinding of Sterling shorts and the Bank of England's relatively restrictive policy stance, the technical picture suggests Sterling's recent strength could mark the beginning of a broader medium-term reversal rather than simply another short-lived rebound.
GBP/USD Nears a Breakout as Buying Pressure Builds
Key Highlights
- GBP/USD started a recovery wave and surpassed the 1.3320 resistance.
- A key contracting triangle is forming with support at 1.3290 on the 4-hour chart.
- EUR/USD struggled to extend its recovery wave above the 1.1475 resistance.
- WTI Crude Oil prices are under pressure below the $72.50 pivot level.
GBP/USD Technical Analysis
The British Pound started a recovery wave above 1.3200 against the US Dollar. GBP/USD gained pace after it settled above 1.3250.
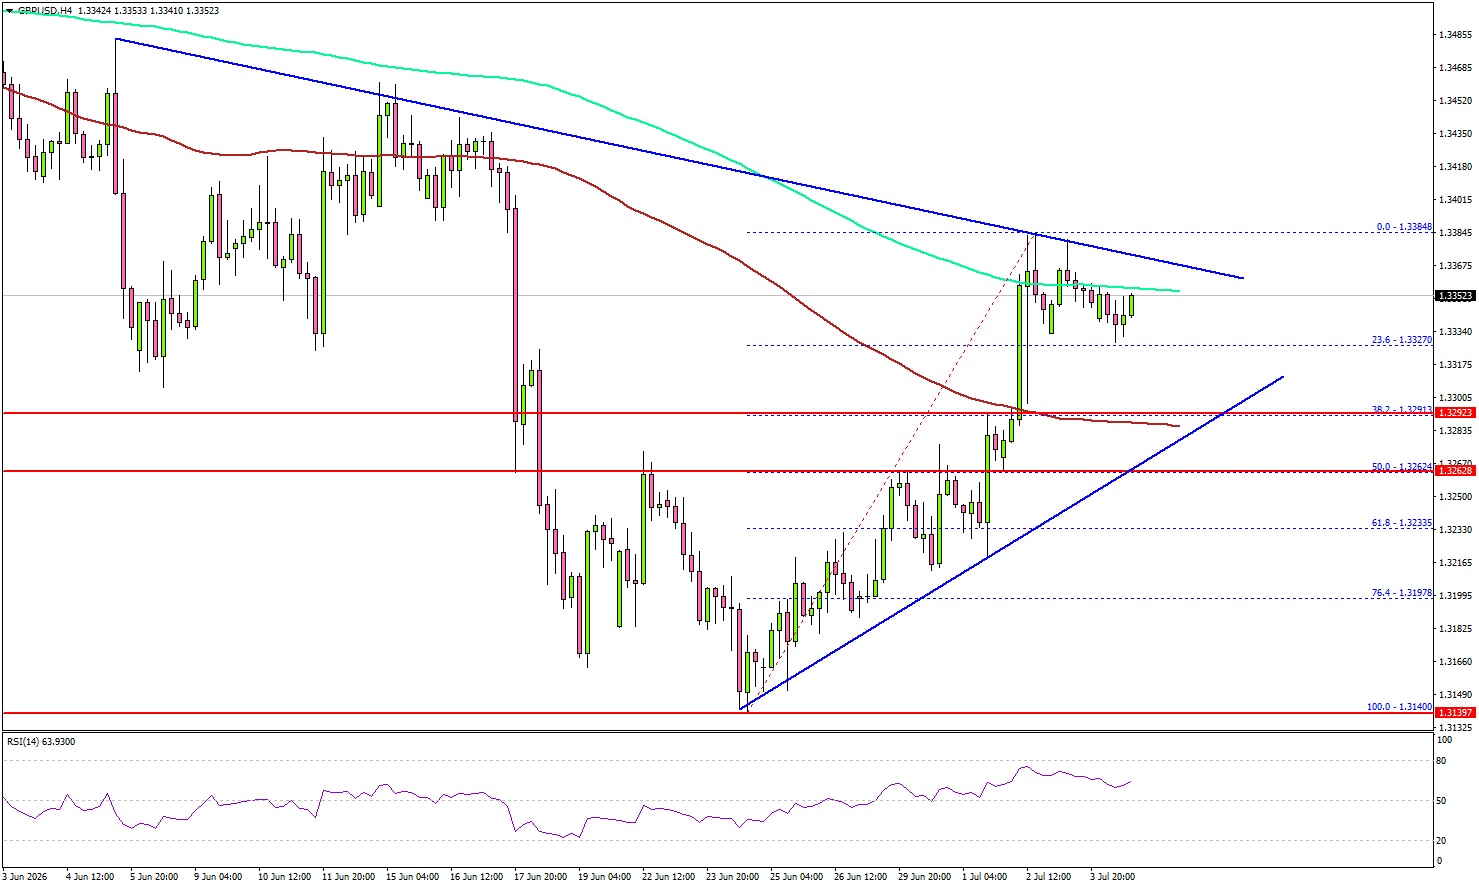
Looking at the 4-hour chart, the pair surged above the 100 simple moving average (red, 4-hour) and 1.3320. However, the bears defended the 1.3385 resistance and the 200 simple moving average (green, 4-hour).
A high was formed at 1.3384, and the pair started consolidating gains. There was a minor decline below 1.3350. If there is another decline, the pair might find support near 1.3290. Besides, there is a key contracting triangle forming with support at 1.3290.
The first major support could be near 1.3250. A downside break and close below 1.3250 might send the pair toward 1.3220. Any more losses could open the doors for a test of 1.3150.
On the upside, the bears might remain active near 1.3385. The next major resistance might be 1.3400. A close above 1.3400 could spark a sharp increase. In the stated case, the bulls could aim for a move to 1.3500.
Looking at EUR/USD, the bulls attempted a recovery wave, but they need a daily close above 1.1475 for upside continuation.
Upcoming Key Economic Events:
- UK's Financial Stability Report.
- FPC Meeting Minutes.
- FPC Statement.
- BoE's Mann speech.
Japan Real Wages Extend Longest Growth Streak Since 2021
Japan's real wages rose 1.4% yoy in May, extending gains for a fifth consecutive month, although the pace slowed from April's 2.0% increase. The latest reading marks the longest stretch of positive real wage growth since a seven-month run in 2021, suggesting household purchasing power continued to improve despite persistent inflation pressures.
Nominal wages increased 3.2% yoy, easing from 3.6% yoy in April and falling short of the 3.4% yoy consensus. Even so, it marked the fourth consecutive month of wage growth above 3%, the longest such run in more than 34 years. Regular pay rose 3.0% yoy after a 3.3% gain in April, while overtime pay growth slowed from 4.8% yoy to 2.9% yoy. Special payments, largely reflecting bonuses, increased 5.2% yoy following April's 10.3% rise.
Separately, household spending fell -0.4% yoy in May, improving slightly from April's -0.5% decline and significantly outperforming expectations for a -2.2% drop. The combination of sustained real wage growth and a milder-than-expected decline in household spending suggests domestic consumption remained relatively resilient, offering continued support for Japan's demand-driven recovery.
Japan Wages & Household Spending — May 2026
| Indicator | Previous | Latest | Market Expectation |
|---|---|---|---|
| Real Wages (YoY) | 2.0% | 1.4% | N/A |
| Nominal Wages (YoY) | 3.6% | 3.2% | 3.4% |
| Household Spending (YoY) | -0.5% | -0.4% | -2.2% |
Wage Breakdown
| Component | Previous | Latest |
|---|---|---|
| Regular Pay (Base Salaries) | 3.3% | 3.0% |
| Overtime Pay | 4.8% | 2.9% |
| Special Payments (Bonuses) | 10.3% | 5.2% |
Key Takeaways
| Area | Summary |
|---|---|
| Real Wages | Rose 1.4% yoy, marking the fifth consecutive monthly increase and the longest positive streak since 2021. |
| Nominal Wages | Increased 3.2% yoy, marking the fourth straight month above 3%, the longest such run in more than 34 years. |
| Household Spending | Fell -0.4% yoy, but significantly outperformed expectations for a -2.2% decline, suggesting consumer demand held up better than anticipated. |