Sample Category Title
USD/JPY Daily Outlook
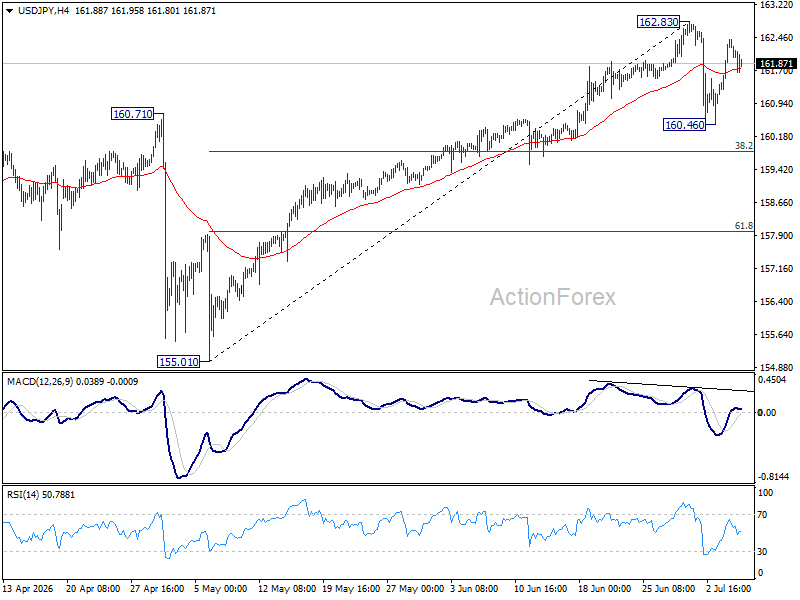
Intraday bias in USD/JPY remains neutral and more consolidations would be seen below 162.83. In case of another fall, downside should be contained by 38.2% retracement of 155.01 to 162.83 at 159.84. On the upside, firm break of 162.83 will resume larger up trend.
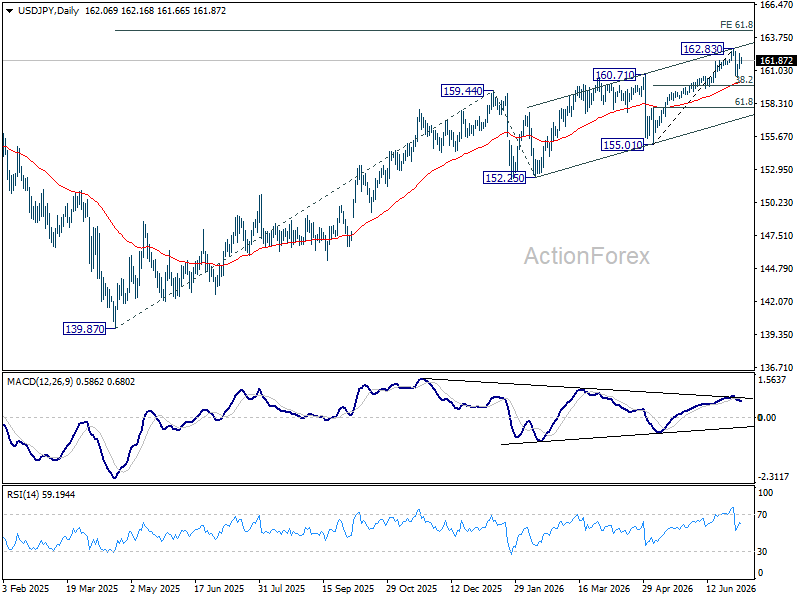
In the bigger picture, rise from 139.87 (2025 low) is seen as another rising leg of the long term up trend. Next target is 61.8% projection of 139.87 to 159.44 from 152.25 at 164.34. For now, outlook will remain bullish as long as 155.01 support holds, even in case of deep pullback.
GBP/USD Daily Outlook
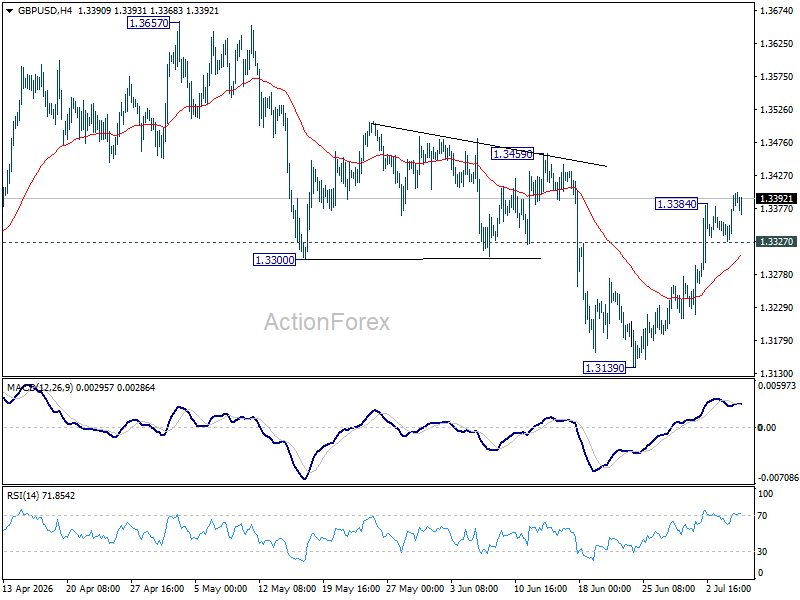
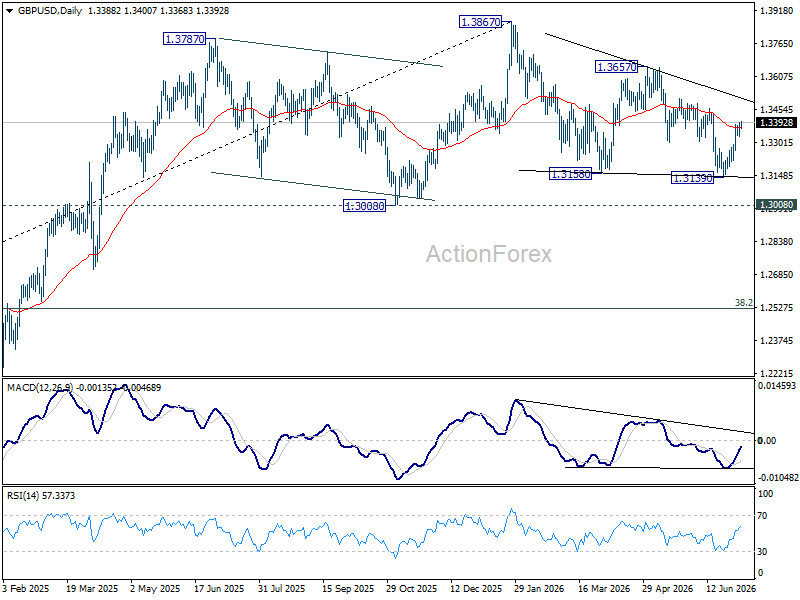
GBP/USD's rally resumed after brief retreat and intraday bias is back on the upside for 1.3459 resistance. Firm break there will argue that whole correction from 1.3867 has completed, and target 1.3657 resistance for confirmation. On the downside, below 1.3327 minor support will turn intraday bias neutral again.
In the bigger picture, price actions from 1.3867 are a corrective pattern within the broader up trend from 1.0351 (2022 low). With 1.3008 support intact, medium term bullishness is maintained and break of 1.3867 is in favor for a later stage, towards 1.4248 key resistance (2021 high). However, firm break of 1.3008 will at least bring deeper fall to 38.2% retracement of 1.0351 to 1.3867 at 1.2524, with increased risk of bearish reversal.
USD/CHF Daily Outlook
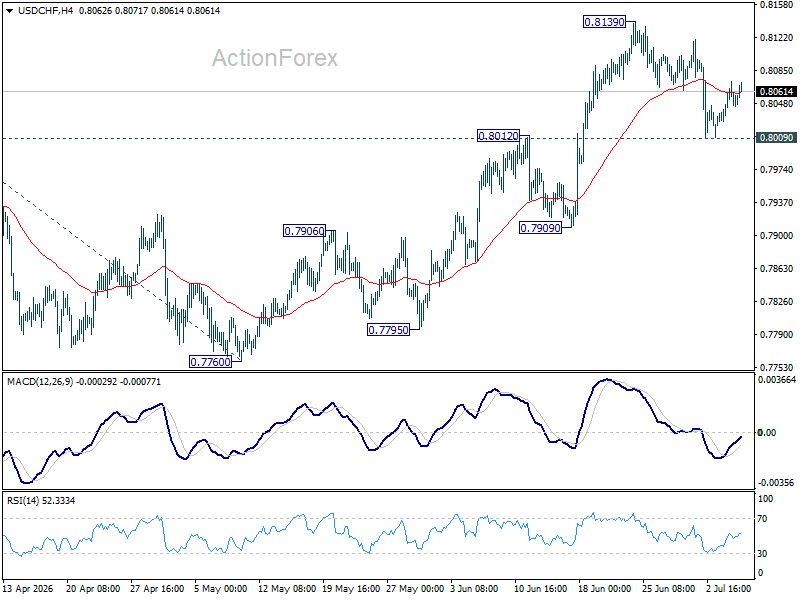
Intraday bias in USD/CHF remains neutral and more consolidations could be seen below 0.8139. Further rally remains in favor. Above 0.8139 will extend the rally from 0.7760 to 100% projection 0.7603 to 0.8041 from 0.7600 at 0.8198 next. However, sustained break of 0.8009 support will bring deeper fall to 55 D EMA (now at 0.7955) and below.
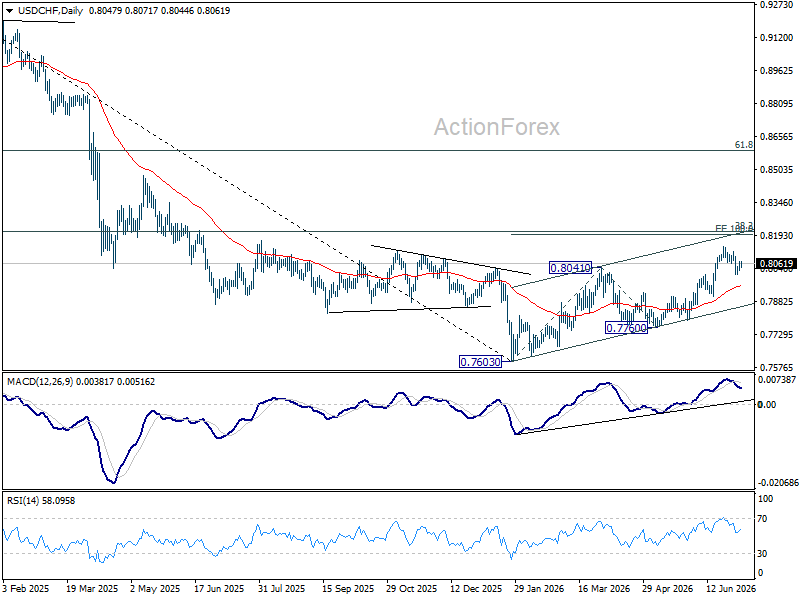
In the bigger picture, while a medium term bottom was formed at 0.7603, it's still early to call for bullish trend reversal. As long as 38.2% retracement of 0.9200 (2025 high) to 0.7603 at 0.8213 holds, the larger down trend could still continue through 0.7603 at a later stage. However, firm break of 0.7603 will argue that the trend has reversed and turn focus to 0.8332 support turned resistance (2023 low) for confirmation.
AUD/USD Daily Report
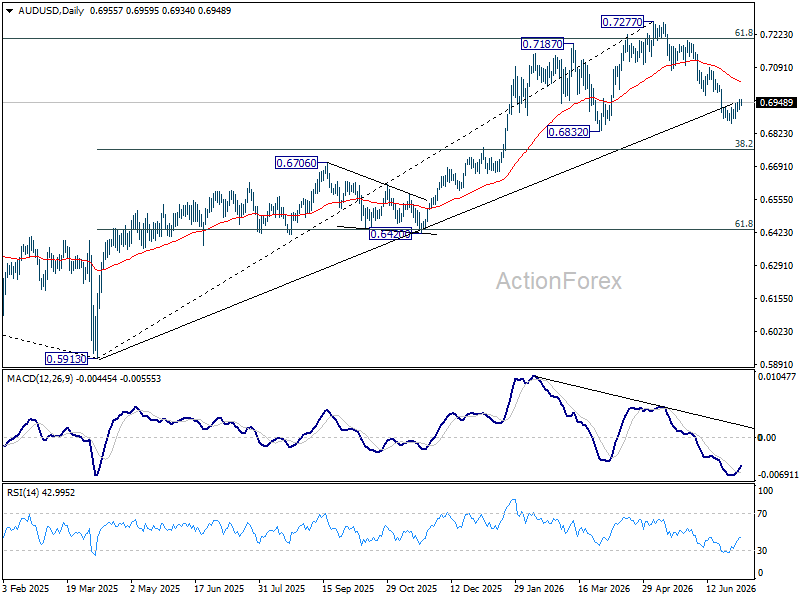
Intraday bias in AUD/USD remains neutral for the moment. More consolidations could be seen above 0.6864. Further fall is expected as long as 0.6977 support turned resistance holds. Below 0.6864 will target 0.6832 support. Firm break there will target 0.6756 fibonacci level. However, sustained break of 0.6977 will bring stronger rebound to 0.7087 resistance instead.
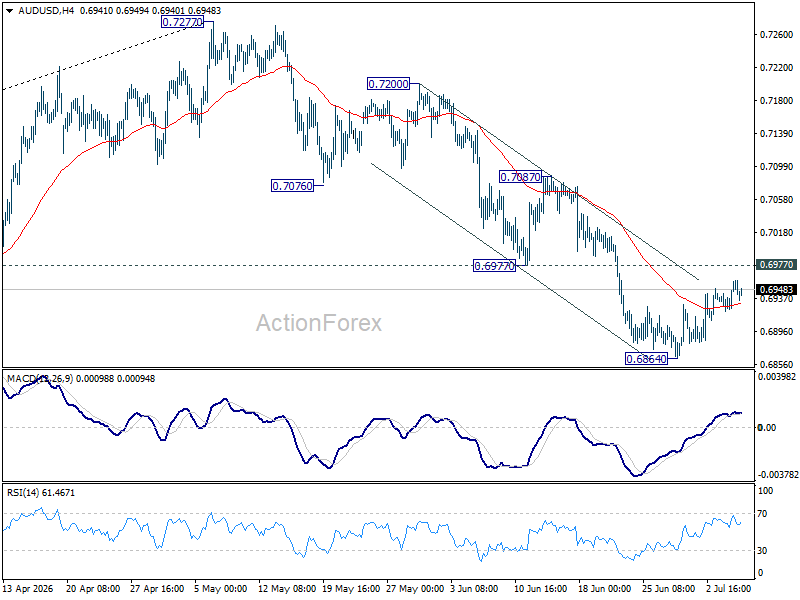
In the bigger picture, considering bearish divergence condition in D MACD, a medium term top could be formed at 0.7277 after failing to sustain above 61.8% retracement of 0.8006 (2021 high) to 0.5913 (2024 low) at 0.7206. Deeper fall could be seen to 38.2% retracement of 0.5913 to 0.7277 at 0.6756 as a correction. But strong support should be seen there to bring rebound. Consolidations would continue below 0.7277 for a while.
USD/CAD Daily Outlook
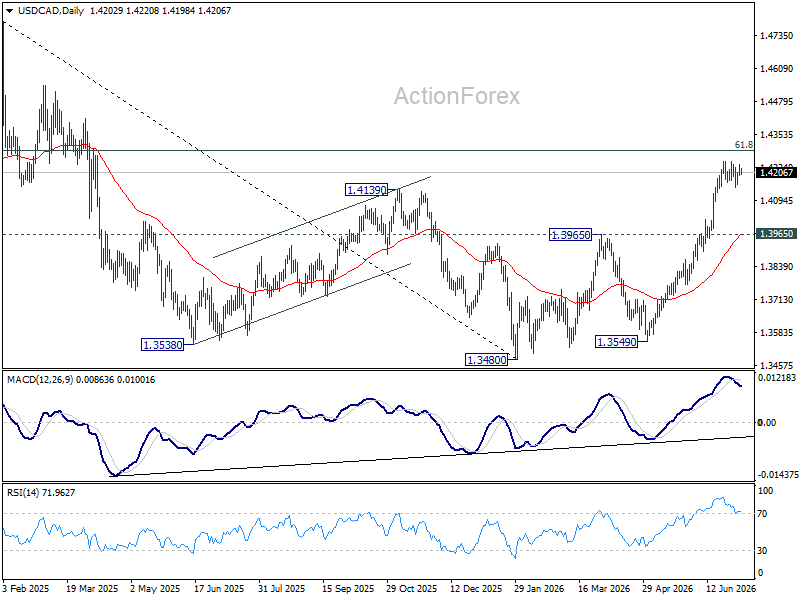
USD/CAD is staying in consolidations below 1.4247 and intraday bias remains neutral. Deeper pullback cannot be ruled out. But downside should be contained above 1.3965 resistance turned support. Above 1.4247 will resume the rally from 1.3480 to 61.8% retracement of 1.4791 to 1.3480 at 1.4290. Firm break there will pave the way back to 1.4791 high.
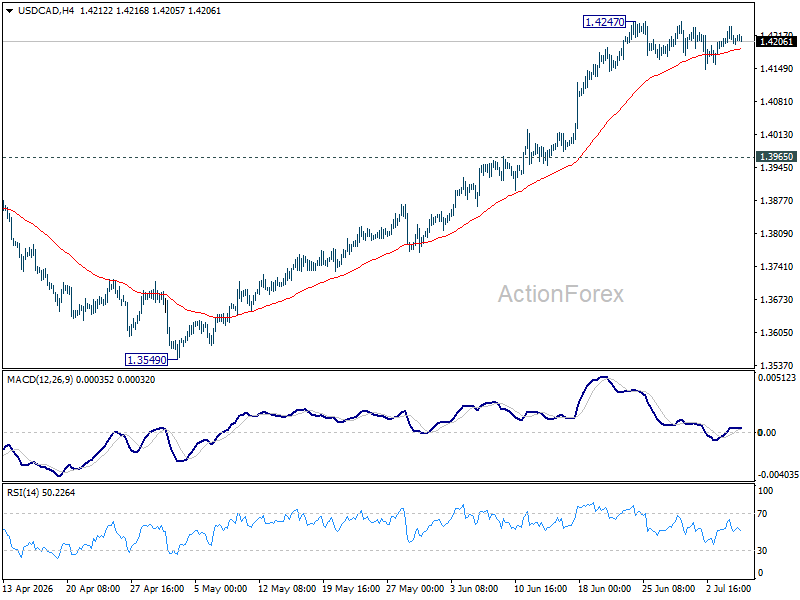
In the bigger picture, current development suggests that fall from 1.4791 has completed as a three wave correction to 1.3480. It's still early to judge if rise from there a corrective bounce, or resumption of the larger up trend from 1.2005 (2021 low). But in either case, retest of 1.4791 high should be seen next.
GBP/JPY Daily Outlook
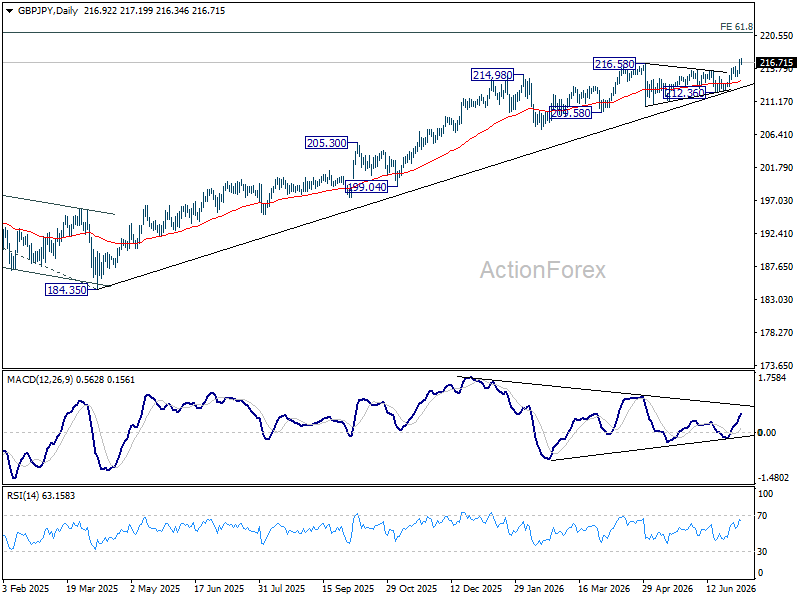
Intraday bias in GBP/JPY remains on the upside as this point. Sustained trading above 216.58 will extend larger up trend and target 220.90 fibonacci projection. For now, risk will stay on the upside as long as 214.61 support holds, in case of retreat.
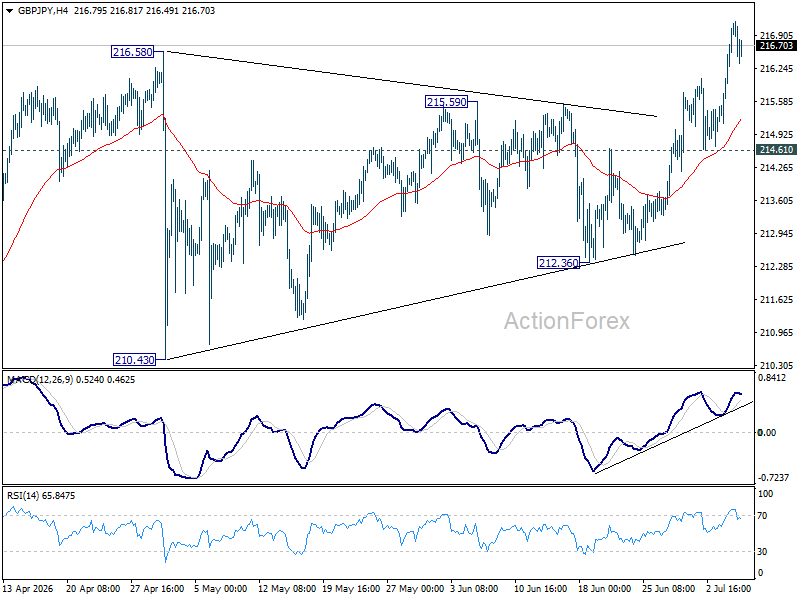
In the bigger picture, there is no clear sign of trend reversal yet. The long term up trend could still extend to 61.8% projection of 148.93 (2022 low) to 208.09 (2024 high) from 184.35 at 220.90 on resumption. However, sustained break of 55 W EMA (now at 207.89) will argue that it's already in medium term down trend for 184.35 support.
EUR/JPY Daily Outlook
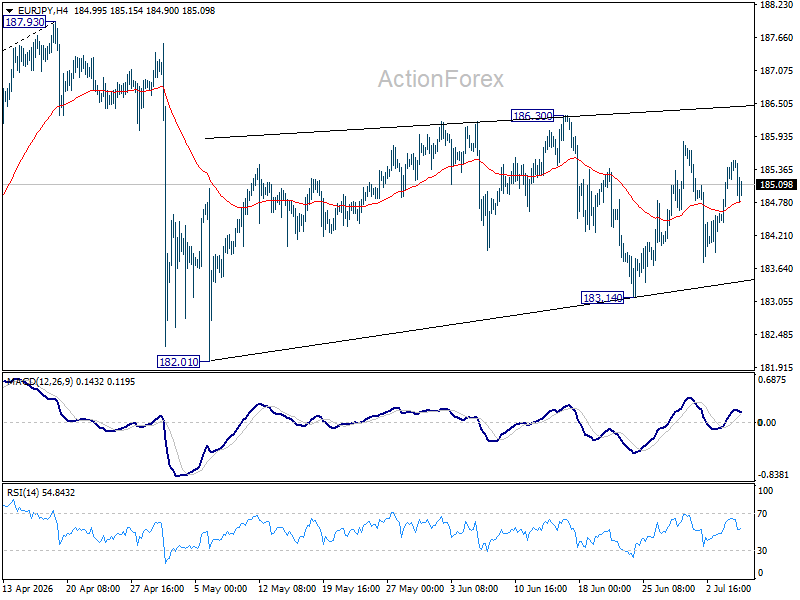
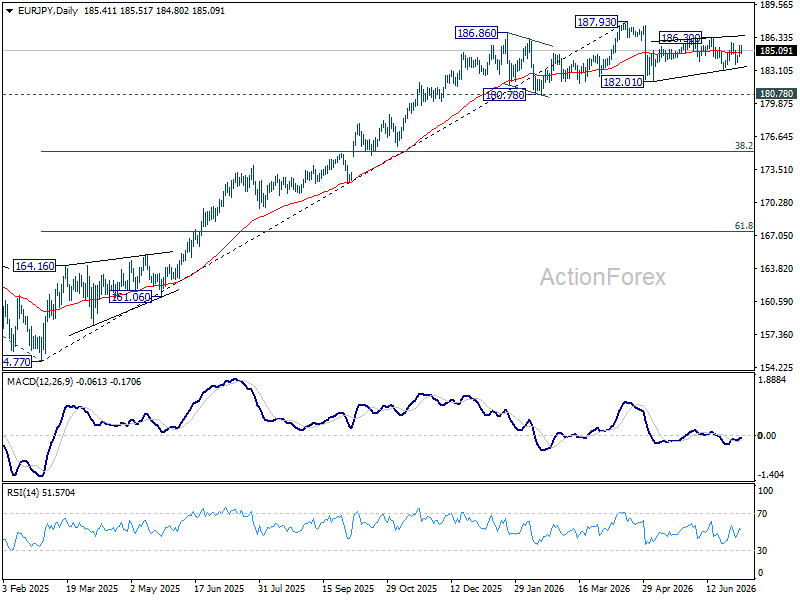
Range trading continues in EUR/JPY and intraday bias remains neutral. On the upside, break of 186.30 will resume the rebound from 182.01 to retest 187.93 high. On the downside, break of 183.14 will target 182.10 support next.
In the bigger picture, there is no sign of reversal yet. Uptrend from 114.42 (2020 low) is still expected to resume at a later stage to 78.6% projection of 124.37 (2022 low) to 175.41 (2025 high) from 154.77 at 194.88. However, sustained break of 55 W EMA (now at 179.76) will argue that it's already in a medium term down trend to 175.41 resistance turned support and below.
EUR/GBP Daily Outlook
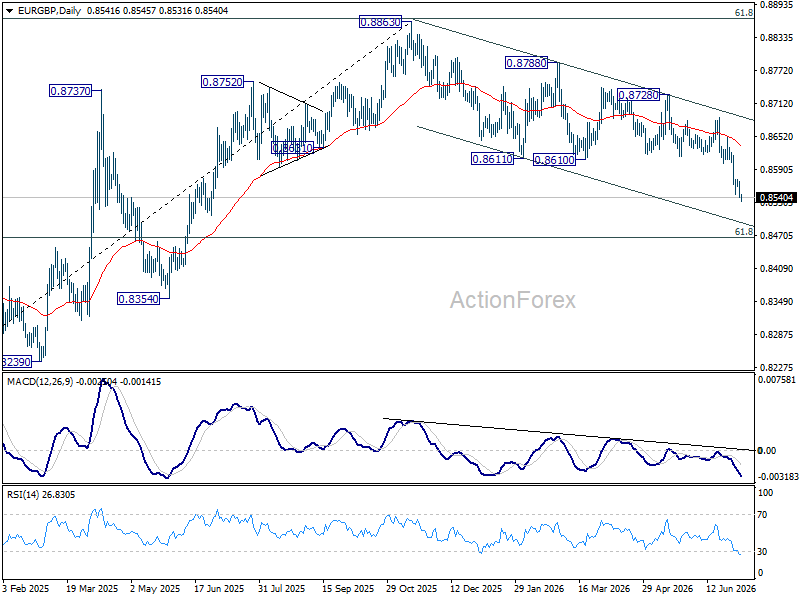
Intraday bias in EUR/GBP remains on the downside for 61.8% retracement of 0.8221 to 0.8863 at 0.8466. On the upside, above 0.8573 minor resistance will turn bias neutral first. But risk will stay on the downside as long as 0.8686 resistance holds, in case of recovery.
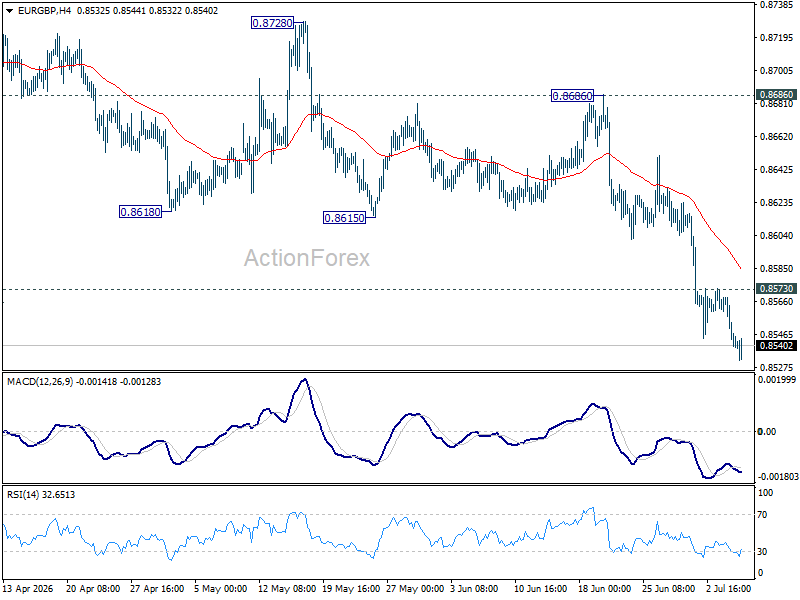
In the bigger picture, current development suggests that rise from 0.8221 (2024 low) has completed at 0.8863, just ahead of 38.2% retracement of 0.8221 (2024 low) to 0.8863 (2025 high) at 0.8618. Deeper fall would be seen back to 0.8201 (2022 low). For now, outlook will be neutral at best as long as 0.8863 hold.
EUR/AUD Daily Outlook
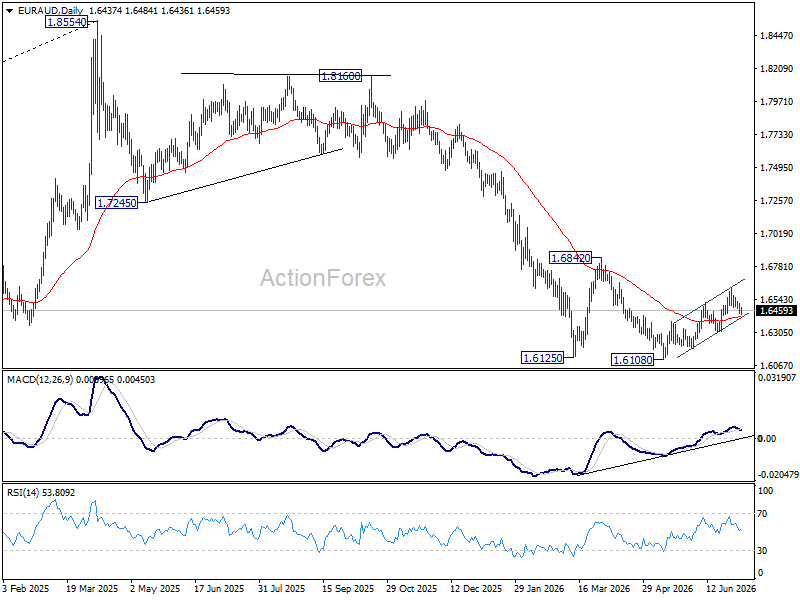
Intraday bias in EUR/AUD remains neutral and outlook is unchanged. Further rise is in favor as long as 1.6306 support holds. Above 1.6617 will extend the rebound from 1.6108 towards 1.6842 key structural resistance. However, firm break of 1.6306 will turn bias back to the downside for retesting 1.6108.
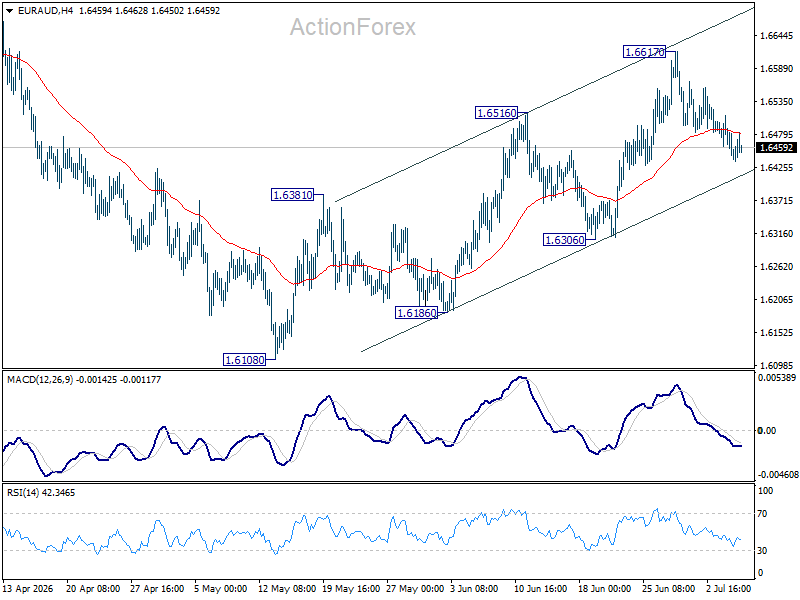
In the bigger picture, outlook will stay bearish as long as 1.6842 resistance holds. Fall from 1.8554 (2025 high) is expected to continue to 61.8% retracement of 1.4281 to 1.8554 at 1.5913. Decisive break there will pave the way back to 1.4281 (2022 low). However, firm break of 1.6842 should confirm medium term bottoming, and bring stronger rally.
EUR/CHF Daily Outlook
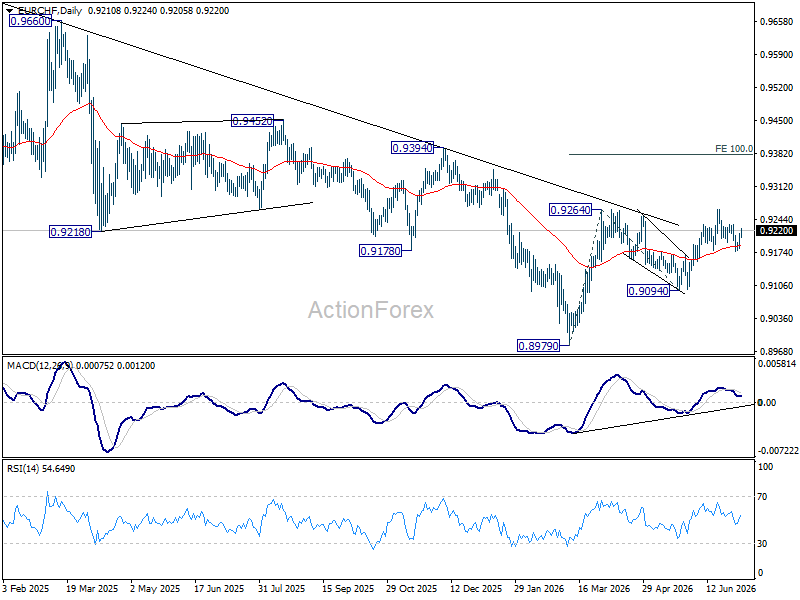
EUR/CHF recovered further today but stays below 0.9234 resistance. Intraday bias remains neutral first. With 0.9176 support intact, further rise remains in favor. On the upside,a above 0.9234 will bring retest of 0.9265 resistance first. Firm break there will resume the rally from 0.8979 to 100% projection of 0.8979 to 0.9264 from 0.9094 at 0.9379. However, decisive break of 0.9176 will dampen this bullish view, and bring deeper fall back to 0.9094 support.
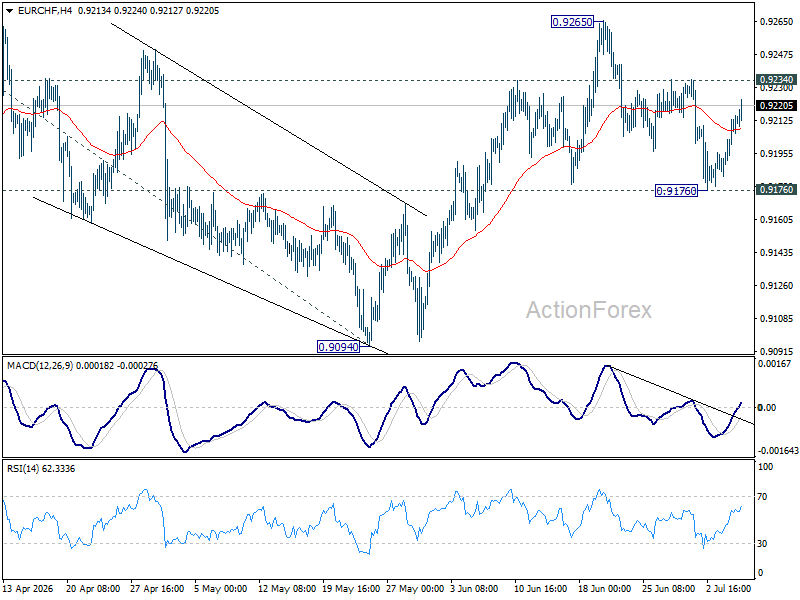
In the bigger picture, the break of medium term falling trend line resistance indicates that 0.8979 is already a medium term bottom. Considering bullish convergence condition in W MACD, rise from there should at least be reversing the fall from 0.9928, with prospect of developing into a medium term up trend. Firm break of 0.9394 resistance will add more credence to this case. For now risk will remain on the upside as long as 0.9094 support holds, in case of retreat.