
Sample Category Title
AUD/USD Daily Report
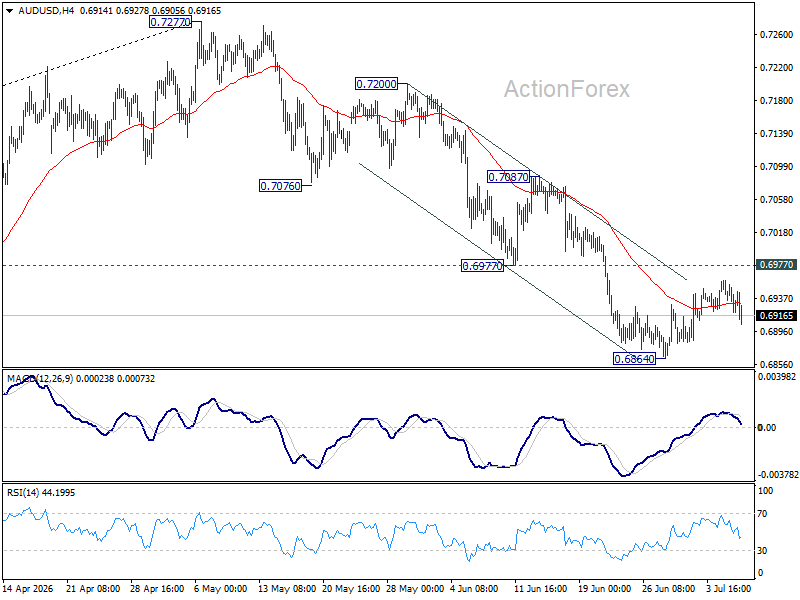
Intraday bias in AUD/USD remains neutral and consolidations could continue above 0.6864. Further fall is expected as long as 0.6977 support turned resistance holds. Below 0.6864 will target 0.6832 support. Firm break there will target 0.6756 fibonacci level. However, sustained break of 0.6977 will bring stronger rebound to 0.7087 resistance instead.
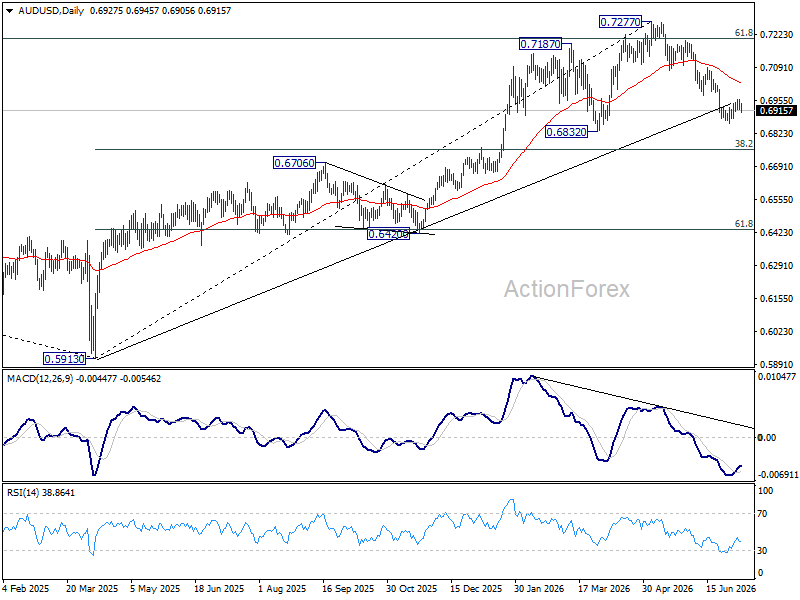
In the bigger picture, considering bearish divergence condition in D MACD, a medium term top could be formed at 0.7277 after failing to sustain above 61.8% retracement of 0.8006 (2021 high) to 0.5913 (2024 low) at 0.7206. Deeper fall could be seen to 38.2% retracement of 0.5913 to 0.7277 at 0.6756 as a correction. But strong support should be seen there to bring rebound. Consolidations would continue below 0.7277 for a while.
USD/CAD Daily Outlook
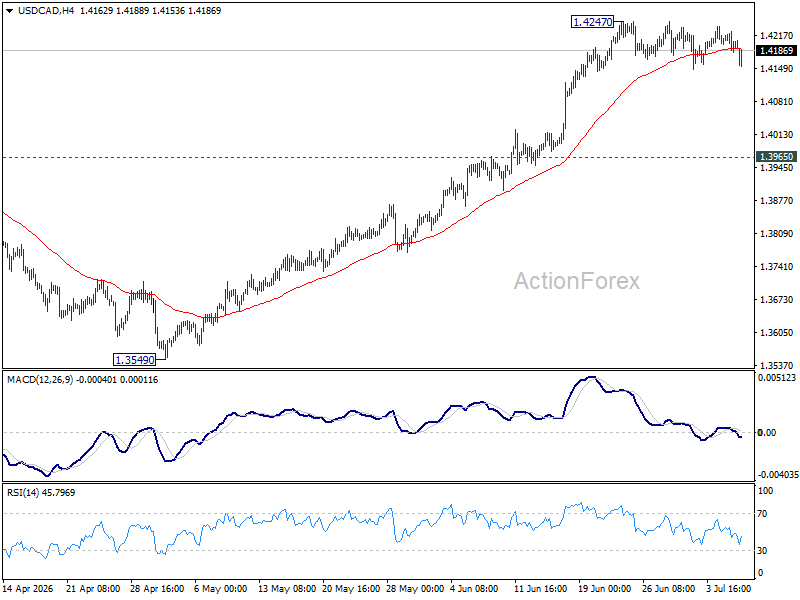
USD/CAD is still bounded in consolidations below 1.4247 and intraday bias remains neutral. Deeper pullback cannot be ruled out. But downside should be contained above 1.3965 resistance turned support. Above 1.4247 will resume the rally from 1.3480 to 61.8% retracement of 1.4791 to 1.3480 at 1.4290. Firm break there will pave the way back to 1.4791 high.
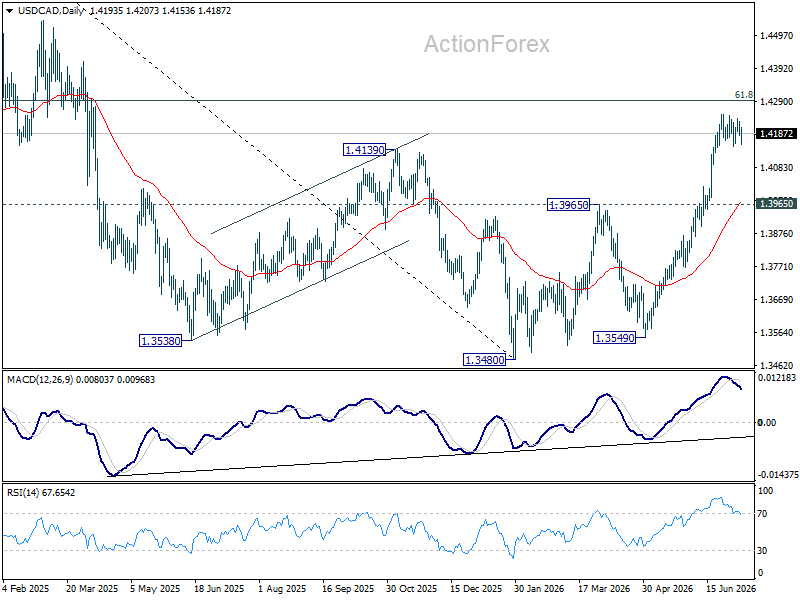
In the bigger picture, current development suggests that fall from 1.4791 has completed as a three wave correction to 1.3480. It's still early to judge if rise from there a corrective bounce, or resumption of the larger up trend from 1.2005 (2021 low). But in either case, retest of 1.4791 high should be seen next.
GBP/JPY Daily Outlook
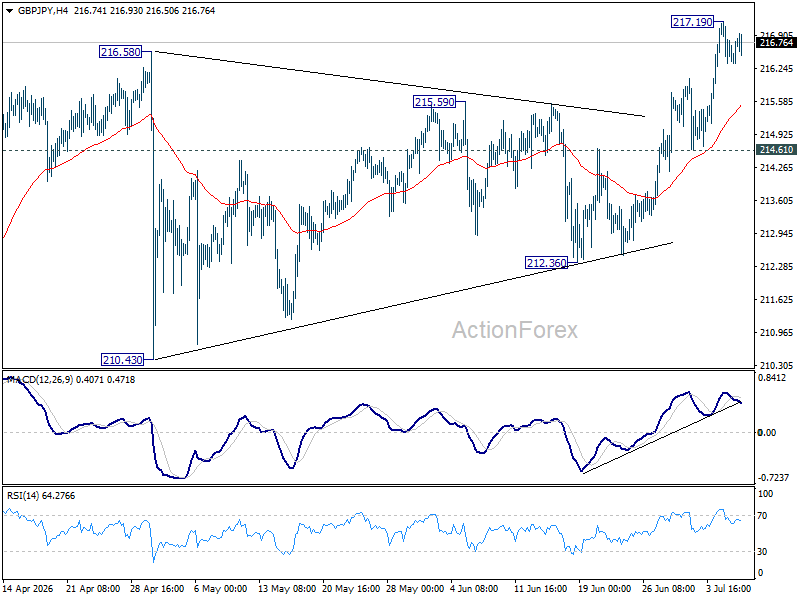
Intraday bias in GBP/JPY is turned neutral first with current retreat. Some consolidations would be seen but downside should be contained above 214.61 support. On the upside, firm break of 217.19 will extend larger up trend and target 220.90 fibonacci projection level.
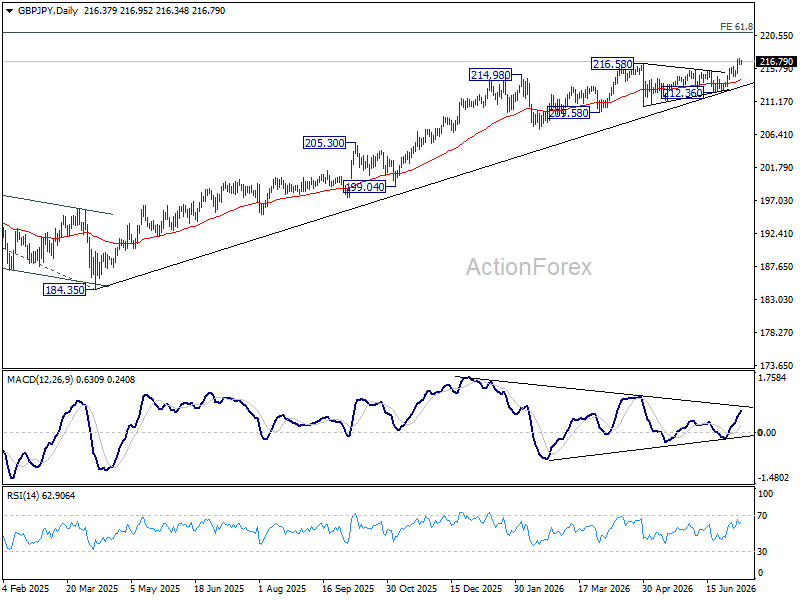
In the bigger picture, there is no clear sign of trend reversal yet. The long term up trend could still extend to 61.8% projection of 148.93 (2022 low) to 208.09 (2024 high) from 184.35 at 220.90 on resumption. However, sustained break of 55 W EMA (now at 207.89) will argue that it's already in medium term down trend for 184.35 support.
EUR/JPY Daily Outlook
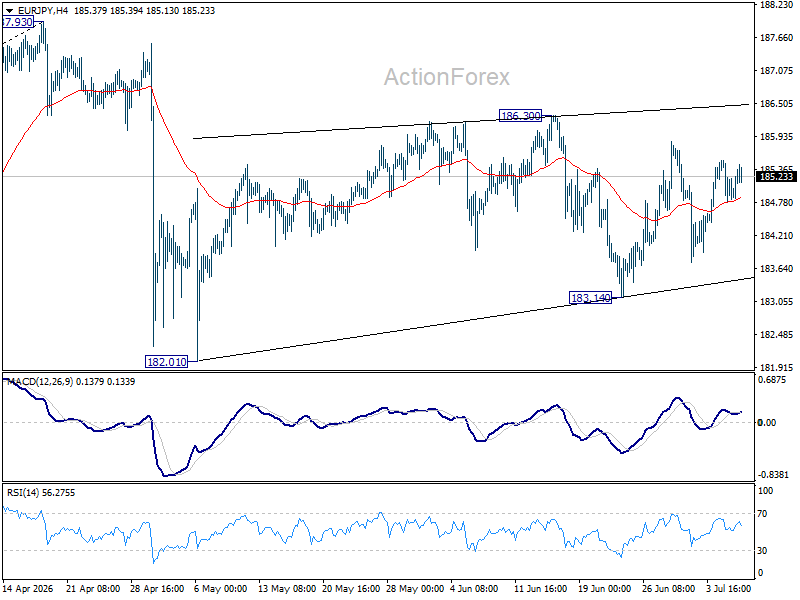
Sideway trading continues in EUR/JPY and intraday bias remains neutral for the moment. On the upside, break of 186.30 will resume the rebound from 182.01 to retest 187.93 high. On the downside, break of 183.14 will target 182.10 support next.
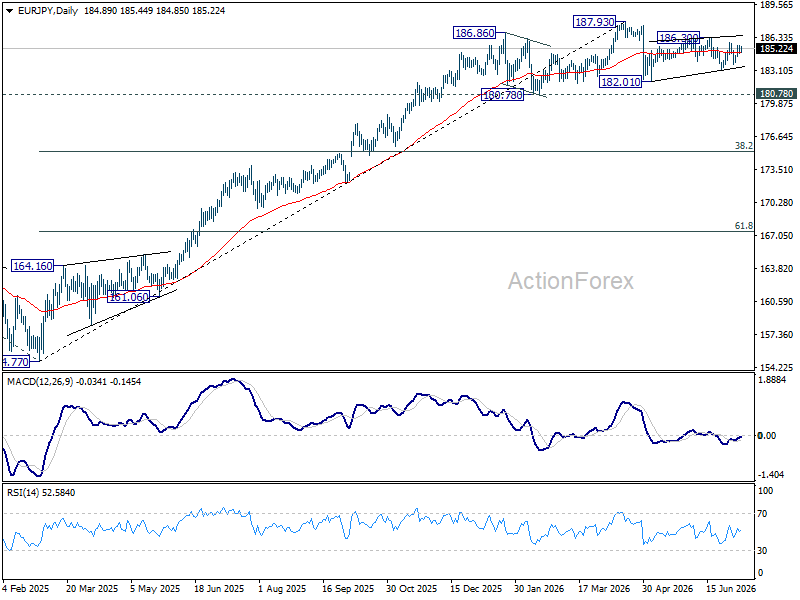
In the bigger picture, there is no sign of reversal yet. Uptrend from 114.42 (2020 low) is still expected to resume at a later stage to 78.6% projection of 124.37 (2022 low) to 175.41 (2025 high) from 154.77 at 194.88. However, sustained break of 55 W EMA (now at 179.76) will argue that it's already in a medium term down trend to 175.41 resistance turned support and below.
EUR/GBP Daily Outlook
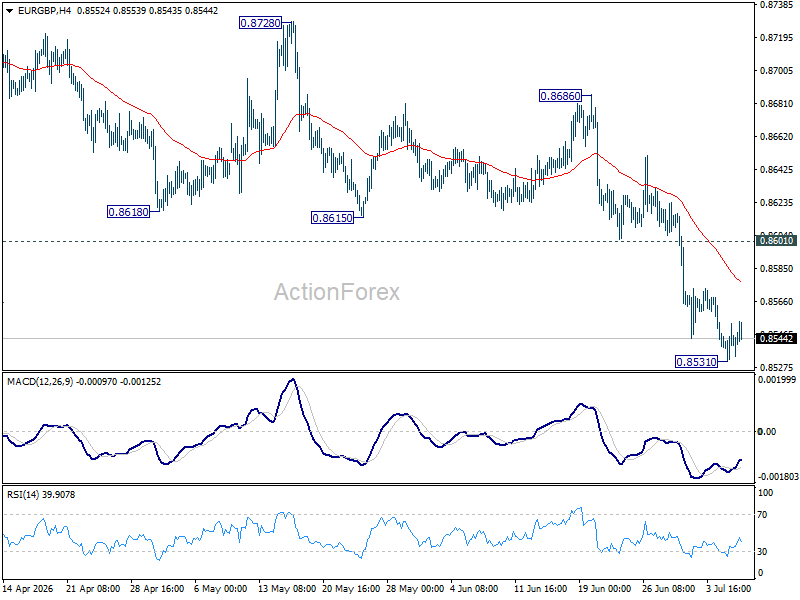
Intraday bias in EUR/GBP is turned neutral first with current recovery. Some consolidations would be seen but upside should be limited by 0.8601 support turned resistance to bring another fall. On the downside, break of 0.8531 temporary will resume the down trend from 0.8863 to 61.8% retracement of 0.8221 to 0.8863 at 0.8466.
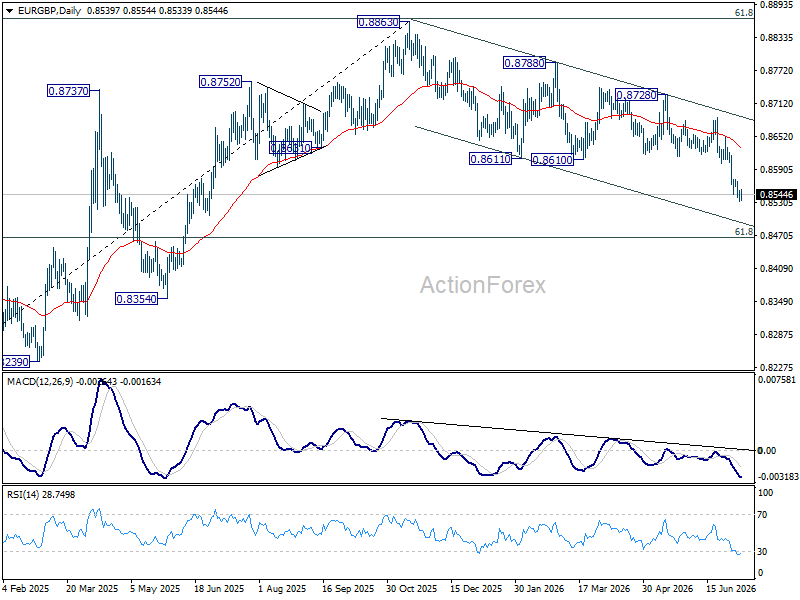
In the bigger picture, current development suggests that rise from 0.8221 (2024 low) has completed at 0.8863, just ahead of 38.2% retracement of 0.8221 (2024 low) to 0.8863 (2025 high) at 0.8618. Deeper fall would be seen back to 0.8201 (2022 low). For now, outlook will be neutral at best as long as 0.8863 hold.
EUR/AUD Daily Outlook
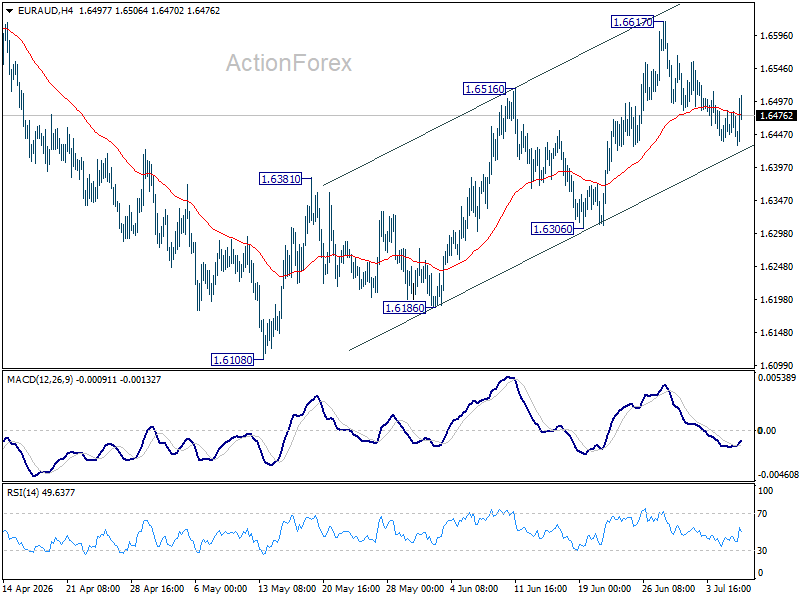
More consolidations could still be seen in EUR/AUD and intraday bias remains neutral. But further rise is in favor as long as 1.6306 support holds. Above 1.6617 will extend the rebound from 1.6108 towards 1.6842 key structural resistance. However, firm break of 1.6306 will turn bias back to the downside for retesting 1.6108.
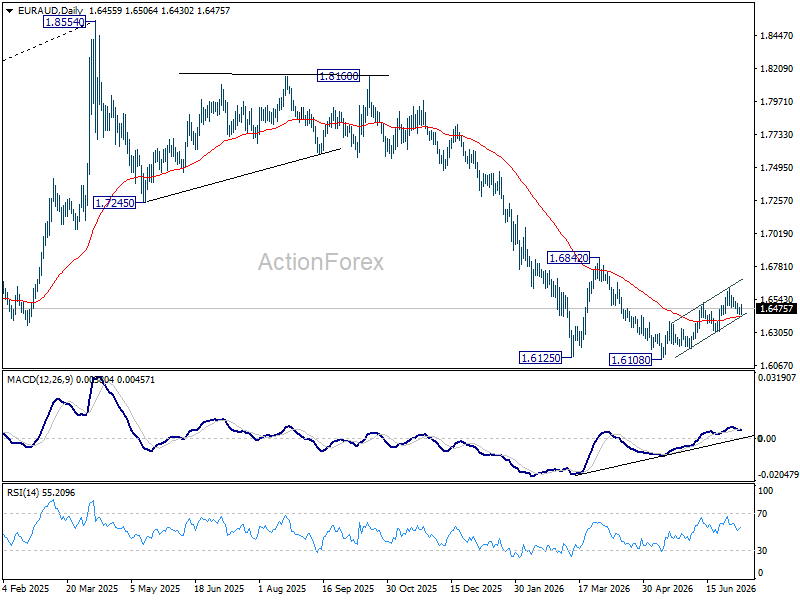
In the bigger picture, outlook will stay bearish as long as 1.6842 resistance holds. Fall from 1.8554 (2025 high) is expected to continue to 61.8% retracement of 1.4281 to 1.8554 at 1.5913. Decisive break there will pave the way back to 1.4281 (2022 low). However, firm break of 1.6842 should confirm medium term bottoming, and bring stronger rally.
EUR/CHF Daily Outlook
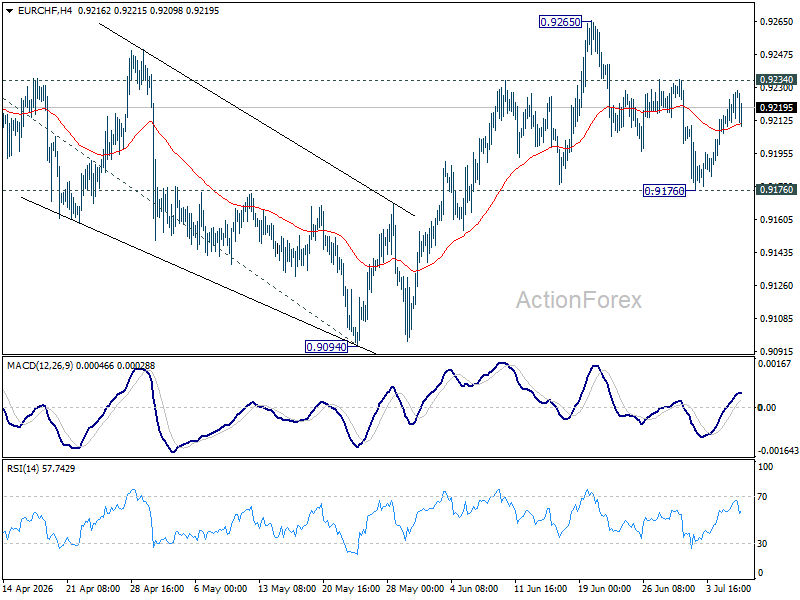
Intraday bias in EUR/CHF remains neutral for the moment. Further rally is expected with 0.9176 support intact. On the upside, above 0.9234 will bring retest of 0.9265 resistance first. Firm break there will resume the rally from 0.8979 to 100% projection of 0.8979 to 0.9264 from 0.9094 at 0.9379. However, decisive break of 0.9176 will dampen this bullish view, and bring deeper fall back to 0.9094 support.
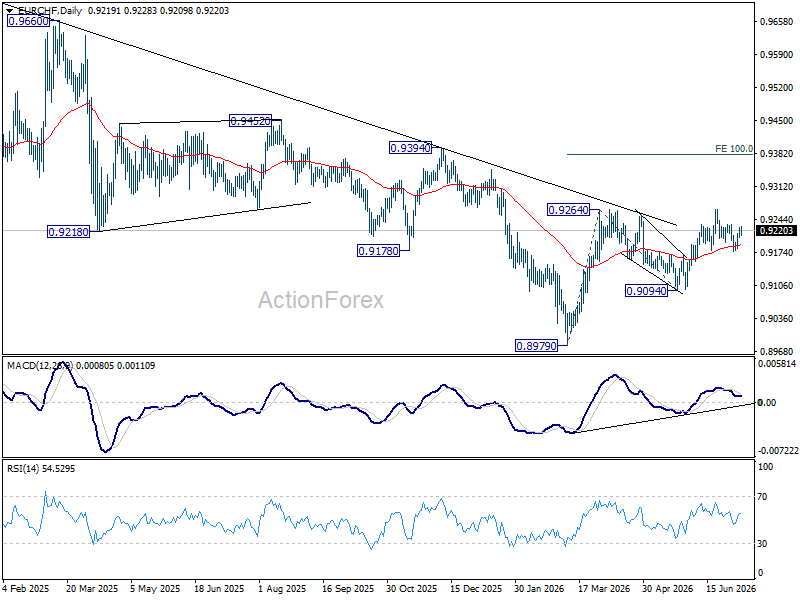
In the bigger picture, the break of medium term falling trend line resistance indicates that 0.8979 is already a medium term bottom. Considering bullish convergence condition in W MACD, rise from there should at least be reversing the fall from 0.9928, with prospect of developing into a medium term up trend. Firm break of 0.9394 resistance will add more credence to this case. For now risk will remain on the upside as long as 0.9094 support holds, in case of retreat.
Brent Oil Price Jumps Over 4% on Fresh Escalation of US-Iran Conflict
Brent price jumped over 4% on Wednesday morning, extending recovery leg from temporary base at $70 zone.
Fresh acceleration was sparked by the latest comment from President Trump that deal with Iran is over, following the latest fire exchange between US and Iran that undermined recent optimism and started to lift oil prices again.
Bounce from psychological $70 support was anticipated, as daily studies were at that time oversold, but instead of limited technical correction, we can expect possible stronger rally as geopolitical factor (the key driver of the oil price until now) gets involved.
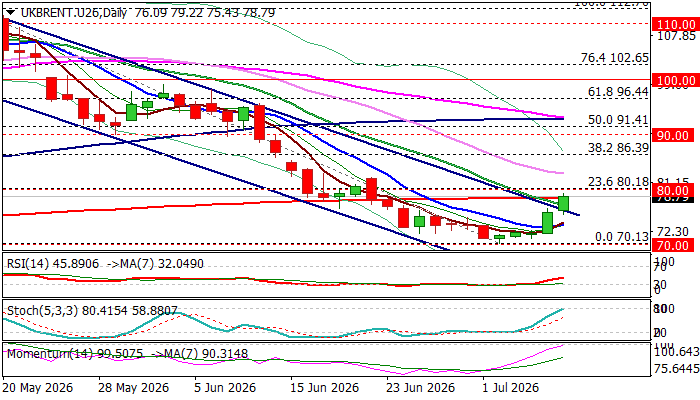
Technical picture on daily chart improves after the price rose above 10 and 20DMA’s, broke above the upper boundary line of bear-channel (from $112.70) and cracked 200DMA ($78.44), pressuring next pivotal barriers at $80.00/18 (psychological / Fibo 23.6% of $112.70/$70.13 descend).
Firm break here is needed to generate initial signal of formation of reversal pattern on daily chart that would provide fresh impetus to recovery attempts.
North-heading momentum indicators (14-d momentum is hitting the centreline and RSI heading towards 50 breakpoint) would boost positive outlook if indicators continue to ascend and generate bullish signals.
Near-term action will continue to depend primarily on developments on geopolitical front, with escalation on the ground to further lift the price (although Trump’s rhetoric is not seen as very reliable factor, due to quick changes of direction).
Bullish scenario sees sustained break of 200DMA and $80 zone as a trigger for acceleration towards $86.39 (Fibo 38.2%) and $90 (psychological) in extension.
Conversely, calmer tones from both sides may deflate immediate bulls and keep near-term action in a scenario of limited correction of larger downtrend (return and close within the bear-channel seen as minimum requirement to keep larger bears in play).
Res: 80.00; 80.18; 82.09; 85.29
Sup: 75.78; 73.11; 72.04; 70.50
Pound Awaits Tighter Policy from Bank of England
GBP/USD declined to 1.3352 on Wednesday amid a general deterioration in the external environment and a decline in risk appetite. The escalation of tensions in the Strait of Hormuz and Iran's attacks on facilities in Kuwait and Bahrain have prompted investors to move away from riskier assets.
Earlier, the pound had appeared more resilient, supported by oil prices rising above 72 USD per barrel and the associated inflationary risks. Market participants are currently pricing in approximately a 76% probability of a Bank of England rate hike before year-end, with the likelihood of tightening as early as November exceeding 50%.
Bank of England Governor Andrew Bailey recently confirmed that inflation remains on a path towards the 2% target but acknowledged that this process will take longer than previously expected. At the same time, the regulator does not see scope for reducing interest rates in the near future.
Political uncertainty in the UK has had a limited impact on the market so far. The favourite for the post of Prime Minister, Andy Burnham, has yet to announce his candidate for Chancellor of the Exchequer. However, investors believe that much of the domestic political risk has already been priced into the pound's exchange rate.
Technical Analysis
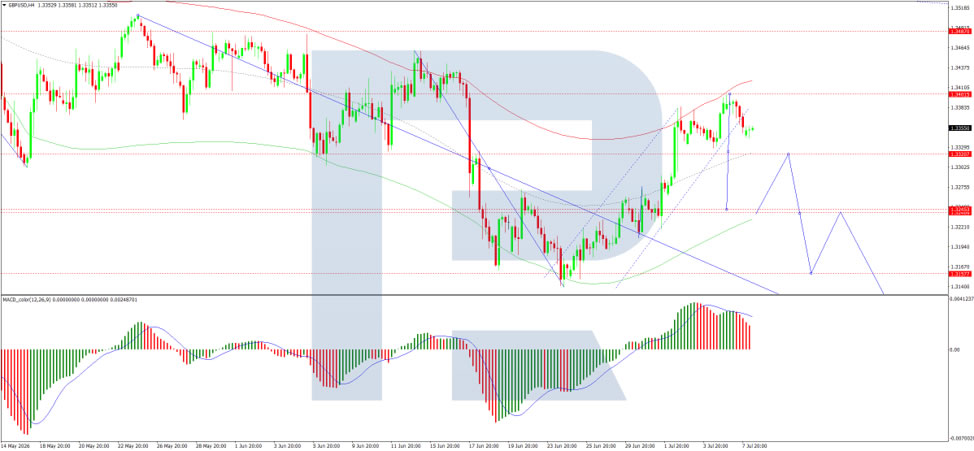
On the H4 GBP/USD chart, the market is moving lower towards 1.3240. A wide consolidation range is forming around this level. An upside breakout from this range would open the way for a move towards 1.3480, while a downside breakout would suggest a decline towards 1.3290, with scope for the trend to extend to 1.3090. The MACD indicator supports this scenario, with its signal line above zero and pointing firmly downwards, reflecting continued bearish momentum.
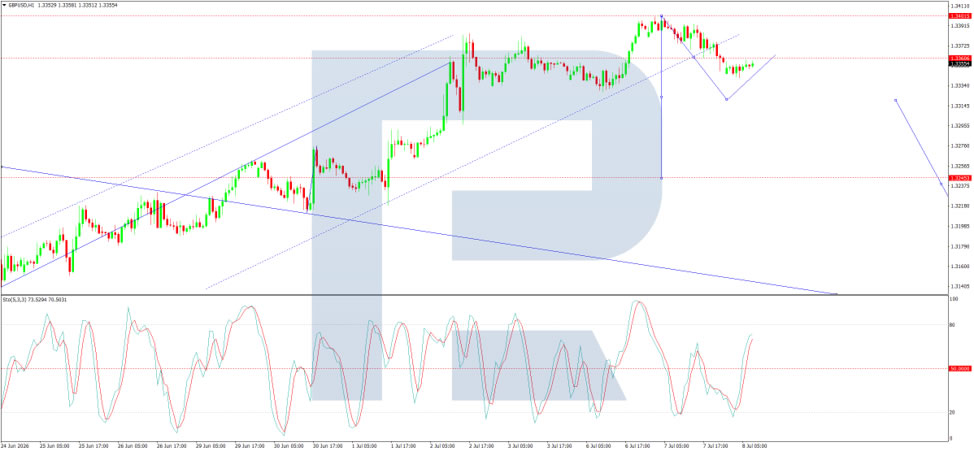
On the H1 chart, the market has formed a compact consolidation range around the 1.3360 level, currently extending down to 1.3340. A move higher towards 1.3360 is expected, followed by a decline to 1.3320. The Stochastic oscillator confirms this scenario, with its signal line below 80 and pointing downwards towards 20, indicating increasing short-term downside pressure.
Conclusion
Sterling has retreated as deteriorating geopolitical conditions in the Middle East – including attacks on Gulf states and heightened tensions in the Strait of Hormuz – have dampened risk appetite. The pound had previously found support from rising oil prices and market expectations of further Bank of England tightening, with a 76% probability of a rate hike priced in by year-end. Governor Bailey's confirmation that inflation remains above target and that rate cuts are not imminent has reinforced the hawkish outlook. While domestic political uncertainty appears largely priced in, the pound's near-term trajectory will depend on how geopolitical risks evolve. Technically, further downside towards 1.3240 and potentially 1.3090 appears likely in the medium term.
DAX 40: Can the Index Print Fresh Record Highs Once Again?
The DAX 40 has shed more than 2% over the past several sessions, breaking a rally that had pushed the index to record highs on the back of Germany's fiscal pivot toward defence, infrastructure and climate spending. The pullback raises a legitimate question: is this a healthy pause within an intact uptrend, or the start of a deeper correction?
On the macro front, the picture remains mixed but constructive. German durable goods orders surprised meaningfully to the upside, hinting that domestic industry may finally be turning a corner. That said, a portion of this year's projected GDP growth stems from calendar effects rather than genuine demand recovery.
Monetary policy offers the clearest explanation for the recent weakness. The ECB delivered its first hike since 2023 in June, and the shift in tone alone unsettled rate-sensitive DAX sectors like Financials and real estate, while a firmer euro added pressure on export-driven industrials.
Technical Analysis
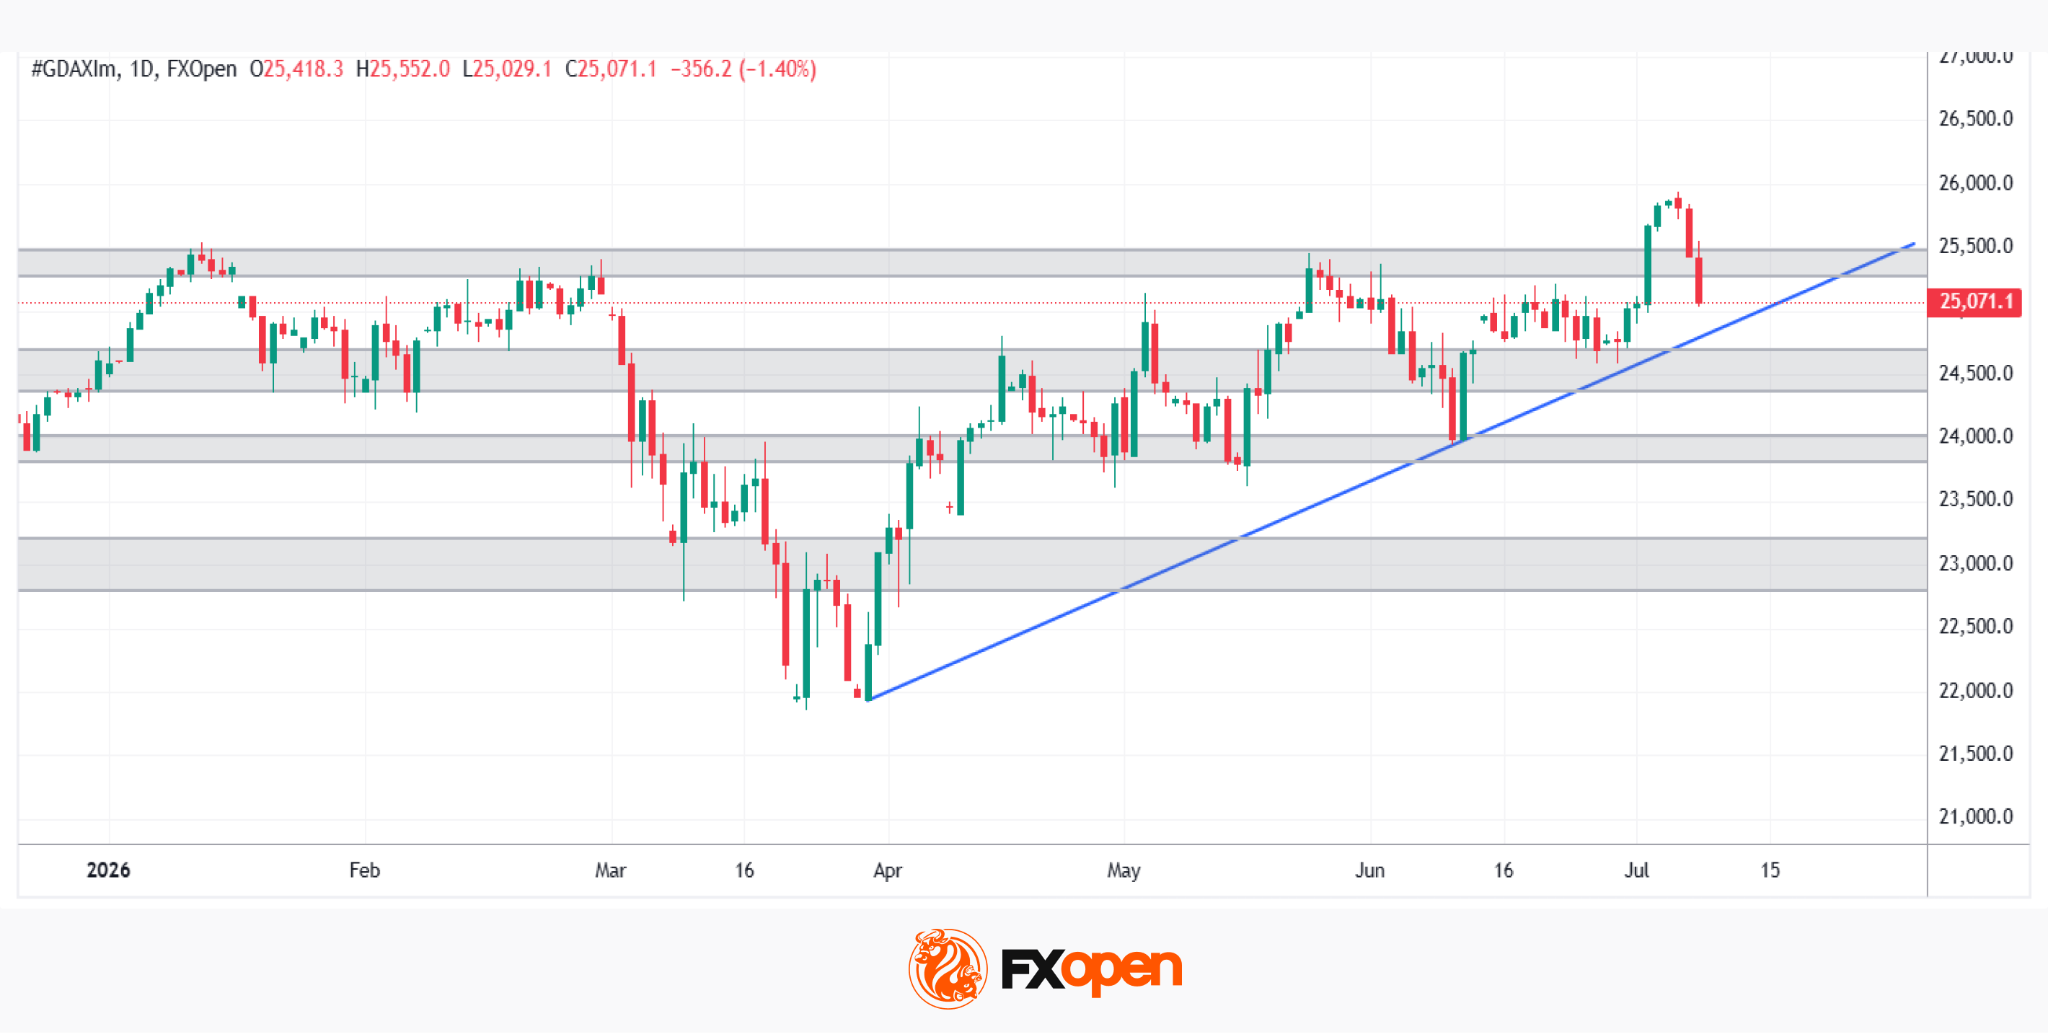
As the chart shows, DAX 40 (GDAXI on FXOpen) has climbed steadily from April's lows along a well-respected ascending trendline, recently pushing to new record highs near 26,000 before the sharp two-session pullback that triggered this correction. Price has now retraced heading to that same trendline, which converges with the 24,500-24,600 support zone—making this an important decision point for the index.
Bullish Scenario
If buyers step back in and defend the trendline together with the 24,500-24,600 zone, the broader uptrend structure remains intact. In this case, the recent drop would look more like a routine shakeout than a genuine reversal. From there, a renewed push back above the 25,400-25,550 resistance area—where the index broke down during the pullback—would be the first sign that momentum is returning. A clean break above that zone would put fresh record highs firmly back on the table, extending the rally that has defined the DAX since April.
Bearish Scenario
On the other hand, a decisive daily close below the trendline and the 24,500-24,600 support would be a meaningful technical signal, suggesting the correction has more room to run. Losing this zone would likely trigger further selling, as it has acted as a springboard for the rally since spring. In that scenario, the index would probably drift toward the 24,000 area first, with 23,000-23,200—the last major support tested back in April—becoming the key downside target if selling pressure intensifies.
With price now sitting exactly on this critical trendline, the coming sessions look set to decide whether the DAX's record-breaking run continues, or whether this correction has only just begun.
Trade global index CFDs with zero commission and tight spreads (additional fees may apply). Open your FXOpen account now or learn more about trading index CFDs with FXOpen.
This article represents the opinion of the Companies operating under the FXOpen brand only. It is not to be construed as an offer, solicitation, or recommendation with respect to products and services provided by the Companies operating under the FXOpen brand, nor is it to be considered financial advice.