Sample Category Title
BoJ’s Asada: Demand-Driven Inflation Needed Before Another Rate Hike
Bank of Japan board member Toichiro Asada said he would only support another interest rate hike once inflation is clearly being driven by stronger domestic demand rather than temporary cost pressures. Speaking after dissenting against the BoJ's June rate increase, Asada said, "I would support another rate hike only after confirming demand-driven inflation," signaling that current price gains have yet to meet his threshold for further policy normalization.
Asada argued that inflation generated by higher oil prices and a weaker yen should not be treated the same as inflation supported by rising wages and household spending. While acknowledging that energy prices have passed through to consumer inflation more quickly than expected, he indicated that the BoJ should wait for clearer evidence that wage growth is translating into stronger consumption and sustainably higher prices. He also stressed that monetary policy should respond to evolving economic conditions rather than follow a predetermined tightening path.
The remarks reinforce Asada's position as the most cautious voice on the BoJ board following last month's decision to raise the policy rate to 1.00%. He also argued that Japan's neutral interest rate remains low and supported a gradual normalization of the BoJ's balance sheet through a measured reduction in bond purchases. His comments highlight that, despite the BoJ's ongoing normalization process, policymakers remain divided over when inflation can truly be considered durable enough to justify additional rate hikes.
USDCHF Wave Analysis
USDCHF: ⬆️ Buy
– USDCHF reversed from support zone
– Likely to rise to resistance level 0.8130
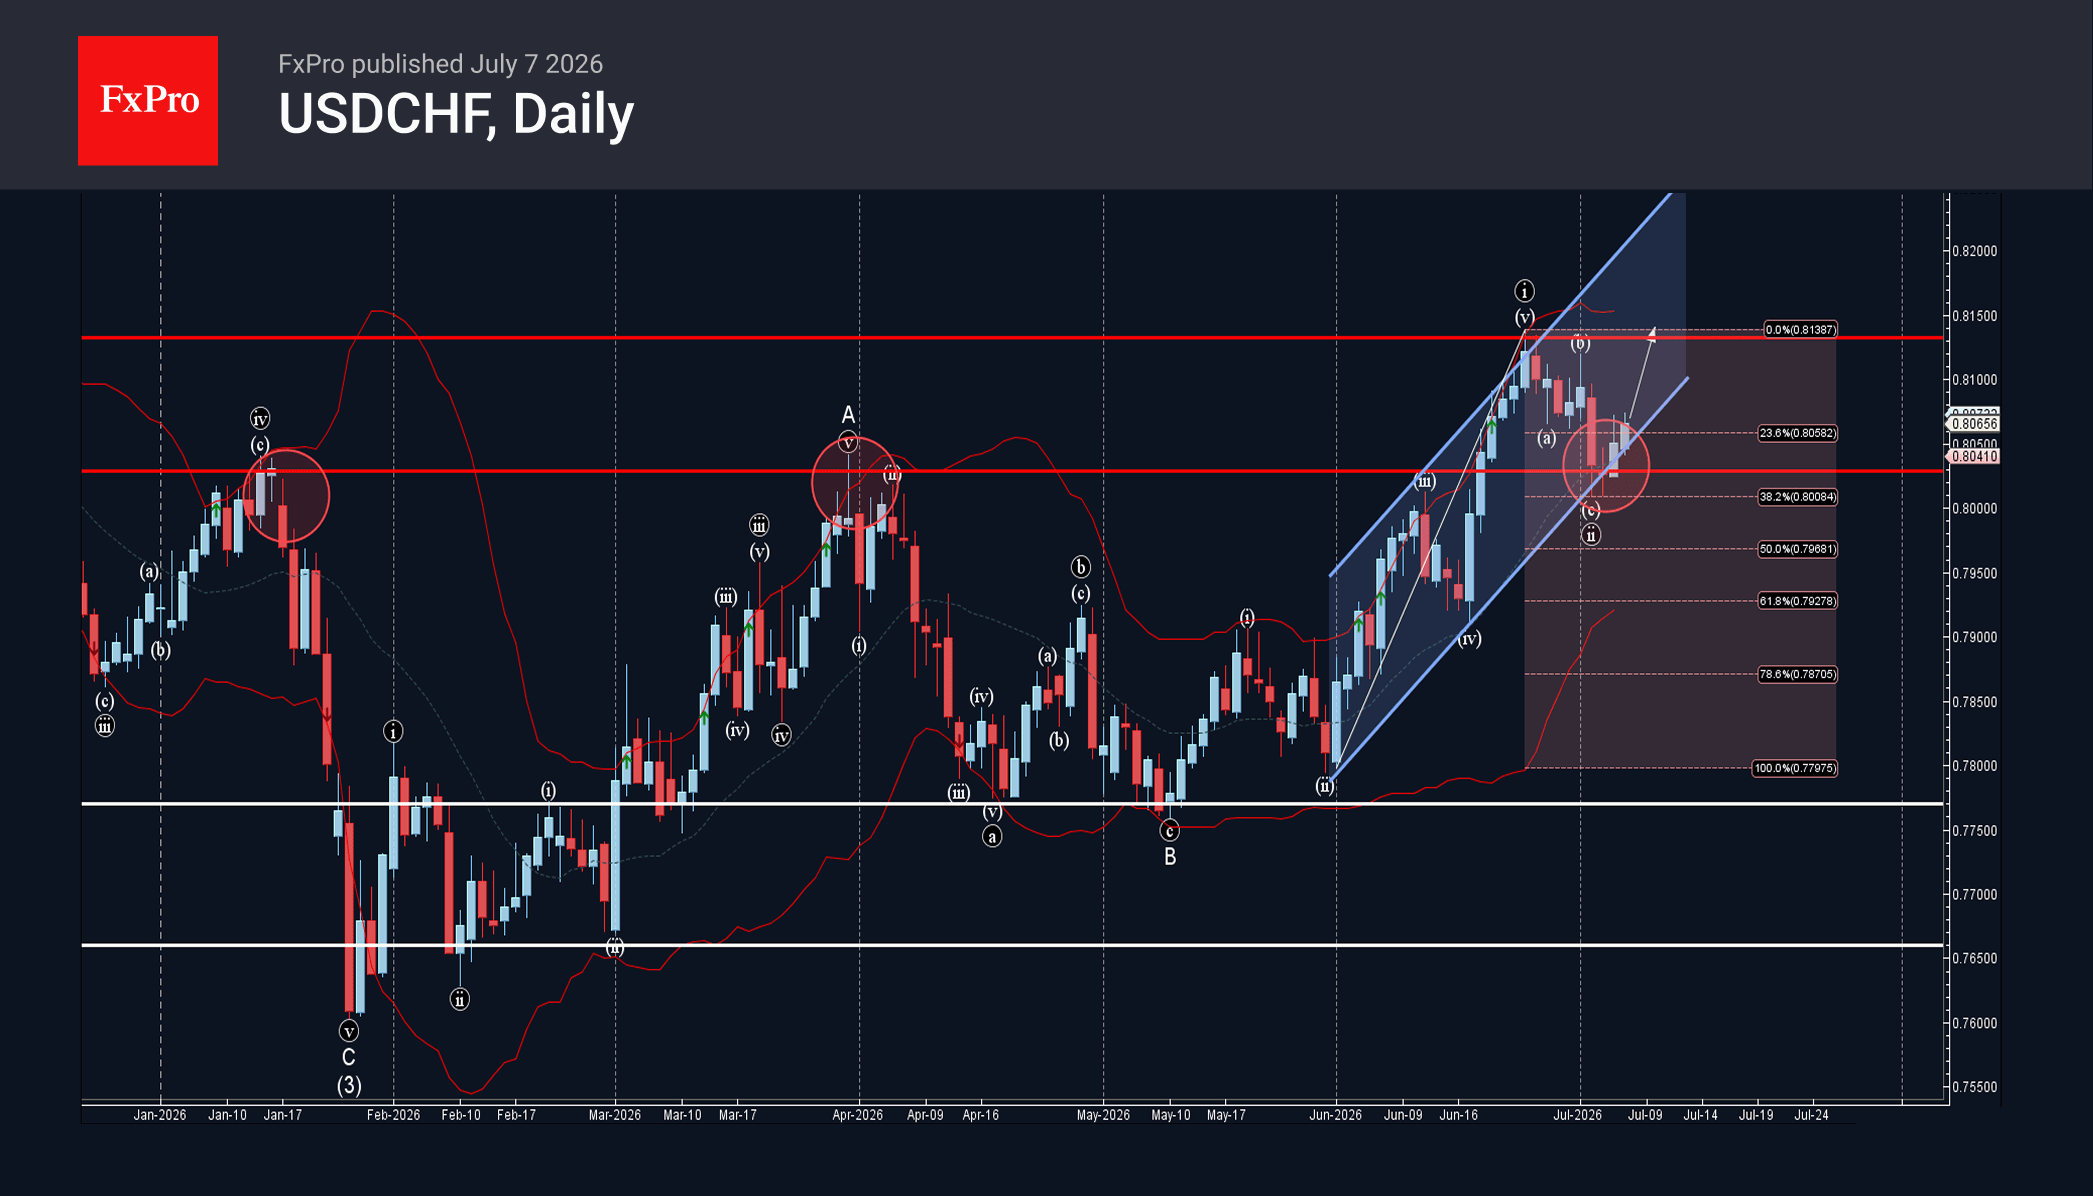
USDCHF currency pair reversed from the support zone between the pivotal support level 0.8030 (former strong resistance from January and March), 38.2% Fibonacci correction of the upward impulse from May and the support trendline of the daily up channel from May.
The upward reversal from this support area started the active short-term impulse wave iii from the start of July.
Given the bullish US dollar sentiment seen across the FX markets today, USDCHF currency pair can be expected to rise to the next resistance level 0.8130 (which stopped earlier impulse wave i).
Crypto: the Market Is Set to Test the Strength of the Downtrend
Market Overview
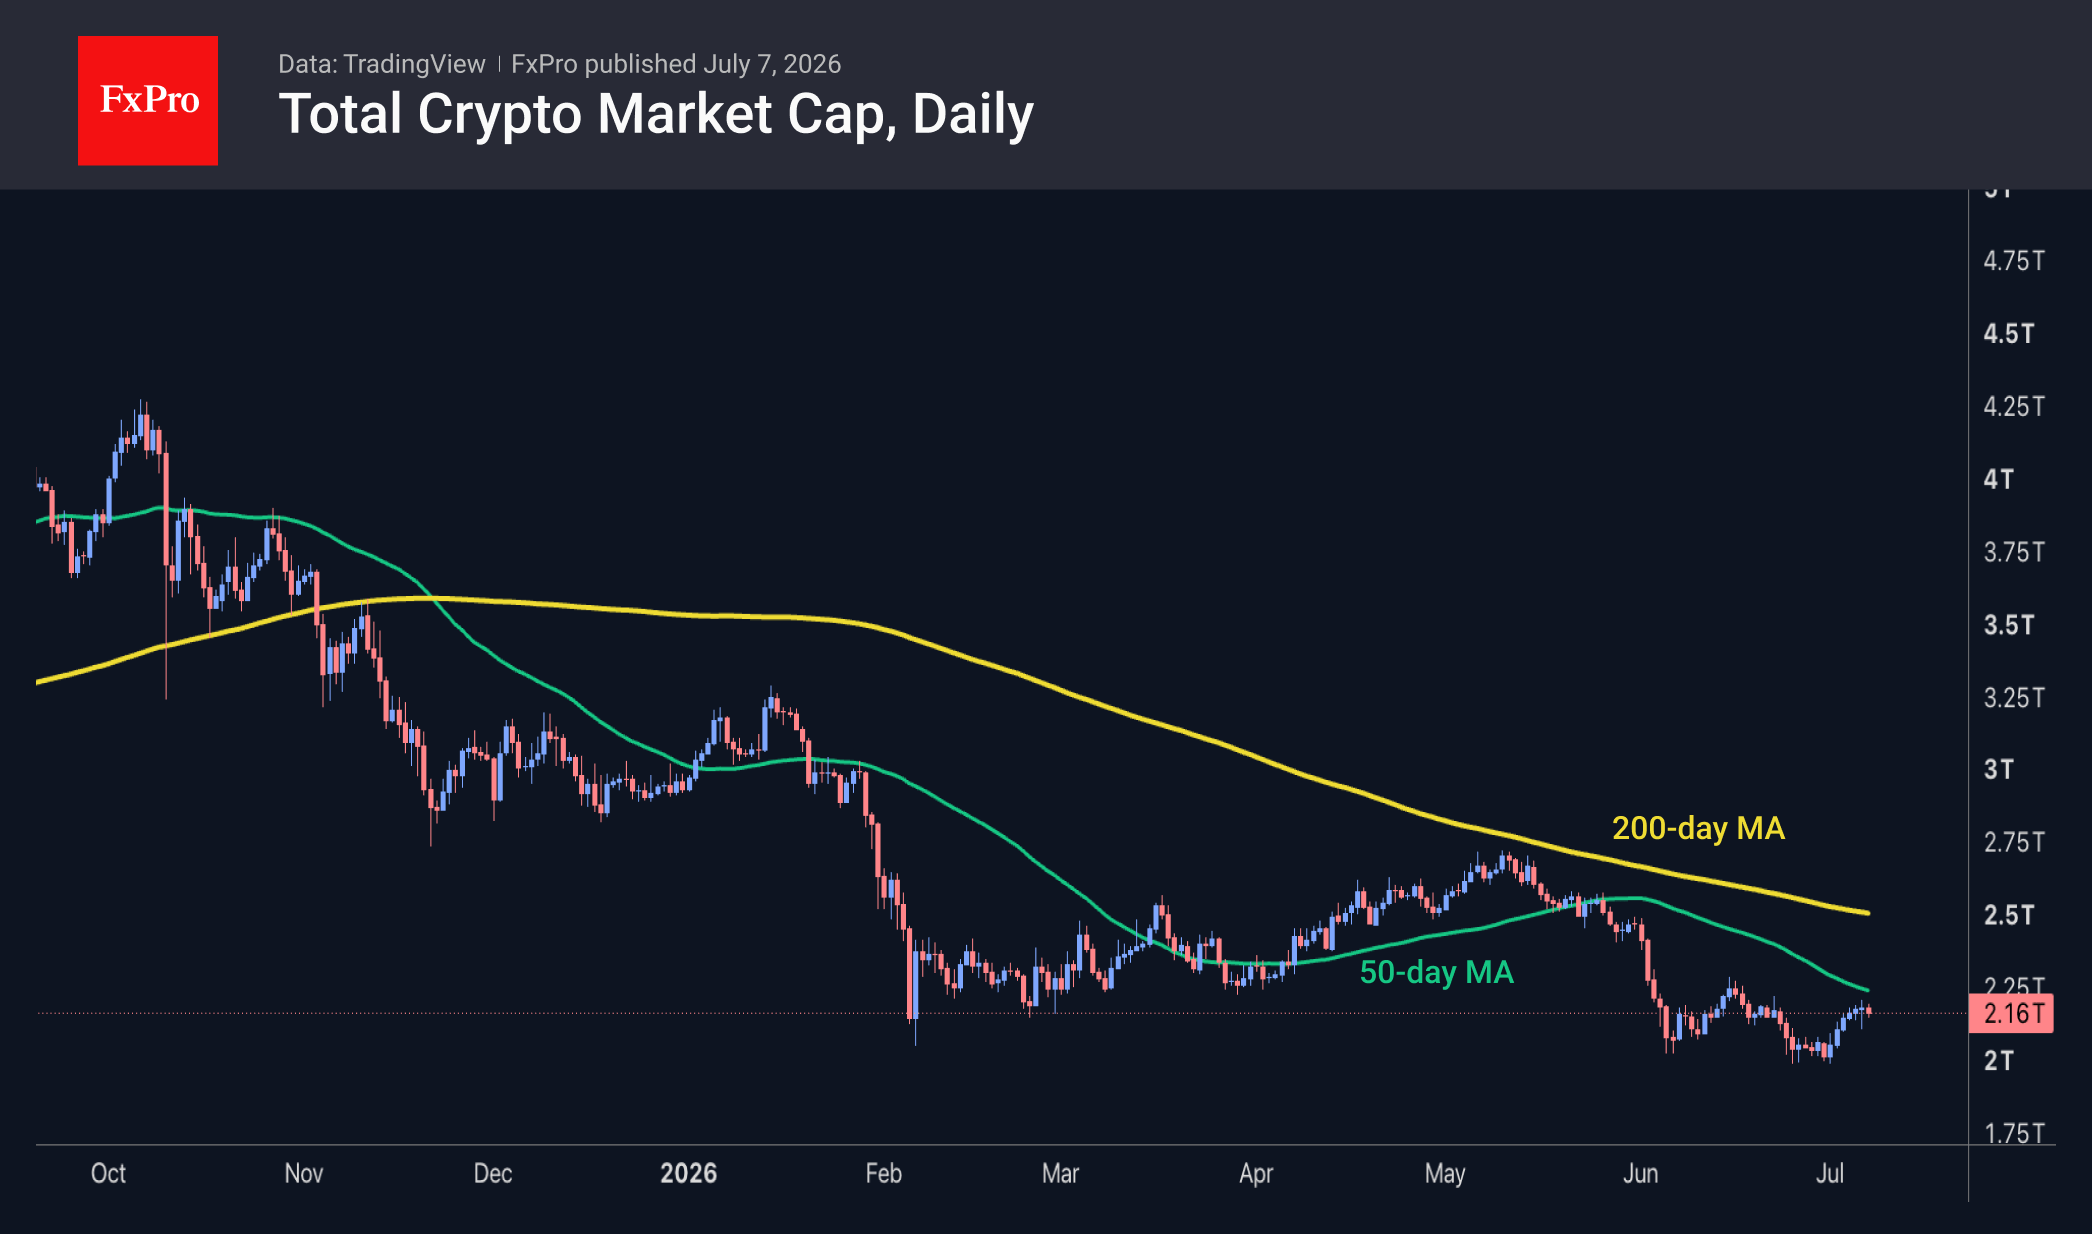
The crypto market capitalisation has risen by 2.3% over the past 24 hours to $2.19T. Still, we see the market’s ability to absorb the news of Strategy selling bitcoins from its reserves as the key development. The market began to recover from the initial dip fairly quickly, adopting a pragmatic stance regarding the scale of the sell-off. Although a test of the previous high is still to come, market capitalisation is approaching the 50-day moving average; a sustained move above this level would be an important confirmation of a reversal towards a bullish trend. Among the most active coins, the top gainers over the past 24 hours were Aptos (+6.1%), Internet Computer (+3.8%) and VeChain (+3.7%). Lagging were Stellar (-2.3%), Gram (-2.1%) and Hedera (-1.6%).
The sentiment index has risen to 27, emerging from the ‘extreme fear’ zone where it had remained for 40 days. That said, we once again advise waiting for a sustained move above the 50 level before concluding that the market has reversed. This is because such a move has not been achieved since last November.
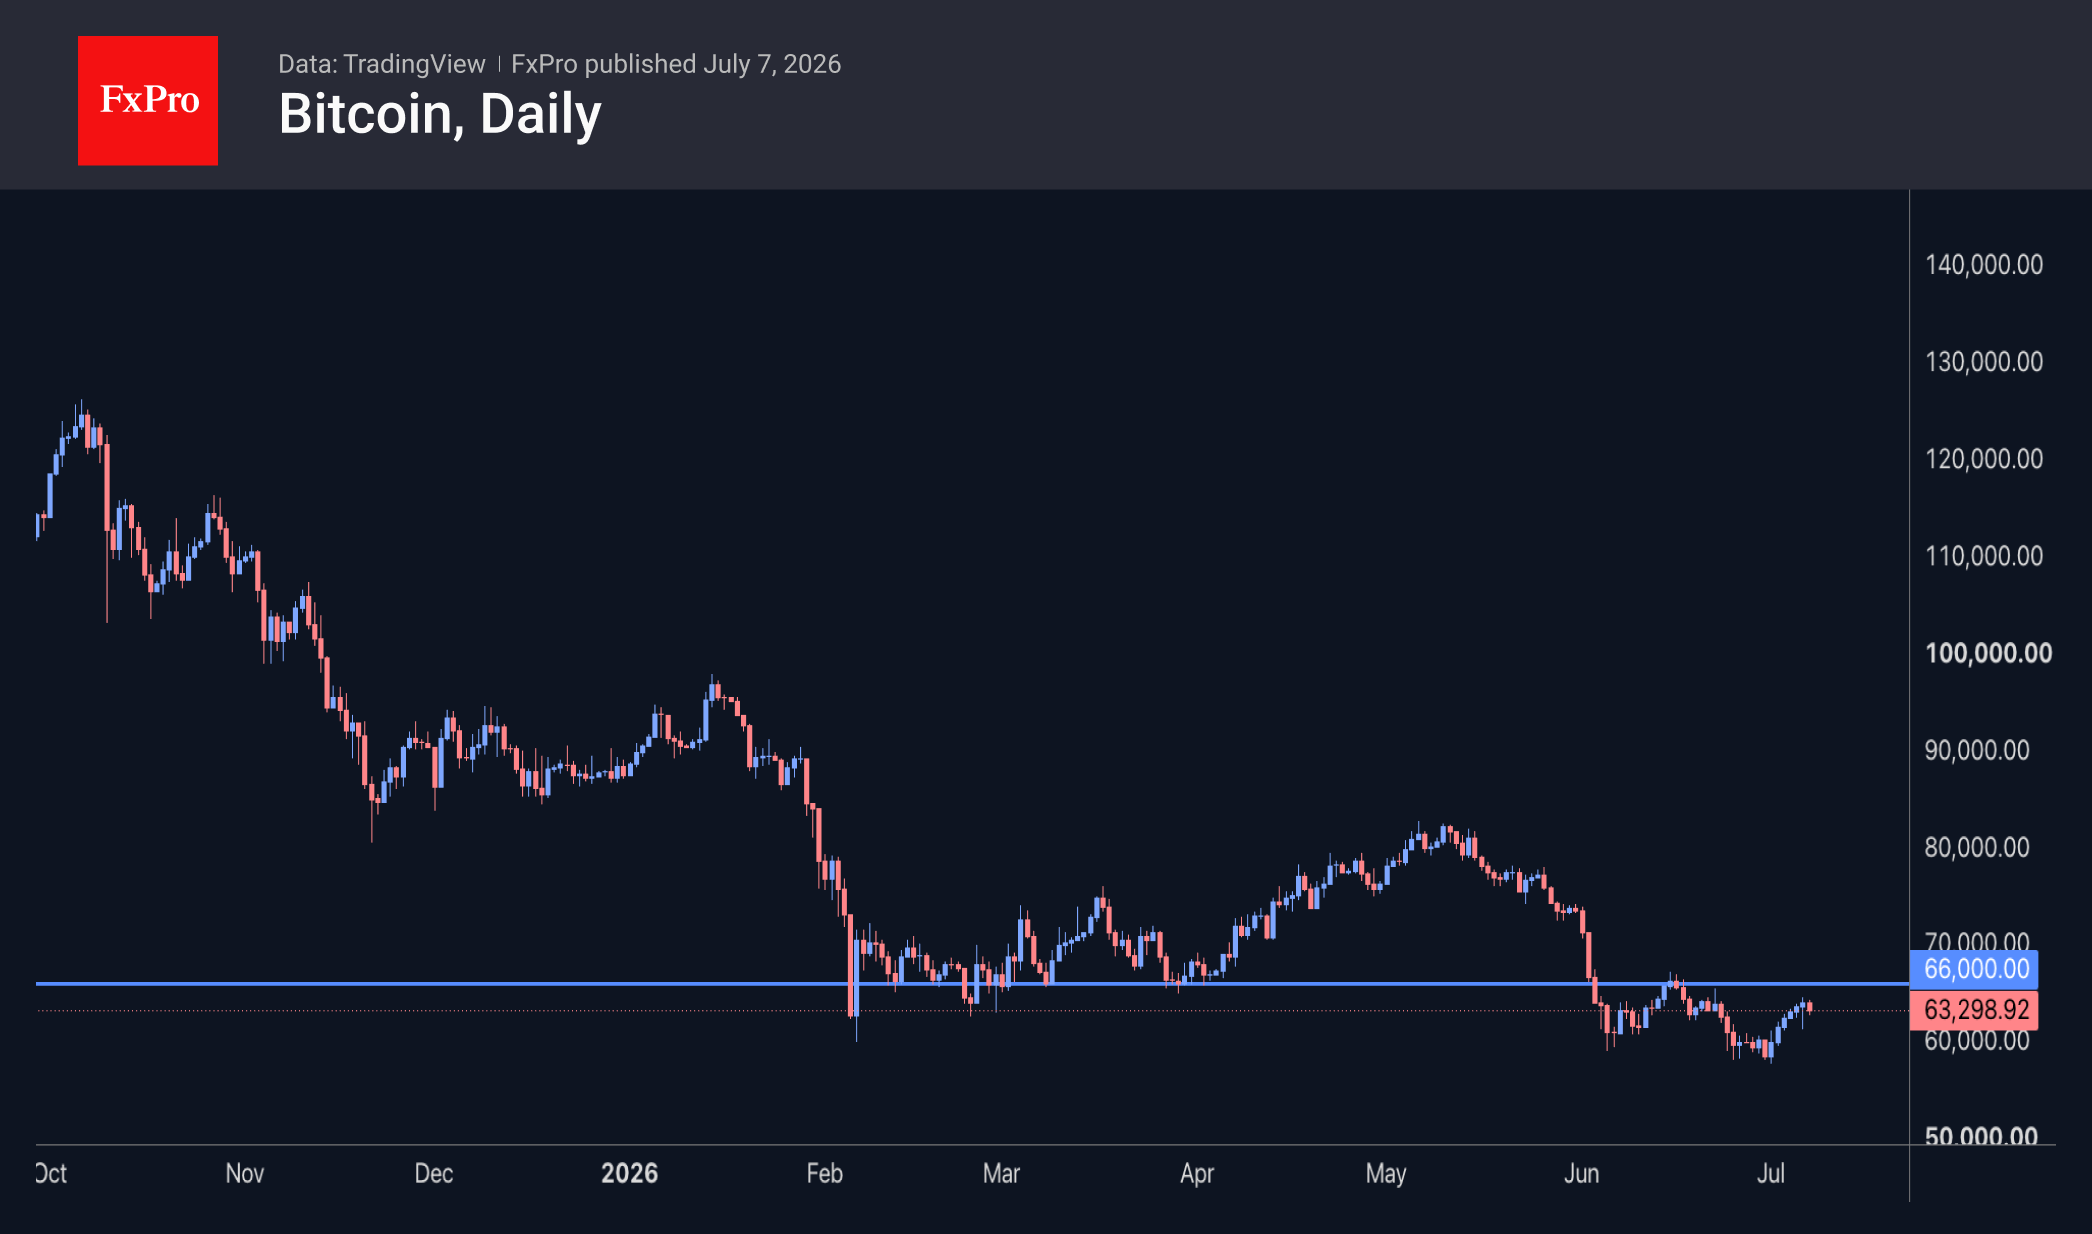
Bitcoin climbed above $64.5K at the start of the day, posting a bold 5.5% rise following the initial reaction to reports that Strategy had sold $226 million worth of the leading cryptocurrency. However, this momentum was short-lived, and we saw a pullback to $63K. Should the uptrend continue, it is worth monitoring Bitcoin’s performance around the $66K mark. A sustained move above this level could be one of the first signs of a trend reversal. However, we cannot rule out an intensification of selling pressure, as seen mid-last month.
News Background
Last week, Strategy sold 3,588 BTC (around $226 million) at an average price of around $60K per coin. Strategy’s reserves fell to 843,775 BTC, purchased at an average price of $74,476 per BTC. The proceeds were used to pay dividends on STRC preference shares.
According to Visa, the monthly volume of transactions involving stablecoins rose to a record $1.79 trillion in June. The figure jumped by 63% compared with May and by 125% year-on-year. Circle’s USDC accounted for the bulk of the volume in the first month of summer, making up around 67%.
Around one million people lost a total of $3.8 billion on investments in the US President’s TRUMP meme coin, according to Nansen’s calculations. In a recent financial disclosure, Trump reported receiving $636 million from the TRUMP token.
The FxPro Analyst Team
Eco Data 7/8/26
| GMT | Ccy | Events | Act | Cons | Prev | Rev |
|---|---|---|---|---|---|---|
| 23:50 | JPY | Bank Lending Y/Y Jun | 5.70% | 5.80% | 5.70% | |
| 02:00 | NZD | RBNZ Interest Rate Decision | 2.50% | 2.25% | 2.25% | |
| 05:00 | JPY | Eco Watchers Survey: Current Jun | 44 | 44.6 | 43.6 | |
| 14:00 | USD | Wholesale Inventories May F | 0.10% | 0.30% | 0.30% | |
| 14:30 | USD | Crude Oil Inventories (Jul 3) | 3.0M | -1.9M | -3.8M | |
| 18:00 | USD | FOMC Minutes |
| 23:50 | JPY |
| Bank Lending Y/Y Jun | |
| Actual | 5.70% |
| Consensus | 5.80% |
| Previous | 5.70% |
| 02:00 | NZD |
| RBNZ Interest Rate Decision | |
| Actual | 2.50% |
| Consensus | 2.25% |
| Previous | 2.25% |
| 05:00 | JPY |
| Eco Watchers Survey: Current Jun | |
| Actual | 44 |
| Consensus | 44.6 |
| Previous | 43.6 |
| 14:00 | USD |
| Wholesale Inventories May F | |
| Actual | 0.10% |
| Consensus | 0.30% |
| Previous | 0.30% |
| 14:30 | USD |
| Crude Oil Inventories (Jul 3) | |
| Actual | 3.0M |
| Consensus | -1.9M |
| Previous | -3.8M |
| 18:00 | USD |
| FOMC Minutes | |
| Actual | |
| Consensus | |
| Previous | |
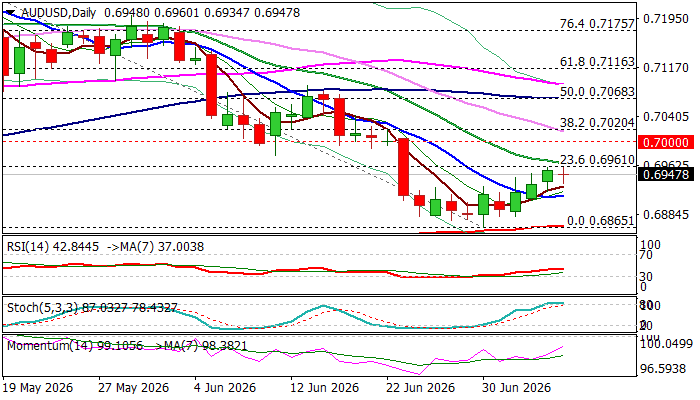
AUDUSD – Recovery Faces Increased Headwinds from Initial Fibo Resistance
Tuesday’s action, shaped in tight Doji candle, suggests that recovery leg from 0.6865 (June 30 low) starts to lose traction, following repeated failure at initial Fibo barrier at 0.6961 (23.6% retracement of 0.7271/0.6965) reinforced by falling 20DMA.
Overbought stochastic and south-turning RSI (currently at 42) on daily chart, warn of potential correction, if Fibo barrier at 0.6961 continues to cap.
Dips should be contained by broken 10DMA (0.6914) to keep near-term bias with bulls and prospects for acceleration towards 0.7000/20 pivots (psychological / Fibo 38.2%) and 0.7068 (50% retracement / 100DMA) in extension.
The notion is supported by softer tones from the US central bank on monetary policy, particularly on signals of weakening US labor sector, after disappointing June NFP data that almost fully sidelined expectations for Fed rate hike this month and dropped bets for a hike in September’s policy meeting.
On the other hand, the RBA kept hawkish stance that contributed to divergence of monetary policy views of two central banks and underpinned the Aussie dollar.
Conversely, any hawkish shift from the Fed may hurt near-term structure and risk retest of 200DMA (0.6868), key medium-term support, which keeps broader bulls (from Apr 2025) in play.
Res: 0.6961; 0.7000; 0.7020; 0.7068
Sup: 0.6914; 0.6868; 0.6833; 0.6766
Sunset Market Commentary
Markets
For the third consecutive session, markets were 'forced into' technical trading as there were few data with market-moving potential and as markets basically concluded that the assessment on the timing of (potential) rate hikes in the likes of the US or EMU is likely postponed at least until September (or even later). Even so, given this short-term 'market equilibrium', yields in the US and EMU today added a few bps. Oil prices after a protracted decline from levels near $120 p/b end-April, apparently found a short-term bottom. This is a nice setback reversing most of the post-war rise. Even so, quotations further out on the oil curve still are higher compared to the start of the year. In this respect, uncertainty on supply (e.g. potential fees to pass through the Strait of Hormuz, military incidents and/or other potential supply issues) isn't solved yet and still might affect prices. Whatever the reason, Brent oil trades near $72.5 p/b, off the lows near $70 touched last week. In this context, US and European/German yields add 3–4 bps across the curve. Fiscal sustainability also probably remains an issue. In this respect, Japanese yields continued to rise this morning between 1.9 bps and 3.2 bps over the 2-y–20-y sector, with 10-y and 20-y setting new multi-decade highs at 2.86% and 3.84% respectively. The 30-y fared a bit better in auction outcome today, but most of the intraday gains had to be returned later in the session. Regarding the theme of fiscal sustainability, we also keep an eye on the monthly US Treasury refinancing starting with a $58bn 3-yr note action this evening. The sale of 10-y Notes (tomorrow) and 30-y Notes (Thursday) in this respect might be more important as a pointer. Equity markets entered somewhat of a more erratic pattern. This apparently is a mix of some kind of sector rotation, but also a hesitant reaction to results in tech/AI-related sectors (e.g. Samsung this morning), suggesting some market nervousness on valuations going into the Q2 earnings season. The EuroStoxx 50 eased 0.5%. After Nasdaq outperformance yesterday, some rotation (or is it hesitancy?) is again at work with the Dow gaining 0.4%, the S&P opening little changed and the Nasdaq correcting 0.6%.
For now, very little to report on the major USD cross rates. The delay on policy moves at least until after summer 'neutralizes' interest rates and interest rate differentials as a factor for FX trading. At this stage it's also not clear which currencies might be affected most in case fiscal sustainability would gain importance as a global market factor. EUR/USD is going nowhere. The pair holds in the lower half of the 1.14 big figure (1.1435). DXY in a similar pattern hovers sideways near 101 (100.95). USD/JPY at 161.9 still shows yen fragility, but at least for now the impression is that markets and Japanese authorities also respect some kind of implicit short-term ceasefire. Sterling remains well bid against the euro, with EUR/GBP (0.8545) near the lowest levels in more than a year.
News & Views
Hungarian inflation in June landed close to expectations. Prices stagnated on a monthly basis and pulled the yearly print further below the 2% lower limit of the 3% ±1 ppt target range (1.7% from 1.8%). Food prices fell by 0.2% m/m (and y/y), Hungary's statistics office showed. Services added 0.3% to their prices (4% y/y) while electricity, gas and other fuel prices were up by 0.4% (−2.3% y/y). Core CPI rose 0.14% m/m with the annual print at 1.97%, more or less matching May. Sticky price inflation, a measure compiled by the central bank, eased from 3.8% y/y to 3.6% – the slowest since May 2020. The central bank's flash analysis shows that June CPI came in below the projections made last month. The Hungarian central bank at its June meeting lowered rates by 25 bps and flagged several more to come throughout the summer months. Budapest gets backing from today's data to do so. The dovish messaging triggered negligible HUF depreciation, meaning currency markets are not protesting either. EUR/HUF today barely budged around 354. Money markets assume MNB easing to end around 5% from a 6% base rate currently.
Prices fell 0.3% m/m in Czechia last month. The bigger-than-expected drop dragged y/y inflation from 2.1% to 1.5% vs 1.8% expected. Core CPI (ex. energy, food, alcohol and tobacco) rose 0.3% m/m and remained at May's 3.1%. Combined with elevated services inflation at 4.5% (from 4.7%), it suggests underlying price momentum is stronger than it looks on the surface. Energy prices indeed dropped a sharp 2.8% m/m amid the recent oil price decline, pushing the y/y figure to −1% in a sharp reversal from May's +1.8%. It is this stubborn domestic price risk that prompted the Czech National Bank to raise rates to 3.75% last month. Guidance for future moves was scarce but most policymakers labelled the June move as a precautionary one rather than the start of a cycle. Czech money markets entertain the idea of another increase in one of the upcoming meetings (perhaps September), even after today's CPI miss. The Czech koruna loses some ground to EUR/CZK 24.23.
Canada’s Trade Surplus Widens in May
- Canada's trade balance moved further into surplus territory in May, widening to $4.2 billion from $3.4 billion the prior month.
- Exports in May moved higher by 0.9% month-on-month (m/m) following sturdy gains over the past three months. Exports of metal ores and non-metallic minerals, led by sulphur shipments (+37% m/m) and aluminum (+50.7%) contributed most to the headline increase. Sturdy gains in consumer goods exports (+3.9% m/m) and basic and industrial chemical, plastic, and rubber products (+5.6% m/m) were partially offset by a 2.0% m/m pullback in energy exports following a robust April performance.
- Goods imports edged lower by 0.2% m/m in May, reversing April's gain. However, the decrease was narrowly based, with imports of unwrought gold, silver, and platinum falling by 33% m/m. Otherwise, 9 of 11 subsectors booked a gain, including consumer goods (+3.5% m/m), industrial machinery and equipment (+2.8% m/m) and aircraft/other transportation equipment (+5.7% m/m).
- In volume terms, exports were flat while imports nudged higher by 0.4% m/m.
- Canada's merchandise trade surplus with the United States widened to $11.6 billion in May to $10.3 billion in April. Exports to non-U.S. destinations continued to moderate in May, dipping 0.3% m/m.
Key Implications
- With data through the first two months of the quarter, trade activity remains consistent with net exports shifting from a Q1 drag to a modest tailwind for real GDP growth in Q2. With flows still heavily influenced by volatile components (notably oil, gold and autos), trade contributions are likely to remain choppy through the remainder of the year.
- Beyond the monthly data, Canada’s trade backdrop remains fragile amid elevated policy risk. The July 1 CUSMA deadline passed without renewal, shifting the agreement into rolling annual reviews and prolonging uncertainty amid unresolved issues related to steel, aluminum, autos, lumber, procurement, etc. This leaves risks modestly tilted to the downside even as solid U.S. demand offers a partial offset.
The Next Dollar Catalyst Is CPI. The Bigger Story Is Inside the Fed.
Financial markets spent much of today's session waiting rather than reacting. Most major currency pairs traded comfortably within yesterday's ranges as investors resisted making large directional bets ahead of tomorrow's RBNZ decision and next week's US inflation report. Dollar and Yen were the day's strongest performers, but neither attracted enough follow-through buying to establish fresh trends, underscoring a market searching for its next catalyst.
The relatively subdued price action in USD/JPY also suggests both bulls and bears are becoming more selective. While the pair remains close to last week's 40-year high, Dollar bulls have shown little appetite to force a breakout. Traders recognize that, for Japanese authorities, intervention is more about timing than any specific exchange-rate level. Thin-liquidity periods, when official buying can have the greatest market impact, remain the preferred windows for action.
For the Dollar, the next meaningful opportunity to establish direction is likely to come from next week's June CPI report. Last week's weaker-than-expected payrolls reduced expectations for an earlier Fed rate hike, but they did not overturn the broader view that policymakers still expect one increase before year-end. Inflation data therefore remain the key test of whether the Fed's more hawkish June projections will ultimately be validated.
Kiwi, meanwhile, lagged ahead of tomorrow's RBNZ meeting, where policymakers face one of the most evenly balanced decisions of the year. The NZIER Shadow Board recommended leaving the Official Cash Rate unchanged but described the decision as a "line-ball" call. That uncertainty is echoed by New Zealand's major banks, with ANZ and BNZ expecting a hike while ASB and Westpac forecast another hold. With conviction low on both sides, markets appear content to wait for the policy statement rather than speculate aggressively beforehand.
Yet perhaps the more interesting debate this week has not been about where rates are heading, but about how central banks should communicate them. A philosophical divide has emerged within the Federal Reserve over the role of forward guidance, raising broader questions about how investors should interpret future policy signals.
Kevin Warsh — structural skeptic, near-blanket opposition
Fed Chair Kevin Warsh's position isn't "use it carefully," it's closer to "don't use it, full stop, for now." At his first press conference (June 17) he declined to submit a dot-plot projection at all, explicitly because of his opposition to forward guidance, making him the only one of 19 policymakers with no dot on the chart. He shortened the FOMC statement itself from 341 words to 132. His stated logic: forward guidance can lock policymakers into positions too early and compound mistakes when the economic picture shifts, and financial markets have become too dependent on Fed signaling in a way that reduces the Fed's own flexibility.
At the ECB's Sintra forum (June 30), he went further, framing this as a philosophical stance shared with other central bankers rather than a Fed-specific policy quirk — arguing central banks should stop trying to predict the economy, alongside ECB's Lagarde, BoE's Bailey, and BoC's Macklem, who separately voiced the same skepticism. Lagarde's framing is telling: she said she regretted having "felt bound and compelled by forward guidance" — Warsh is positioning this as guidance-as-trap, not guidance-as-tool.
He's held this line even under pressure to clarify next steps: as recently as July 1 he declined to say what the Fed would do next, saying "I'm not going to make a judgment now... the tactics, the strategy, and the rest, that's still to come."
Christopher Waller — tool-specific, situational usefulness
Governor Christopher Waller's framing is narrower and more conventional central-bank-economist: forward guidance can aid the transmission of monetary policy by influencing expectations and market reactions — evidenced by Treasury yields moving ahead of actual rate hikes — but it's not appropriate in all cases. That's a "right tool for the right regime" argument, not a rejection of the concept. Waller has separately been on record wanting the Committee to strip out any easing bias and move to a more neutral policy stance — a substantive rate-path view distinct from Warsh's process critique.
Where the contrast really lies
The interesting split isn't hawk-vs-dove — both are currently reading the data cautiously given May's 4.2% CPI print — it's methodological: Warsh's objection is closer to epistemic (he thinks the exercise of publishing forward paths is itself flawed and creates false precision that constrains later decisions), while Waller's is closer to operational (guidance is a legitimate instrument, deploy it when the transmission mechanism benefits, hold back when it doesn't). Waller would likely still show up on a dot plot with a number; Warsh pointedly won't. That's a genuine philosophical difference about the Fed's communication function, layered on top of whatever their individual rate-path views happen to be.
For investors, the implication is straightforward. If the Fed gradually shifts toward Warsh's philosophy, markets may receive fewer explicit policy signals and become increasingly dependent on incoming data. That would make releases such as CPI, employment and inflation expectations even more important, reinforcing the transition already taking place in FX markets toward a world driven less by central bank guidance and more by country-specific economic fundamentals.
Bitcoin Passed a Key Stress Test. Now Comes the Hard Part.
Bitcoin's biggest story last week wasn't its rebound above $60,000—it was the market's ability to absorb a $216 million sale by Strategy without breaking lower. That resilience suggests much of the recent forced selling may have already been flushed out. We examine why a near-term base could be forming, why a durable market bottom is still unconfirmed, and the technical levels that could decide Bitcoin's next major move. Read More.
GBP/CHF Nears Trend-Reversal Zone as Political Risk Fades and Sterling Shorts Unwind
Sterling's rally has been driven less by improving UK fundamentals than by the rapid unwinding of political risk and one of the market's largest speculative short positions. With the Bank of England maintaining a restrictive policy stance and GBP/CHF approaching a major technical resistance zone, the conditions for a medium-term bullish reversal are falling into place. Read More.
ECB's Panetta: Fragile Outlook Means No Predetermined Path for Rates
The ECB should not lock itself into a predetermined policy path, according to Governing Council member Fabio Panetta. While inflation risks remain elevated, he warned that the Eurozone's fragile growth outlook and ongoing geopolitical uncertainty require policymakers to stay flexible and data-dependent. Read More.
Japan Real Wages Extend Longest Growth Streak Since 2021
Japan's wage growth remained solid in May as real wages extended their longest positive run since 2021, while household spending declined far less than expected. The latest data point to improving household purchasing power and resilient consumer demand despite moderating wage momentum. Read More.
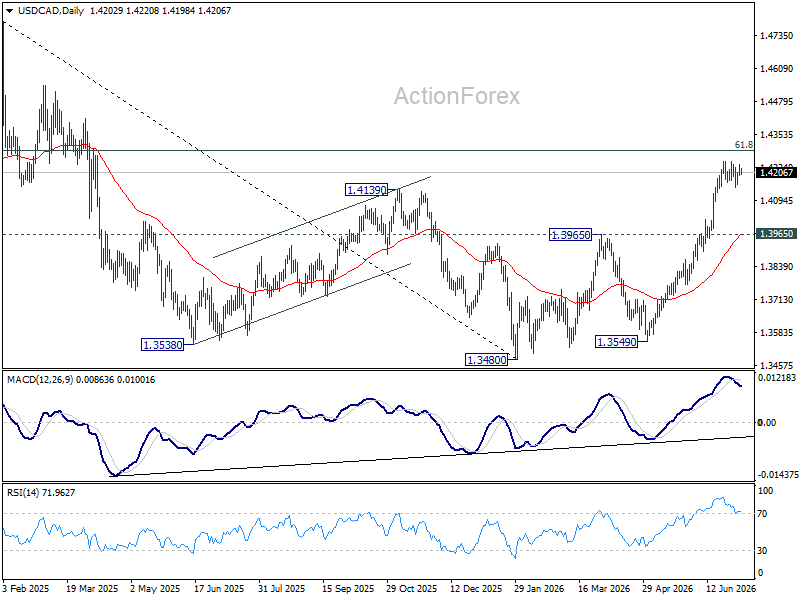
USD/CAD Daily Outlook
USD/CAD is staying in consolidations below 1.4247 and intraday bias remains neutral. Deeper pullback cannot be ruled out. But downside should be contained above 1.3965 resistance turned support. Above 1.4247 will resume the rally from 1.3480 to 61.8% retracement of 1.4791 to 1.3480 at 1.4290. Firm break there will pave the way back to 1.4791 high.
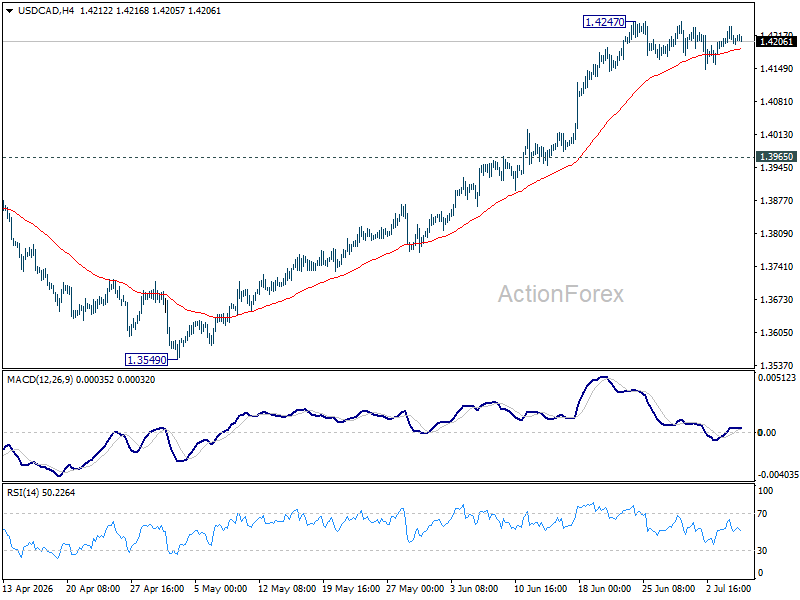
In the bigger picture, current development suggests that fall from 1.4791 has completed as a three wave correction to 1.3480. It's still early to judge if rise from there a corrective bounce, or resumption of the larger up trend from 1.2005 (2021 low). But in either case, retest of 1.4791 high should be seen next.
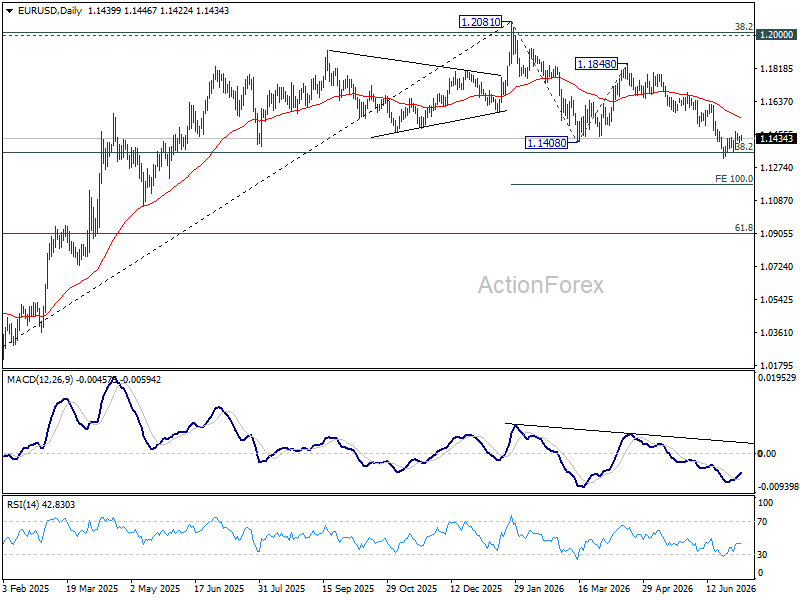
EUR/USD Daily Outlook
EUR/USD is staying in consolidations above 1.1323 and intraday bias remains neutral. With 1.1499 support turned resistance intact, further decline is expected. On the downside, break of 1.1323 will resume the fall from 1.2081 to 100% projection of 1.2081 to 1.1408 from 1.1848 at 1.1175. However, decisive break of 1.1499 will turn bias back to the upside for 55 D EMA (now at 1.1546) and above.
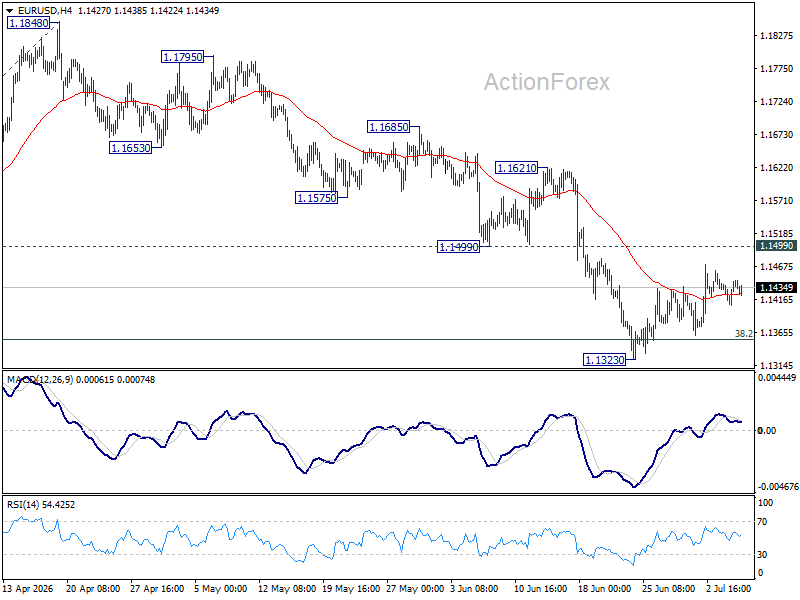
In the bigger picture, focus is back on 38.2% retracement of 1.0176 to 1.2081 at 1.1353. Decisive break there will revive the case of medium term bearish trend reversal after rejection by 1.2 key cluster resistance level. Further fall should be seen to 61.8% retracement at 1.0904. Nevertheless, strong rebound from 1.1353, followed by break of 1.1621 resistance, will retain medium term bullishness.
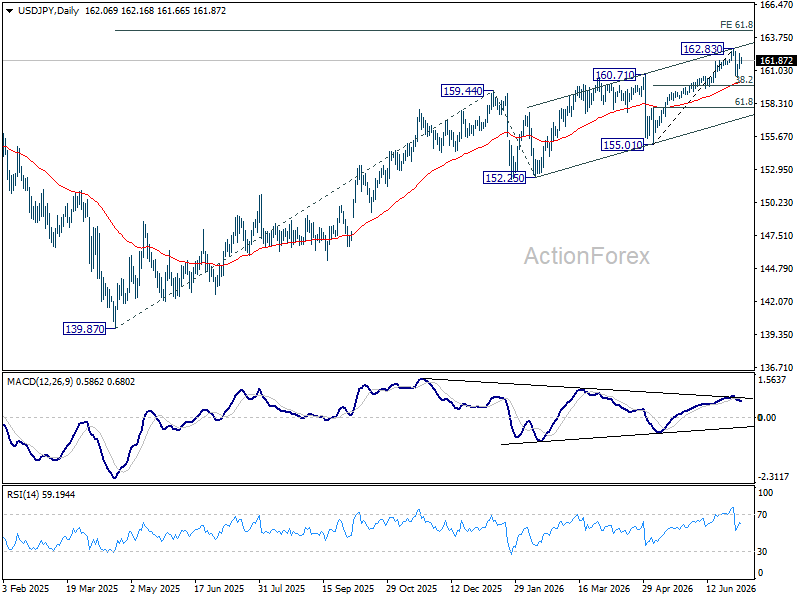
USD/JPY Daily Outlook
Intraday bias in USD/JPY remains neutral and more consolidations would be seen below 162.83. In case of another fall, downside should be contained by 38.2% retracement of 155.01 to 162.83 at 159.84. On the upside, firm break of 162.83 will resume larger up trend.
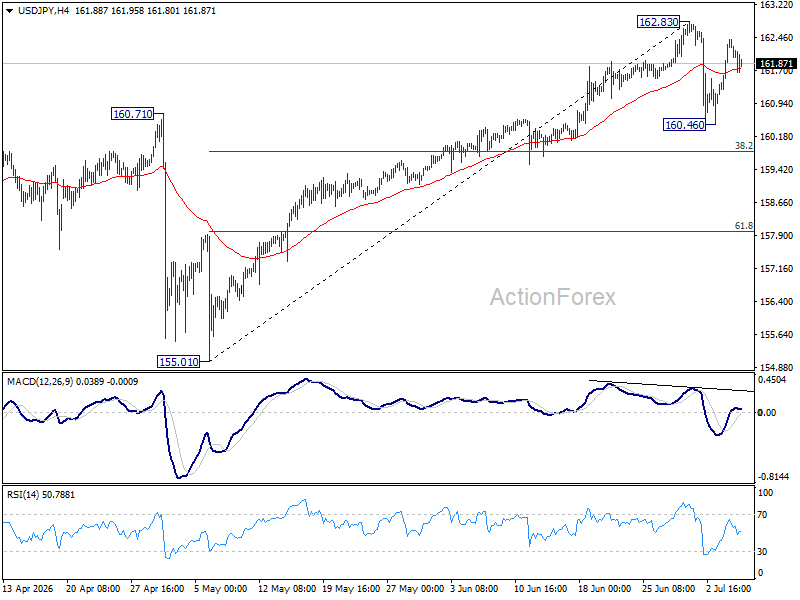
In the bigger picture, rise from 139.87 (2025 low) is seen as another rising leg of the long term up trend. Next target is 61.8% projection of 139.87 to 159.44 from 152.25 at 164.34. For now, outlook will remain bullish as long as 155.01 support holds, even in case of deep pullback.