
Sample Category Title
AUD/USD Daily Report
AUD/USD is staying in consolidations from 0.6864 ad intraday bias remains neutral. Further fall is expected as long as 0.6977 support turned resistance holds. Below 0.6864 will target 0.6832 support. Firm break there will target 0.6756 fibonacci level. However, sustained break of 0.6977 will bring stronger rebound to 0.7087 resistance instead.
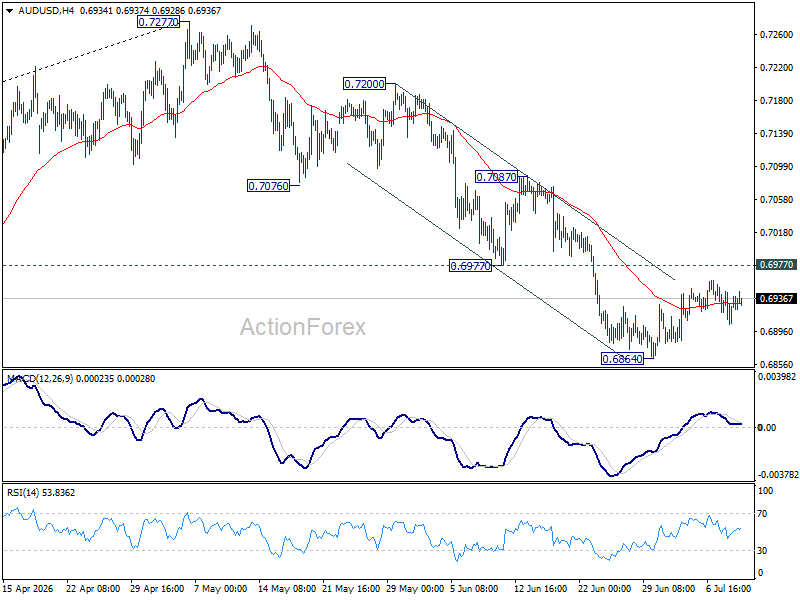
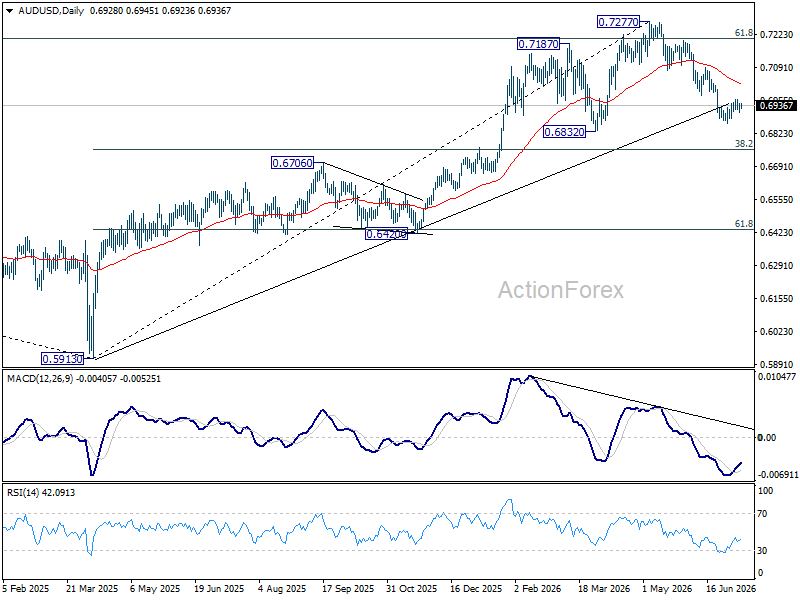
In the bigger picture, considering bearish divergence condition in D MACD, a medium term top could be formed at 0.7277 after failing to sustain above 61.8% retracement of 0.8006 (2021 high) to 0.5913 (2024 low) at 0.7206. Deeper fall could be seen to 38.2% retracement of 0.5913 to 0.7277 at 0.6756 as a correction. But strong support should be seen there to bring rebound. Consolidations would continue below 0.7277 for a while.
USD/CAD Daily Outlook
Consolidation continues below 1.4247 and intraday bias remains neutral in USD/CAD. Deeper pullback cannot be ruled out. But downside should be contained above 1.3965 resistance turned support. Above 1.4247 will resume the rally from 1.3480 to 61.8% retracement of 1.4791 to 1.3480 at 1.4290. Firm break there will pave the way back to 1.4791 high.
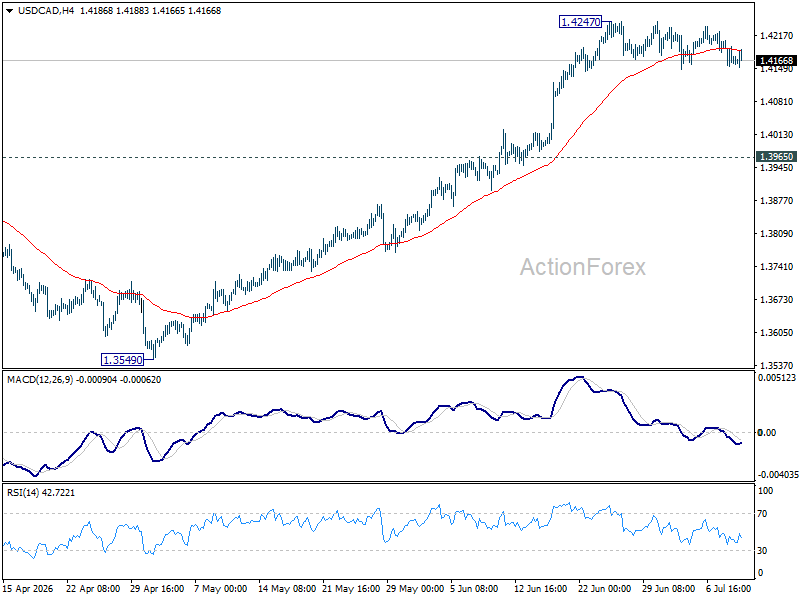
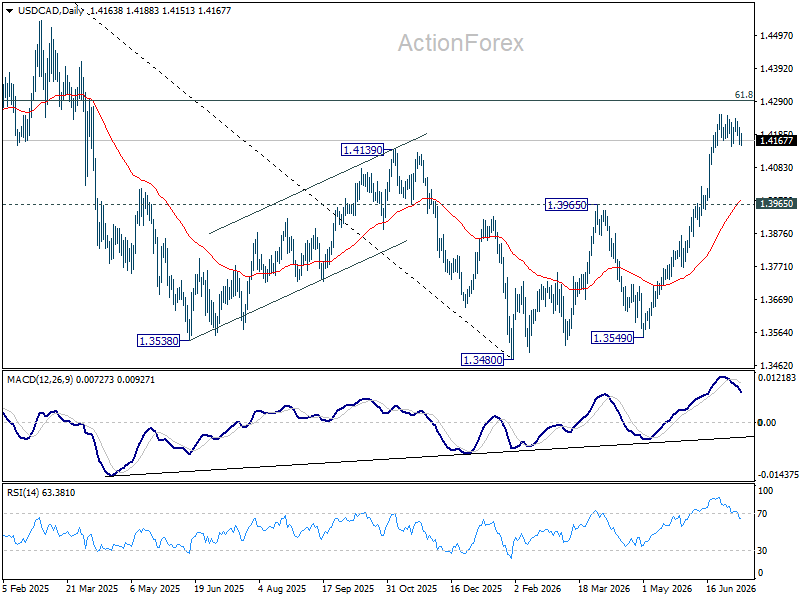
In the bigger picture, current development suggests that fall from 1.4791 has completed as a three wave correction to 1.3480. It's still early to judge if rise from there a corrective bounce, or resumption of the larger up trend from 1.2005 (2021 low). But in either case, retest of 1.4791 high should be seen next.
GBP/JPY Daily Outlook
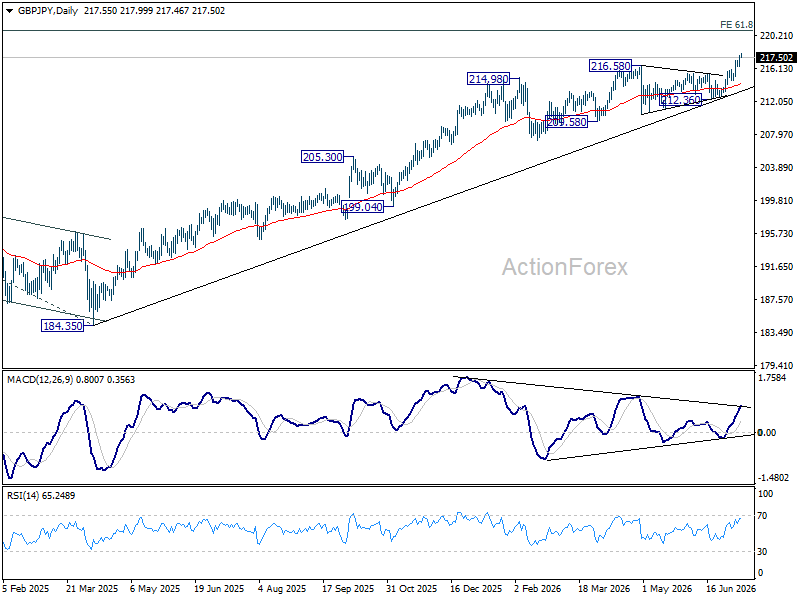
GBP/JPY's rally resumed after brief consolidations and intraday bias is back on the upside. Current up trend should target 220.90 fibonacci projection level next. On the downside, below 216.34 minor support will turn intraday bias neutral again and bring consolidations, before staging another rally.
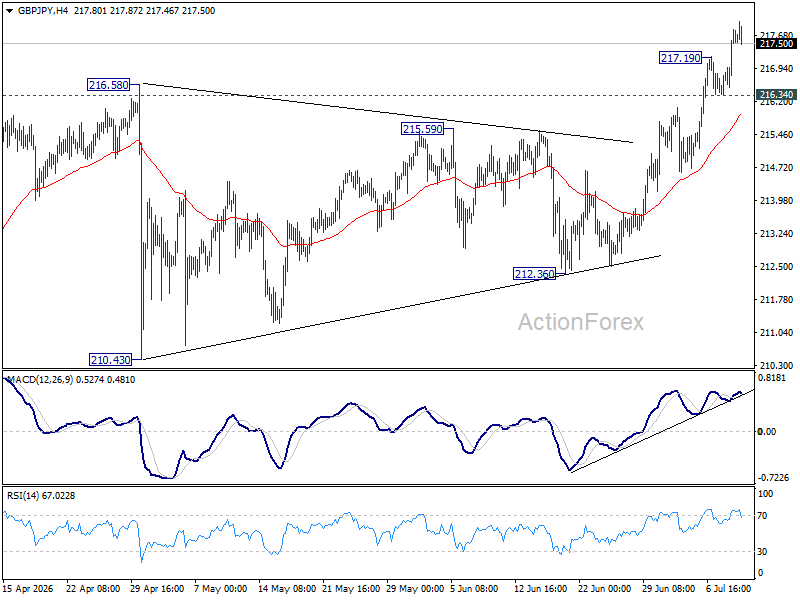
In the bigger picture, there is no clear sign of trend reversal yet. The long term up trend could still extend to 61.8% projection of 148.93 (2022 low) to 208.09 (2024 high) from 184.35 at 220.90 on resumption. However, sustained break of 55 W EMA (now at 207.89) will argue that it's already in medium term down trend for 184.35 support.
EUR/JPY Daily Outlook
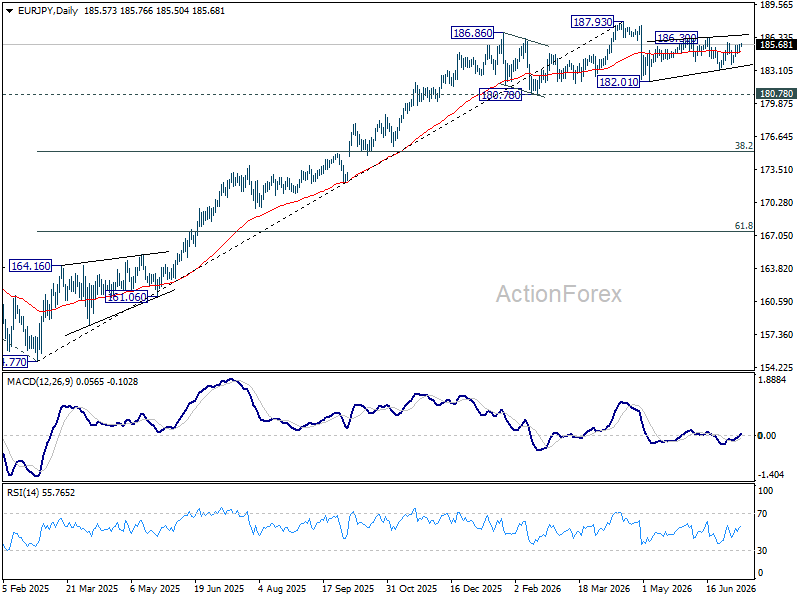
EUR/JPY is still bounded in range trading and intraday bias stays neutral at this point. On the upside, break of 186.30 will resume the rebound from 182.01 to retest 187.93 high. On the downside, break of 183.14 will target 182.10 support next.
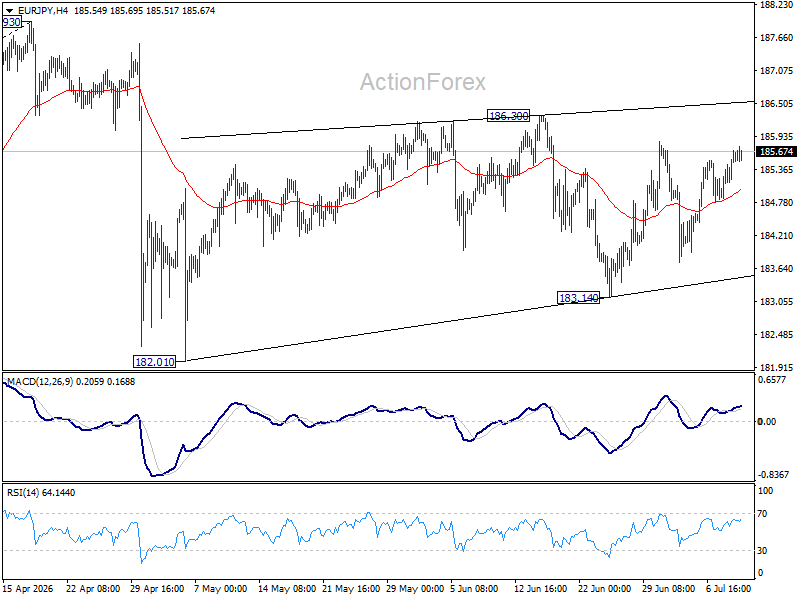
In the bigger picture, there is no sign of reversal yet. Uptrend from 114.42 (2020 low) is still expected to resume at a later stage to 78.6% projection of 124.37 (2022 low) to 175.41 (2025 high) from 154.77 at 194.88. However, sustained break of 55 W EMA (now at 179.76) will argue that it's already in a medium term down trend to 175.41 resistance turned support and below.
EUR/GBP Daily Outlook
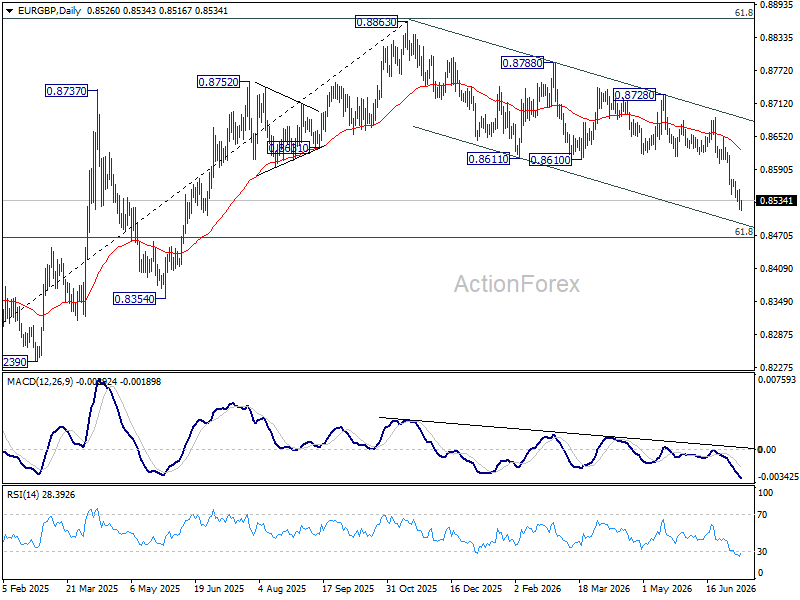
EUR/GBP's fall resumed after brief consolidations. Intraday bias is back on the downside for 61.8% retracement of 0.8221 to 0.8863 at 0.8466. On the upside, above 0.8554 resistance will turn intraday bias neutral again. But recovery should be limited by 0.8601 support turned resistance to bring another fall.
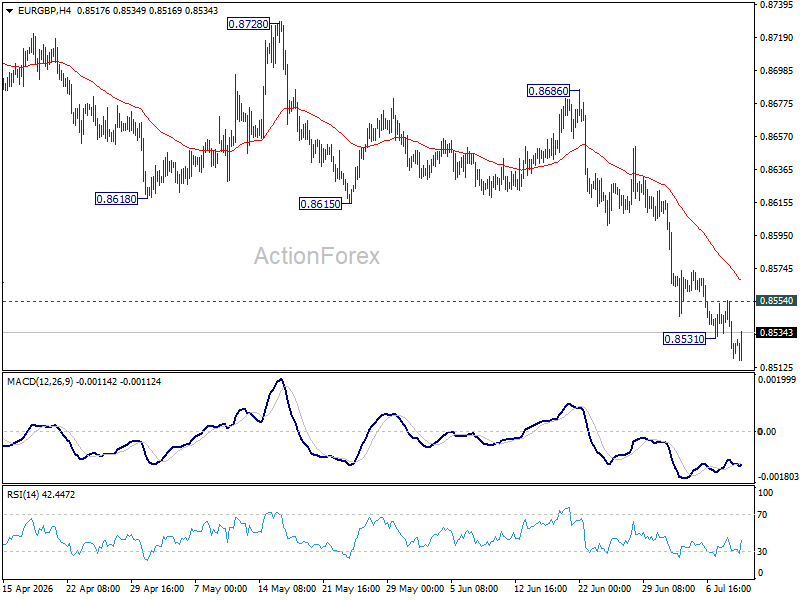
In the bigger picture, current development suggests that rise from 0.8221 (2024 low) has completed at 0.8863, just ahead of 38.2% retracement of 0.8221 (2024 low) to 0.8863 (2025 high) at 0.8618. Deeper fall would be seen back to 0.8201 (2022 low). For now, outlook will be neutral at best as long as 0.8863 hold.
EUR/AUD Daily Outlook
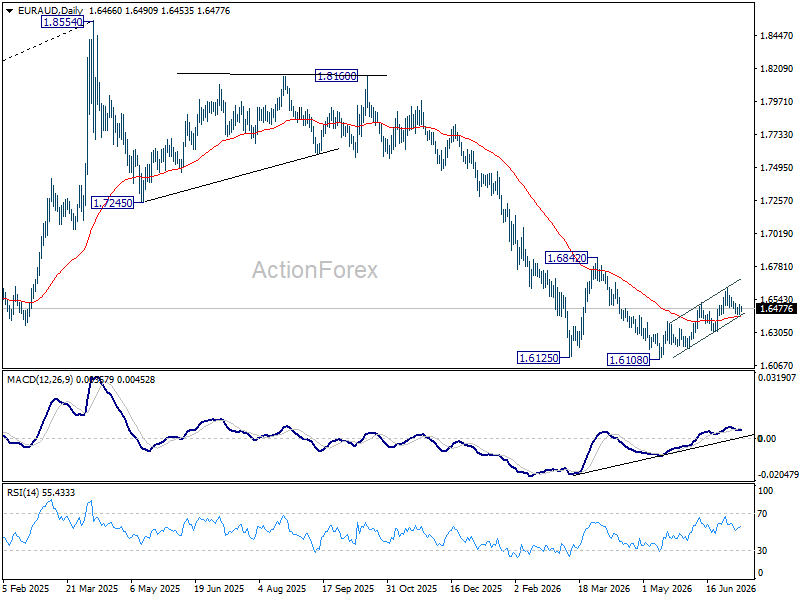
Intraday bias in EUR/AUD remains neutral and more consolidations could be seen. But further rise is in favor as long as 1.6306 support holds. Above 1.6617 will extend the rebound from 1.6108 towards 1.6842 key structural resistance. However, firm break of 1.6306 will turn bias back to the downside for retesting 1.6108.
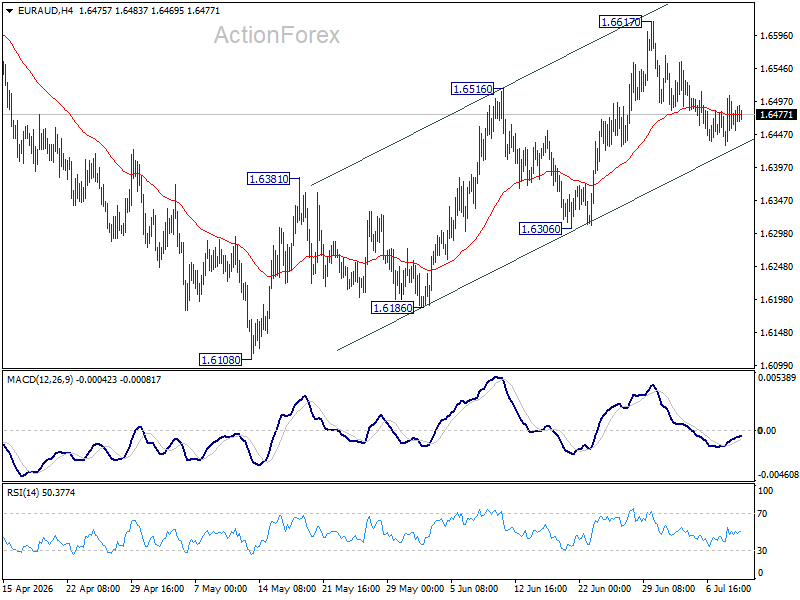
In the bigger picture, outlook will stay bearish as long as 1.6842 resistance holds. Fall from 1.8554 (2025 high) is expected to continue to 61.8% retracement of 1.4281 to 1.8554 at 1.5913. Decisive break there will pave the way back to 1.4281 (2022 low). However, firm break of 1.6842 should confirm medium term bottoming, and bring stronger rally.
EUR/CHF Daily Outlook
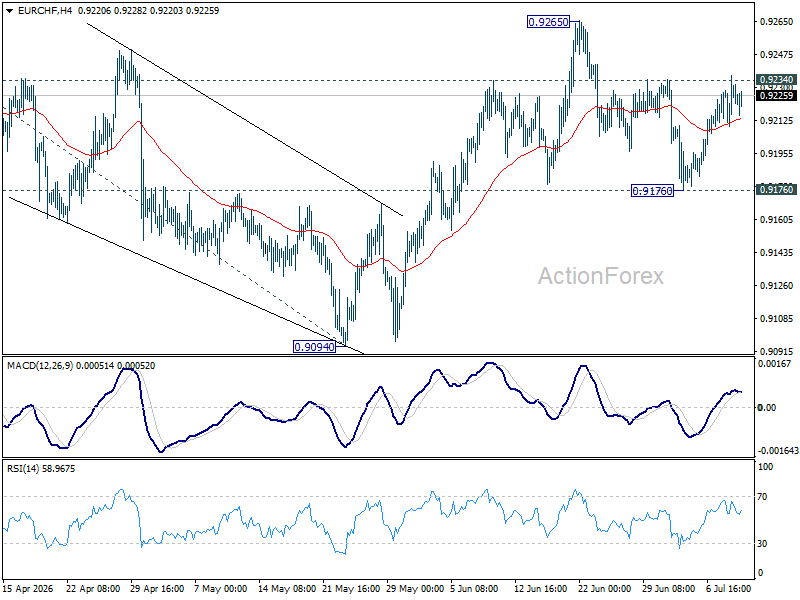
Intraday bias in EUR/CHF stays neutral and outlook is unchanged. With 0.9176 support intact, further rally is expected. On the upside, above 0.9234 will bring retest of 0.9265 resistance first. Firm break there will resume the rally from 0.8979 to 100% projection of 0.8979 to 0.9264 from 0.9094 at 0.9379. However, decisive break of 0.9176 will dampen this bullish view, and bring deeper fall back to 0.9094 support.
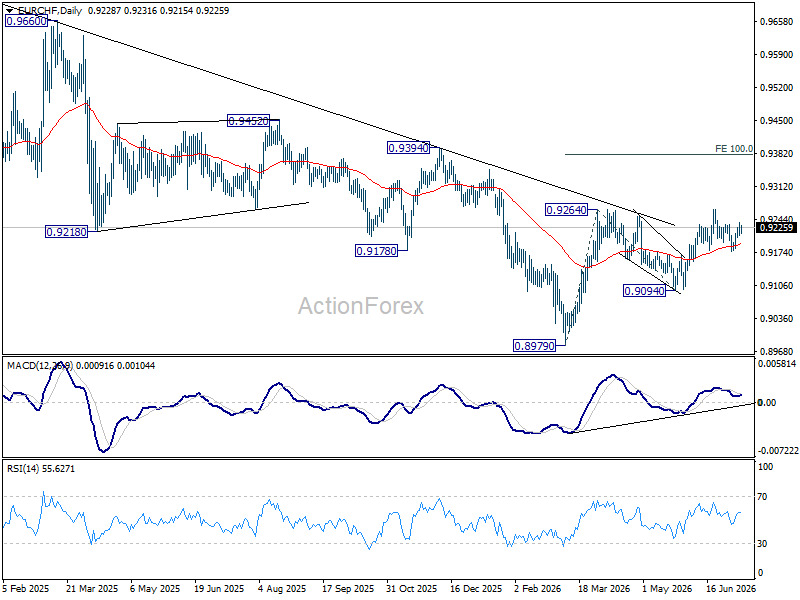
In the bigger picture, the break of medium term falling trend line resistance indicates that 0.8979 is already a medium term bottom. Considering bullish convergence condition in W MACD, rise from there should at least be reversing the fall from 0.9928, with prospect of developing into a medium term up trend. Firm break of 0.9394 resistance will add more credence to this case. For now risk will remain on the upside as long as 0.9094 support holds, in case of retreat.
GBP/CAD Hits Decade High as USMCA Shock Adds New Driver Ahead of Jobs Data
GBP/CAD climbed to its highest level in a decade this week, reflecting an increasingly powerful divergence between a Pound supported by fading domestic political risks and a Canadian Dollar facing mounting structural headwinds. Sterling continues to benefit from the unwinding of sizeable speculative short positions built ahead of Prime Minister Keir Starmer's resignation, while Bank of England Governor Andrew Bailey has effectively ruled out near-term rate cuts. With Bank Rate holding at 3.75% versus the Bank of Canada's 2.25%, the existing yield advantage remains firmly intact. More recently, however, the rally has found an additional and arguably more durable driver: rising uncertainty over Canada's trade outlook.
The turning point came on July 1, when the Trump administration declined to extend the USMCA at its mandatory trilateral review. Although the agreement remains in force under an annual review mechanism for up to another decade, the decision marks a meaningful increase in long-term policy uncertainty rather than an immediate disruption to trade. Instead of securing another 16-year extension, businesses now face the prospect of recurring negotiations and periodic reviews. That uncertainty could weigh on investment and growth over coming years, reducing the likelihood that the Bank of Canada will need to tighten policy further.
The BoC has already downplayed the inflationary impact of higher energy prices, arguing there is limited evidence that rising oil costs are feeding into broader price pressures. Together, the trade outlook and the central bank's cautious stance point to a policy bias that is becoming increasingly less supportive for the Canadian Dollar.
Market positioning reinforces that narrative. Speculative bearish bets against the Canadian Dollar have climbed to their highest level since December, while Canada's two-year yield trades more than 140 basis points below its US counterpart, the widest gap since last May.
Attention now turns to June employment data from Canada due tomorrow, which could determine whether markets further strengthen expectations ahead of the Bank of Canada's July 15 meeting. Consensus looks for employment to rise by around 10,000 after May's outsized 88,000 gain, with the unemployment rate holding at 6.6%.
The risks appear asymmetric. A weaker-than-expected report would reinforce the existing bearish narrative by strengthening expectations that the BoC remains firmly on hold or even shifts toward easing eventually. By contrast, an in-line or even moderately stronger report may offer only temporary relief while the broader uncertainty surrounding USMCA continues to overshadow Canada's medium-term outlook.
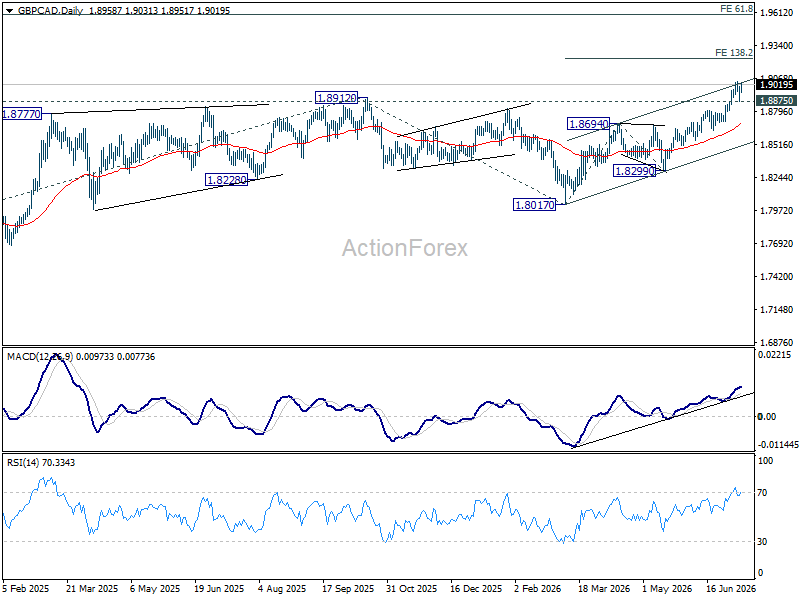
Technically, further rise is expected in GBP/CAD as long as 1.8875 support holds. Immediate focus is on medium term rising channel resistance (now at 1.9049). Decisive break there could prompt upside acceleration to 138.2% projection of 1.8017 to 1.8694 from 1.8299 at 1.9235. Break of 1.8875 will delay the bullish case, and bring consolidations first.
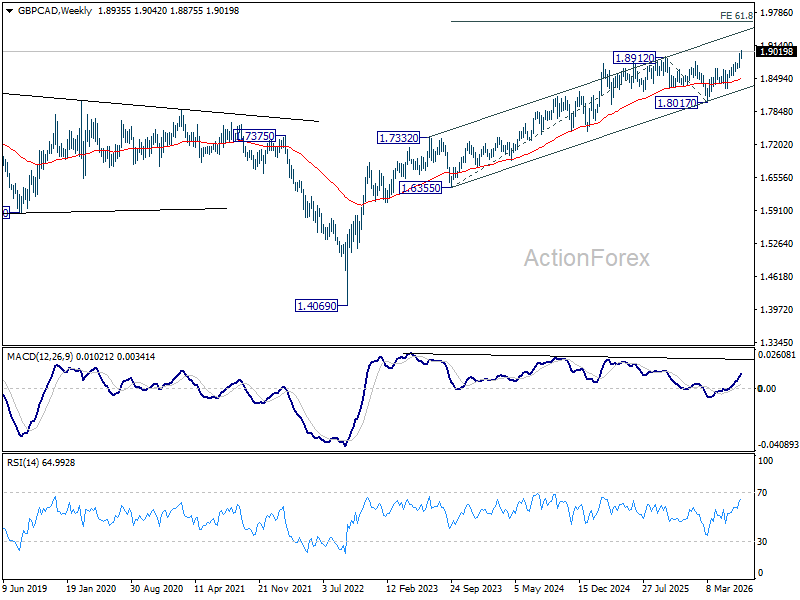
In the bigger picture, GBP/CAD is extending the whole up trend from 1.4069 (2022 low). Next medium term target is 61.8% projection of 1.6355 to 1.8912 from 1.8017 at 1.9597.
European Currencies Seek Stability Amid Rising Geopolitical Tensions
European currencies are showing mixed performance as they attempt to stabilise following their recent decline and the release of the Federal Reserve's latest meeting minutes. The minutes revealed growing concern over persistent inflationary pressures, with several policymakers supporting the possibility of an immediate interest rate increase, while the majority maintained a more cautious approach to further monetary tightening. Overall, the document highlighted ongoing divisions within the Fed over the future path of interest rates but maintained a broadly hawkish backdrop for the US dollar, as further rate hikes have not been ruled out should inflation remain elevated.
Fresh uncertainty has also emerged from renewed tensions in the Middle East. Following the latest escalation between the United States and Iran, investors have once again shifted their focus to the risk of a broader regional conflict and the potential disruption of energy supplies through key shipping routes. Rising geopolitical tensions continue to support demand for safe-haven assets while increasing concerns that higher energy prices could fuel another wave of inflation, further complicating the Federal Reserve's prospects for policy easing. Against this backdrop, European currencies are attempting to stabilise, although persistent uncertainty continues to limit the scope for a sustained recovery.
EUR/USD
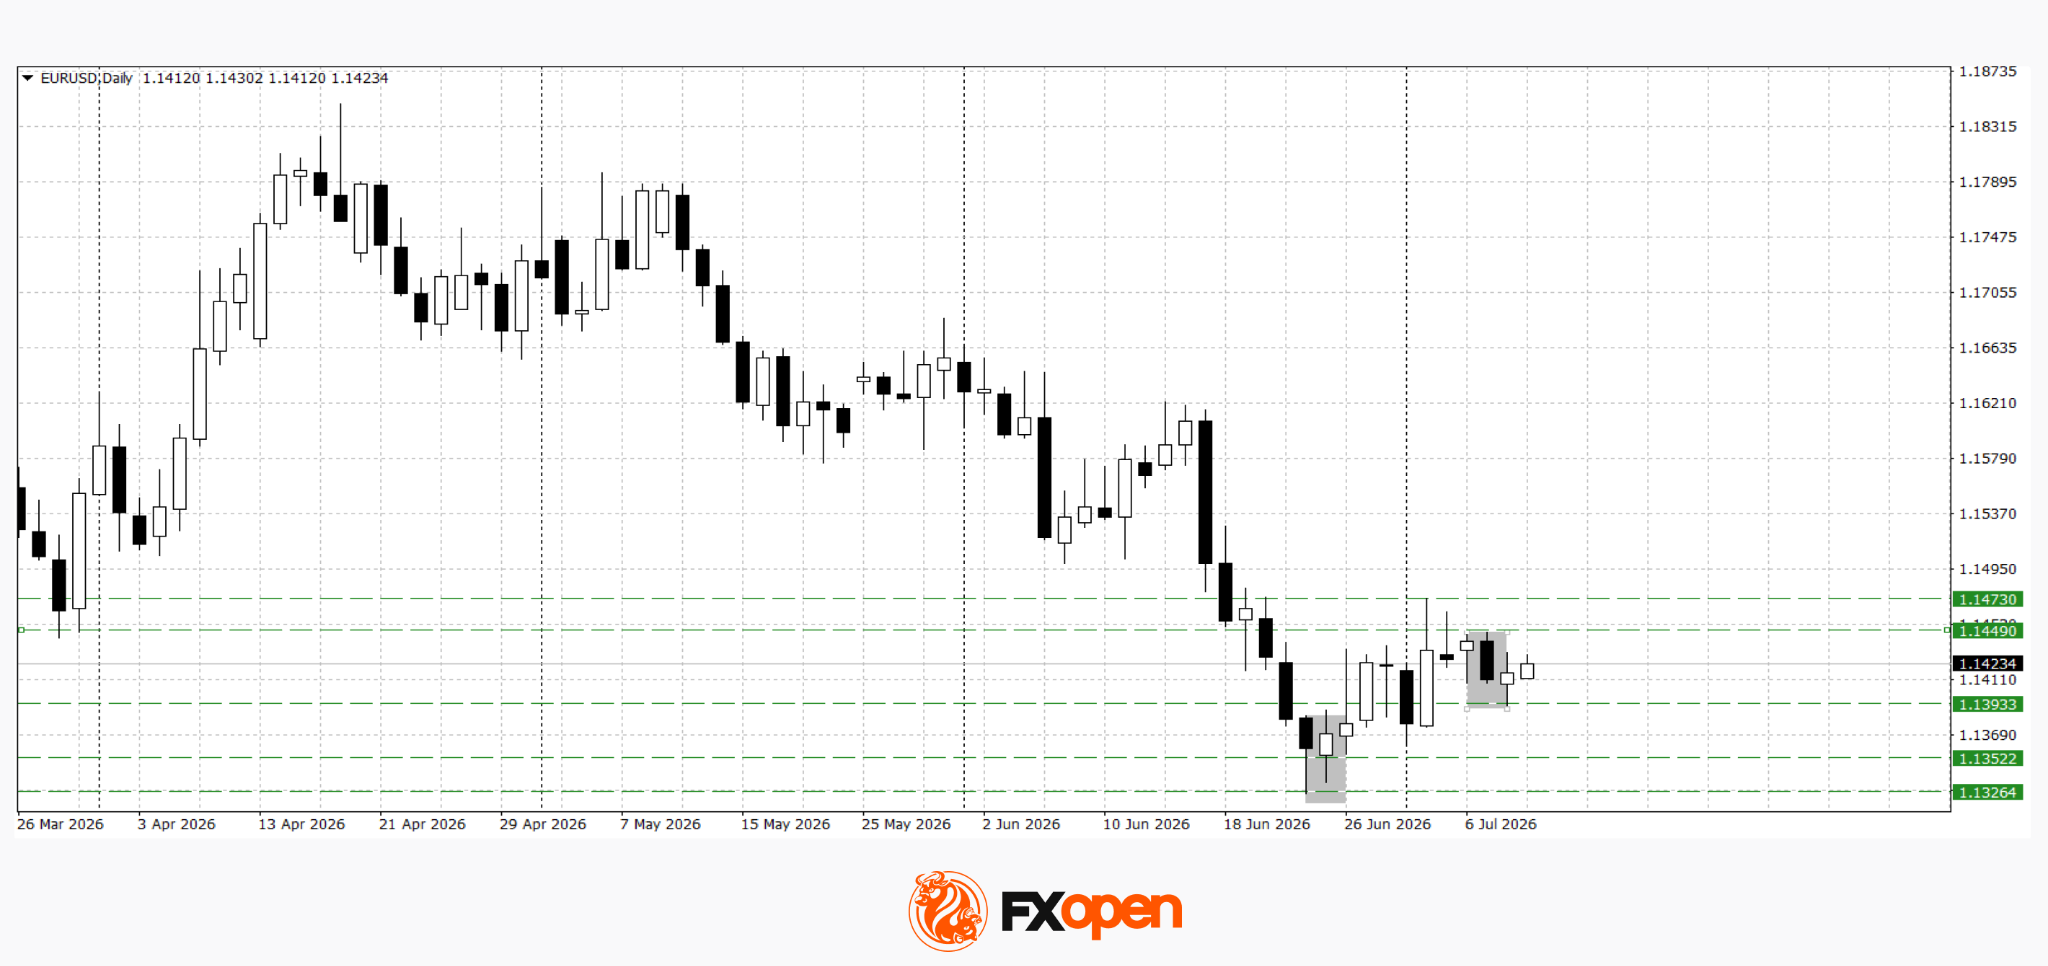
Following its recent decline, EUR/USD has once again tested support around 1.1390 before attempting to stabilise. Buyers have so far managed to keep the pair above its June lows, although the broader technical picture remains fragile. Technical indicators suggest the pair could recover towards the 1.1450–1.1470 region, supported by several bullish reversal patterns on the daily chart. However, if the pair is rejected from that resistance area and fails to establish a foothold above it, downside pressure could return, exposing 1.1330–1.1350 as the next support zone.
Key events for EUR/USD:
- Today, 09:00 (GMT+3): Germany Trade Balance
- Today, 13:00 (GMT+3): Spain Thomson Reuters/Ipsos Primary Consumer Sentiment Index (PCSI)
- Today, 15:30 (GMT+3): US Initial Jobless Claims
GBP/USD
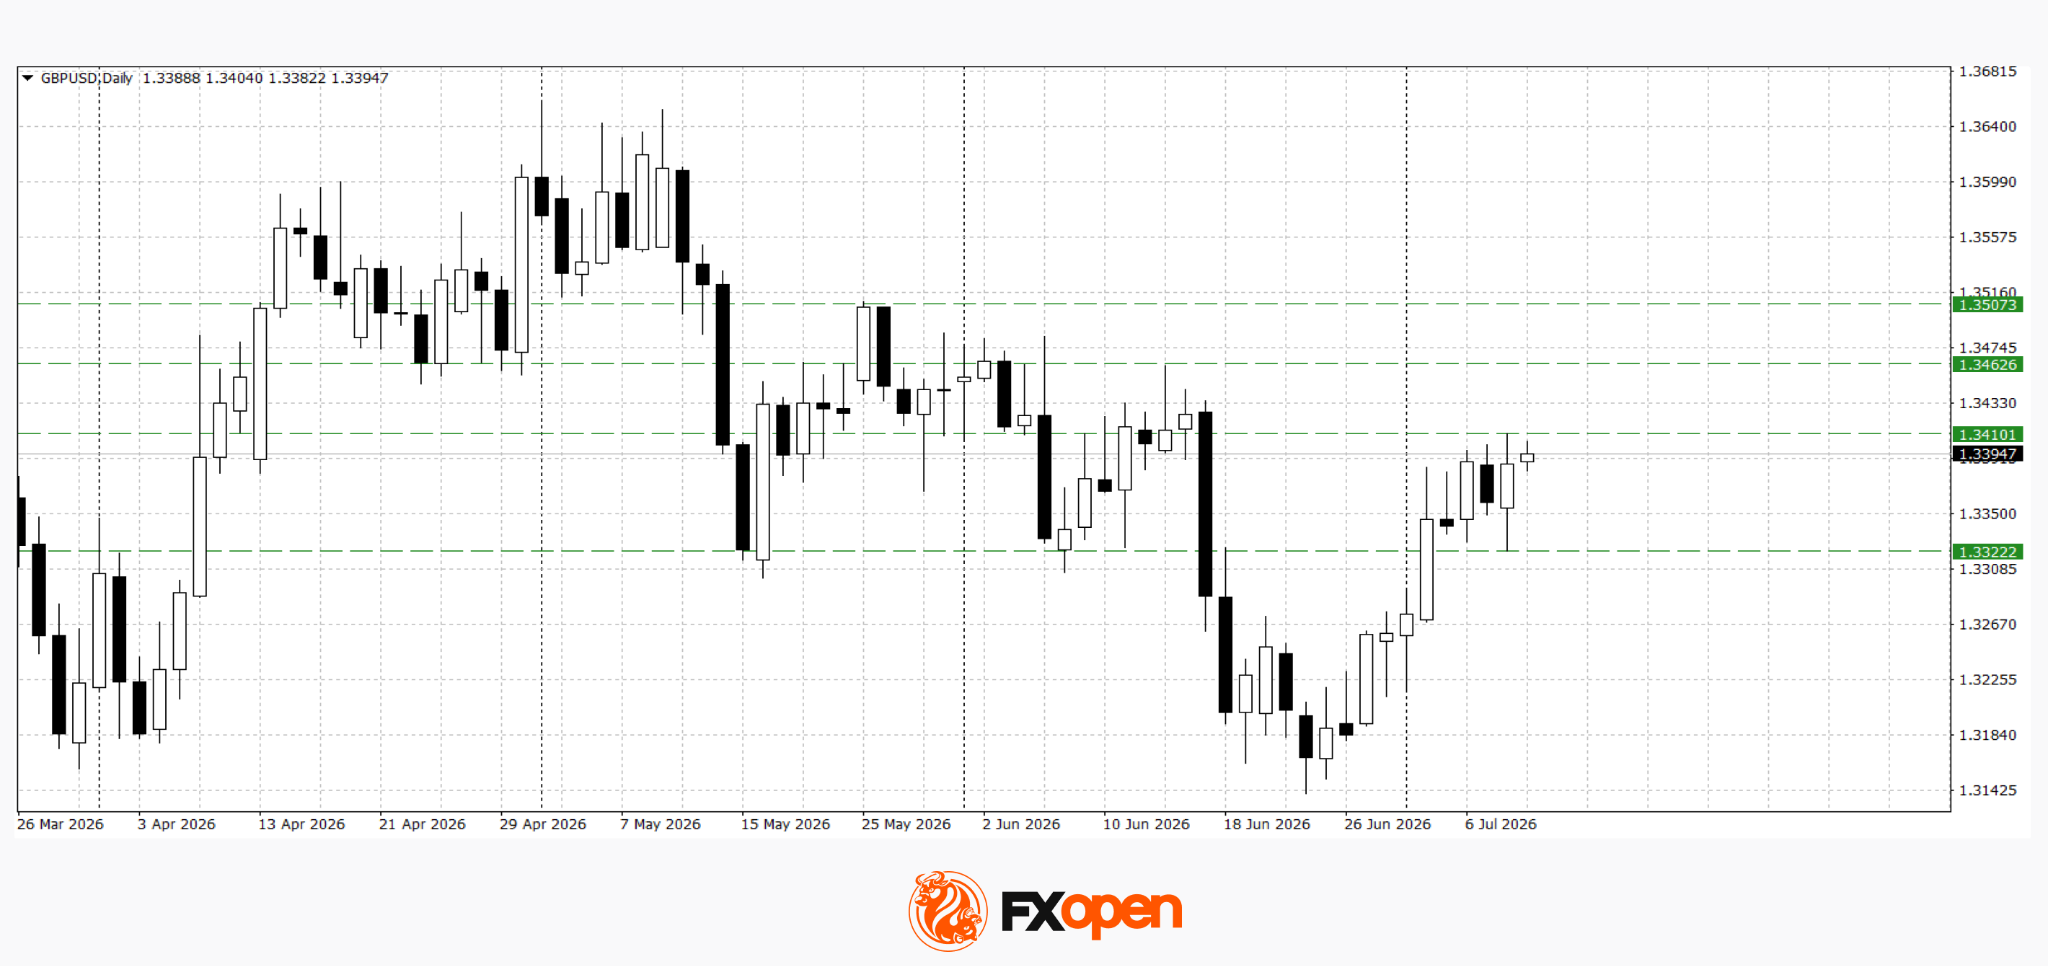
GBP/USD continues to outperform, extending its recovery after rebounding from the 1.3160–1.3200 support zone. Sterling has regained ground towards 1.3400, reflecting continued short-term buying interest. A sustained move above 1.3400 could pave the way for further gains towards 1.3460–1.3500. Conversely, a decisive break below 1.3320 would invalidate the current bullish outlook.
Key events for GBP/USD:
- Today, 13:00 (GMT+3): UK Thomson Reuters/Ipsos Primary Consumer Sentiment Index (PCSI)
- Today, 16:00 (GMT+3): Speech by FOMC member John Williams
- Today, 20:30 (GMT+3): Speech by Dallas Federal Reserve President Lorie Logan
Key Takeaways
European currencies are attempting to regain stability after their recent decline, but the technical outlook remains mixed. EUR/USD is holding above key support near 1.1390, although the risk of renewed downside persists. By contrast, GBP/USD continues to recover and is now testing significant resistance around 1.3400. The next directional move will largely depend on developments in the Middle East, further guidance from the Federal Reserve, and whether buyers can secure sustained breaks above key technical levels.
Trade over 50 forex markets 24 hours a day with FXOpen. Take advantage of low commissions, deep liquidity, and spreads from 0.0 pips (additional fees may apply). Open your FXOpen account now or learn more about trading forex with FXOpen.
This article represents the opinion of the Companies operating under the FXOpen brand only. It is not to be construed as an offer, solicitation, or recommendation with respect to products and services provided by the Companies operating under the FXOpen brand, nor is it to be considered financial advice.
Middle East Tensions Weigh on Gold
Gold fell to 4,032 USD per ounce on Thursday, marking its second consecutive day of decline. Pressure on the market intensified amid fears that a new escalation of conflict in the Middle East could disrupt energy supplies and accelerate inflation.
The US military confirmed that it has been striking targets in Iran for the second consecutive day, seeking to limit Tehran's ability to threaten shipping through the Strait of Hormuz. In response, Iran has announced preparations for a large-scale operation against American military bases in the region.
US President Donald Trump stated that, in his view, the ceasefire has effectively come to an end. He also warned of the possibility of further strikes against Iran and the imposition of an additional naval blockade.
Additional investor attention has been drawn to the minutes from the Fed's June meeting. They showed that only a small proportion of the regulator's representatives advocated a rate hike as early as June, with most participants remaining concerned about inflation risks.
The market continues to price in at least one Fed interest rate increase before the end of 2026, which limits gold's upside potential despite ongoing demand for safe-haven assets.
Technical Analysis
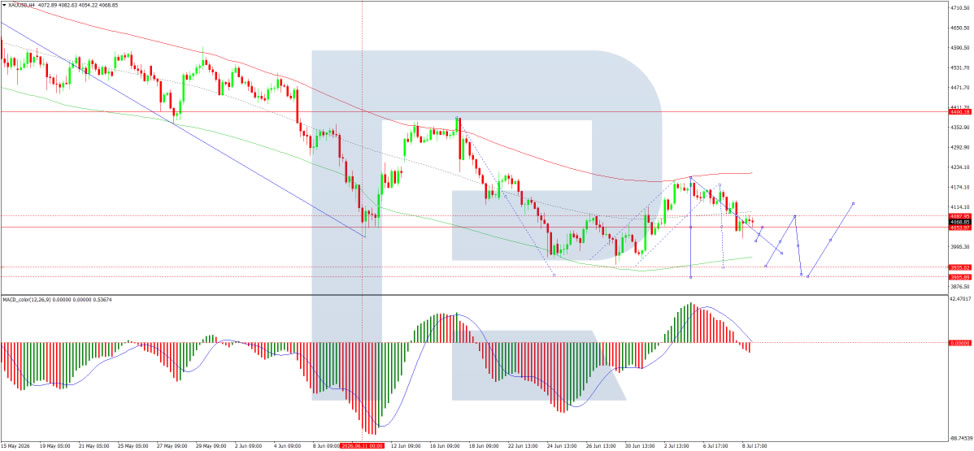
On the H4 XAU/USD chart, the market is trading within a consolidation range around the 4,090 USD level. A decline to 4,018 USD and a subsequent rise to 4,088 USD have been completed. A further move lower towards 3,930 USD is expected, followed by a potential rebound to 4,055 USD, with scope for an extension to 4,150 USD. The MACD indicator confirms the current downside momentum, with its signal line below the centre line and pointing firmly downwards.
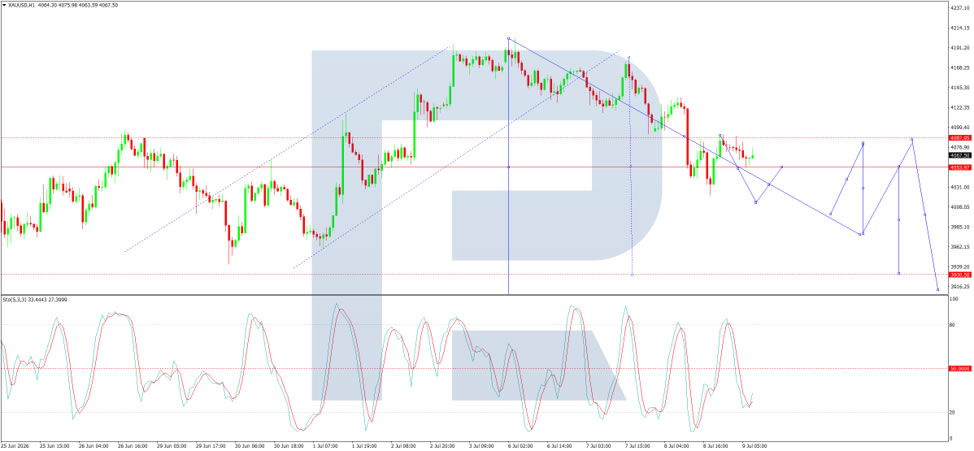
On the H1 chart, the market has broken below the 4,090 USD level and is moving lower towards 3,977 USD. A wide consolidation range is forming around 4,090 USD. The Stochastic oscillator confirms this scenario, with its signal line below the 50 level and pointing downwards towards 20, indicating continued downside pressure.
Conclusion
Gold continues to decline as renewed Middle East conflict intensifies fears of energy supply disruptions and rising inflation. US strikes on Iran and Tehran's threat of retaliation have escalated tensions, with President Trump declaring the ceasefire effectively over. Meanwhile, the Fed minutes revealed a cautious central bank, with only a minority advocating an immediate rate hike, while most members remain vigilant about inflation risks. Markets continue to price in at least one Fed rate hike before year-end, limiting gold's appeal despite safe-haven demand. Technically, further downside towards 3,930 USD appears likely, with any recovery likely to be capped by ongoing geopolitical and monetary policy headwinds.