Sample Category Title
Australian Dollar Yawns after Jobs Report
The Australian dollar is showing little movement today after the solid Australian employment report.
Australian employment rebounds
The Australian labour market remains resilient, as indicated by a solid August employment report. The increase in employment of 33.5 thousand was very close to the consensus of 35 thousand, with the gain of 58.8 thousand full-time jobs especially impressive. The release was within expectations and the Australian dollar’s response has been muted. The unemployment rate ticked higher to 3.5%, up from 3.4%.
The employment data likely will not change things for the RBA, which meets on October 6th. The RBA has delivered 50bp rate hikes four straight times, but may be looking to ease its tightening and guide the economy to a soft landing. If the RBA needs an excuse to hike by 25bp, it could hang its hat on the slight rise in the unemployment rate.
Australia’s Inflation Expectations slowed to 5.4% in August, marking a third consecutive decline. This is a dose of good news for the RBA, which wants to ensure that inflation expectations do not become unanchored in an environment of red-hot inflation.
In the US, the August inflation report resulted in plenty of volatility, as stock markets fell sharply before recovering. The US dollar rose sharply after inflation came in at 8.3%, higher than the forecast of 8.1%. The markets have been forced to recalibrate after assuming that inflation had peaked and the Fed would make a U-turn on policy. The Fed has been consistent in its hawkish message, and it seems that the markets are finally listening. The FOMC is expected to raise rates by 75bp, with market pricing showing plenty of fluctuation. Currently, there is a 74% likelihood of a 75bp increase, with a 26% of a massive 100pt hike. Gone is the anticipation of a “modest” 50bp rise, as the Fed is expected to continue to stay aggressive until inflation shows unmistakable signs that it has peaked and is moving lower. The Fed is saying that inflation will be brought down to the 2% target in 2023, but it looks like the road to low inflation will have bumps along the way, as the battle with inflation has been difficult and that is likely to continue to be the case.
AUD/USD Technical
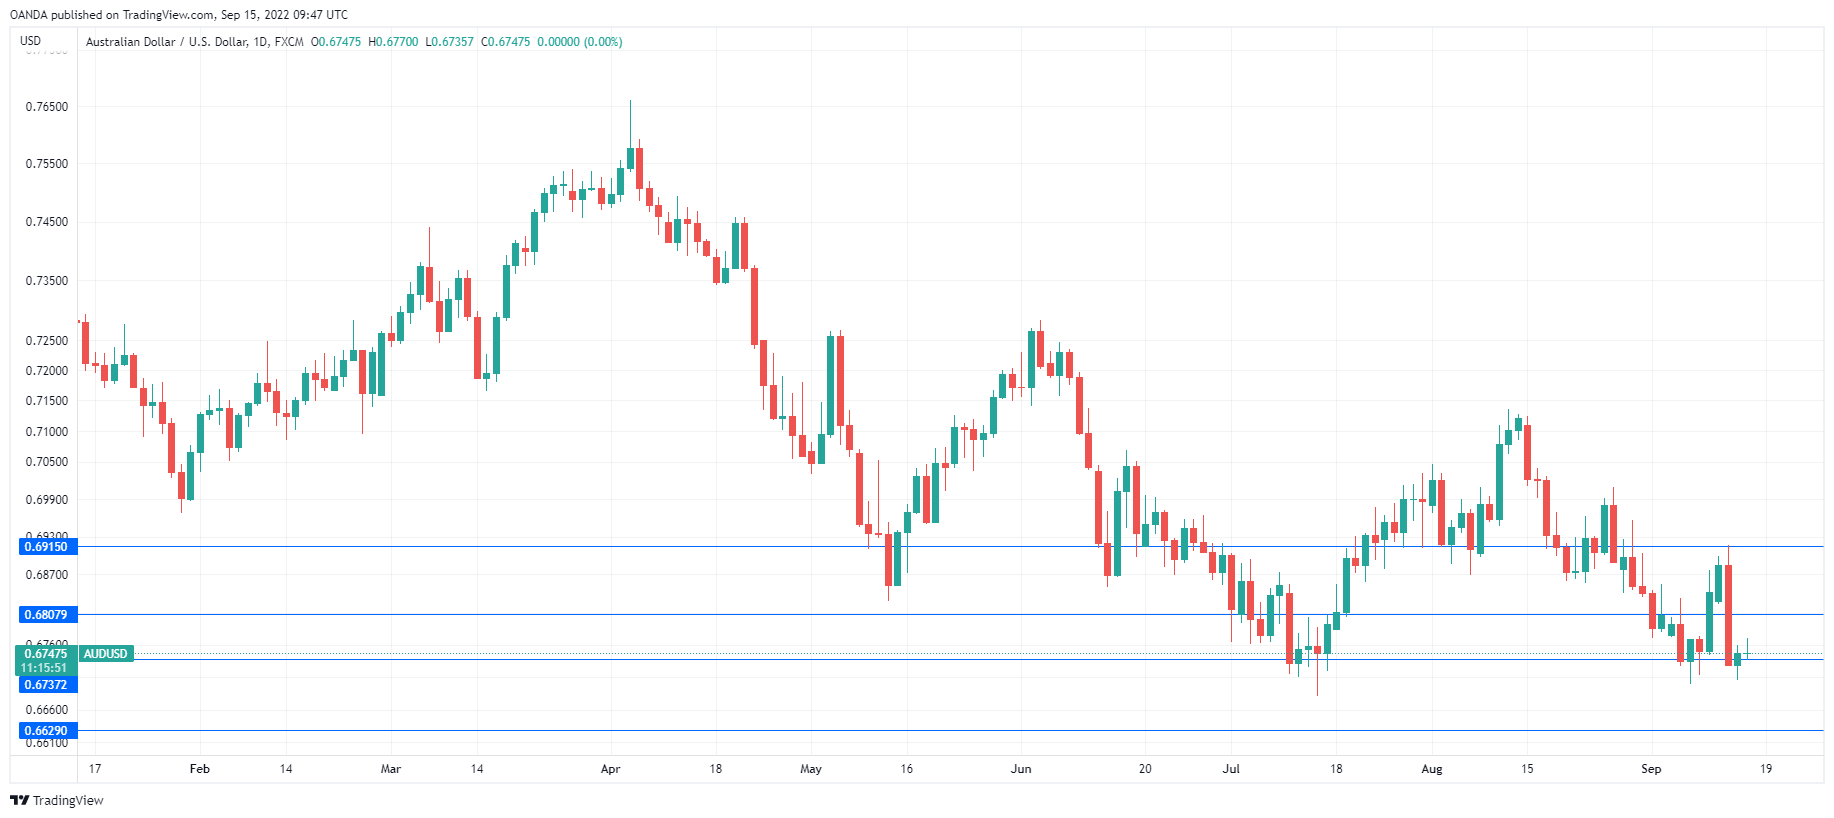
- AUD/USD has weak support at 0.6737, followed by support at 0.6629
- There is resistance at 0.6807 and 0.6915
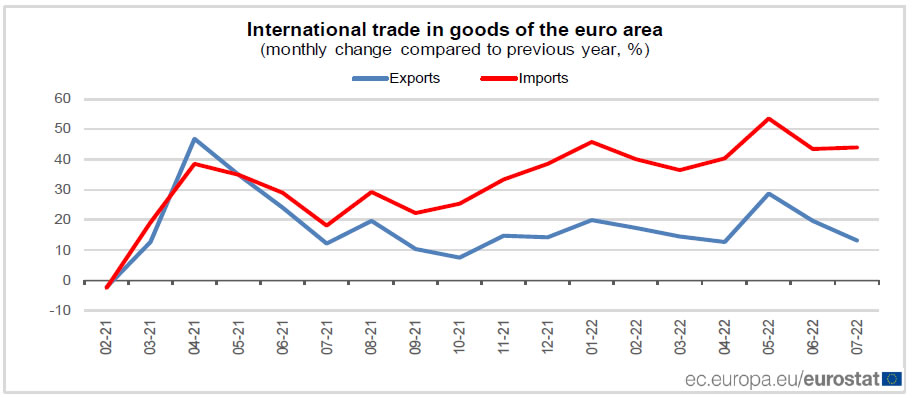
Eurozone exports rose 13.3% yoy in Jul, imports surged 44.0% yoy
Eurozone exports of goods rose 13.3% yoy to EUR 235.5B in July. Imports rose 44.0% yoy to EUR 269.5B. Trade deficit with the rest of the world came in at EUR -34B. Intra-Eurozone trade rose 24.0% yoy to EUR 224.8B.
In seasonally adjusted term, Eurozone exports dropped -1.7% mom to EUR 236.7B. Imports rose 1.5% mom to EUR 277.0B. Trade deficit widened to EUR -40.3B, larger than expectation of EUR -32.5B. Intra-Eurozone trade rose from EUR 225.1B to EUR 229.3B.
ECB de Guindos: Determined action essential to keep inflation expectations anchored
ECB Vice-President Luis de Guindos said in a speech, "monetary policy needs to be focused on price stability and on delivering our inflation target over the medium term. Determined action is essential to keep inflation expectations anchored, which in itself contributes to delivering price stability and avoids second-round effects in inflation. The main asset that central banks have is credibility, and this asset becomes even more important in times of high uncertainty."
On the economy, de Guindos said, "A period of heightened uncertainty is here to stay for a while, rendering decision-making more complex. Output growth is slowing down substantially and is expected to stagnate around year-end and remain low next year at less than 1%, while risks have intensified on the downside. This is set against a deteriorating inflation outlook with record-high inflation rates expected to stay elevated, well above our target, with risks primarily on the upside."
Bitcoin Won’t Give Up $20K
Market picture
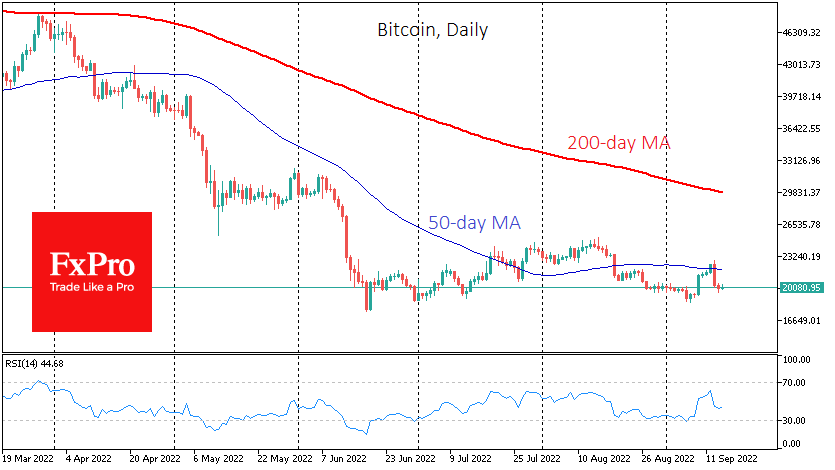
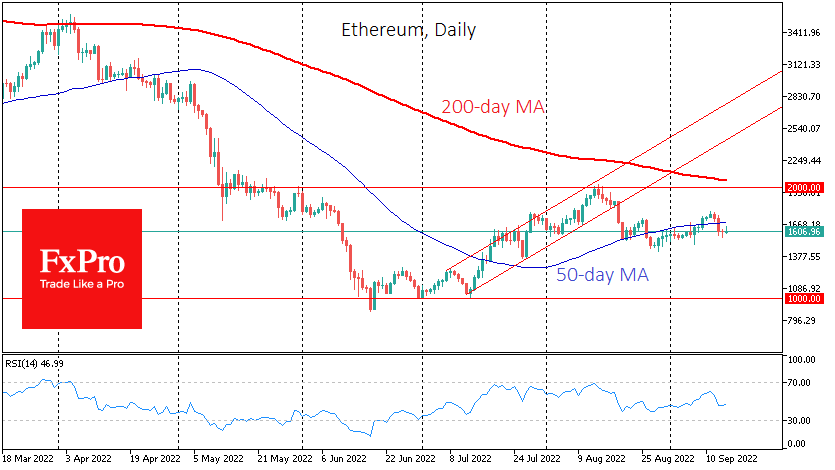
Bitcoin has lost 1.2% in the last 24 hours, trading at $20.1K. The plunge below a meaningful round level late Wednesday afternoon did not last long. Ethereum pulled down 0.3% to $1610 while the crypto community awaits the market’s reaction to The Merge (move to PoS algorithm). We can describe sentiment across the crypto market as a cautious wait-and-see.
Short-term Bitcoin momentum indicates that sellers wanted to swing the market yesterday and snap stop orders at the end of the day, taking advantage of a period of reduced liquidity on Wednesday. As we see, it failed, and BTCUSD returned precisely to where it started its local decline. However, the balance of power is now on the bears’ side, as the global risk demand is suppressed, and critical technical levels (50- and 200-day MA, 200-week MA) are above the price.
News background
Major US companies Charles Schwab, Citadel and Fidelity have announced the launch of digital asset exchange EDX Markets (EDXM), which will be available to retail and institutional investors.
Another recalculation resulted in a 3.45% increase in bitcoin mining complexity to 32.05 trillion hashes, the highest in the network’s history.
Network service provider Cloudflare announced that its gateways support the upcoming transition of the Ethereum network to the Proof-of-Stake (PoS) consensus algorithm on September 15.
Bloomberg Intelligence expert Mike McGlone believes the crypto market will begin a bullish trend after The Merge update. In his opinion, ETH’s move to PoS will have a revolutionary impact on cryptocurrencies and the entire financial system.
Changpeng Zhao, chief executive of cryptocurrency exchange Binance, said the EU’s crypto-asset regulation principles could become the global standard for the entire industry.
Ethereum Quiet Within a Triangle Range
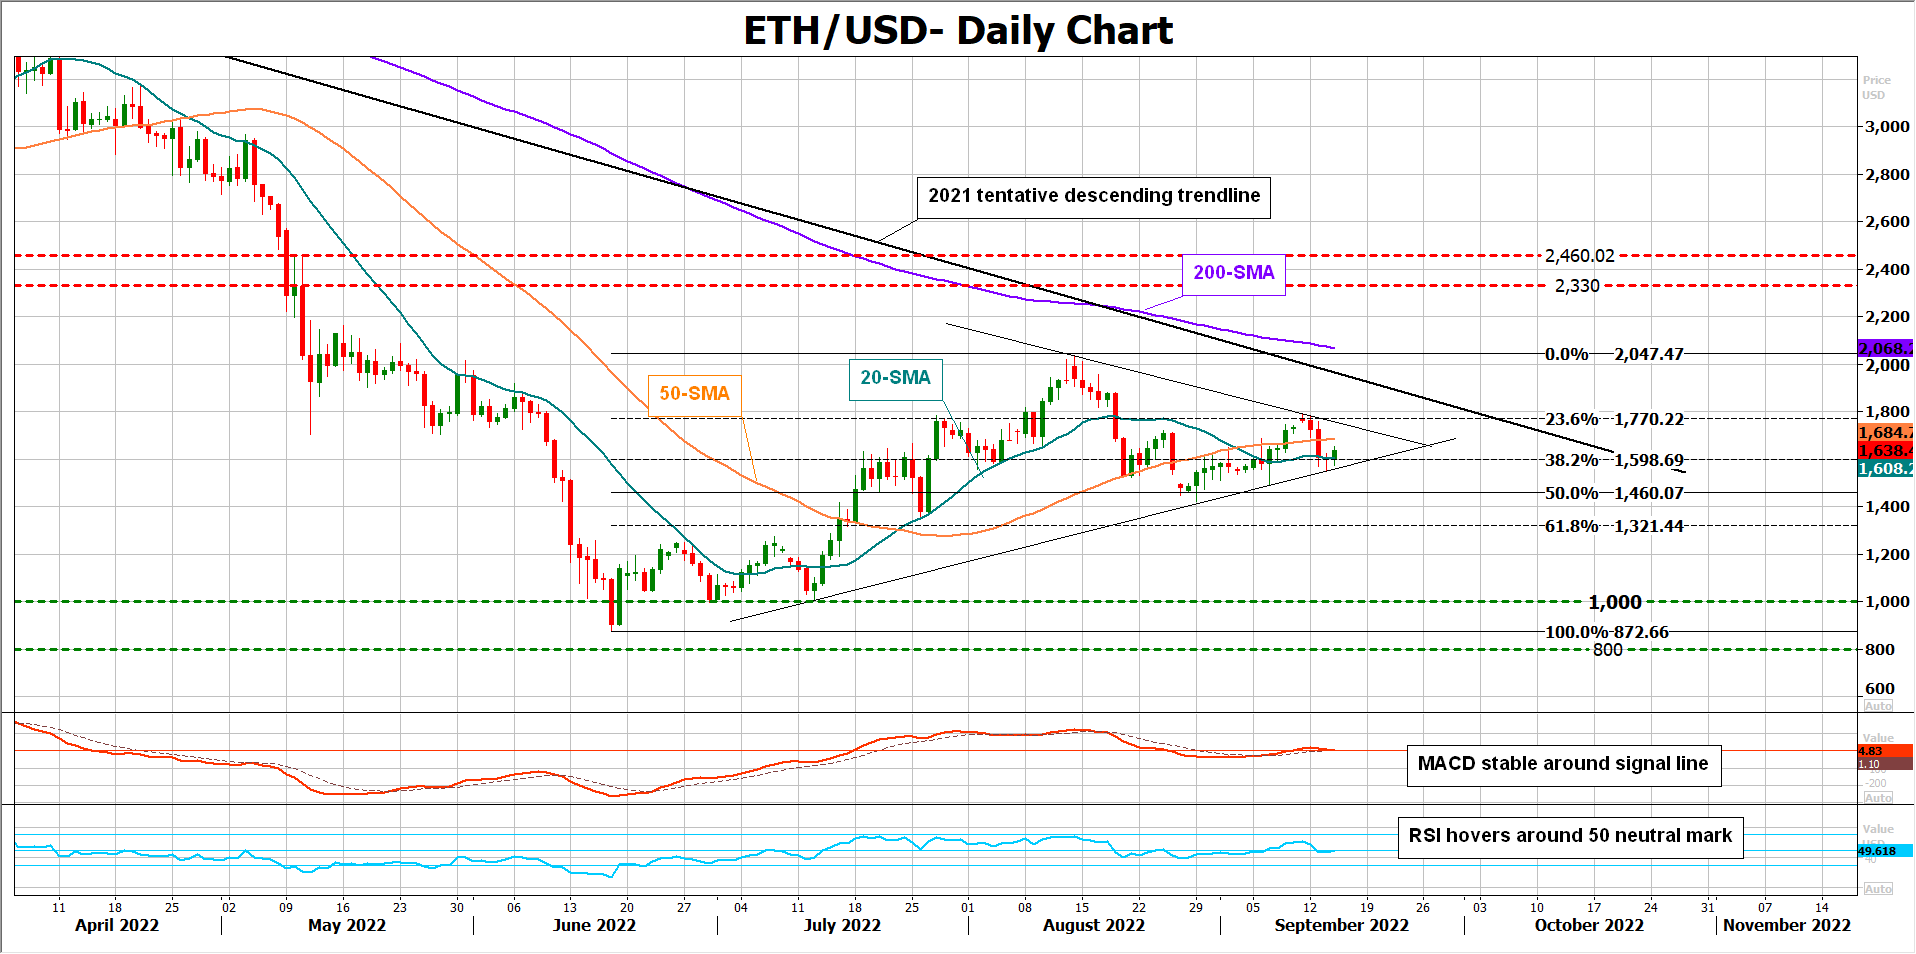
Ethereum (ETHUSD) has been in the red so far this week, gradually retreating after almost touching the 1,800 round level. Despite the soft negative mood, the short-term bias has not switched to the bearish side yet, as the second most popular crypto keeps trading within a symmetrical triangle.
The momentum indicators are also reflecting a wait-and-see attitude among traders given the sideways trajectory in the RSI and the MACD.
The 38.2% Fibonacci retracement of the latest upleg is currently canceling selling pressures around 1,600. If it gets defeated, with the price closing below the triangle, the spotlight will immediately turn to the 50% Fibonacci of 1,460, while the 61.8% Fibonacci of 1,321 could be of greater importance since any violation at this point may directly squeeze the price towards the 1,000 psychological mark. Even lower, the bears will aim for a downtrend resumption below the 800 number.
For the bulls to take the lead, the price will need to advance above the triangle and the 23.6% Fibonacci of 1,770. If that turns out to be the case, all attention will shift to the critical area of 1,975-2,047, formed by the 2021 tentative descending trendline and the 200-day simple moving average (SMA). Declaring another victory here, the bulls could pick up steam towards the 2,330 – 2,460 resistance area.
All in all, the horizontal trajectory in Ethereum suggests some patience until a clear breakout happens above 1,770 or below 1,600.
AUDUSD Turns Green Near Multi-Month Lows, Bias Remains Bearish
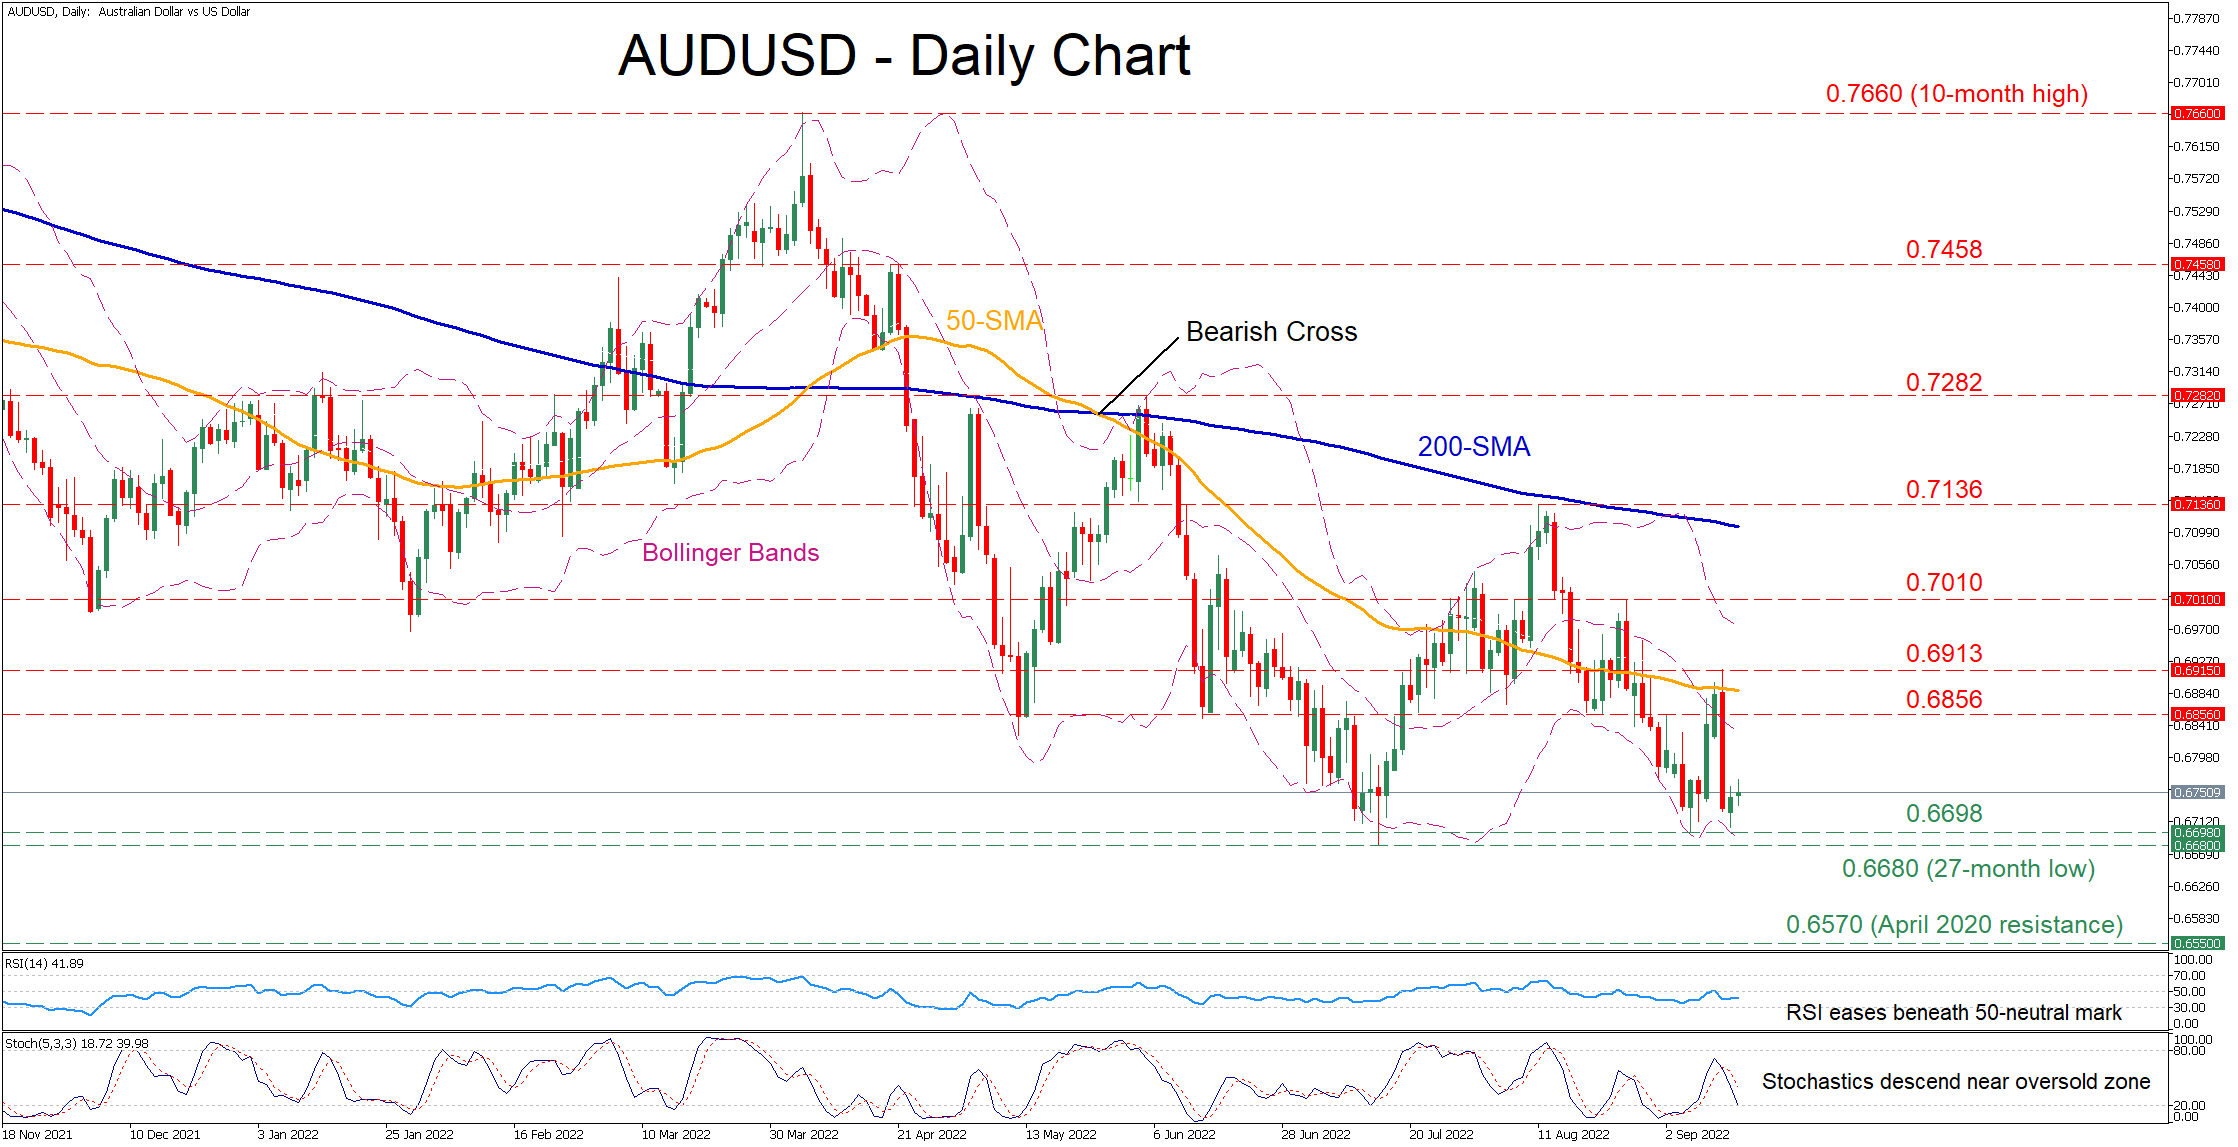
AUDUSD has been inching lower in the short-term, generating a structure of lower highs and lower lows. Although the pair made efforts to recoup some losses, it quickly retraced towards its multi-month lows as the 50-day simple moving average (SMA) capped upside moves.
The momentum indicators currently suggest that near-term risks are tilted to the downside. Specifically, the RSI is flatlining beneath its 50-neutral threshold, while the stochastic oscillator is descending near the oversold zone.
Should the negative momentum strengthen, the price could initially test the recent low of 0.6698. Sliding beneath that floor, the 27-month low of 0.6680 might come under examination. Failing to halt there, the price may decline to form fresh multi-year lows, where the April 2020 resistance zone of 0.6570 could reject any further declines.
On the flipside, bullish actions could propel the price towards the recent support region of 0.6856. A break above the latter could open the door for the recent peak of 0.6913 before the spotlight turns to 0.7010. Even higher, the price advance may cease at the August high of 0.7136.
Overall, even though AUDUSD is pushing for some recovery, the pair seems unable to edge higher and escape its recent lows. Therefore, a break above the 50-day SMA is needed to revive bulls’ hopes for a sustained rebound.
Dollar Index: Dollar Keeps Firm Tone on Revived Expectations of Aggressive Fed
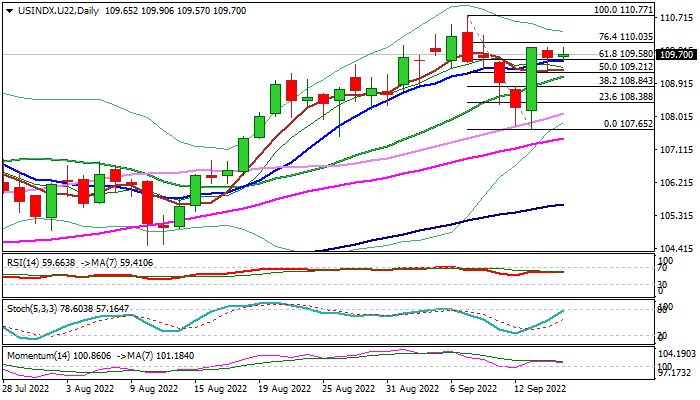
The dollar remains steady and holding above solid supports at 109.58/51 (broken Fibo 61.8% of 110.77/107.65 / 10DMA) in European session on Thursday.
Wednesday’s pullback from the top of strong rally following US inflation report, sparked by signals of possible intervention of the Bank of Japan, was strongly rejected after markets realized that intervention is for now unlikely.
The greenback kept fresh bullish tone, regained after hotter than expected inflation in August, revived expectations that Fed will remain on track for another 0.75% hike, with some hints of being even more aggressive in the policy meeting next week.
This offers fresh support to the US currency, along with daily techs, now returned to full bullish setup and the action underpinned by Tuesday’s large bullish daily candle.
Repeated close above broken Fibo level and 10 DMA to re-confirm bullish stance and keep focus at the upside, with immediate target at 110.03 (Fibo 76.4%) and key barrier at 110.77 (new 20-year high posted on Sep 7).
Res: 109.89; 110.03; 110.53; 110.77.
Sup: 109.51; 109.21; 109.09; 108.84.
Why global markets haven’t seen their troughs yet?
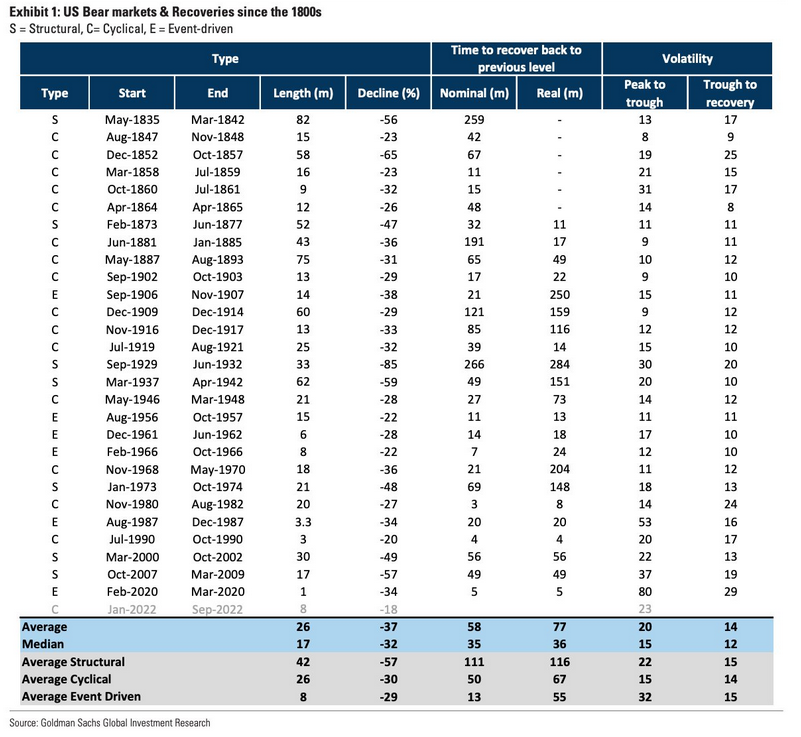
The Chinese culture says that one picture is worth a thousand words, and the exhibition below from the analysis of Goldman Sachs shows us all the drops in the U.S market, as well as their comebacks.
Source: Goldman Sachs
First of all, they divide the Bear Markets into Structural, Cyclical, and Event-driven declines. As you can see, the recent Structural ones were in 2000 – 2002 (dot.com crisis) and 2007-2009 (Lehman Brothers crisis). An Event-driven bear market took place in 2020 for only one and a half months. The way they label the corrections of the market is right, because in the first 2 examples, the fault came from the structural policy of the stock exchanges and the supporting money supply through the banking-loan system respectively, and the third example came from the event of the virus COVID-19, which in turn spread fear for the humanity.
That said, let’s see if we are supporting the argument they depicted for the nowadays correction as a Cyclical one, with only 8 months duration till now. The most recent Cyclical decline was in 1990 (only 3 months), where after the month of June and the unemployment rate at 5,2%, and the all-time highs for DOW30 at 2900 points, President Bush decides to turn the lights into threatening Iraq with an embargo and an inevitable war, and last but not least, he broke his promise about not raising taxes. After a month, the U.S entered into a recession and till the end of the year, the unemployment rate was at 6,3%.
In my opinion, these facts are not considered Cyclical, but since they come from decisions of higher officials, such as the President of the USA, should be considered Structural. So as be for the declines. Hence, for me, we have a Structural Bear Market which came from the monetary policy of the overheating M2(money supply through the Federal Reserve buying senior bonds) for over a decade.
But the article aims to prove whether we have a Structural/Cyclical or an Event-driven decline, the reasons for not having seen the trough yet. The 3 reasons are:
- The transition from a bear market to a bull market tends to be strong and driven by the expansion of valuations, regardless of the type of bear market. Here, we have a good picture of the giants, like Apple, Tesla, etc., but the overall economic conditions and valuations are poor and strongly declined.
- Sentiment-based Risk Appetite Indicator and Fundamentals-based Bull/Bear Indicator, (GSRAII) and (GSBLBR) respectively, help identify potential turning points. When both indicators come to an end/edge provide strong signals.
- Approaching the worst point of the business cycle, peaking inflation and interest rates and negative positioning are also important to recognize the turning point.
Also, as you can observe in the picture, the average for a Structural/Cyclical Bear Market is between 26-42 months and the recovery takes between 50 -111 months. As much as double the correction phase. Therefore, because we eliminate the Event-driven one, since we are in the middle of an uncertain result of the Russia – Ukraine war, persistent inflation caused by the high prices of energy (crude/brent oil and natural gas), and the lack of supply affecting the commodities (corn, wheat), the upcoming global recession is inevitable and the one that we do not know yet is the depth.
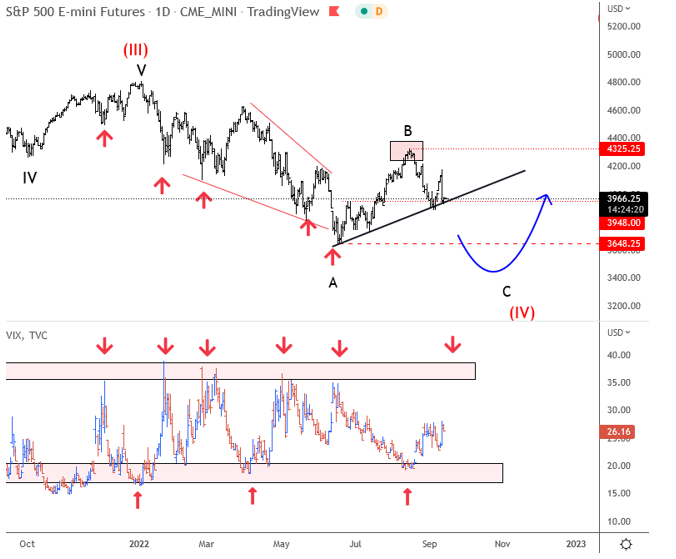
With that being said, we believe that stocks are trapped in a higher degree consolidation. On SP500 we are observing two ideas for wave (IV). The first and primary count shows room for wave C to retest the 2022 lows. VIX known as a fear index also suggests that fear is not at the extreme yet, meaning that there is room till we see more pessimism, which should reach extreme readings before we may finally see a bottom. Unfortunately, that’s how market and crowd behavior works.
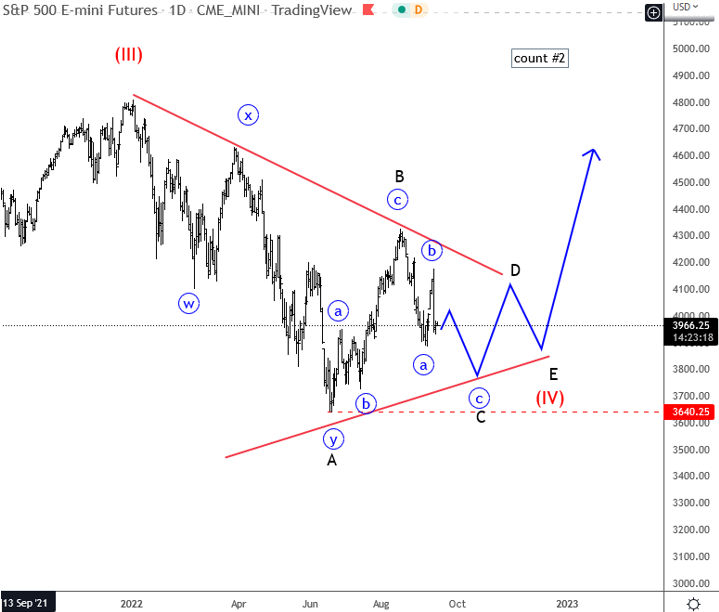
If price would stay sideways for a longer-period in this 48099 3659 range than triangle is also one valid scenario, but even this one is incomplete. So it appears that based on two counts there can be more volatile moves by the end of the year.
XAU/USD: Bears Pressure Key Longer-Term Support
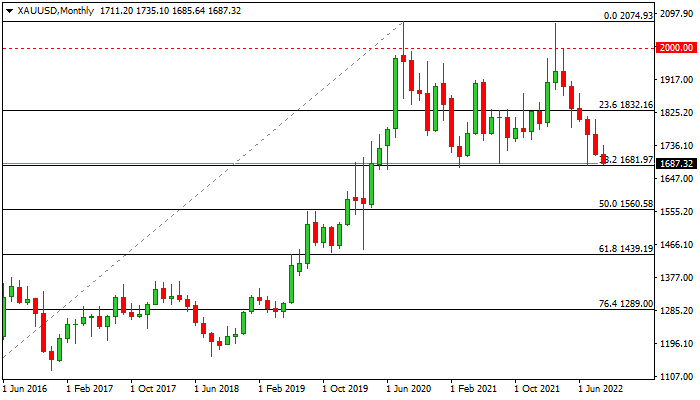
Spot gold extends steep decline from $1735 lower top into third consecutive day, under renewed pressure from fresh strength of the dollar.
US inflation rose above expectations in August, adding to expectations that Fed will deliver another massive 75 basis points rate hike next week, giving fresh boost to the greenback, which was in defensive in past few days and deflating the yellow metal.
Fresh weakness hit the lowest in eight weeks in early Thursday’s trading and pressuring key supports at $1680 zone, where lows from Mar 2021 till July 2022 formed a higher base on a monthly chart, with support being reinforced by Fibo 38.2% of larger $1046/$2074 ascend (2015/2020) and 200WMA.
Technical studies are bearish on daily and weekly chart, supporting the action, though oversold conditions suggest that bears are likely to face increased headwinds on approach to key supports.
Firm break of $1680 zone would open way for stronger acceleration lower, as completion of a double-top pattern on monthly chart on break of higher base would generate reversal signal and risk extension towards $1560 zone (Apr 2020 low/50% retracement of 1046/$2074).
Broken psychological $1700 support and falling 10DMA ($1708) offers solid resistances which should cap upticks.
Res: 1691; 1700; 1708; 1721.
Sup: 1680; 1676; 1632; 1608.
WTI Futures Retest 20-day SMA in a Descending Move
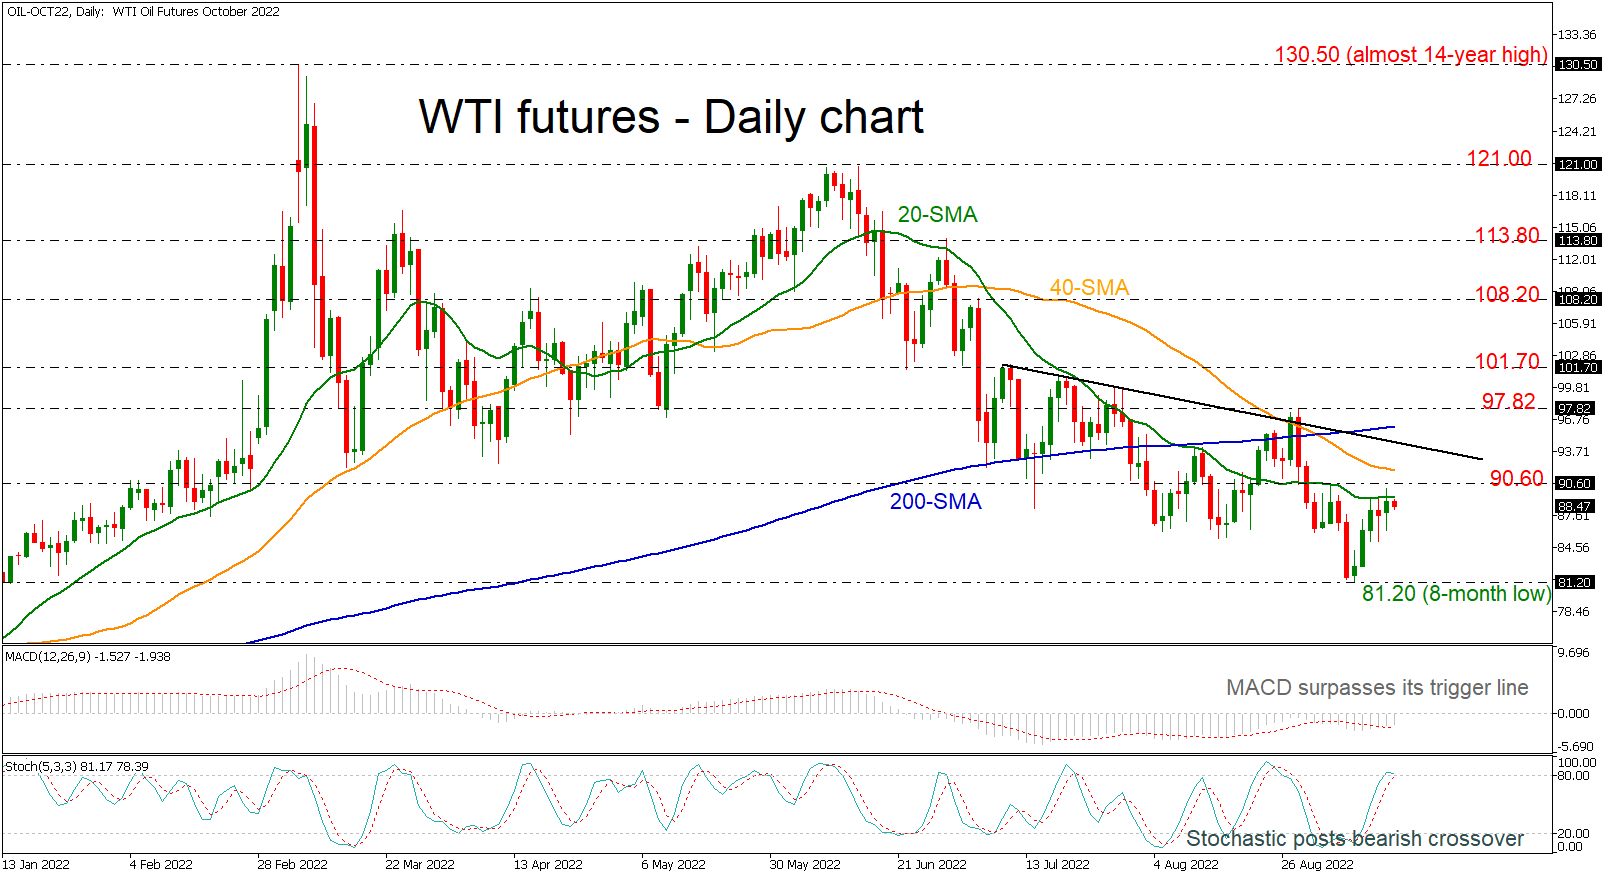
WTI futures rebounded off the eight-month low of 81.20 and reached the 20-day simple moving average (SMA) at 89.50. The technical oscillators are showing some contradicting signs. The MACD is surpassing its trigger line suggesting more gains; however, the stochastic is appearing overbought as it is ready to post a bearish crossover within its %K and %D lines.
Should the commodity manage to strengthen its positive momentum, the next resistance could come around 90.60. A break above this level could take the price until the 40-day SMA at 91.90 ahead of the short-term falling trend line near 93.90 and the 200-day SMA at 96.00, shifting the bias to a neutral one.
However, if prices are unable to break the 20-day SMA, the risk would remain to the downside with the eight-month trough at 81.20 coming into focus again. A drop lower would signal a resumption of the long-term downtrend that’s been developing since March. The next key support to watch lower down is the inside swing high of 72.73, registered in December 2021.
All in all, WTI crude oil futures seem to be in a downtrend, recording lower lows and lower highs in the short-term, while an advance above the 200-day SMA may change the outlook to neutral.