Sample Category Title
Daily Technical Analysis
EUR/USD
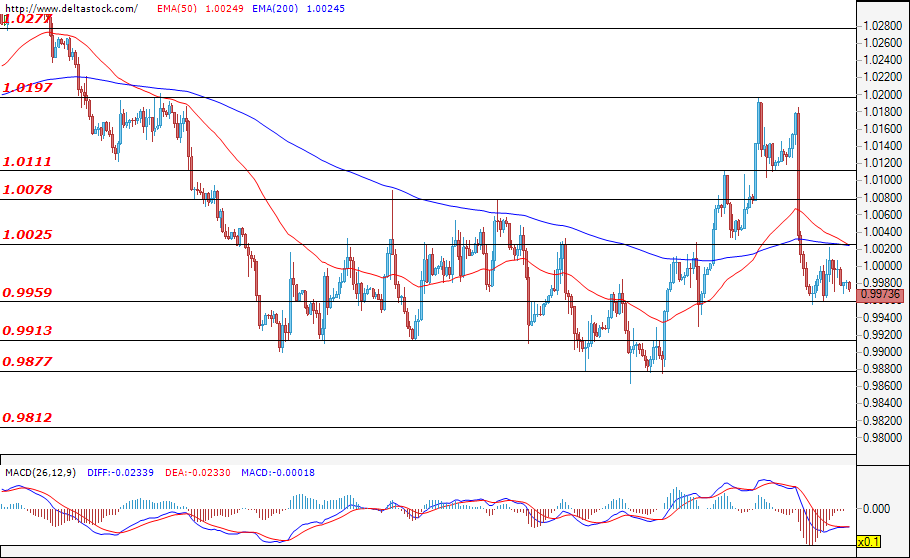
Yesterday’s trading session was marked with low volatility as the bears couldn’t gain enough momentum to continue the downward movement, and the pair found a strong support zone at around 0.9959. At the time of writing this analysis, the EUR/USD is locked in the narrow range of 0.9960 – 1.0025. It is highly possible that this consolidation phase will continue in the early hours of today’s trading, before a potential resumption of the downtrend follows suit. Even though the forecasts remain negative – for a further depreciation of the single European currency, the bulls would most probably try to take control over the market and target the resistance at 1.0025, where a successful breach may lead to a deeper correction targeting the next resistance at 1.0078. On the other hand, if the local resistance at 1.0025 withholds the bulls’ pressure, or if the sellers manage to keep the price below the key resistance at 1.0078, then it is highly likely to witness a new wave of sell-offs heading the price towards the low at 0.9877. However, this scenario may be realised only in case the bears manage to violate the lower border of the range lying at 0.9960. Today, increased volatility can be expected around the release of the initial jobless claims data for the U.S. at 12:30 GMT. A better-than-expected data may trigger an impulse move and give the necessary stimulus for the bulls to attack the low at 0.9877 and even that at 0.9812.
USD/JPY
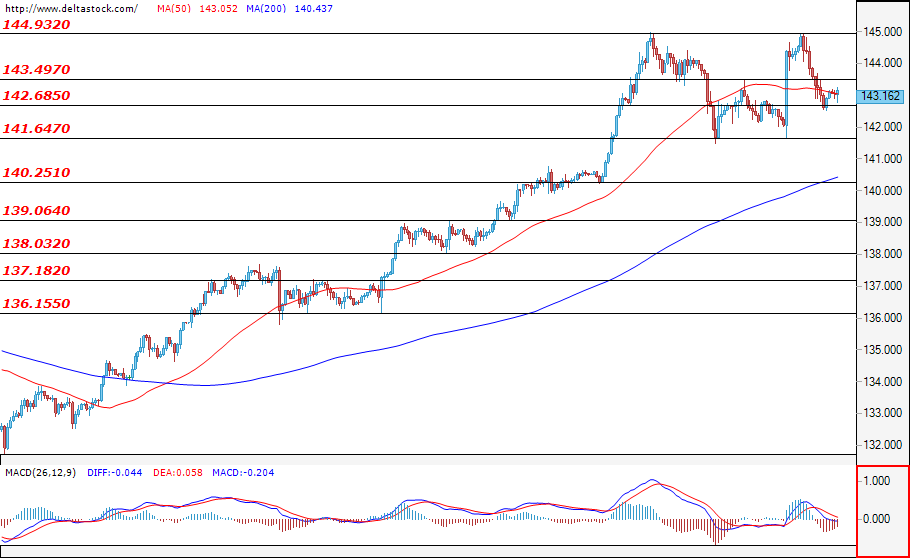
During yesterday’ trading session, the bears once again managed to thwart the bulls’ attack around the resistance at 144.90 and the Ninja convincingly bounced back, reaching the support at 142.68. In fact, it seems that the bulls are starting to lose momentum just above the mentioned support, and it looks like the pair has found itself in a short consolidation in the range of 142.68 – 143.49. The forecasts for today’s trading session are for the bears to try to take the price out of this channel and to head the pair towards a test of the critical support at 141.64. In the opposite direction, if the bulls manage to overcome the upper border of the range and lead the price above 144.00, then we may witness another bull attack on the critical resistance at 144.93.
GBP/USD
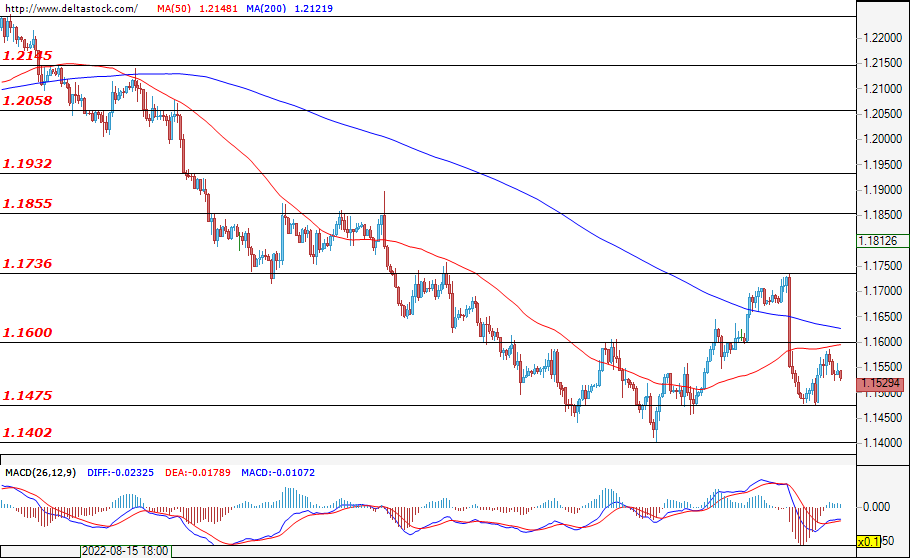
The situation with the GBP/USD is quite similar to that of the EUR/USD. After the sharp decline from yesterday, the bulls managed to limit the sell-off to just above the support zone at 1.1475. Furthermore, the sterling recovered part of its recent losses and tested the psychological level at 1.1600, but the bulls couldn’t gain enough momentum to violate it. At the time of writing, the pair is holding just below the mentioned resistance and it is highly possible for the pair to start consolidating in the interval between 1.1475 and 1.1600, before investors eventually start to define the future path of the pair. Essentially, the current market sentiment is for a continuation of the downtrend, but only if the bears manage to successfully violate the critical support at 1.1475. If this happens, this could be considered as a good opportunity for the sellers to strengthen the negative expectations and to head the price towards a test of the psychological level at 1.1400.
EUGERMANY40
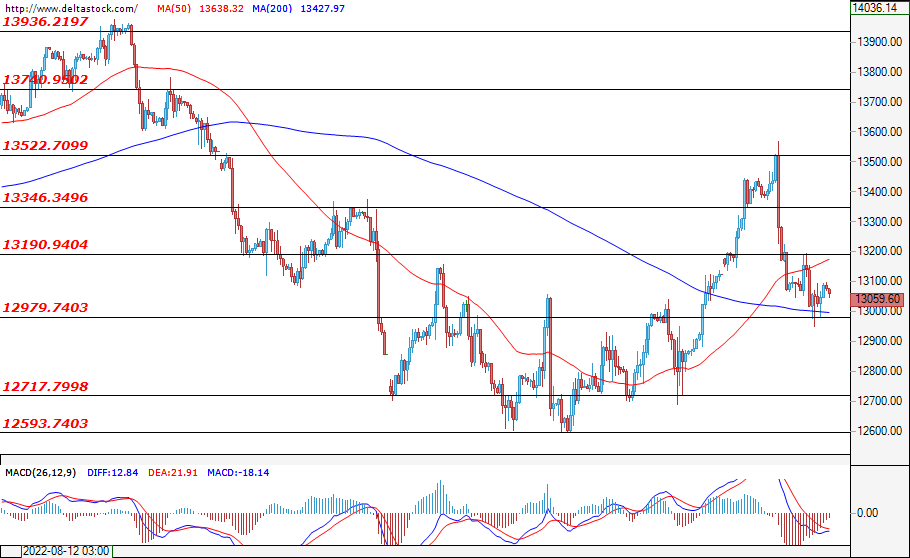
The EUGERMANY40 made modest gains in the European trading session and managed to recover part of yesterday's losses. Following the worse-than-expected CPI reading, the index plunged alongside other global markets on speculation that the FED will maintain its hawkish stance for longer than expected. The price of the index approaches the critical support level at 13000, thus the forecasts for today’s trading session are for this level to be tested. In case the price falls below it, then we may expect a further depreciation towards the next key support at 12717, which is a logical scenario considering the continuing supply issues, increasing energy prices and inflation rates, and the overall economic situation as a result of the conflict between Russia and Ukraine. Nevertheless, before investors decide to take short positions, they should consider the possibility of the support at 13000 withholding the bears’ pressure and the forming of a short consolidation in the interval of 12979 – 13190, before a potential resumption of the downtrend is to take place. In the upward direction, the first key resistance is found at 13190, followed by the level at 13346.
US30
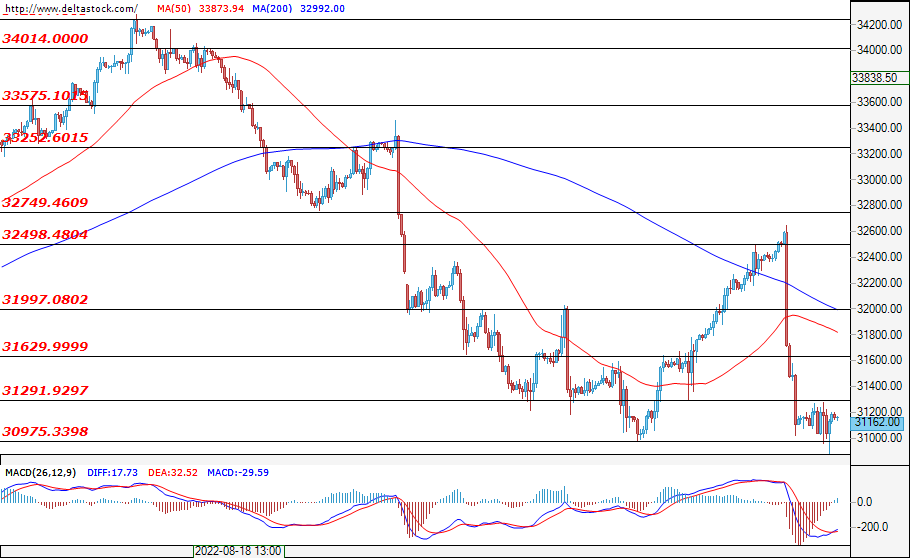
Both the European markets and the U.S. blue-chip stock index closed in the red and the index lost approximately 4.5% of its value. However, the bulls managed to limit the sell-off at the 30975 support level, and at the time of writing the analysis, the US30 is trading in a very narrow range in the channel of 30975 – 31291, as the market takes a breathing after yesterday’s sharp decline. A successful breach of the support at 30975 would give investors the necessary incentive to attack the next significant levels at 30700 and at 30500. An alternative scenario, in which the bulls manage to take control and violate the resistance at 31291, would easily lead to a deeper correction towards the level at 31629. Today, an increase in volatility can be expected around the announcement of the data on the initial jobless claims, the Philadelphia FED survey and the empire state manufacturing indices, as well as the retail sales data for the U.S., all of which are scheduled for 12:30 GMT.
US Retail Sales Have Market Moving Potential
Markets
Yesterday, markets entered calmer waters after the massive sell-off in both bonds and equities triggered by higher than expected US August inflation data published Tuesday. Yields moves were much more moderate compared to Tuesday. Even so, a further curve flattening (EMU)/inversion (US) illustrates that markets are adapting to the idea that central banks won’t be able to ease their anti-inflation crusade anytime soon. The US 2-y yield rose another 3.2 bps. The 30-y eased 2.9 bps. A 75 bps hike is fully priced in for next week’s FOMC meeting. The market sees about a 1 in 3 chance for the Fed stepping up the pace of rate hikes to 1.0%. The German curve showed a similar picture with the 2-y adding 2.9 bps. The 30-y yield dropped 4. 7 bps. Eco data were only second tier yesterday. EC Chair Ursula von der Leyen’s State of the Union aired some options on how Europe might tackle the impact of high energy prices on the economy, but the message wasn’t concrete enough to have any impact on markets. Equities showed a mixed picture. European indices still felt some follow-through losses after Tuesday’s WS sell-off (EuroStoxx50 -0.52%). US indices finished in green (Dow + 0.1%; Nasdaq +0.74%) but gains after all were limited given Tuesday’s huge loss. The dollar also took a breather. DXY closed near 109.66 (from 109.82). USD/JPY left the 145 area (close 143.08) as Japanese authorities signaled high alert on further yen weakness that might translate into FX interventions. After Tuesday’s setback, EUR/USD hovered near parity without much of a clear direction (close 0.9981). Sterling slightly outperformed the euro (EUR/GBP close 0.8648) after UK inflation came in close to expectations at 9.9%.
This morning, sentiment in Asian markets remains inconclusive. Most indices are trading little changed with China underperforming. US yields continue drifting higher and so does the dollar (USD/JPY 143.65, EUR/USD 0.997). US data again will take center stage today with the retail sales, weekly jobless claims, the Empire manufacturing survey, The Philly Fed business outlook and US production data scheduled for release. Especially the retail sales have market moving potential. A decline in gasoline prices is expected to put a lid on headline sales. However, core sales (control group expected at 0.5% M/M) still are expected to show decent growth. Retail sales is a notoriously volatile series. Even so, signs of resilience in global demand might reinforce the idea that the Fed has more work to do. In this respect, a good retail sales report might be no good news for risk sentiment. The DXY USD-index settled in a ST consolidation pattern between 107.60 and 110.32. We see risk for an upside test. After EUR/USD’s return below parity, the 0.9864 low might again come on the radar.
News Headlines
Australian employment grew by 33.5k in August, matching consensus estimates of 35k an undoing a chunk of the July losses (-40.9k). Despite job growth, the unemployment rate ticked higher from the 48-year low of 3.4% to 3.5%. It follows the participation rate rising from 66.4% to 66.6%, boosting the size of the labor force. It is expected that inbound migration could extend that trend further, potentially easing wage and thus inflationary pressures over time. Today’s data is seen strengthening the RBA’s case to slowdown the tightening pace after four consecutive 50 bps rate hikes. Markets attach a 60-40 probability on hiking by 25 or 50 bps at the October 4 meeting. Australian swap rates rise between 3.2 and 5.1 bps this morning. The Aussie dollar strengthens marginally vs the dollar (AUD/USD 0.675) but remains near two year lows.
Staying Down Under, GDP growth in New Zealand over the second quarter this year rebounded by 1.7% q/q after contracting 0.2% in Q1. The kiwi economy is now 0.4% larger than one year ago. Both the quarterly and the yearly figure beat estimates. The services industry (2.7%) lead growth, driven sectors benefiting from tourism. These include accommodation and food services (30% q/q), arts & recreation (19.9%) and transport services (19.7%). Goods-producing industries contracted sharply as manufacturing tanked 5.9%. On an expenditure basis, exports of services was a major boost (60.7% q/q) but household spending was weak (down 3.2%). The New Zealand dollar this morning rises marginally but left intraday highs already. NZD/USD continues to test important support at 0.60..
US Oil Hits Resistance
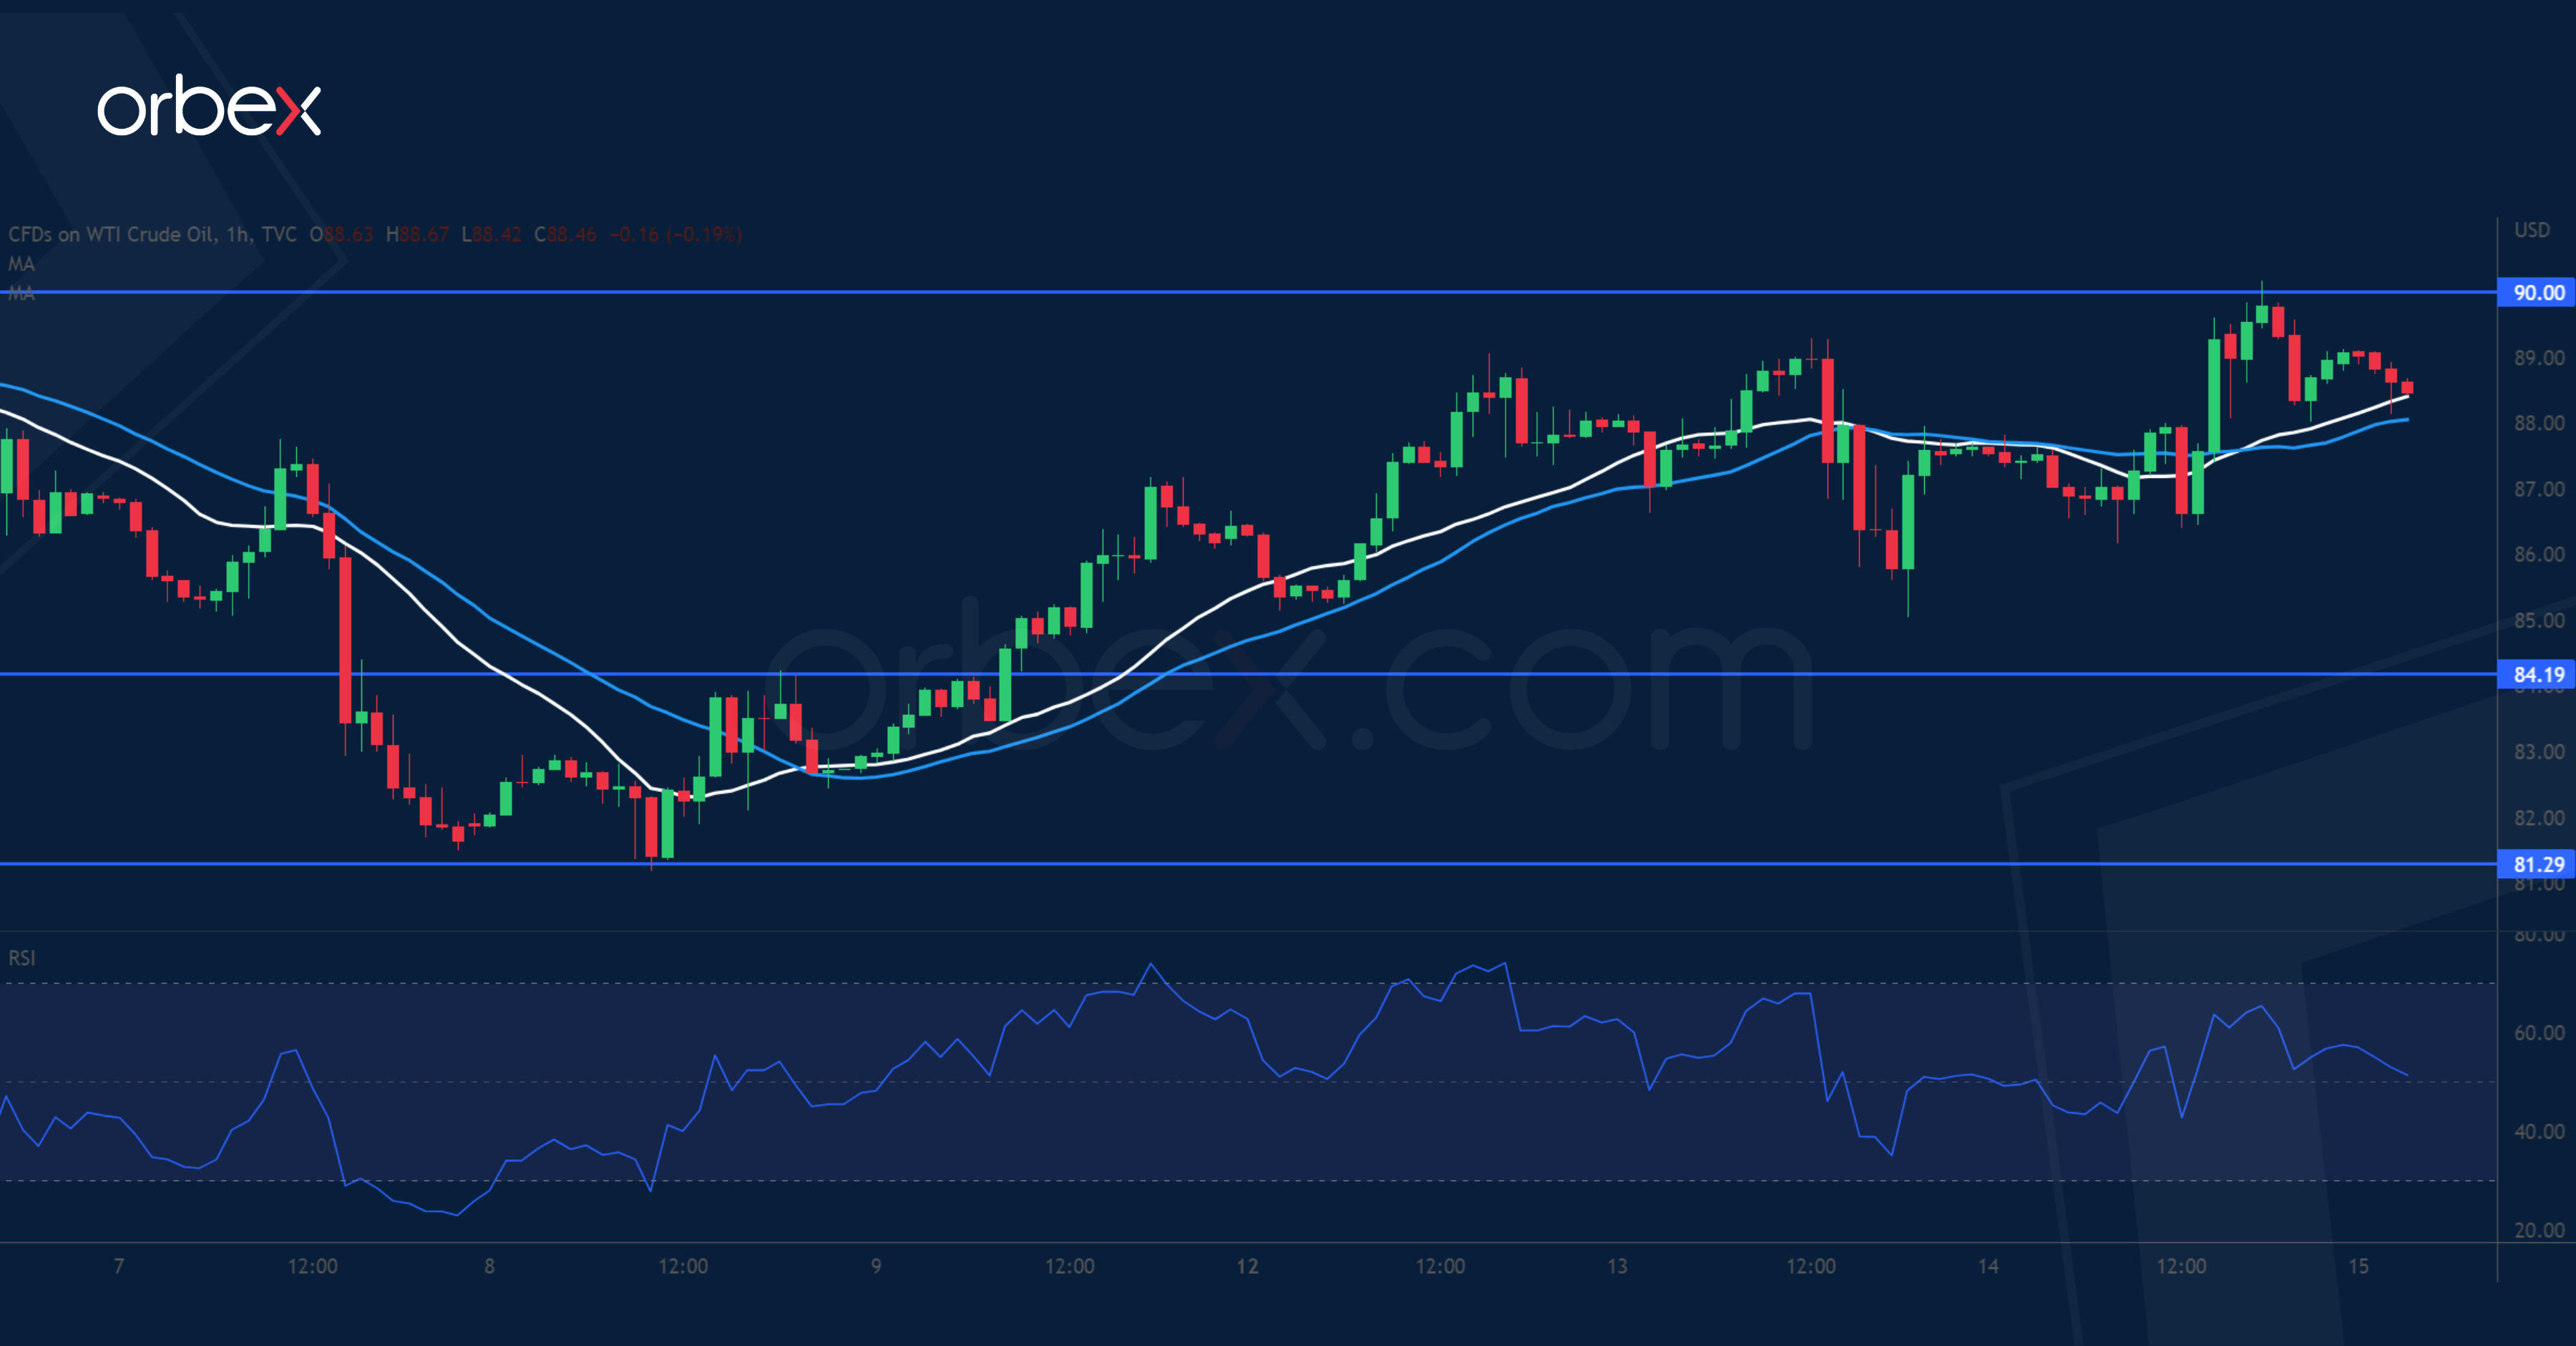
WTI crude rallied after a slower increase in US inventories. From the daily chart’s perspective, sentiment remains downbeat after the price broke below the key support at 86.00. The bears may see bounces as opportunities to sell at a better price. The current recovery has met stiff selling pressure at 90.00 which coincides with the 30-day moving average. However, if the buy side manages to push past this supply zone, 94.00 could be next. 84.20 is the closest support and its breach could resume the downtrend below 81.30.
NZD/USD Breaks Key Support
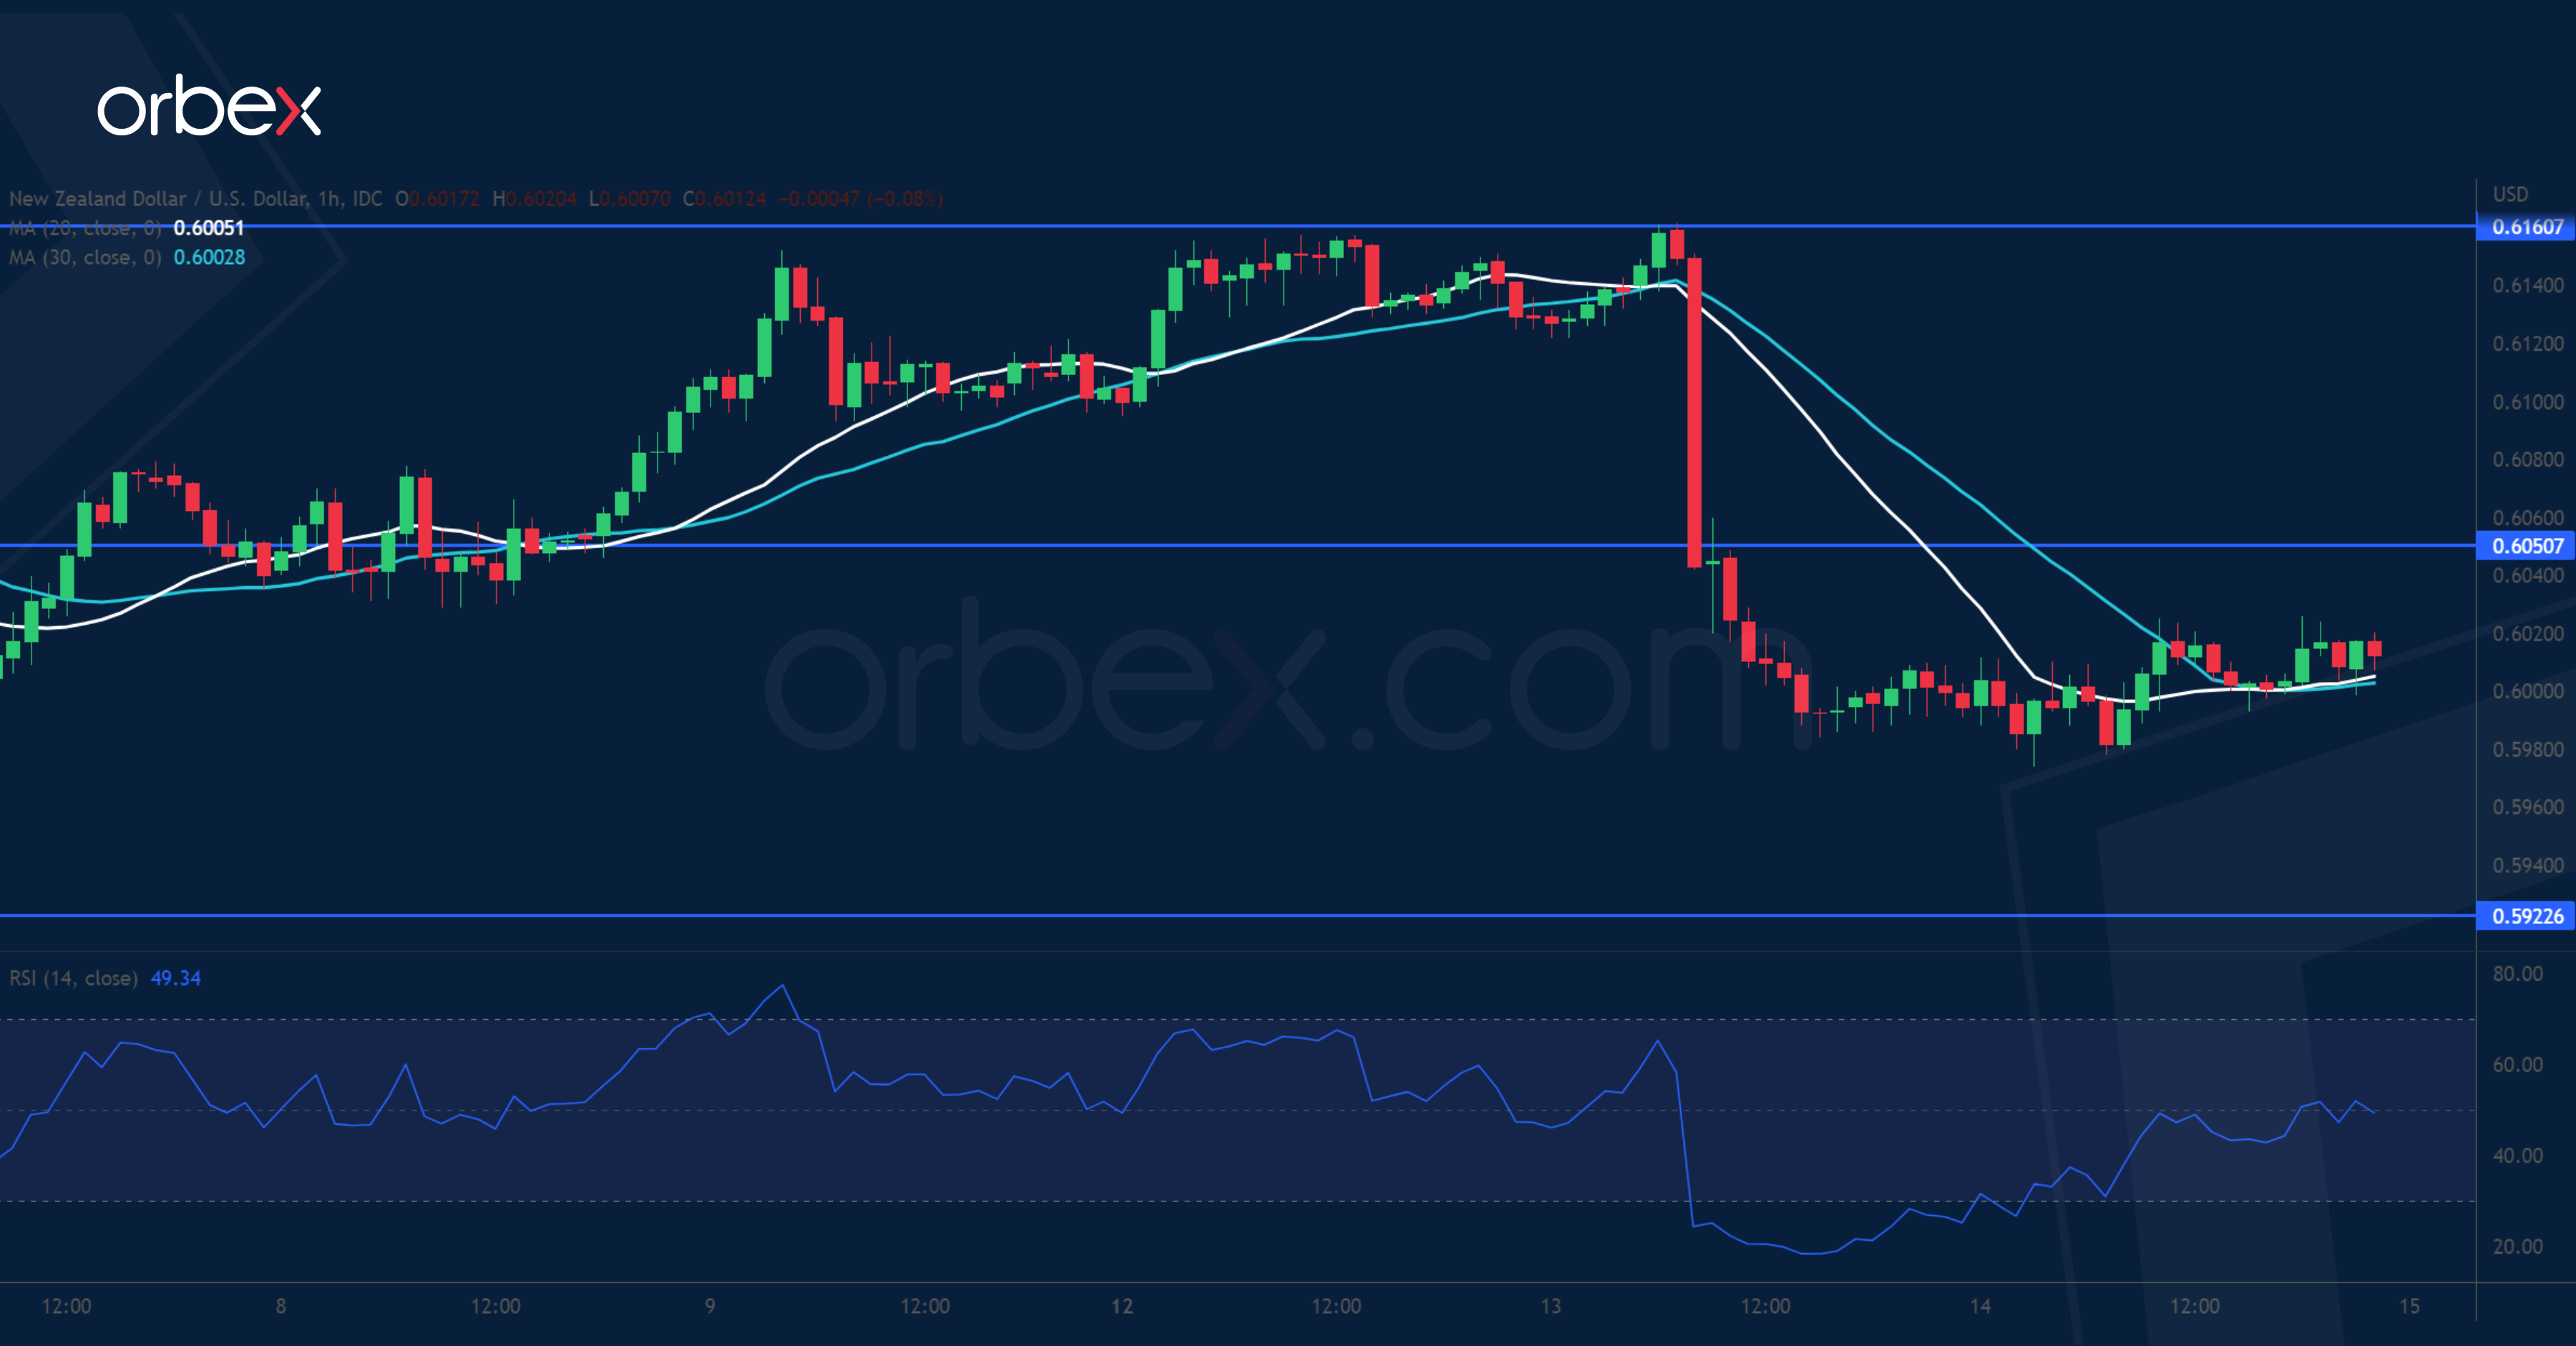
The New Zealand dollar recovers over upbeat Q2 GDP. The pair came under pressure near a former support (0.6160) over the 20-day moving average. The long bearish candle is a sign of capitulation as the short-term mood tanks. A break below the psychological support of 0.6000 has invalidated the recent rebound and indicated that the path of least resistance is down. May 2020’s lows around 0.5920 could be the next target. An oversold RSI may cause a bounce to 0.6050 where trend followers could sell into strength.
GBP/USD Finds Support
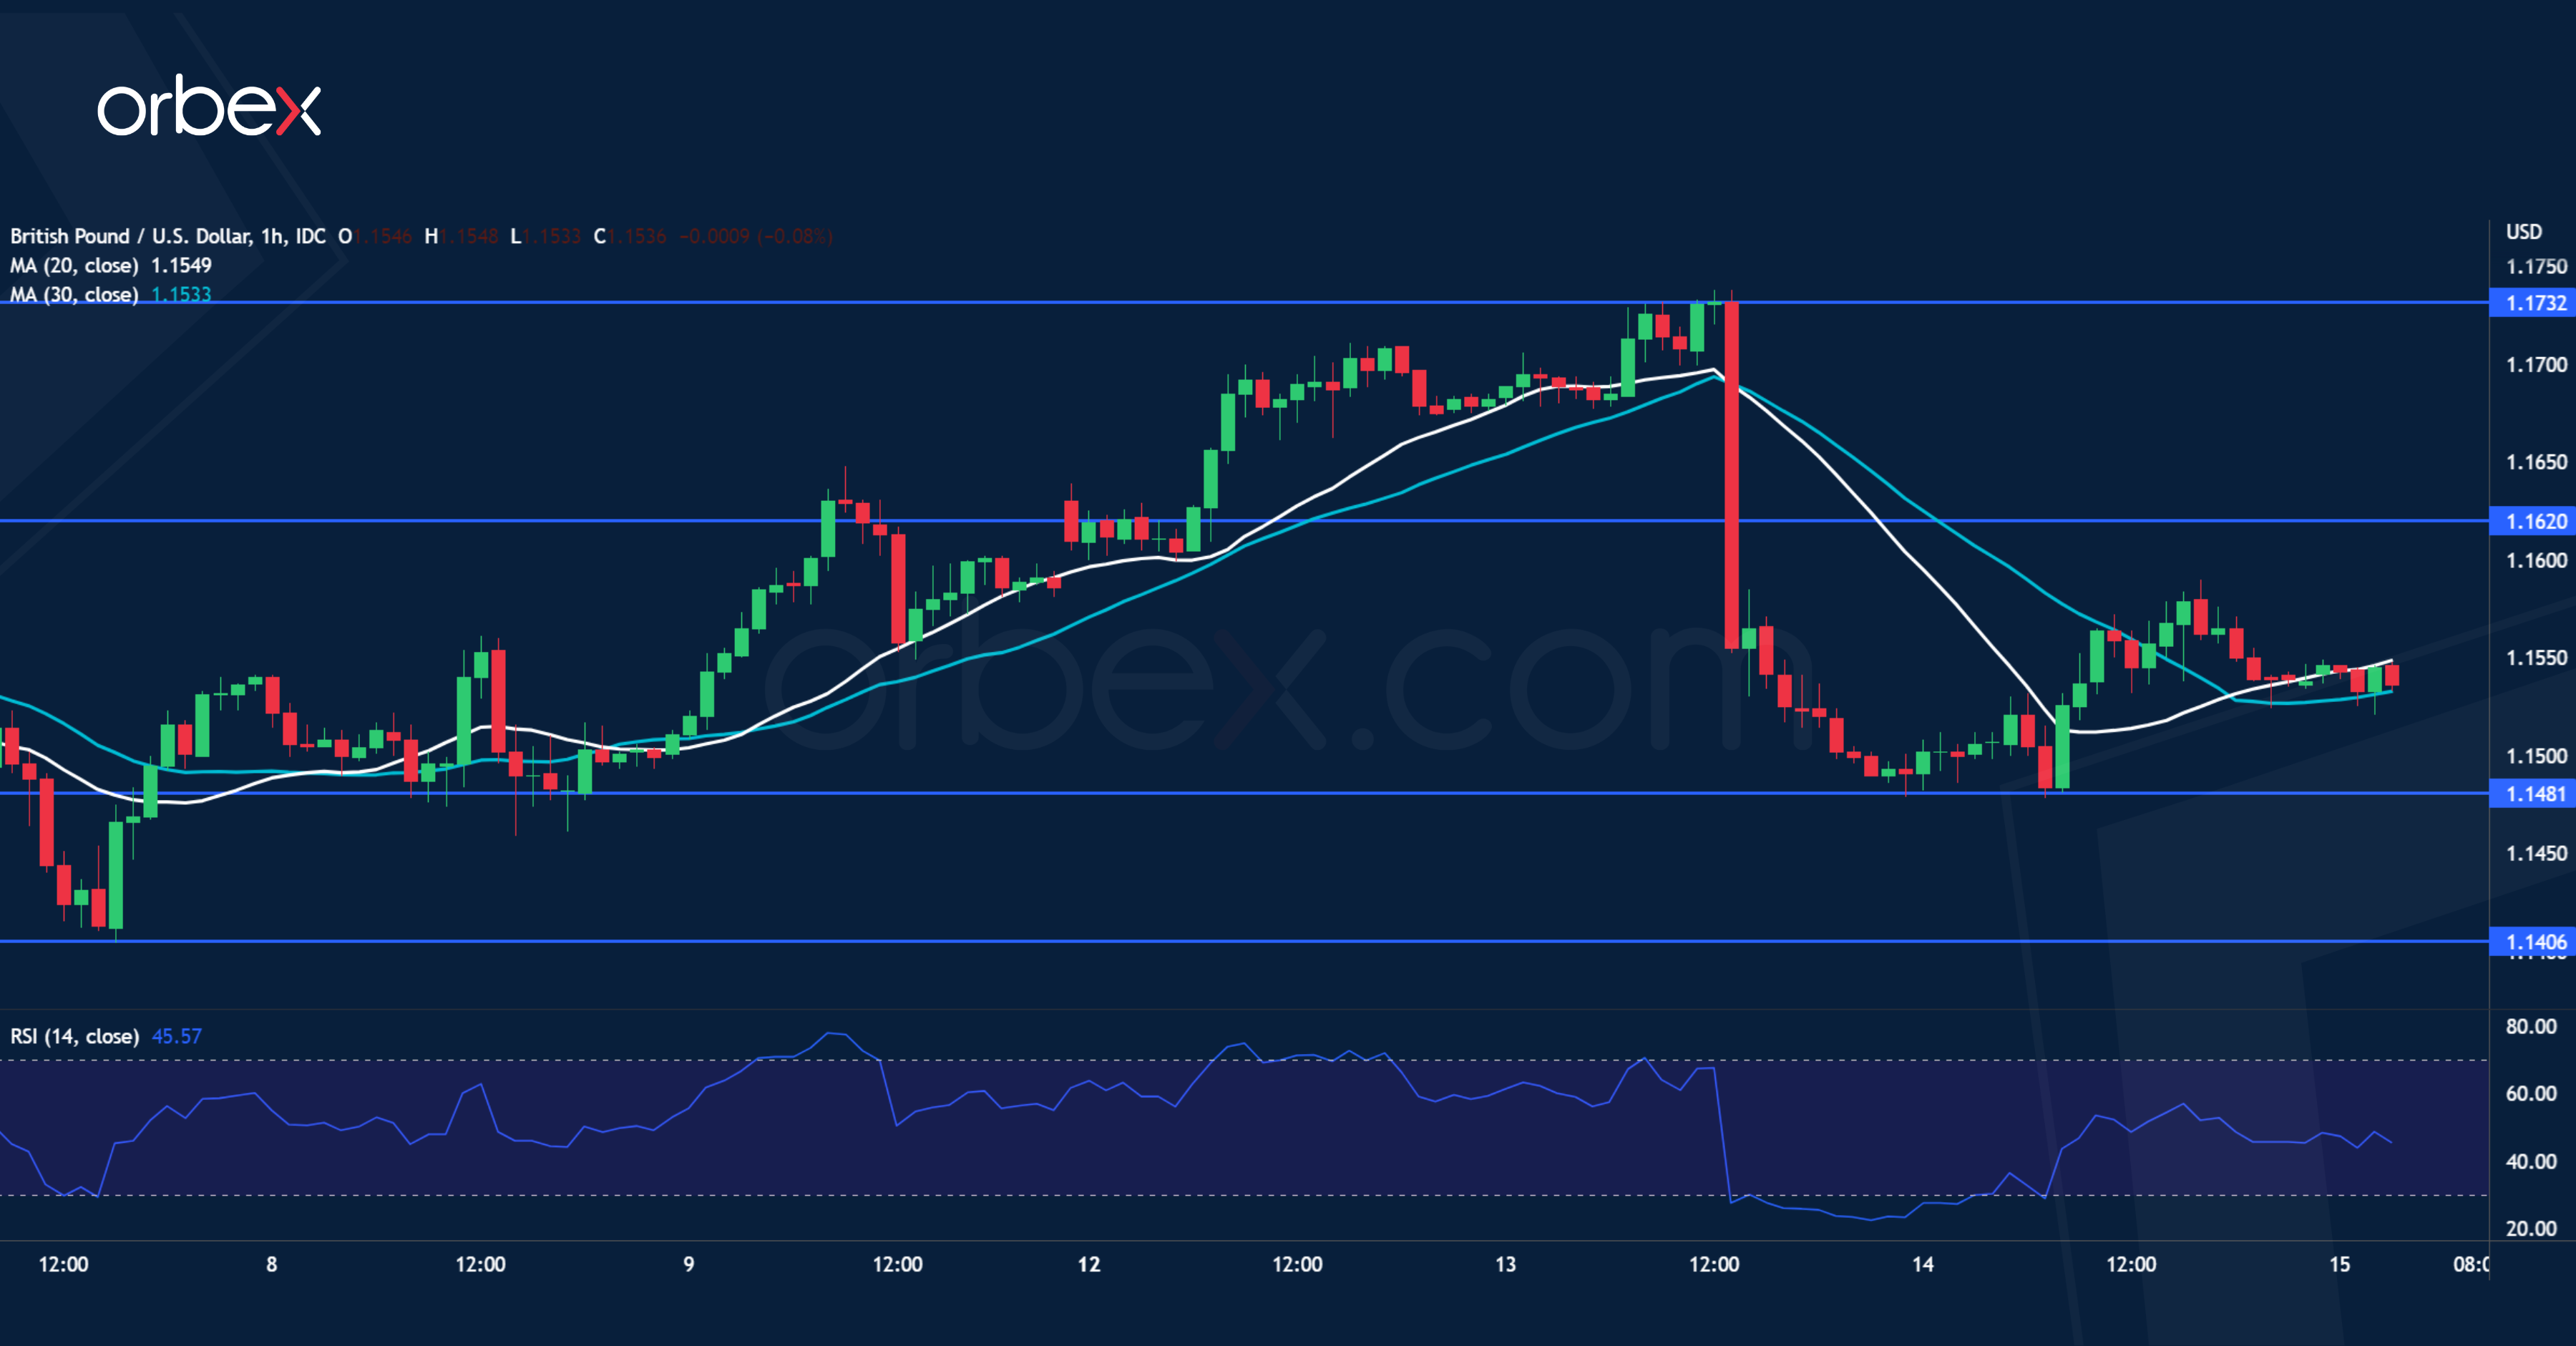
The pound bounces back as Britain’s core CPI stayed stubbornly high in August. The sharp decline came to a halt at the base of a previous bullish breakout at 1.1480. The RSI’s oversold condition attracted some bargain hunters in the demand zone. The support-turned-resistance at 1.1620 is the next hurdle where trapped buyers would be looking to exit. However, its breach would send Sterling back to 1.1730 on the 20-day moving average, suggesting that the bulls may not yet have had their last word.
GBP/JPY Daily Outlook
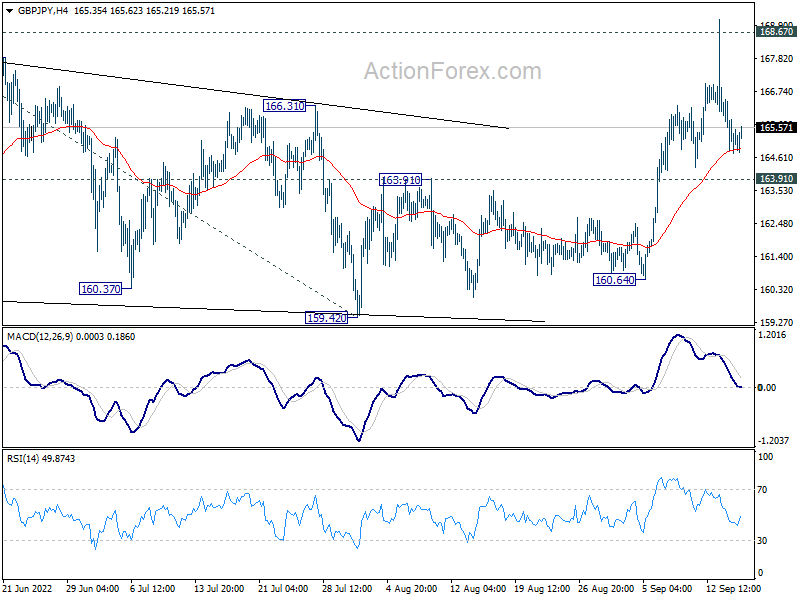
Daily Pivots: (S1) 164.49; (P) 165.50; (R1) 166.25; More...
Intraday bias in GBP/JPY stays neutral for the moment. On the upside, decisive break of 168.67 high will resume larger up trend. Next target is 100% projection of 155.57 to 168.67 from 159.42 at 172.42. On the downside, break of 163.91 resistance turned support will turn bias back to the downside to extend the corrective pattern from 168.67.
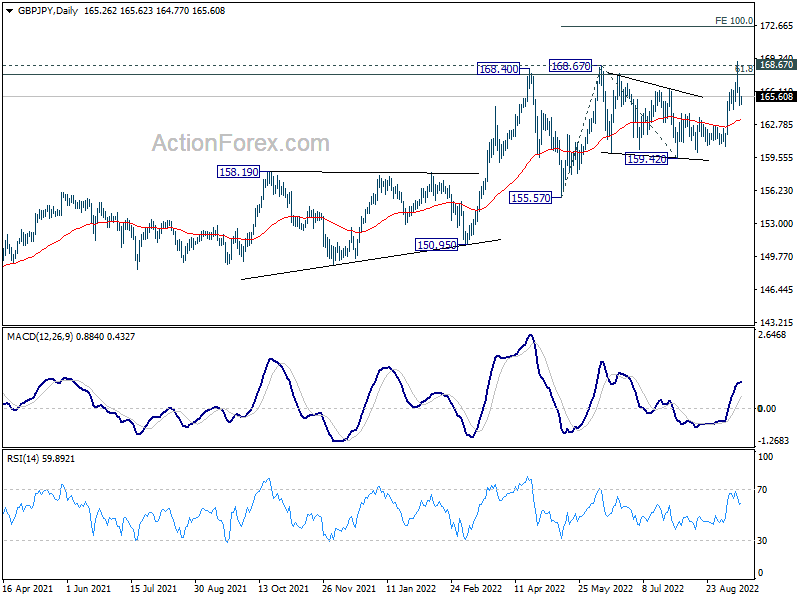
In the bigger picture, up trend from 123.94 (2020 low) is still in progress. Sustained break of 61.8% retracement of 195.86 (2015 high) to 122.75 (2016 low) at 167.93 will be a long term bullish signal, and could pave the way back to 195.86 high. This will remain the favored case as long as 155.57 support holds, even in case of deep pull back.
EUR/JPY Daily Outlook
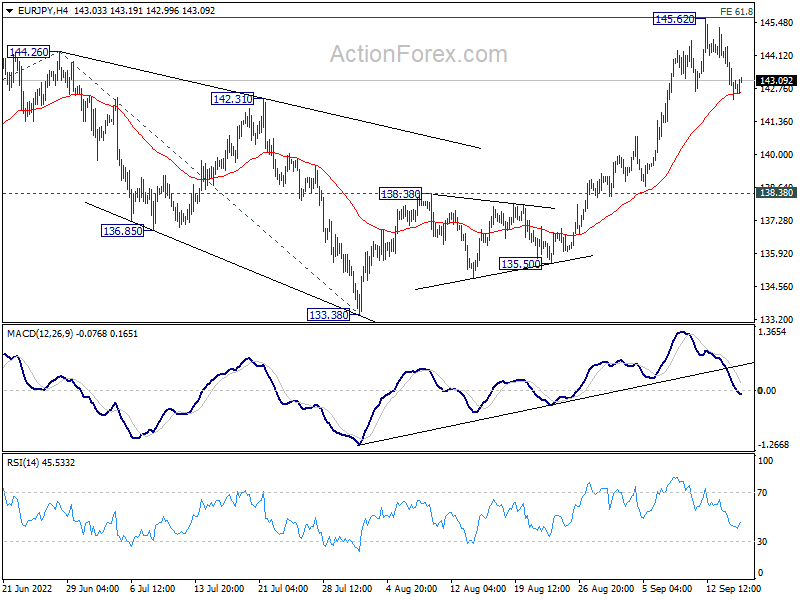
Daily Pivots: (S1) 141.95; (P) 143.21; (R1) 144.13; More....
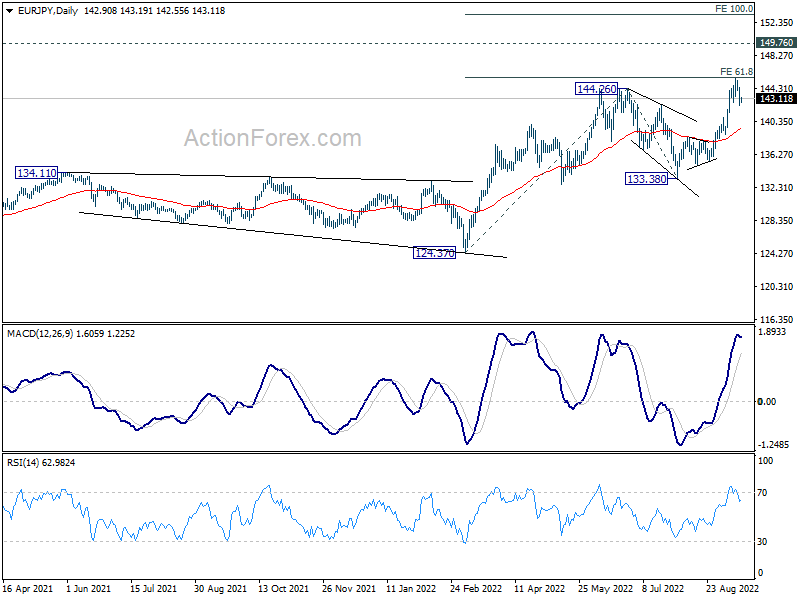
EUR/JPY is staying in consolidation from 145.62 and intraday bias remains neutral first. Deeper pull back cannot be ruled out. But downside should be contained above 138.38 resistance turned support bring another rally. On the upside, decisive break of 61.8% projection of 124.37 to 144.26 from 133.38 at 145.67 will pave the way to 149.76 long term resistance, and then 100% projection at 153.27.
In the bigger picture, up trend from 114.42 (2020 low) is seen as the third leg of the pattern from 109.30 (2016 low). Next target is 149.76 (2015 high). For now, outlook will remain bullish as long as 133.38 support holds, even in case of deep pull back.
EUR/GBP Daily Outlook
Daily Pivots: (S1) 0.8621; (P) 0.8652; (R1) 0.8679; More...
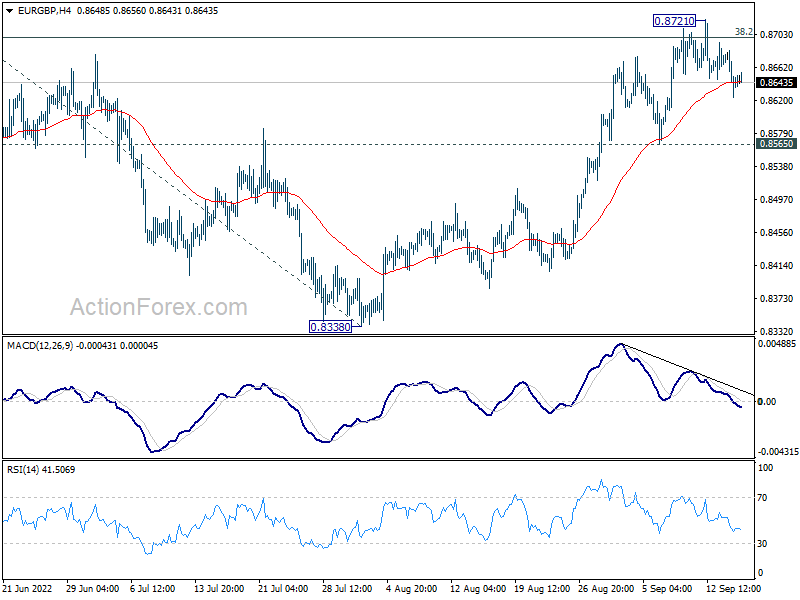
Intraday bias in EUR/GBP remains neutral and outlook is unchanged. On the upside, firm break of 0.8720 resistance will indicate resumption of whole rise from 0.8201. Intraday bias will be back on the upside for 100% projection of 0.8201 to 0.8720 from 0.8338 at 0.8857. On the downside, however, break of 0.8565 support will indicate rejection by 0.8720 and turn bias back to the downside.
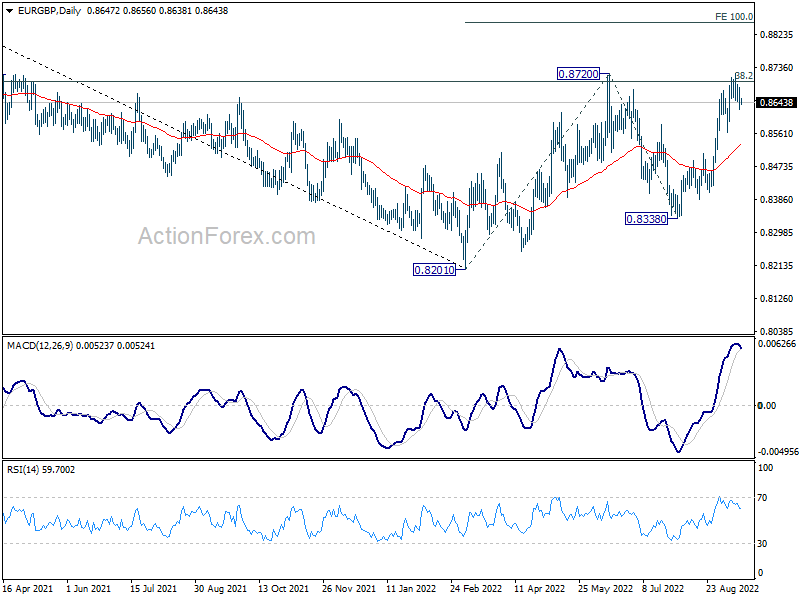
In the bigger picture, focus is back on 38.2% retracement of 0.9499 to 0.8201 at 0.8697. Sustained break there will argue that rise from 0.8201 is a medium term up trend, rather than a correction. Next target is 61.8% retracement at 0.9003. Rejection by 0.8697 again will maintain medium term bearishness, for extending the down trend from 0.9499 (2020 high) at a later stage.
EUR/AUD Daily Outlook
Daily Pivots: (S1) 1.4722; (P) 1.4773; (R1) 1.4859; More...
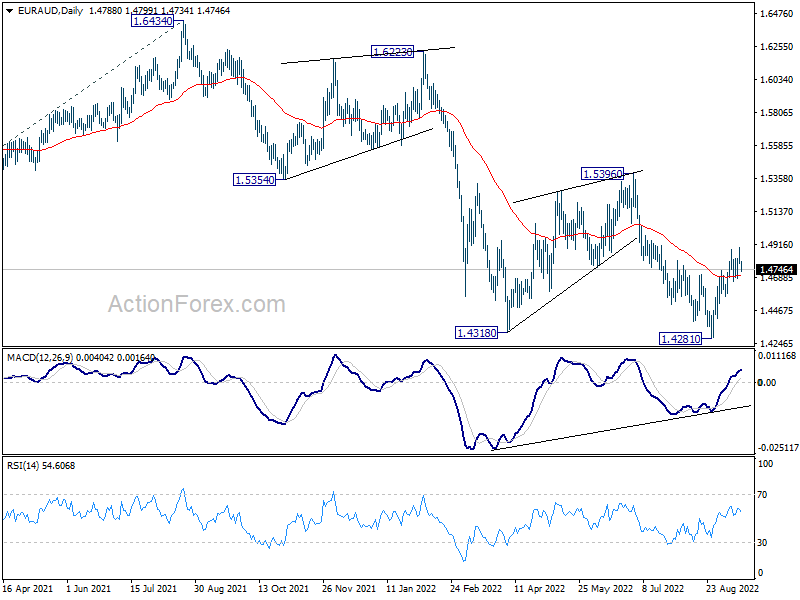
EUR/AUD edged higher to 1.4896 but quickly retreated. Intraday bias stays neutral first. On the upside, above 1.4896 will resume the rebound from 1.4281 short term bottom, and target 1.5396 resistance. On the downside, however, break of 1.4564 minor support will turn bias back to the downside for retesting 1.4281 low.
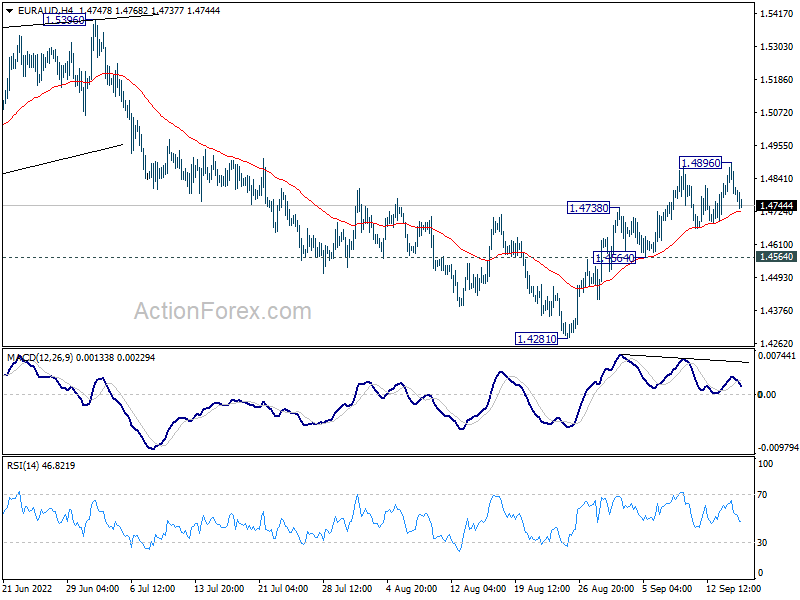
In the bigger picture, down trend from 1.9799 is still in progress. Break of 1.4318 low will target 61.8% projection of 1.9799 to 1.5250 from 1.6434 at 1.3623, which is close to 1.3624 long term support (2017 low). This will remain the favored case now as long as 1.5396 resistance holds.
EUR/CHF Daily Outlook
Daily Pivots: (S1) 0.9580; (P) 0.9605; (R1) 0.9627; More....
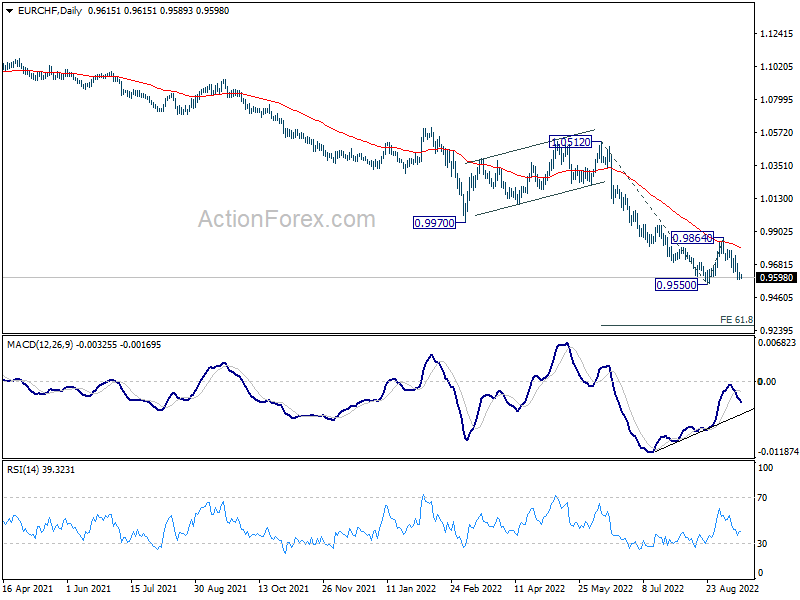
Intraday bias in EUR/CHF stays mildly on the downside for retesting 0.9550 low. Decisive break there will resume larger down trend. Next target is 61.8% projection of 1.0512 to 0.9550 from 0.9864 at 0.9269. On the upside, above 0.9744 minor resistance will extend the corrective pattern from 0.9550 with another rising leg.
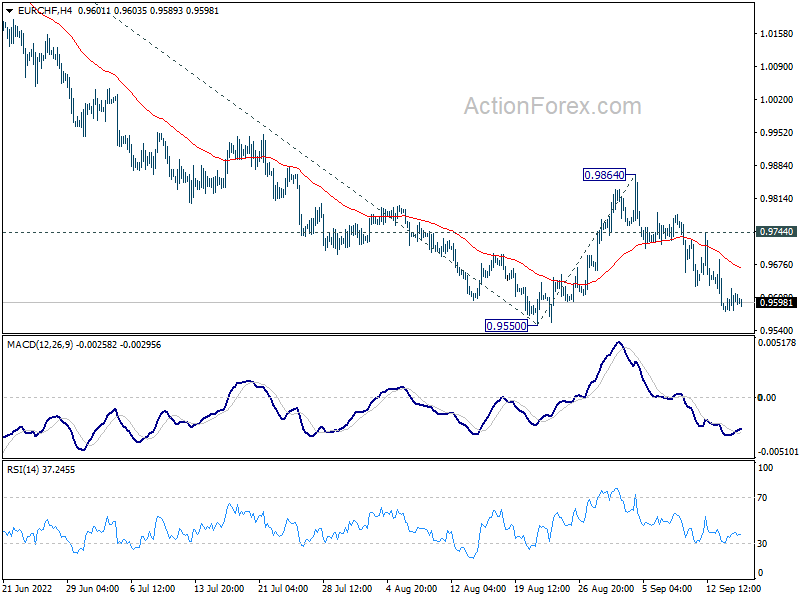
In the bigger picture, long term down trend from 1.2004 (2018 high) is still in progress. Next target is 138.2% projection of 1.2004 to 1.0505 to 1.1149 at 0.9033. On the upside, break of 0.9970 support turned resistance is needed to be the first sign of medium term bottoming. Otherwise, outlook will stay bearish in case of strong rebound.