

Sample Category Title
Eurozone Trade Deficit Calls for a Stronger Euro
According to a new Eurostat publication, the eurozone’s seasonally adjusted foreign trade deficit widened to 40bn in July. Since last October, the region has found itself in the unfamiliar role of a net importer. That is a notable reversal after about ten years of exports significantly exceeding imports. From 1999 to 2012, exports and imports held together even in the crisis period of 2008-2009.
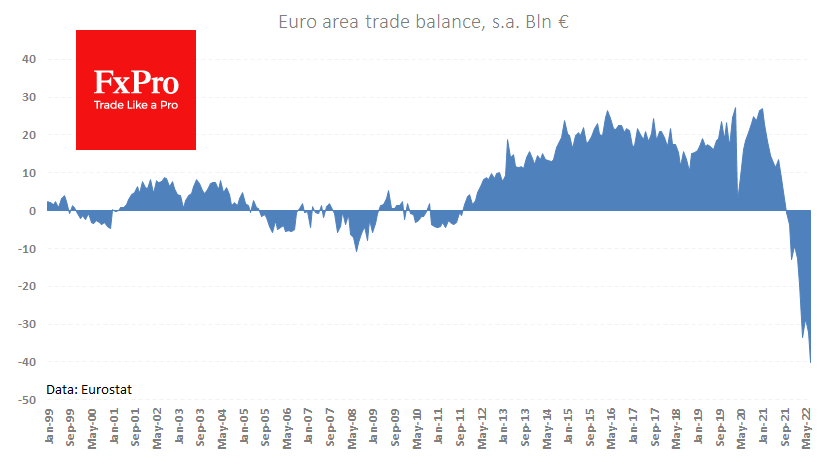
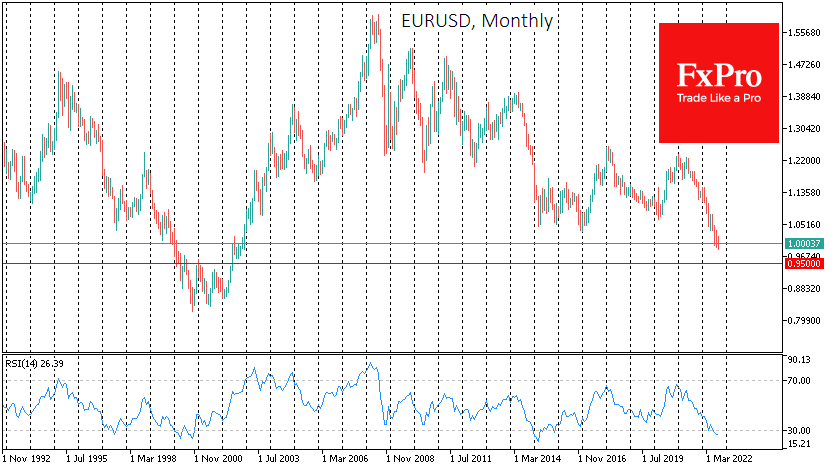
Following a series of energy shocks, imports have been growing faster than exports for the last 18 months, in 10 of which there is a ballooning deficit. It is interesting that during this whole time, i.e., since the start of 2021, the EURUSD has been systematically falling.
In the case of Europe, it is not yet possible to say that a currency depreciation improves foreign trade performance, it is instead the opposite. The falling Euro is inflating energy import bills.
We are also seeing signs of a peak in exports, which have been falling for the past two months despite the import jump. The reason on the surface is the loss of competitiveness of the region’s goods, as energy costs Europe more than some competing regions, such as the US.
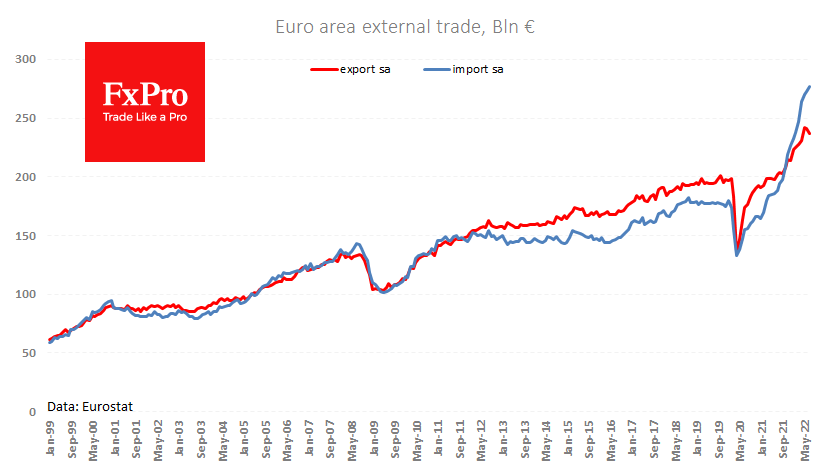
Surging energy prices are responsible for a rise in EU imports from Norway (+151% between January and July) and Russia (+70%). Still, there is also an increase in the trade deficit with China of over 100 billion and sizeable increases in imports from the UK and India, suggesting a weaker competitive position of European goods.
The latter should be a wake-up call for eurozone monetary authorities, as soft policies are now working against the economy by depreciating the single currency and inflating import costs.
It may sound a bit unusual, but the eurozone should adopt the policies of emerging economies, which are fighting the economic crisis by supporting the national currency and trying to keep capital in.
More and more ECB officials may share this thought, so the resolution to raise rates we saw last week might be a long-term shift rather than a passing episode. If that is the case, we should expect a tightening of the monetary authority’s tone and more overt moves to protect the Euro from declining.
However, traders and investors should be aware that such political shifts will not be able to reverse the exchange rate in one go. At best, a slowdown in the Euro depreciation can become the case in the coming months, not days. That said, we believe a EURUSD initial decline towards 0.95 is likely before the Euro gains a solid footing.
US: Retail Sales Continued to Grow as Sales at Car Dealers Outperformed
Retail sales were up 0.3% month-on-month (m/m) in August – above the consensus forecast (-0.1% m/m) – and higher than the flat reading in July.
Sales at autos & parts dealers were the major contributor to today's gains, with a 2.8% m/m rebound from July's 2.0% m/m decline.
Excluding autos, retail sales were down 0.3% m/m in August, below the consensus expectations for a flat reading.
Sales at gasoline stations were down by 4.2% m/m, reflecting the 10.6% pullback in gas prices. Adjusted for prices, sales were up 7.1% m/m. Meanwhile, sales at building materials retailers were up 1.1% m/m in August, but excluding prices they declined by 0.3% m/m as reflecting cooling housing activity.
Excluding the above categories, the "control group", used in calculating personal consumption expenditures, was flat on the month in August - lower than the 0.5% m/m expected by the consensus. July's reading was also revised down to 0.4% m/m, from 0.8% m/m reported previously.
- Nominal growth was reported by miscellaneous stores retailers (+1.6% m/m), food services & drinking places (+1.1% m/m), department stores, food & beverage stores (+0.5% m/m), sporting goods (+0.5% m/m), hobby, book & music stores (+0.5% m/m) and clothing & accessory stores (+0.4% m/m).
- The one category that weighed on growth in August was non-store retailers (-0.7% m/m), which stepped down from a stellar growth in July, outweighing all the other gains.
Key Implications
Strong demand for cars drove today's stronger-than-expected reading. Putting autos aside, retail sales declined. When adjusted for inflation, sales ex autos were down 1.2% month-on-month. Some of the weakness was offset by stronger real sales at apparel stores as consumers opened their wallets to prep their kids for school. Still, it seems more and more obvious that consumers are pivoting to prioritizing essentials, with our estimate of real discretionary spending contracting an average of -0.1% m/m over the past three months.
Today's stronger than expected reading only reinforces the Fed's hawkish stance. Today's data excludes almost all services consumption (except spending on restaurants) which should be relatively more resilient than spending on non-essential goods. We now expect real goods spending to come in at a healthy 0.3% month-on-month, tracking 1.4% quarter-on-quarter (annualized).
EUR/USD Mid-Day Outlook
Daily Pivots: (S1) 0.9949; (P) 0.9986; (R1) 1.0017; More...
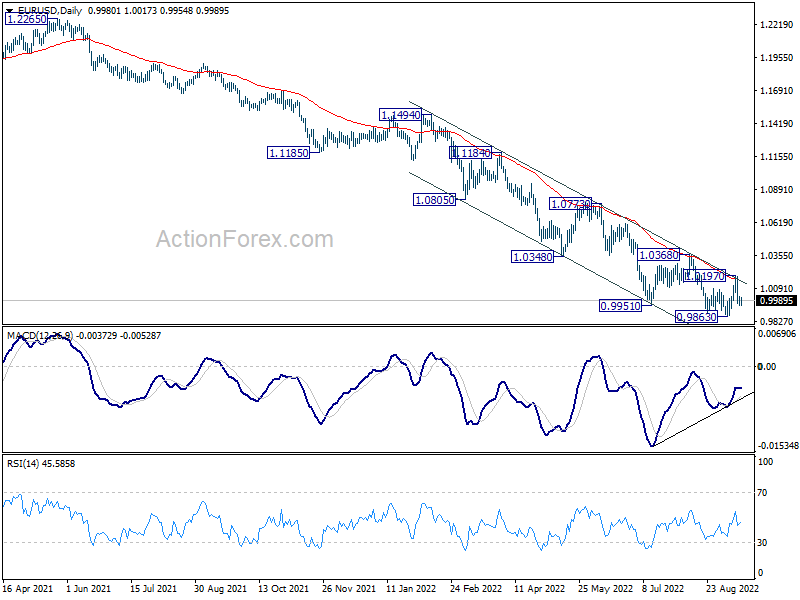
Intraday bias in EUR/USD stays mildly on the downside at this point. Deeper fall could be seen to retest 0.9863 low first. Firm break there will resume larger down trend. On the upside, break of 1.0197 resistance will now raise the chance of larger trend reversal, and target 1.0368 resistance.
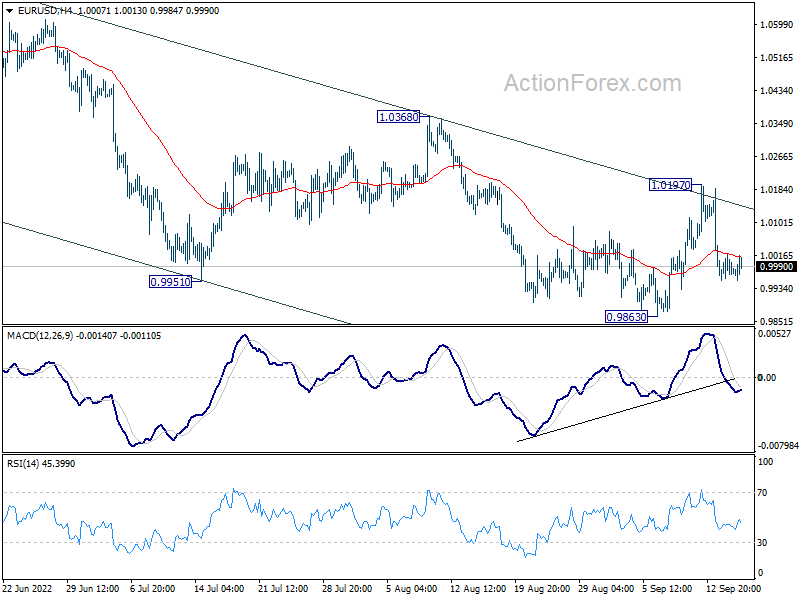
In the bigger picture, down trend from 1.6039 (2008 high) is still in progress. Next target is 100% projection of 1.3993 to 1.0339 from 1.2348 at 0.8694. In any case, outlook will stay bearish as long as 1.0368 resistance holds, in case of strong rebound. However, firm break of 1.0368 will confirm medium term bottom at 0.9863 already.
GBP/USD Mid-Day Outlook
Daily Pivots: (S1) 1.1483; (P) 1.1537; (R1) 1.1593; More...
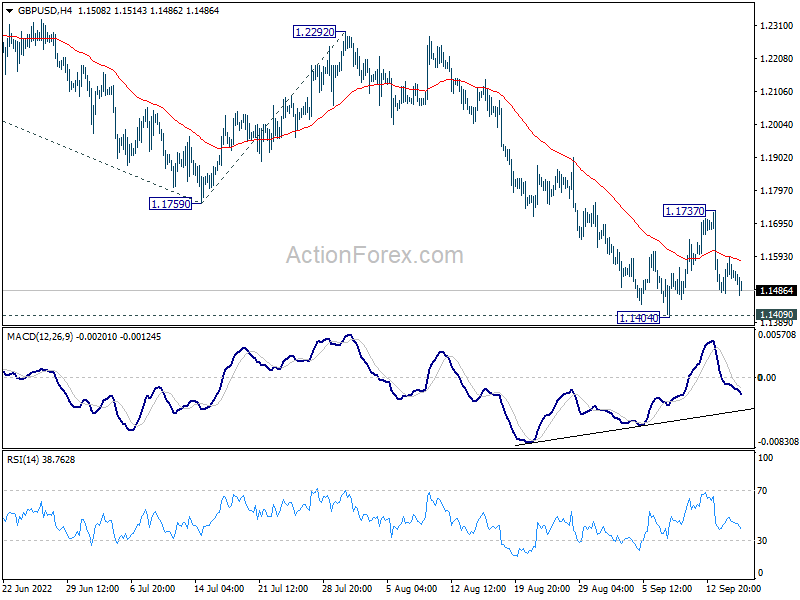
Intraday bias in GBP/USD stays neutral and outlook remains bearish. On the downside, decisive break of 1.1404/9 will resume larger down trend. Next target is 61.8% projection of 1.3748 to 1.1759 from 1.2292 at 1.1063. On the upside, above 1.1737 minor resistance will resume the rebound from 1.1404 to 55 day EMA (now at 1.1904).
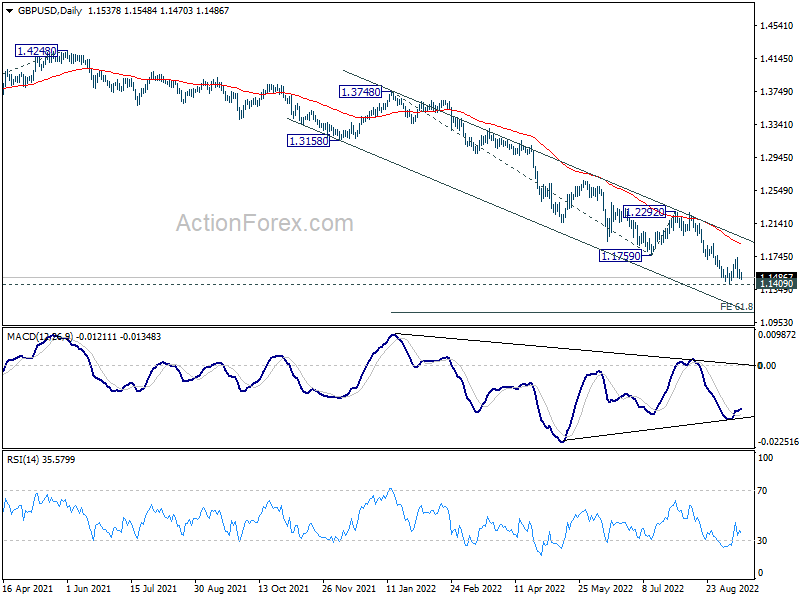
In the bigger picture, based on current momentum, fall from 1.4248 (2018 high) is probably resuming long term down trend from 2.1161 (2007 high). Sustained break of 1.1409 will target 61.8% projection of 1.7190 (2014 high) to 1.1409 (2020 low) from 1.4248 (2021 high) at 1.0675. This will remain the favored case for now as long as 1.2292 resistance holds.
USD/CHF Mid-Day Outlook
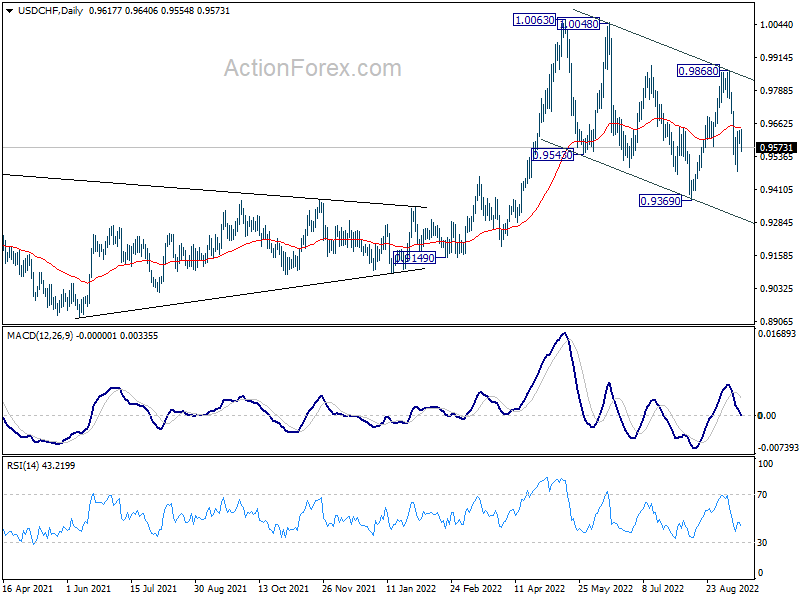
Daily Pivots: (S1) 0.9596; (P) 0.9617; (R1) 0.9644; More
Intraday bias in USD/CHF stays neutral for the moment. The pair is still in corrective pattern from 1.0063. Below 0.9478 will extend the fall from 0.9868 towards 0.9369 support. On the upside, firm break of 4 hour 55 EMA (now at 0.9654) will target 0.9868 resistance first. Further break there will argue that larger up trend is ready to resume through 1.0063.
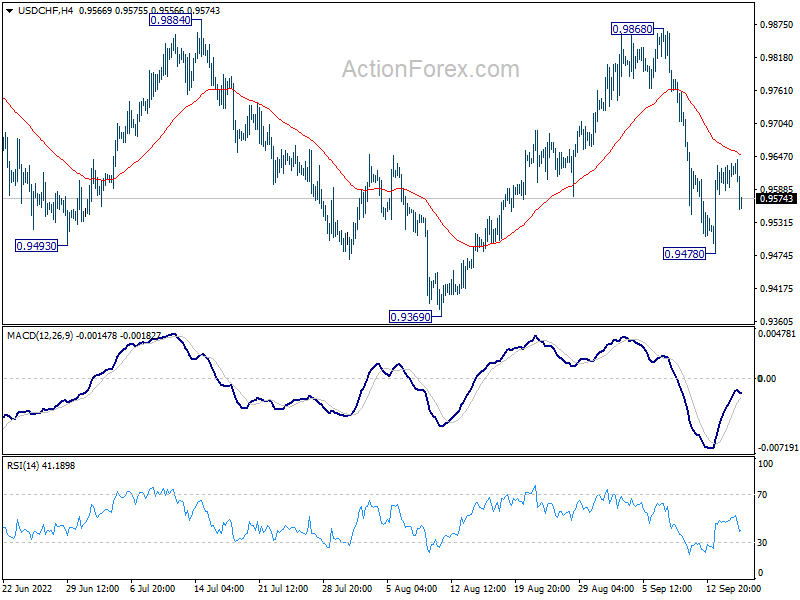
In the bigger picture, current development suggests that up trend from 0.8756 (2021 low) is still in progress. Sustained break of 1.0063 will target 100% projection of 0.9149 to 1.0063 from 0.9369 at 1.0283, and then 1.0342 (2016 high). For now, this will remain the favored case as long as 0.9369 support holds, even in case of deep pull back.
USD/JPY Mid-Day Outlook
Daily Pivots: (S1) 142.17; (P) 143.56; (R1) 144.57; More...
Range trading continues in USD/JPY and intraday bias stays neutral first. While deeper retreat cannot be ruled out, downside should be contained by 139.37 resistance turned support. On the upside, break of 144.98 will resume larger up trend to 147.68 long term resistance. Break there will target 161.8% projection of 126.35 to 139.37 from 130.38 at 151.44 next.
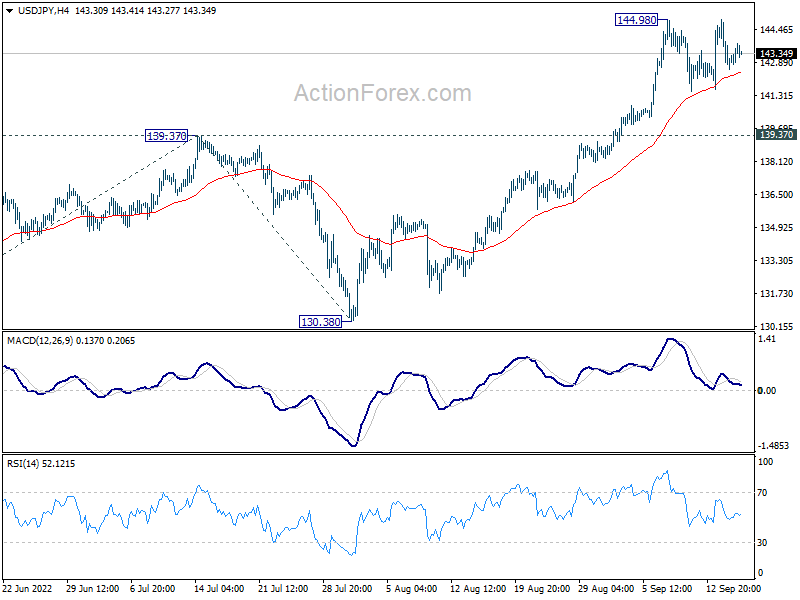
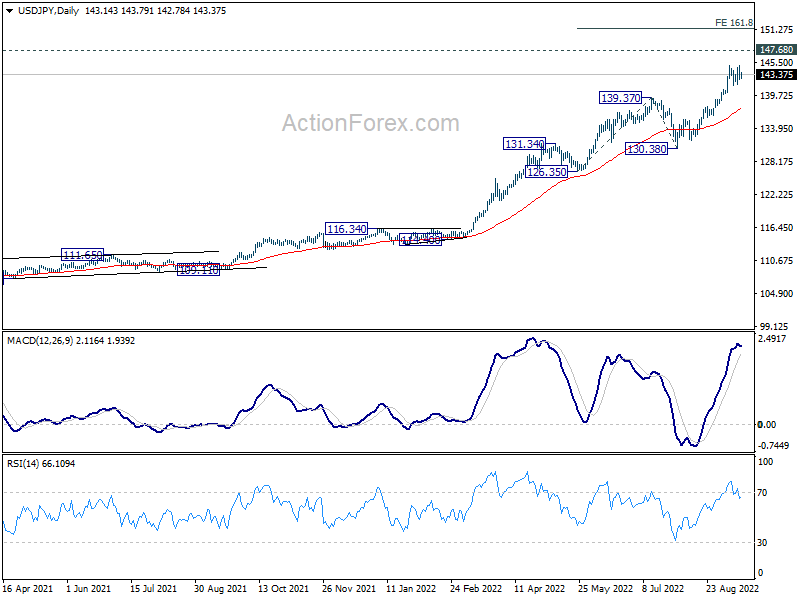
In the bigger picture, up trend from 101.18 is still in progress, as part of the whole up trend from 75.56 (2011 low). Further rise should be seen to 147.68 (1998 high). For now, break of 130.38 support is needed to be the first indication of medium term topping. Otherwise, outlook will stay bullish even in case of deep pull back.
Dollar Shrugs Mixed Retail Sales, GBP/CHF Breaks Pandemic Low
Dollar is staying largely in range after mixed retail sales data from the US. Today's focus turns to selloff in Sterling, in particular against Swiss Franc and Euro. Yen weakens mildly after yesterday's rebound quickly lost momentum. Commodity currencies are trading on the soft side. In other markets, major European indexes are mixed while US futures are nearly flat. Gold is back pressing key support level at around 1680. WTI crude oil is range bound.
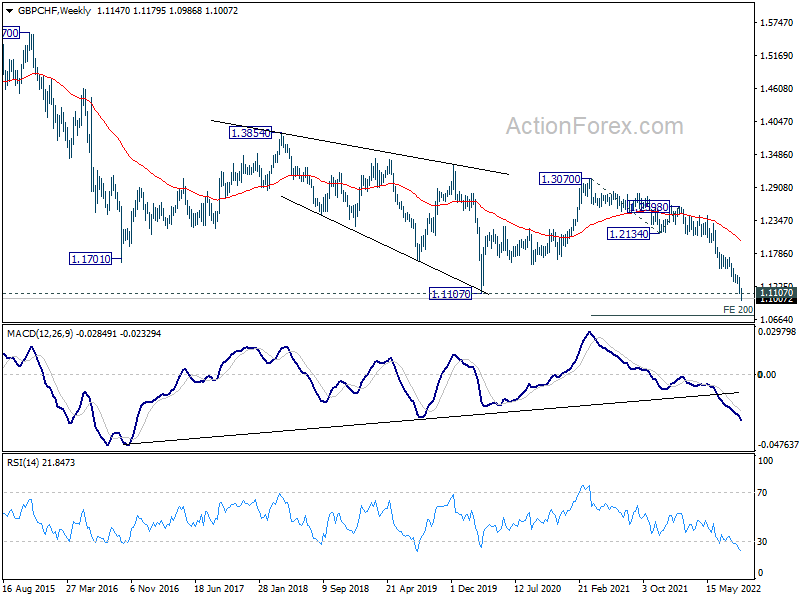
Technically, GBP/CHF break through pandemic low at 1.1107 this week and it's accelerating slightly. Next target is 200% projection of 1.3070 to 1.2134 from 1.2598 at 1.0726. The question is whether EUR/CHF would accelerate downward below 0.9550 low as down trend resumes. Or, EUR/GBP would finally break through 0.8721 resistance will strength to resume the rally from 0.8201.
In Europe, at the time of writing, FTSE is up 0.30%. DAX is down -0.17%. CAC is down -0.64%. Germany 10-year yield is down -0.007 at 1.709. Earlier in Asia, Nikkei rose 0.21%. Hong Kong HSI rose 0.44%. China Shanghai SSE dropped -1.16%. Singapore Strait Times rose 0.31%. Japan 10-year JGB yield dropped -0.0008 to 0.257.
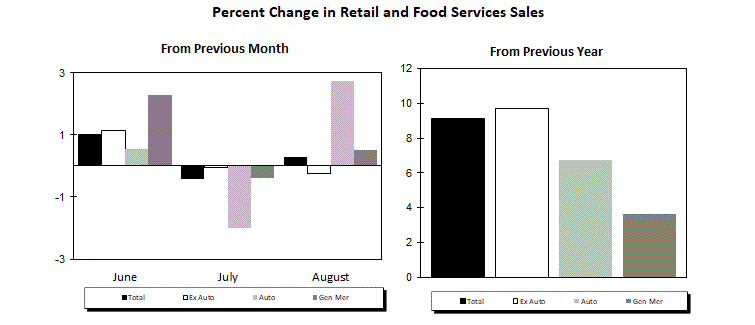
US retail sales rose 0.3% mom in Aug, ex-auto sales down -0.3% mom
US retail sales rose 0.3% mom to USD 683.3B in August, above expectation of 0.0% mom. Ex-auto sales dropped -0.3% mom, below expectation of 0.0% mom. Ex-gasoline sales rose 0.8% mom. Ex-auto, ex-gasoline sales rose 0.3% mom.
Comparing with a year ago, total sales rose 9.1% yoy. Total sales for June through August were up 9.3% from the same period a year ago.
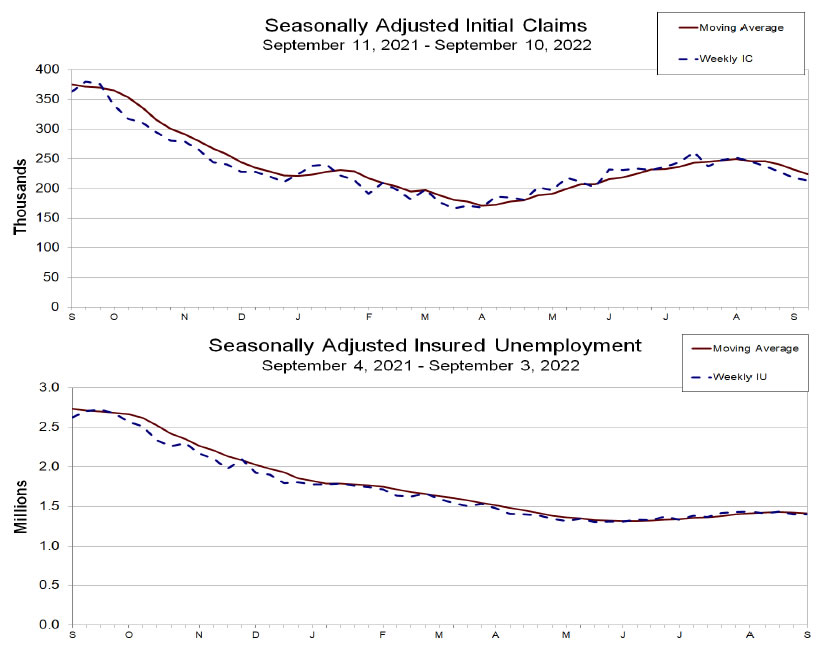
US initial jobless claims dropped to 213k
US initial jobless claims dropped -5k to 213k in the week ending September 10, below expectation of 227k. Four-week moving average of initial claims dropped -8k to 224k. Continuing claims rose 2k to 1403k in the week ending September 3. Four-week moving average of continuing claims dropped -7.75k to 1413k.
Also released, import price index dropped -1.0% mom in August. Empire State manufacturing index improved from -31.3 to -1.5. Philly Fed survey dropped from 6.2 to -9.9.
ECB de Guindos: Determined action essential to keep inflation expectations anchored
ECB Vice-President Luis de Guindos said in a speech, "monetary policy needs to be focused on price stability and on delivering our inflation target over the medium term. Determined action is essential to keep inflation expectations anchored, which in itself contributes to delivering price stability and avoids second-round effects in inflation. The main asset that central banks have is credibility, and this asset becomes even more important in times of high uncertainty."
On the economy, de Guindos said, "A period of heightened uncertainty is here to stay for a while, rendering decision-making more complex. Output growth is slowing down substantially and is expected to stagnate around year-end and remain low next year at less than 1%, while risks have intensified on the downside. This is set against a deteriorating inflation outlook with record-high inflation rates expected to stay elevated, well above our target, with risks primarily on the upside."
Eurozone exports rose 13.3% yoy in Jul, imports surged 44.0% yoy
Eurozone exports of goods rose 13.3% yoy to EUR 235.5B in July. Imports rose 44.0% yoy to EUR 269.5B. Trade deficit with the rest of the world came in at EUR -34B. Intra-Eurozone trade rose 24.0% yoy to EUR 224.8B.
In seasonally adjusted term, Eurozone exports dropped -1.7% mom to EUR 236.7B. Imports rose 1.5% mom to EUR 277.0B. Trade deficit widened to EUR -40.3B, larger than expectation of EUR -32.5B. Intra-Eurozone trade rose from EUR 225.1B to EUR 229.3B.
Japan reports record monthly trade deficit, on record increase in imports
Japan exports rose 22.1% yoy to JPY 8062B in August, driven by shipments of auto and chip-related equipment. Imports rose 49.9% yoy to JPY 10879B. That's the largest increase by value on record, since data became available back in 1979. The rise was driven by higher prices for energy including crude oil, coal, and LNG.
Trade deficit came in at JPY -2817B. That's the largest monthly trade deficit on record. That's also the 13th straight month of year-on-year trade shortfalls.
In seasonally adjusted term, exports dropped -0.7% mom to JPY 8379B. Imports rose 1.5% to JPY 10750B. Trade deficit came in at JPY -2371B.
Australia employment rose 33.5k in Aug, unemployment rate ticked up to 3.5%
Australia employment rose 33.5k in August, slightly smaller than expectation of 35.5k. Full-time jobs rose 58.8k while part-time jobs decreased -25.3k.
Unemployment rate ticked up from 3.4% to 3.5%, above expectation of 3.4%. Participation rate rose 0.2% from 66.4% to 66.6%. Monthly hours worked rose 0.8% mom.
New Zealand GDP grew 1.7% qoq in Q2, driven by services
New Zealand GDP grew 1.7% qoq in Q2, above expectation of 1.0% qoq, following a -0.2% qoq decline in Q1. Service industries rose 2.7% but goods producing industries dropped -3.8%. Primary industries rose 0.2%.
"The reopening of borders, easing of both domestic and international travel restrictions, and fewer domestic restrictions under the Orange traffic light setting supported growth in industries that had been most affected by the COVID-19 response measures," national accounts – industry and production senior manager Ruvani Ratnayake said.
"In the June 2022 quarter, households and international visitors spent more on transport, accommodation, eating out, and sports and recreational activities."
USD/JPY Mid-Day Outlook
Daily Pivots: (S1) 142.17; (P) 143.56; (R1) 144.57; More...
Range trading continues in USD/JPY and intraday bias stays neutral first. While deeper retreat cannot be ruled out, downside should be contained by 139.37 resistance turned support. On the upside, break of 144.98 will resume larger up trend to 147.68 long term resistance. Break there will target 161.8% projection of 126.35 to 139.37 from 130.38 at 151.44 next.
In the bigger picture, up trend from 101.18 is still in progress, as part of the whole up trend from 75.56 (2011 low). Further rise should be seen to 147.68 (1998 high). For now, break of 130.38 support is needed to be the first indication of medium term topping. Otherwise, outlook will stay bullish even in case of deep pull back.
Economic Indicators Update
| GMT | Ccy | Events | Actual | Forecast | Previous | Revised |
|---|---|---|---|---|---|---|
| 22:45 | NZD | GDP Q/Q Q2 | 1.70% | 1.00% | -0.20% | |
| 23:50 | JPY | Trade Balance (JPY) Aug | -2.37T | -2.08T | -2.13T | -2.16T |
| 01:00 | AUD | Consumer Inflation Expectations Sep | 5.40% | 5.90% | ||
| 01:30 | AUD | Employment Change Aug | 33.5K | 35.5K | -40.9K | |
| 01:30 | AUD | Unemployment Rate Aug | 3.50% | 3.40% | 3.40% | |
| 04:30 | JPY | Tertiary Industry Index M/M Jul | -0.60% | -0.10% | -0.20% | |
| 09:00 | EUR | Eurozone Trade Balance (EUR) Jul | -32.5B | -30.8B | ||
| 12:30 | USD | Initial Jobless Claims (Sep 9) | 227K | 222K | ||
| 12:30 | USD | Retail Sales M/M Aug | 0.00% | 0.00% | ||
| 12:30 | USD | Retail Sales ex Autos M/M Aug | 0.00% | 0.40% | ||
| 12:30 | USD | Import Price Index M/M Aug | -1.20% | -1.40% | ||
| 12:30 | USD | Empire State Manufacturing Index Sep | -15.25 | -31.3 | ||
| 12:30 | USD | Philadelphia Fed Manufacturing Survey Sep | 2.5 | 6.2 | ||
| 13:15 | USD | Industrial Production M/M Aug | 0.20% | 0.60% | ||
| 14:00 | USD | Business Inventories Jul | 0.80% | 1.40% | ||
| 14:30 | USD | Natural Gas Storage | 71B | 54B |
US initial jobless claims dropped to 213k
US initial jobless claims dropped -5k to 213k in the week ending September 10, below expectation of 227k. Four-week moving average of initial claims dropped -8k to 224k.
Continuing claims rose 2k to 1403k in the week ending September 3. Four-week moving average of continuing claims dropped -7.75k to 1413k.
US retail sales rose 0.3% mom in Aug, ex-auto sales down -0.3% mom
US retail sales rose 0.3% mom to USD 683.3B in August, above expectation of 0.0% mom. Ex-auto sales dropped -0.3% mom, below expectation of 0.0% mom. Ex-gasoline sales rose 0.8% mom. Ex-auto, ex-gasoline sales rose 0.3% mom.
Comparing with a year ago, total sales rose 9.1% yoy. Total sales for June through August were up 9.3% from the same period a year ago.
Can the EU’s Energy Plan Rescue the Euro from the Doldrums?
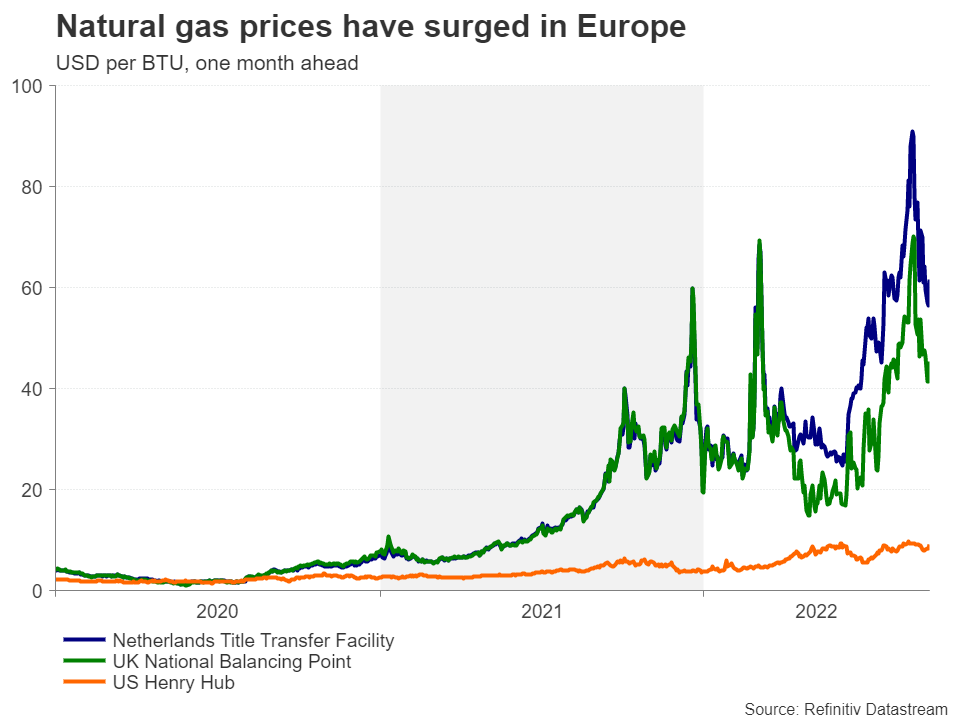
The euro has been besieged on several fronts this year. Having already been on the backfoot due to the widening monetary policy divergence with the United States, the euro then had to contend with the immediate fallout of the war in Ukraine as harsh sanctions were slapped on Russia. But it is the ensuing energy crisis that now poses the biggest threat to the single currency as Europe is heading towards what could be the bleakest winter since the end of World War II. However, the European Union’s proposals to ease the pain of the energy crunch have offered some hope that an economic catastrophe can be averted.
On the backfoot
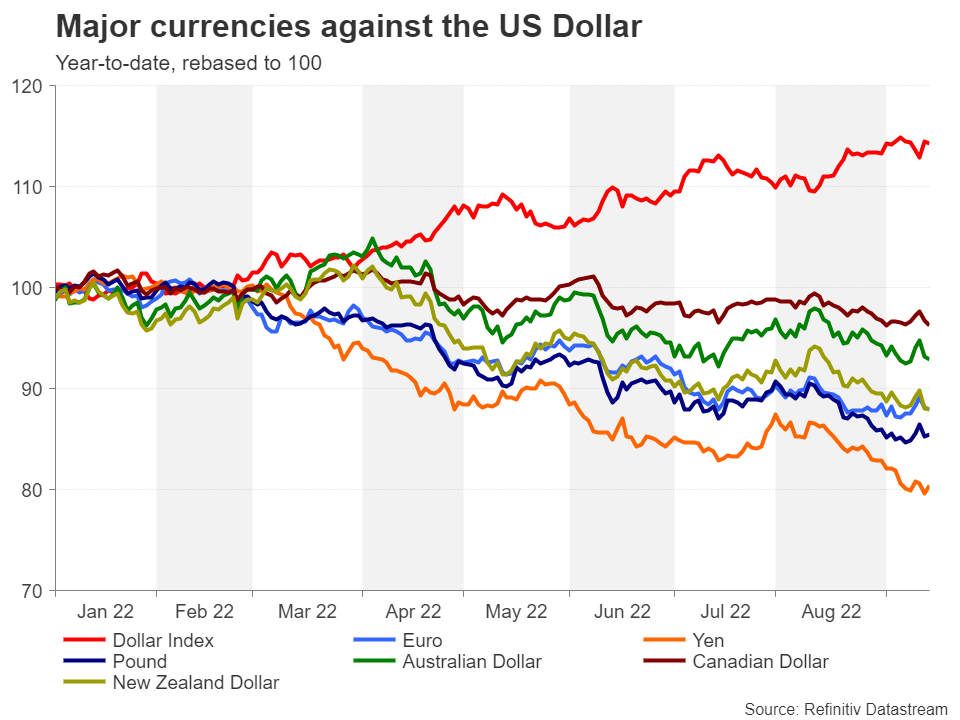
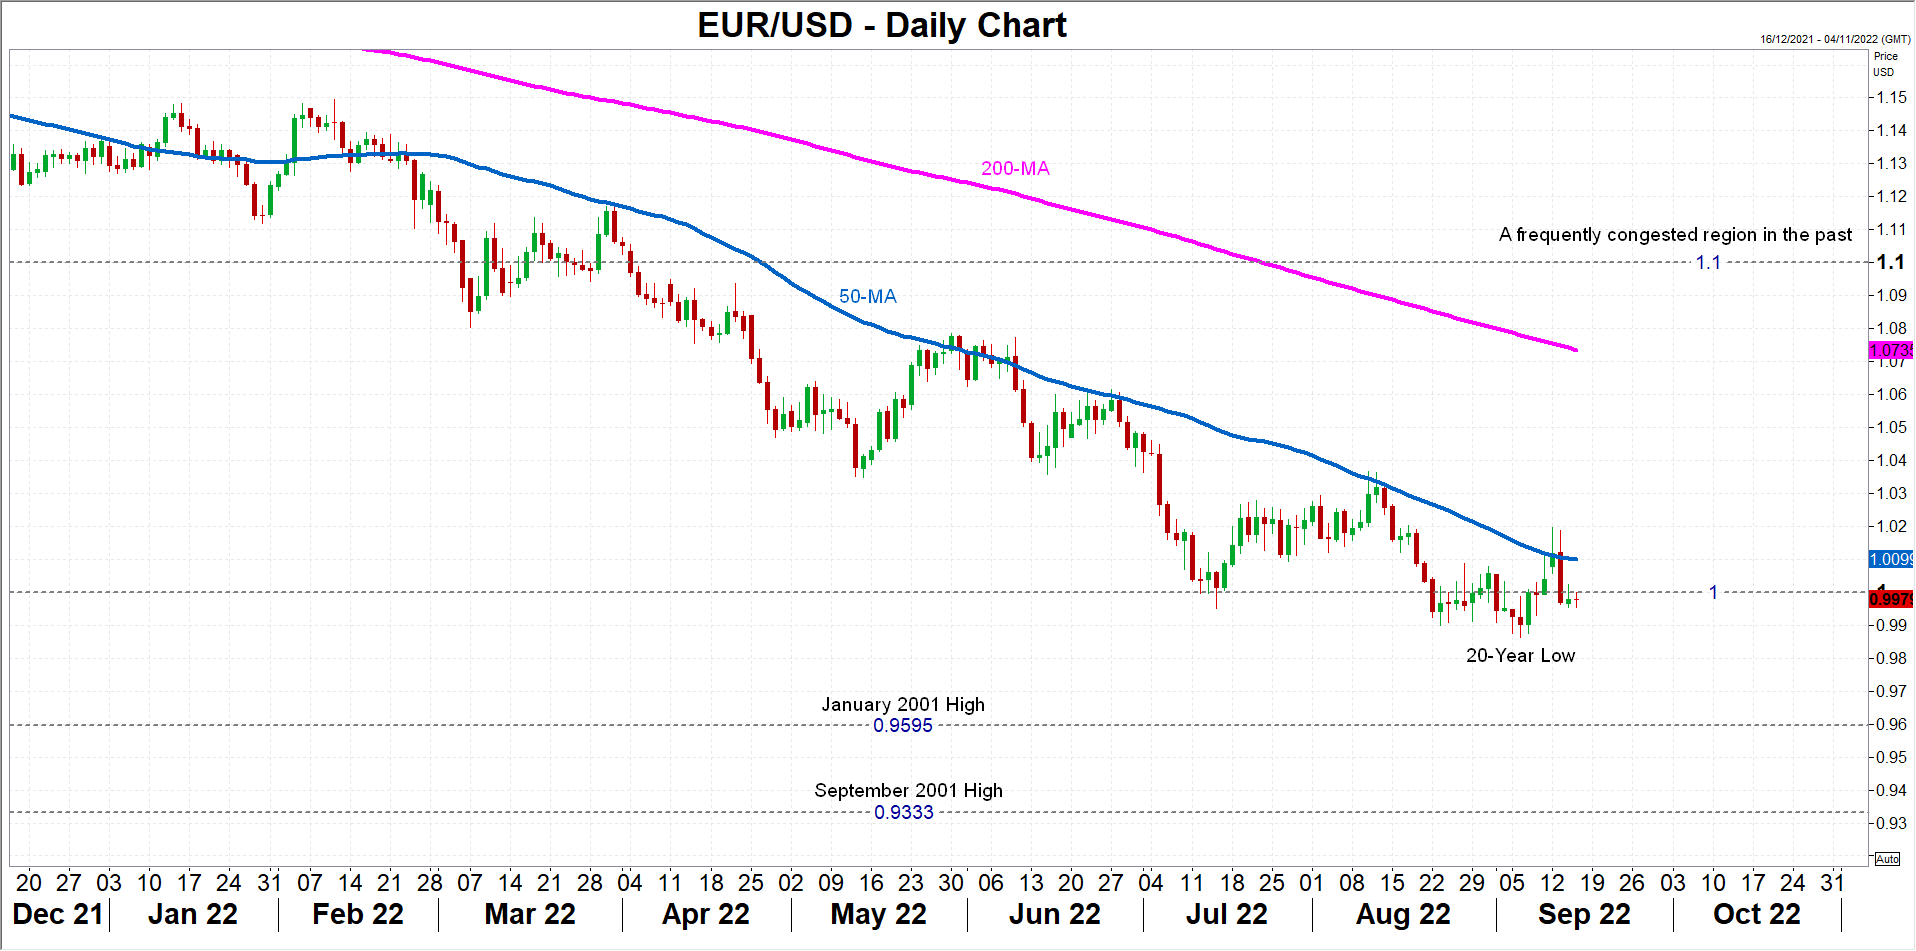
Although the euro does not have the misfortune of holding the title of the worst performing currency, it has nonetheless lost about 12% of its value against the US dollar in the year-to-date, extending the 8% decline from 2021. Hence, it was inevitable that it would reach parity sooner or later and the pair has been repeatedly testing that region for the past month. Much of the weakness can be attributed to dollar strength as the Fed has out-hawked the European Central Bank at every turn ever since the era of pandemic stimulus drew to a close.
However, Europe’s economic troubles keep piling up and investors are increasingly gloomy about the outlook. Decades-high inflation has forced the ECB to hike interest rates at a time when households are being squeezed from the soaring cost of living, while businesses – still reeling from supply chain disruptions – face rising borrowing costs. But the situation escalated after Russia began to slowly turn off the gas taps to Europe.
Solving the gas crisis
Prior to the Ukraine conflict, Russia was Europe’s largest source of natural gas, supplying about 40% of its needs. But that share has fallen to just 9%, partly because European governments have been trying to wean off Russian gas and partly because Moscow has decided to use its exports as leverage to get the sanctions lifted by restricting the supplies that flow through the various pipelines from Russia.
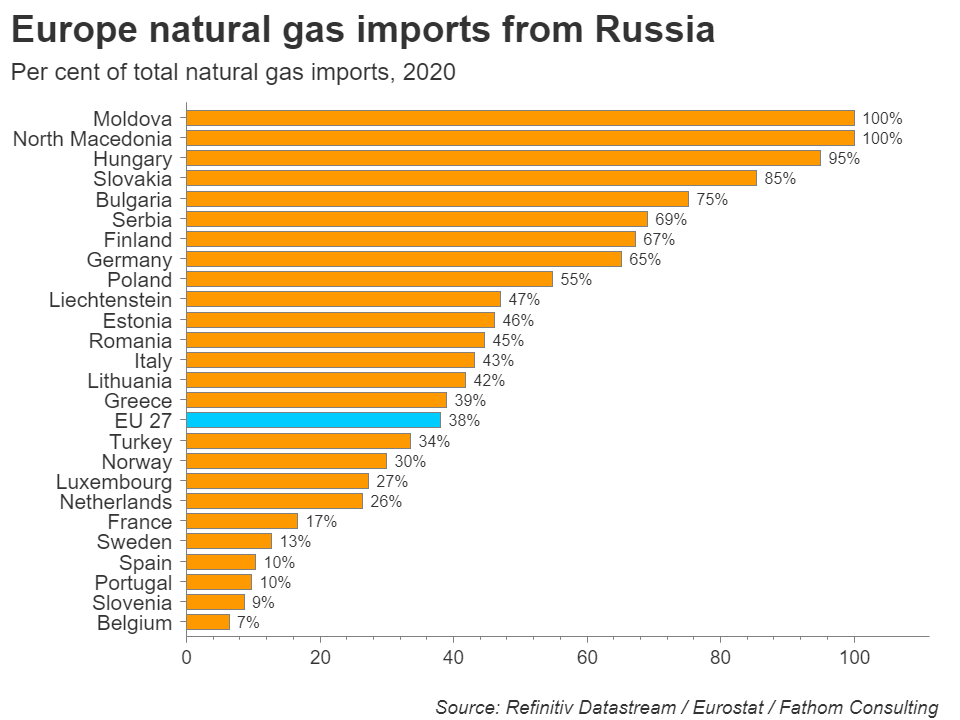
With the war unlikely to end anytime soon and the sanctions against Russia having failed to cripple its economy as intended, Moscow is in a position to maintain pressure on its European neighbors. So what does the EU plan to do about it?
Energy rationing is on the cards
The European Commission has announced a series of proposals to be discussed by member states at a summit on September 30. The EU wants to cap the revenue of non-gas electricity generators such as wind, solar and nuclear plants at 180 euros per megawatt. In addition, the Commission is proposing a windfall tax on fossil fuel producers. The proceeds in both cases would be redistributed to member states to be used as funds to support the most vulnerable households and businesses.
Moreover, the EU wants countries to reduce electricity consumption by at least 5% during peak hours and is also considering offering emergency credit lines to energy companies that are having liquidity problems.
However, plans for a price cap on Russian gas appear to have been shelved as there’s unlikely to be any agreement on it as some member states are worried this could prompt Moscow to completely cut off all gas flows to Europe.
Time is running out
With none of the above proposals involving a direct reduction in electricity bills and the decision on how the funds will be used to be up to individual member states, there are some doubts as to how effective these measures will be. This is assuming also that they don’t subsequently get watered down before they are finalized by EU leaders, who are not expected to approve the package before the European Council meeting on October 20-21.
Undoubtedly, investors are worried that time is running out for a meaningful response before the colder months set in.
Recession seems likely in Germany
Europe’s powerhouse – Germany – is already showing signs of strain. Its economy grew by just 0.1% in the second quarter and business sentiment has plunged since March. The uncertainty generated by the war in Ukraine, surging raw material and energy costs, rising interest rates, and now, a slowdown in its main trading partner China have dealt a huge blow to German exporters.
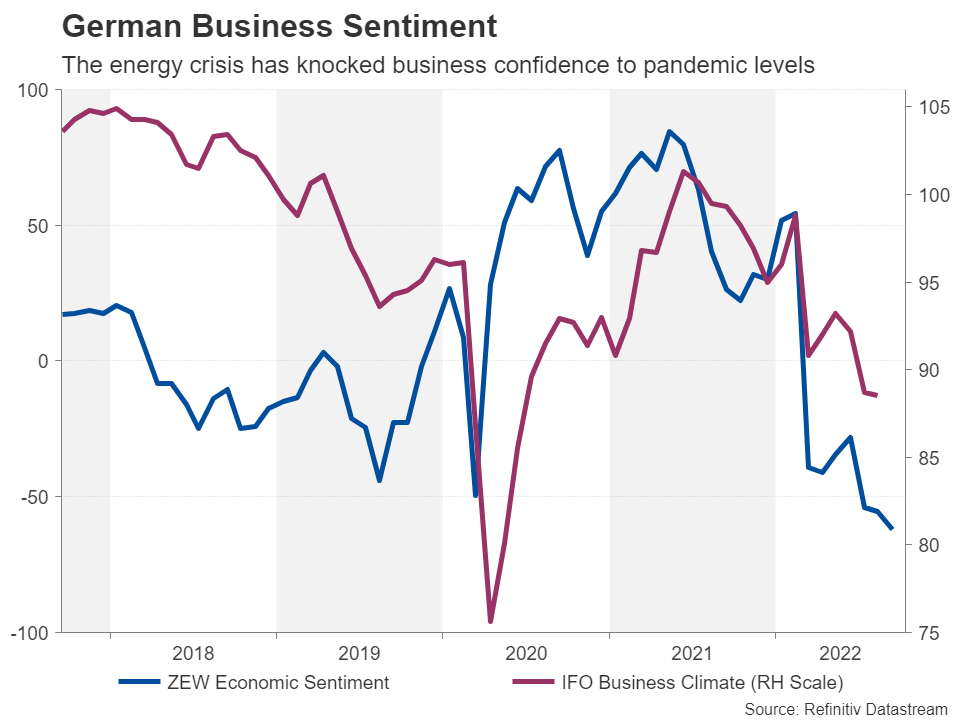
Against this backdrop, Germany is in bigger danger of a recession than other Eurozone countries and given that its economic outlook has a greater weighting in pricing risk and shaping sentiment towards the euro, it’s no wonder there is so much pessimism surrounding the currency.
Euro is staring down below parity
Making matters worse is fresh evidence that inflation in America is proving even stickier than anticipated, which can only translate to the Fed staying hawkish for longer. Unless the EU is able to put together an energy package that not only goes far enough in addressing the squeeze on customers from skyrocketing electricity bills but can also be enacted quickly and effectively, the euro will probably struggle to turn its fortunes around.
If the euro stays in its bearish trajectory, the next downward phase could see the peaks of 0.9595 from January 2001 and 0.9333 from September 2001 being revisited.
Can Europe avoid freezing this winter?
However, despite the odds now being stacked so decisively against the euro and even if the EU’s energy plan were to boost the Eurozone economy only marginally, the storm clouds may clear up a lot sooner than many are anticipating.
For one, gas storage facilities across Europe are currently filled at 84% capacity, which is above the average level of this time of the year. Although this may still not be sufficient for Europe to get through the winter if it’s a very cold one, it does provide hope that the situation might not turn out to be as dire as is being feared.
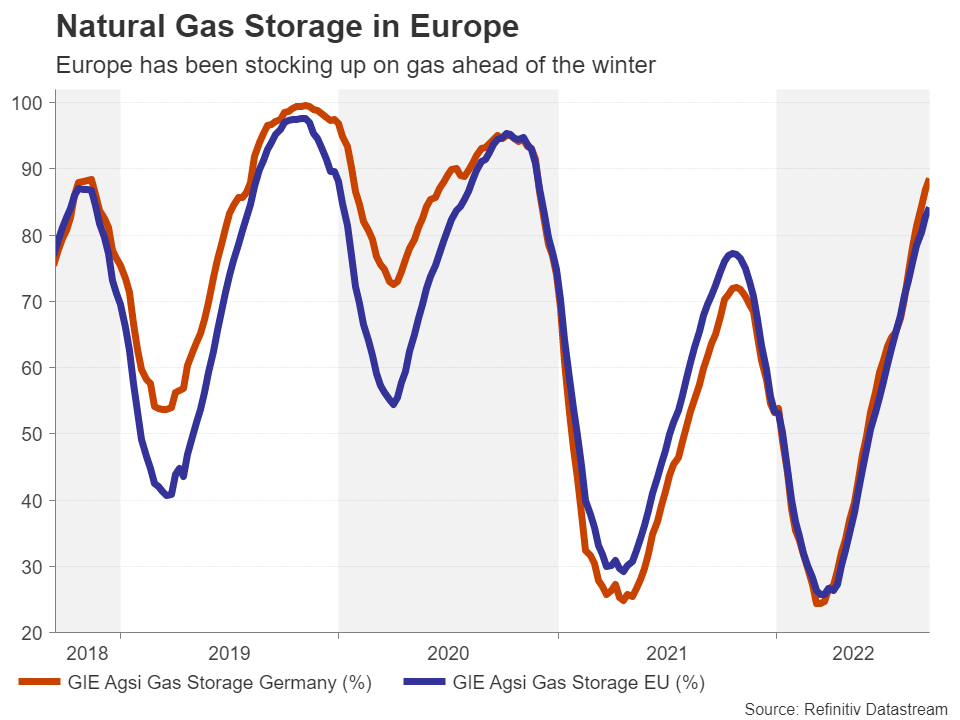
It’s also worth keeping in mind that part of the reason for such high natural gas prices at the moment is that all countries are rushing to secure supplies before winter arrives and once that wave passes and barring any further restrictions from Russia, there is potential for prices to tumble quite dramatically from current levels.
Energy crunch could last years
The euro’s other best hope of course is that inflation in the US does finally begin to drop more substantially in the next few months and the Fed’s tightening cycle comes to an earlier end. This could secure the euro a foothold above parity and in a more bullish outcome, help it stabilize in the historically popular region around $1.10.
But even if doomsday never comes and blackouts are avoided this winter, triggering some sort of a relief rally for the euro, the energy crunch will not necessarily be over. Europe could find itself in exactly the same predicament next winter if Russian supply is not restored. Much will depend on how quickly the EU is able to substitute gas with alternative sources of energy as well as beef up its infrastructure to increase storage capacity and handle more seaborne liquified natural gas.