Sample Category Title
New Zealand CPI jumped to 32-yr high at 7.3% yoy in Q2
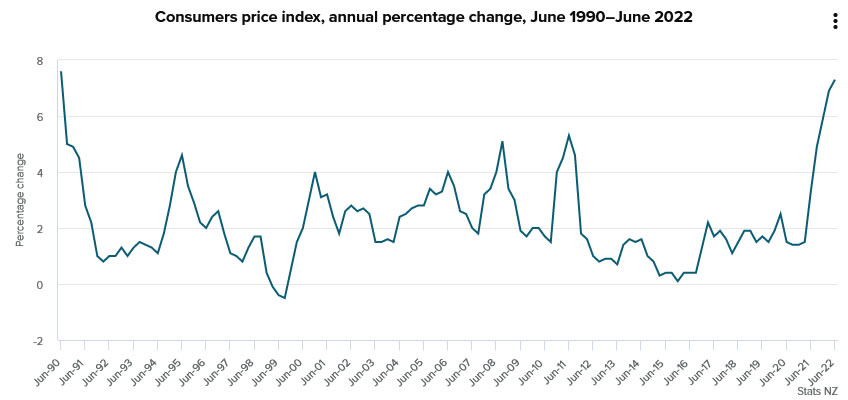
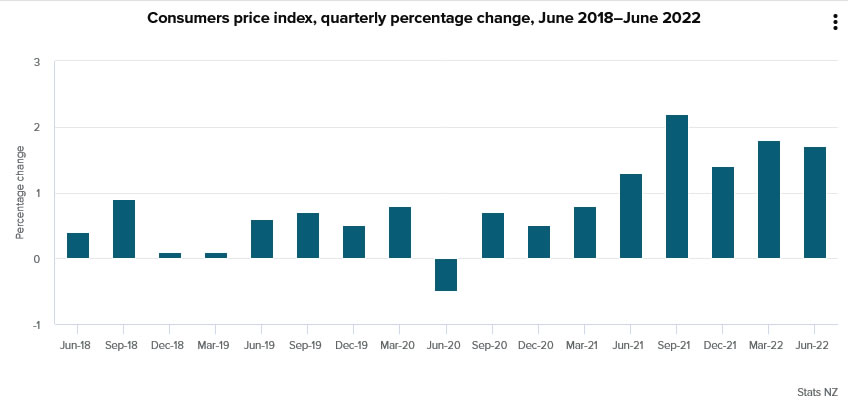
New Zealand CPI rose 1.7% qoq, 7.3% yoy in Q2, above expectation of 1.5% qoq, 7.1% yoy. The annual inflation accelerated from 6.9% yoy to 7.3%, a 32-year high, after 7.6% in Q2 1990.
StatsNZ said, "the main driver for the 7.3 percent annual inflation to the June 2022 quarter was the housing and household utilities group, due to rising prices for construction and rentals for housing... Transport was also a main driver of the quarterly rise, driven by petrol and diesel."
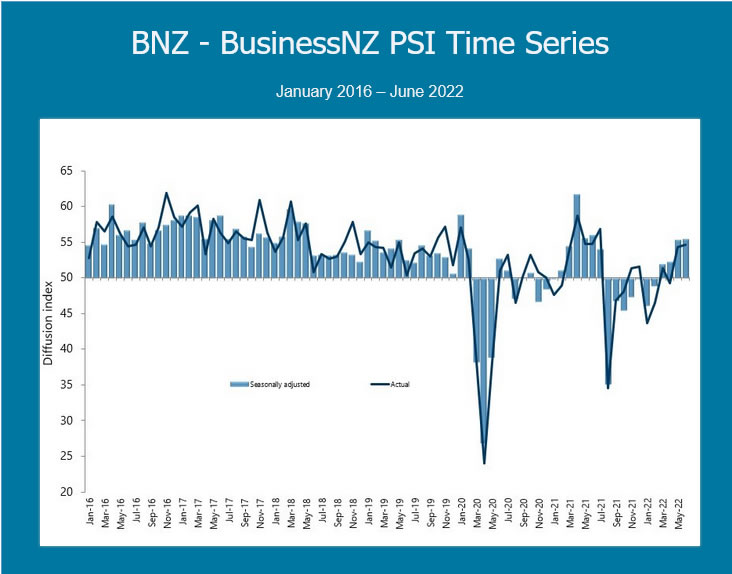
New Zealand BusinessNZ services rose slightly to 55.4, sustained improvement
New Zealand BusinessNZ Performance of Services Index ticked up from 55.3 to 55.4 in June, staying above long term average of 53.6 or the survey. Activity/sales dropped from 59.4 to 56.5. But employment improved notably from 49.0 to 53.1. New orders/business rose from 62.0 to 61.7. Stocks/inventories dropped from 54.7 to 54.1. Supplier deliveries rose from 45.6 to 47.8.
BNZ Senior Economist Craig Ebert said that "the move to traffic light Orange in mid-April, along with the expedited opening of the border, is clearly providing a basis for sustained improvement in New Zealand's services sector".
NZ First Impressions Consumers Price Index June Quarter 2022
Consumer prices rose 1.7% in the June quarter. That took the annual inflation rate to 7.3%, its highest level since 1990. Inflation pressures are widespread and likely to persist for some time yet. Today’s result reinforces our forecast for a series of further OCR hikes over the coming months.
Consumers Price Index, June quarter 2022
Quarterly change: +1.7% (prev: +1.8%)
- Westpac: +1.4%, RBNZ: +1.4%
- Median market f/c: +1.5%, range +1.3% to +1.7%
Annual change: +7.3% (prev: +6.9%)
- Westpac: +7.0%, RBNZ: +7.0%, Market f/c: +7.1%
There’s been no let-up in the intense price pressures that have been buffeting New Zealand households, with consumer prices rising at their fastest annual pace in 32 years.
Consumer prices rose 1.7% in the June quarter. Coming on the back of the strong price rises in previous quarters, that took the annual inflation rate to 7.3% (up from 6.9% in the March quarter). The last time annual inflation was this high was in 1990 following the hike in GST.
Today’s result was much stronger than our own and market forecast. As discussed below, today’s result was also stronger than the RBNZ’s forecast. Upside surprises to our own forecast were spread across domestic and imported categories, with a notable upside surprise in building costs.
Much of the strength in consumer prices has been due to large increases in the price of food, petrol and housing costs. However, the high level of inflation isn’t just due to a few specific items. Price pressures have been boiling over in every corner of the economy. That was reflected in the suite of core inflation measures released by Stats NZ today, which smooth through the quarter-to-quarter swings in prices and track the underlying trend in inflation. Most core inflation measures are now running above 6%.
Underlying that broad-based strength in inflation has been a cocktail of supply-side cost pressures and firm consumer demand. On the cost side of the ledger, continued disruptions to global and local supply chains have resulted in shortages of both production inputs and consumer goods. There has also been increasing upwards pressure on local wages.
But what’s really lit a fire under consumer prices has been the strength of domestic demand. Indeed, if we look at the areas where businesses are reporting significant shortages of supplies, they’re predominantly in areas where demand has been strong, like the construction sector. That is a big concern for the RBNZ, because if demand is running hot, inflation is likely to remain elevated even when the current pressure on operating costs (eventually) eases off. And a key factor underpinning the strength of household demand has been stimulus from low interest rates.
Looking across the broad product groups, imported prices (sometimes referred to as tradables) rose by 1.9% over the past three months, and are up 8.7% over the past year. While much of that was due to fuel costs, other tradable prices are up 5.4% over the past 12 months. Notably, the June quarter saw larger than expected increases in the prices of a range of durables and semi-durable retail items like furnishings which tend to be imported.
Domestic (or non-tradable) prices were up 1.4% in the June quarter and have risen by 6.3% over the past year. That is the fastest annual pace of non-tradables inflation since records began in 2000. The RBNZ pays particular attention to non-tradables inflation, and it is currently running at around twice the pace we’ve seen over the past two decades.
With widespread pressure on operating costs, we expect that inflation will remain elevated over the remainder of this year. In fact, we aren’t forecasting a return back within the RBNZ’s target band until the middle of next year at the earliest. That signals an ongoing squeeze on households’ purchasing power.
What does today’s result mean for the RBNZ?
Today’s result was stronger than the RBNZ’s latest published forecast for a 1.4% rise. However, since that number was published, the RBNZ had noted the upside risk for prices.
Last week, when delivering its third consecutive 50bp hike, the RBNZ reaffirmed that they are planning to continue raising the cash rate to a level where they are confident that inflation will settle within the 1% to 3% target range. And with price pressures continuing to sizzle, there was nothing in today’s report to dissuade them from that course.
Given the continuing and widespread strength in inflation pressures, we’re forecasting the RBNZ will deliver a fourth 50bp hike at the time of the August policy review. We expect that to be followed by 25bp hikes in both October and November, taking the OCR to a level of 3.50% by year’s end.
Details
While strength in price pressures has been widespread, the June quarter saw particularly large price increases in a number of areas.
The biggest contributor to the strong June quarter inflation result was a further large increase in building costs. The cost of purchasing a newly built home rose by 4.5% in the June quarter. That followed similarly large increases in recent months, with construction costs up a massive 18% over the past year. Building activity has been charging higher over the past year. At the same time, acute shortages of materials and staff have seen input costs climbing rapidly.
Adding to the pressure on housing costs, rents have been rising rapidly, with an increase of 1.2% in the June quarter. The annual increase in rents of 4.3% was the largest increase since records began.
The past three months also saw a chunky 1.3% increase in food prices. That includes sizeable increases in the prices for groceries and fresh vegetables.
Fuel prices have also risen strongly, increasing by 6.2% over the past three months. Despite the 25 cent reduction in the petrol excise tax, prices across the country hit record levels in recent months. That’s flowed through to consumers wallets, and the related increases in transport and production costs have added to the prices for all manner of goods and services.
Providing some offset to the above price increases were the reduction in road user charges and the halving of public transport fares that the Government introduced earlier this year.
Forex and Cryptocurrencies Forecast
EUR/USD: Parity 1:1 Achieved
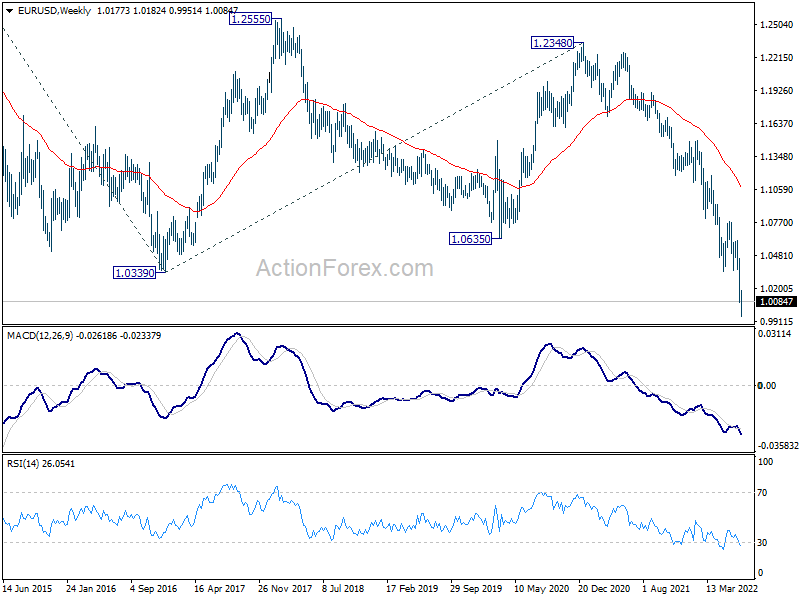
What we've been talking about over the last few months has come true: the EUR/USD hit 1.0000 on Tuesday, July 12. The local bottom was fixed on Thursday July 14 at 0.9951. The last time the pair was so low was in December 2002. Note that the dollar strengthened not only against the euro, but also against other leading world currencies. The DXY index is also in the zone of 20-year highs, having approached the height of 108.99 on July 14.
The greenback's rally was spurred on by recent US inflation data. The consumer price index (CPI) reached 9.1% in June, exceeding the forecast of 8.8%. Note that this was observed only 12 times in 110 years, and the last time inflation rose above 9% was in 1981. This record (rather an anti-record) strengthened market expectations regarding the pace of tightening monetary policy (QT) by the US Central Bank. If earlier it was assumed that the rate would be increased by 50-75 basis points at the next meeting of the FOMC (Federal Open Market Committee) on July 27, there is talk now that federal funds costs may increase immediately by 100 bp. The probability of such a move is estimated by analysts at 82%, and the probability that the rate will be raised by a total of 175 basis points at the two upcoming meetings is 75%, according to CME Group FedWatch.
Atlanta Federal Reserve Bank (FRB) President Rafael Bostic dismissed the possibility, adding that inflation could rise even further by the end of the year, requiring the Fed to act even more decisively. According to experts, the desire of the US Central Bank to stop inflation at any cost may lead to the fact that the rate will eventually reach 4.00% (it is 1.75% at the moment). And this will be done even though the country's economy may fall into the deepest recession.
What is good for the dollar is bad for the stock market. Flight from risky assets intensified amid market fears about a prolonged economic downturn. S&P500, Dow Jones and Nasdaq fell down, while DXY flew up. Data on retail sales in the US, which were released on Friday evening, July 15, slowed down the flight. With a previous reading of -0.1% and a forecast of 0.8%, this figure reached 1.0% in June, which pushed the EUR/USD pair up and finished at 1.0082.
It should be noted that the tightening of the Fed's monetary policy creates problems not only for the US economy, but also for the entire global economy. The share of the US dollar in international reserves was 59% at the end of 2020, and the share in international settlements as of February 2022 reached 39%. Thus, the dollar is both the main reserve currency and the main means of payment in the world. With its strengthening, the burden increases primarily on emerging market economies that have received large loans from the IMF. Debt service difficulties have already led to a default in Sri Lanka, problems await El Salvador, Tunisia, Egypt, Pakistan, and Ghana.
The popularity of the dollar as a defensive asset will continue to grow with the approach of a recession and thanks to the policy of the US Federal Reserve. At the time of writing the review, on the evening of July 15, this forecast is supported by 60% of experts. Further correction to the north is expected by 30%, and 10% of analysts have given a neutral forecast. The oscillator readings on D1 give a completely unambiguous signal: all 100% are colored red. There are 85% of those among the trend indicators, the remaining 15% have taken the opposite position.
The closest strong support for the EUR/USD pair is the 1.0040-1.0050 zone, followed by the 1.0000 level. After it is broken, the bears will target the July 14 low at 0.9950, even lower is the strong 2002 support/resistance zone. 0.9900-0.9930. The nearest serious target of the bulls is a return to the zone 1.0350-1.0450, then there are zones 1.0450-1.0600 and 1.0625-1.0770. There are several levels on the way to 1.0350, which the pair broke very easily during the fall, so it is still difficult to determine which of them can become a serious obstacle when moving up.
The highlight of the coming week will undoubtedly be the ECB meeting on Thursday July 21. It is expected that the regulator will raise the interest rate from 0.0% to 0.25%. Such a move could support the euro a little, although it looks rather timid against the backdrop of the Fed's hawkish policy. Of undoubted interest are the subsequent press conference and comments of the ECB management, which should give the market an idea about the future plans of this regulator.
Other events include the publication on Tuesday, July 19 of the Consumer Price Index (CPI) and the report on bank lending in the Eurozone. Data on the labor market and manufacturing activity in the US will be released on Thursday, July 21, and the value of the PMI (Purchasing Managers Index) in the manufacturing sector in Germany will become known the next day. In addition, we advise you to pay attention to the decision of the People's Bank of China on the interest rate on July 20. This decision is especially interesting, since China's GDP in the Q2 2022. decreased by 2.6% against the forecast of a decrease by 1.5%, which indicates the approach of the country's economy to a recession.
GBP/USD: The Battle for 1.2000 Is Lost, But It's Not Over Yet
The GBP/USD pair, unlike the EUR/USD, has not yet broken a multi-year record, but is already close to it. The local bottom was fixed at 1.1759 last week, and the last chord of the five-day period was set at 1.1865. Below are two serious targets: 1.1409, the collapse point caused by the start of the COVID-19 pandemic in March 2020, and the December 1984 low of 1.0757. We think it's too early to talk about the parity of the pound with the dollar 1:1.
The macro data released on Wednesday July 13 turned out to be unexpectedly green. Thus, the UK GDP (yoy) with a forecast of 2.7% in reality amounted to 3.5%, while the June GDP, with the previous value of -0.2% and the forecast of 0.1%, rose to 0.5%. Despite this positive, the factors of pressure on the country's economy have not gone away. Among them are problems related to Brexit and the customs conflict between Britain and Northern Ireland. Inflation remains the highest in 40 years, and it is possible that it could exceed 11% by November, pushing the economy into a deep recession. We must add the government crisis that caused the resignation of Prime Minister Boris Johnson to all this, as well as the difficulties associated with sanctions against Russia due to its armed invasion of Ukraine.
Despite statements from BoE officials that they are ready to accept a faster pace of monetary tightening, in reality the regulator is acting more cautiously than the market expected. The current interest rate is 1.25%, which is lower than the corresponding Fed rate (1.75%), and the next BOE meeting will take place only on August 04, 2022. And this cannot but exert downward pressure on the GBP/USD pair.
At the moment, 50% of experts believe that the British currency will continue to lose ground, 25% on the contrary expect a rebound upwards, and 25% have taken a neutral position. The readings of the indicators on D1 are as follows. Among the trend indicators on D1, the power ratio is 100:0% in favor of the reds. Among the oscillators, the advantage of the bears is slightly less: 90% indicate a fall, the remaining 10% have turned their eyes to the north.
The nearest support is at 1.1800, followed by the July 14 low of 1.1759. Further, 1.1650, 1.1535 and March 2020 lows in the 1.1400-1.1450 zone. The immediate task of the bulls is to rise to the 1.1875-1.1915 zone, and then a new stage of the battle for 1.2000, which they ingloriously lost last week. In case of victory, the pair will meet resistance in the zones and at the levels of 1.2100, 1.2160-1.2175, 1.2200-1.2235, 1.2300-1.2325 and 1.2400-1.2430.
As for the macroeconomic calendar for the United Kingdom, we advise you to pay attention to Tuesday July 19, when data from the UK labor market arrives. The speech of the head of the Bank of England Andrew Bailey is scheduled on the same day. The value of the Consumer Price Index (CPI) will become known on Wednesday, July 20, and a whole package of data regarding the state of the British economy will be received on Friday. It will include retail sales data for June, as well as data on business activity (PMI) both in individual sectors and in the country as a whole.
USD/JPY: The Storm After the Calm
We called the previous review "The Calm Before the Storm" as USD/JPY did not renew its 24-year high for the first time in five weeks and took a breather. But since a storm was promised, it must break out. A new high at 139.38 was recorded on July 14, and the pair met the end of the trading session at 138.50.
The reason for the new weakening of the yen is the same: the difference between the hawkish monetary policy of the US Federal Reserve and the ultra-dove one of the Bank of Japan (BOJ). By the way, the next meeting of the Japanese Central Bank is to be held next week, on Thursday, July 21, at which it is likely to once again leave the interest rate unchanged at the negative level of -0.1%.
If we usually talk about the fight between bulls and bears, then regarding the future of the yen, the fight is between… analysts and BOJ. The former, for the most part, are waiting for the Central Bank to finally change its policy, and therefore stubbornly vote for the strengthening of the yen. The latter, no less stubbornly, leaves this policy unchanged, and the USD/JPY pair stubbornly moves up.
This time, only 40% of experts speak about the pair's movement to the height of 142.00. The remaining 60% hope for a downward trend reversal. There are no such disagreements in the readings of indicators on D1: all 100% of trend indicators and oscillators are looking north, although 20% of the latter are in the overbought zone. Supports are located at the levels and in the zones 137.65, 137.00, 136.60 135.50-135.70, 134.00, 133.50 and 133.00. The bulls' targets are 140.00 and 142.00. And if the pair's growth rates remain the same as in recent months, it will be able to reach the 150.00 zone in late August - early September
Apart from the meeting of the Japanese Central Bank and the subsequent press conference of its management, there are no other significant events expected in Japan this week.
CRYPTOCURRENCIES: The Beginning of the End of the Bear Phase
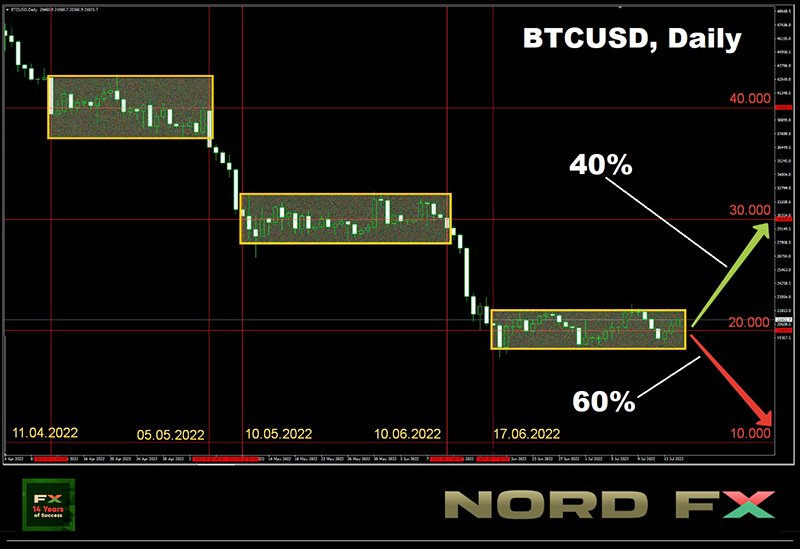
The previous review drew attention to an anomaly when both the dollar and the US stock indices - S&P500, Dow Jones and Nasdaq were growing at the same time. Things fell into place last week: the US currency continued to grow, and the indices fell down. It should be noted to bitcoin's credit that, despite another wave of investor flight from risks, it managed to stay in the $20,000 zone. Now, how long will it last?
CEO of Rockefeller International, who previously held the post of chief strategist at Morgan Stanley, Ruchir Sharma, recalled that a bearish trend usually lasts about a year in the stock market, and stock exchanges indices are falling by 35%. At the moment, the market has decreased by only 20%. So we can expect a further drop in demand for risky assets including bitcoin in the next six months.
"I would not say that we are already at the bottom," Sharma said, adding that bitcoin will return to growth and reach new highs after the end of the bear cycle. The financier recalled the situation with Amazon in the early 2000s, during the dot-com bubble, when the retailer's share price collapsed by 90%. However, stocks then bounced back, and rose another 300 times over the next 20 years.
If you look at the BTC/USD chart, it's easy to see that the flagship currency has been clinging to round levels lately. So, bulls and bears fought for $40,000 from April 11 to May 5. The front line was at $30,000 from May 10 to June 10. The battle has been taking place in the $20,000 zone since mid-June. At the moment, 60% of investors surveyed by Bloomberg consider another decline in the price of bitcoin more likely, this time to $10,000. The remaining 40% are waiting for a recovery to $30,000. The study involved 950 respondents. Compared to institutions, there were more skeptics among retail investors. Almost every fourth called the first cryptocurrency "garbage" (18% of professional market participants).
Galaxy Digital CEO Mike Novogratz said in an interview with CNBC that he does not believe in the possibility of reducing the price of the first cryptocurrency to $13,000. "There is a feeling that we are 90% over this deleveraging. […] The problem is that further growth requires more faith and new capital," he said. According to Novogratz, the sideways trend of digital assets will last until the US Federal Reserve stops raising the base rate, which will take about 18 months.
Macroeconomics expert Lyn Alden made a similar point. She believes that although there are no clear bullish signals in the crypto market, the time for global capitulation has already passed. In her opinion, the worst part of the bearish trend ended along with the unstable first half of 2022. The macro strategist believes that bitcoin can recover as the massive BTC sell-off has stopped.
However, Alden warns that bitcoin could still go down one step. "Macroeconomically, there are still not many bullish catalysts at the moment, and I would not rule out further price movement down." "We have seen that, for the most part, bitcoin is very strongly correlated with the growth of the money supply, especially in dollars. So, when we have had a huge increase in the money supply around the world over the past couple of years, bitcoin has also done very well," explained Alden. 1Now the reverse is happening as the US Federal Reserve and other central banks try to tamp down inflation. This, accordingly, affects the price of the cryptocurrency. In other words, now that the flow of cheap liquidity has dried up and interest rates are rising, investors prefer not to get involved in risky assets.
Some experts prefer to call what is happening in the crypto market not a collapse, but simply another deep correction. In addition, referring to historical data, they declare entering the final phase of a bear market. So, at the end of 2018, the total drop was 84% from the previous historical maximum. The BTC/USD pair has currently fallen from the November 11, 2021 high by only 71%. Thus, if we follow this model, we can expect the completion of the correction in the region of $10,000-11,000, and the subsequent consolidation may last about a year or more.
According to Glassnode, market shrinkage has virtually eliminated the rest of the "market tourists" from the game, leaving only hodlers "at the front". On average, unrealized losses of each of them are now 33%. This is not the worst indicator in history, which also suggests that the final bearish phase has just begun.
The start of the final phase is also signaled by the capitulation of the miners, which has a high correlation with the bottoming of bitcoin. Most of the public mining companies used to expand their production with loans. Now their earnings have dropped to 50%, forcing them to sell off their coin holdings to cover operating and borrowing costs. Glassnode estimates that miner inventories are now around 70,000 BTC worth about $1.3 billion. And in the event of a prolonged consolidation, they will also be forced to put them on sale, which will put additional pressure on the market.
Please note that in this case, we are talking only about the beginning, and not about the end of the final phase of the bearish trend. Thus, the surrender of miners in 2018-19 lasted four months, while the current cycle lasts a little more than a month.
As for Ethereum, the dynamics of the ETH/USD pair quotes almost repeats the dynamics of BTC/USD. Some experts do not exclude its temporary rise to $1,280, however, they believe that this will be another trap for the bulls. And the pair will return to the $1,000 zone after its triggering. The next target of the bears is $500.
Returning to the Bloomberg survey, most of the 950 investors surveyed expressed confidence in the strong position of bitcoin and ethereum over the next five years. In their opinion, developments in the crypto market will prompt regulators to tighten supervision over the industry. This can increase trust and lead to further popularization of digital assets. Ruchir Sharma of Rockefeller International also believes that top cryptocurrencies will become much more stable within three to five years, which will allow them to seriously push the US dollar.
As of this writing (Friday evening, July 15), bitcoin is trading in the $20,900 zone. The total capitalization of the crypto market is $0.945 trillion ($0.966 trillion a week ago). The Crypto Fear & Greed Index has dropped 5 points over the week from 20 to 15 points and is still in the Extreme Fear zone.
EUR/USD Weekly Outlook
EUR/USD dropped to as low as 0.9951 last week as downtrend continued. As a temporary low was formed, ahead of 100% projection of 1.1184 to 1.0348 from 1.0773 at 0.9937, initial bias is neutral this week first. On the upside, break of 1.0121 will turn bias back to the upside for stronger rebound to 1.0348 support turned resistance. Nevertheless, sustained break 0.9937 will extend larger down trend to 161.8% projection at 0.9420.
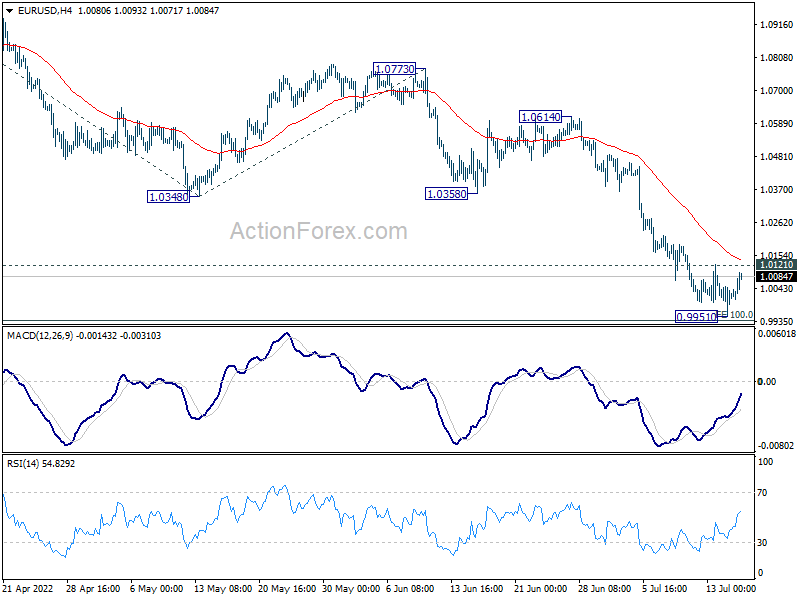
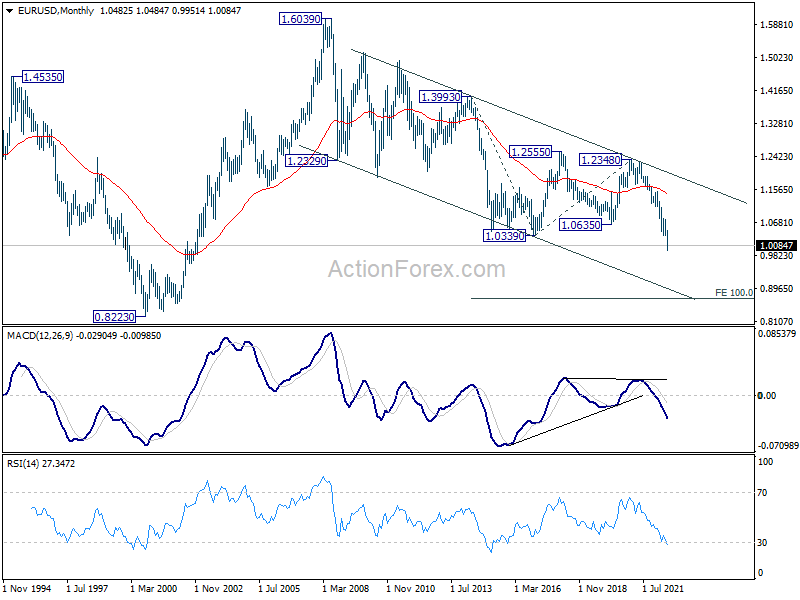
In the bigger picture, down trend from 1.6039 (2008 high) is still in progress. Next target is 100% projection of 1.3993 to 1.0339 from 1.2348 at 0.8694. In any case, outlook will stay bearish as long as 1.0773 resistance holds, in case of rebound.
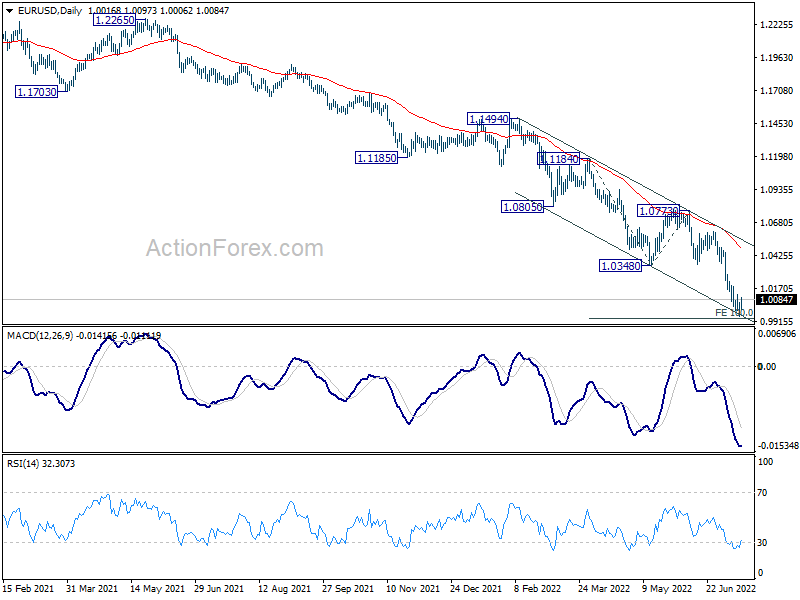
In the long term picture, long term down trend from 1.6039 (2008 high) resuming. Sustained break of 61.8% projection of 1.3993 to 1.0339 from 1.2348 at 1.0090 will pave the way to 100% projection at 0.8694.
USD/JPY Weekly Outlook
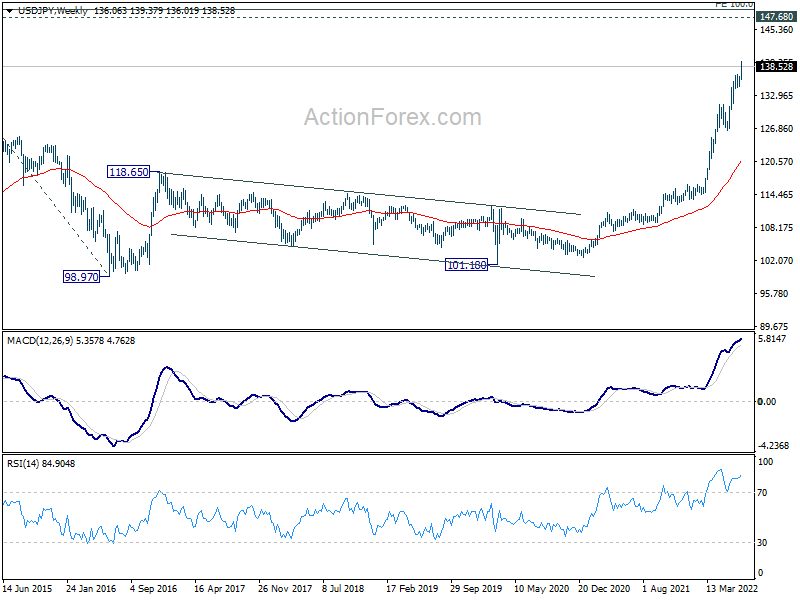
USD/JPY's up trend resumed last week and hit as high as 139.37. With a temporary top in place, initial bias is turned neutral this week for consolidations. But downside of retreat should be contained by 134.73 support. On the upside, break of 139.37 will resume larger up trend to 100% projection of 114.40 to 131.34 from 126.35 at 143.29.
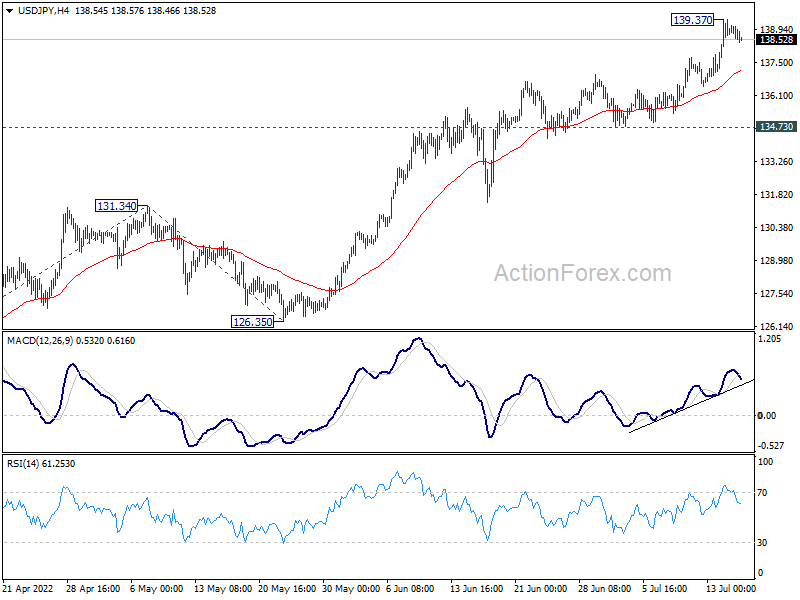
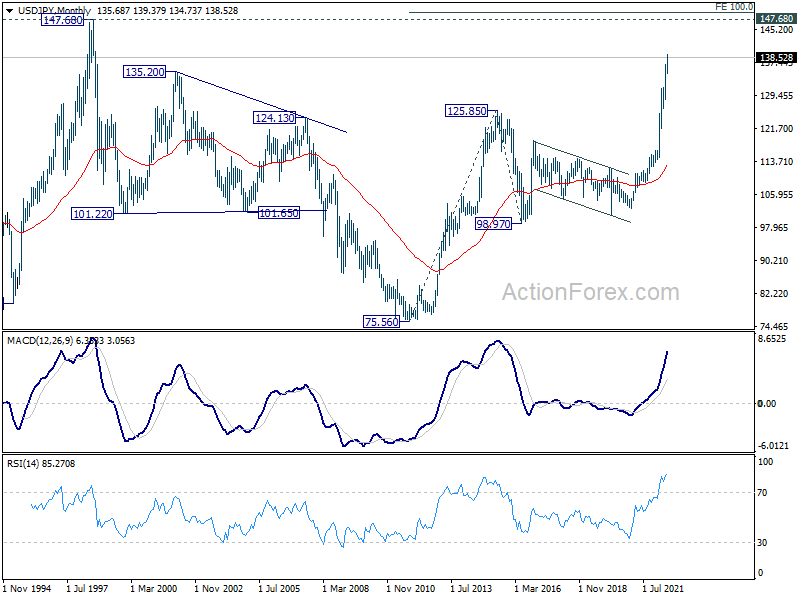
In the bigger picture, current rally is seen as part of the long term up trend from 75.56 (2011 low). Next target is 100% projection of 75.56 (2011 low) to 125.85 (2015 high) from 98.97 at 149.26, which is close to 147.68 (1998 high). This will remain the favored case as long as 126.35 support holds.
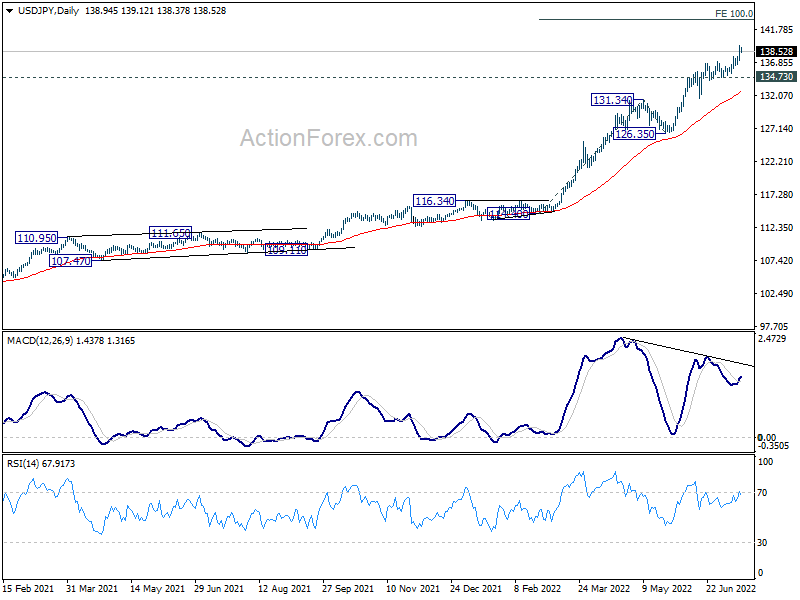
In the long term picture, the up trend from 75.56 (2011 low) long term bottom to 125.85 (2015 high) has just resumed. Next target is 100% projection of 75.56 (2011 low) to 125.85 (2015 high) from 98.97 at 149.26, which is close to 147.68 (1998 high).
GBP/USD Weekly Outlook
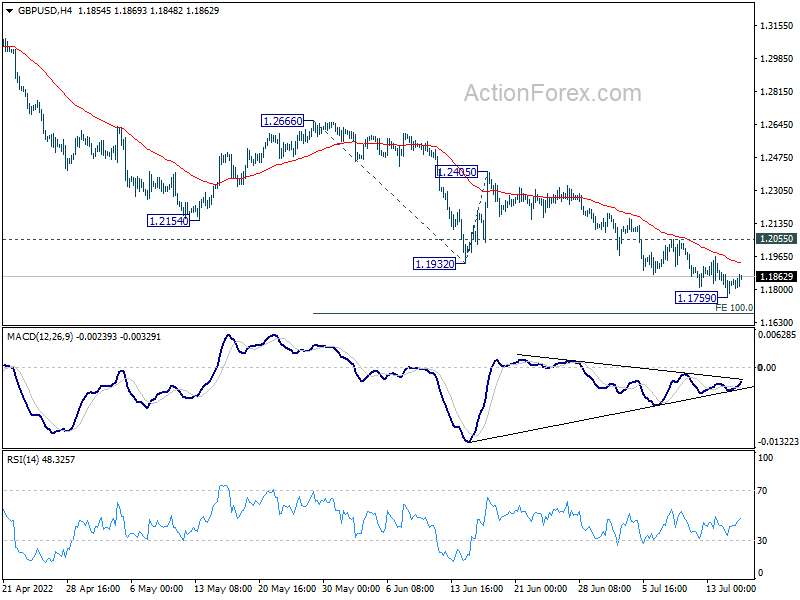
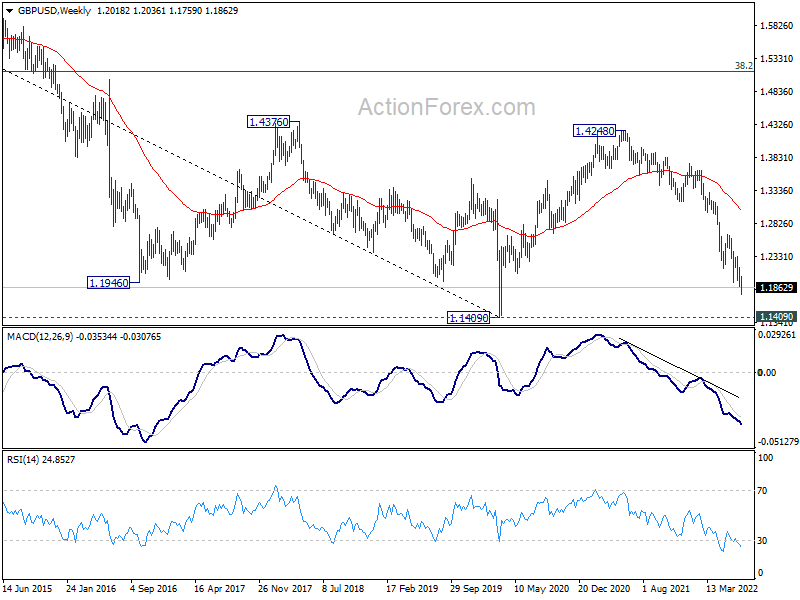
GBP/USD edged lower to 1.1759 last week but recovered again. Initial bias is neutral this week first and further fall is expected with 1.2055 minor resistance intact. Below 1.1759 will resume recent down trend to 100% projection of 1.2666 to 1.1932 from 1.2405 at 1.1671. Break there will target 1.1409 long term support. Nevertheless, break of 1.2055 will turn bias to the upside for stronger rebound.
In the bigger picture, fall from 1.4248 (2018 high) could be a leg inside the pattern from 1.1409 (2020 low), or resuming the longer term down trend. Deeper decline is expected as long as 1.2666 resistance holds. Next target is 1.1409 low. However, firm break of 1.2666 will bring stronger rise back to 55 week EMA (now at 1.3065).
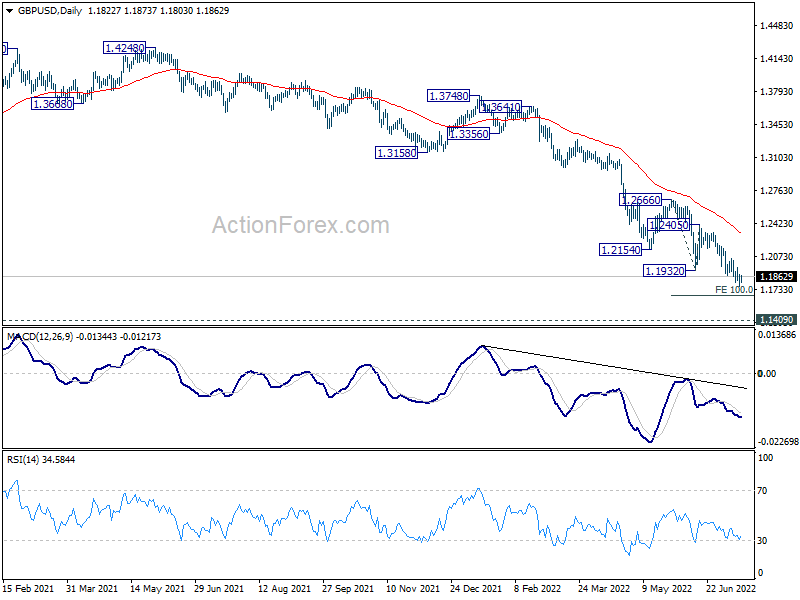
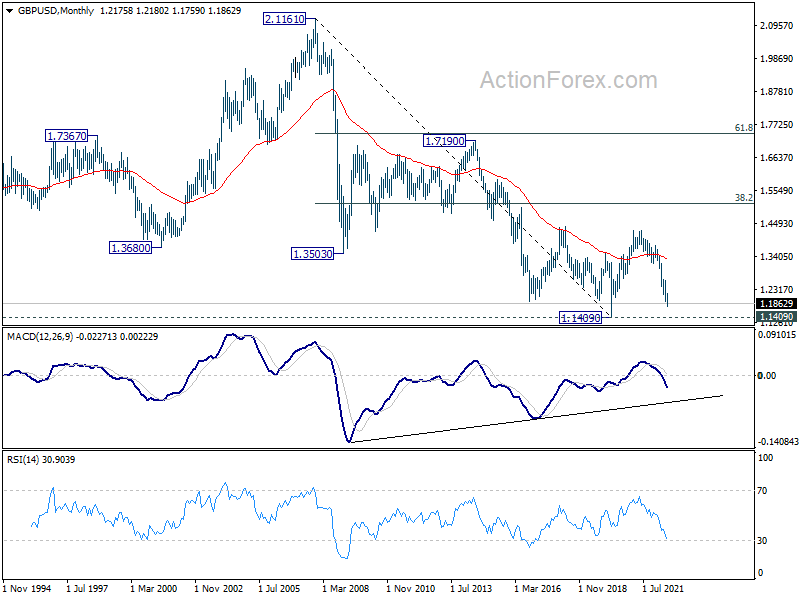
In the longer term picture, rebound from 1.1409 long term bottom should have completed at 1.4248 already, well ahead of 38.2% retracement of 2.1161 to 1.1409 at 1.5134. The development argues that price actions from 1.1409 are developing into a corrective pattern only. That is, long term bearishness is retained for resuming the down trend from 2.1161 (2007 high) at a later stage.
USD/CHF Weekly Outlook
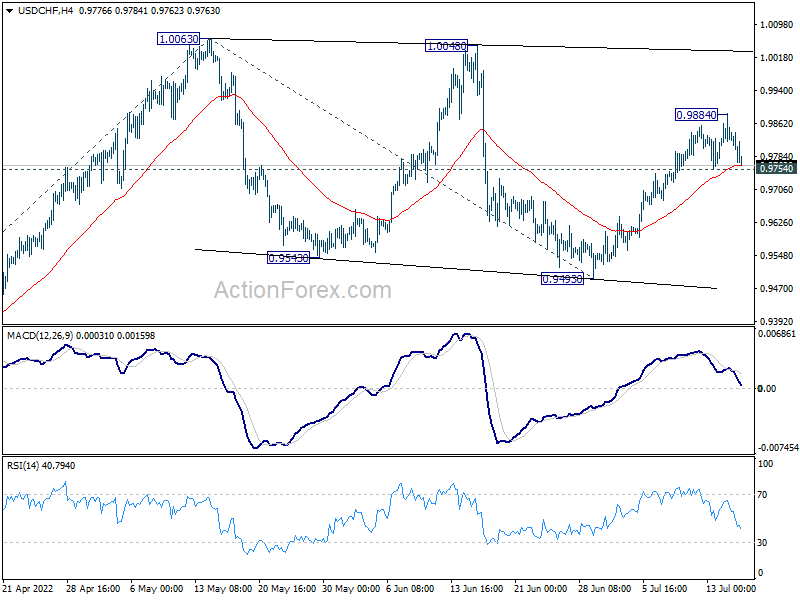
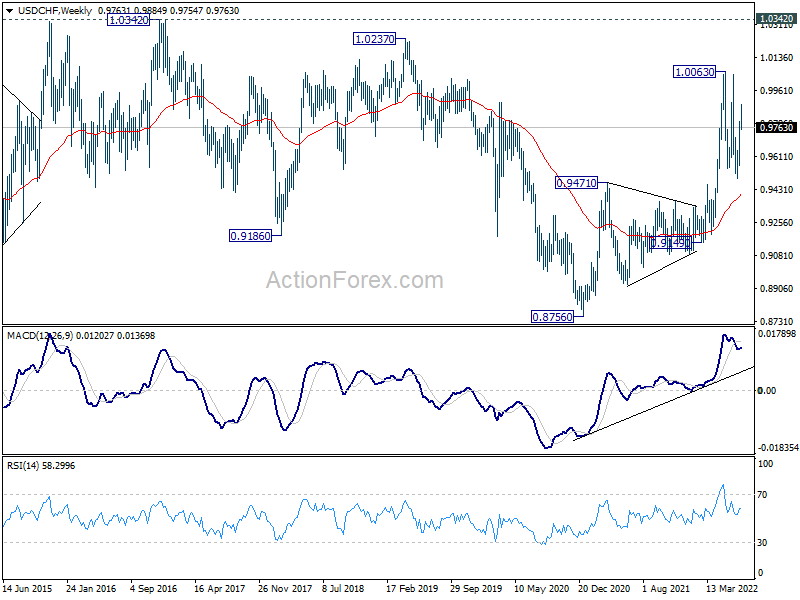
USD/CHF edged higher to 0.9884 last week but retreated again. Initial bias is neutral this week first. On the downside, break of 0.9754 minor support will argue that corrective pattern from 1.0063 is extending with another falling leg. Intraday bias will be on the downside for 0.9493 support. On the upside, break of 0.9884 will resume the rise from 0.9493 to retest 1.0063 high.
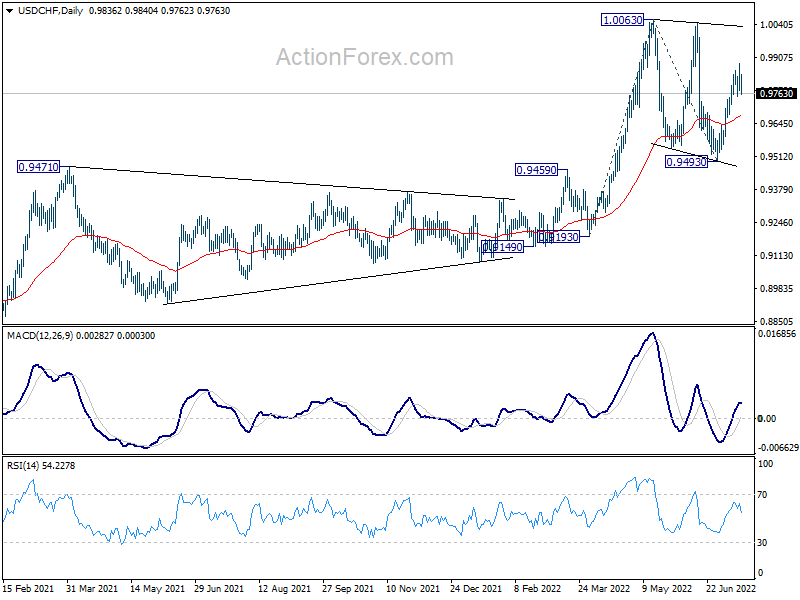
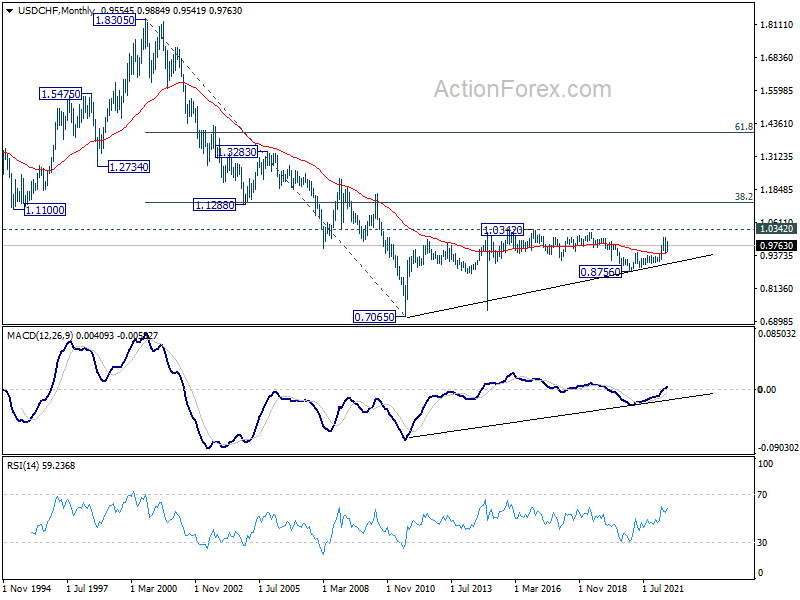
In the bigger picture, medium term up trend from 0.8756 (2021 low) is still in progress. Next target is 1.0342 (2016 high). Sustained break there will resume long term up trend from 0.7065 (2011 low). This will remain the favored case as long as 0.9471 resistance turned support holds.
In the long term picture, current development argues that the correction from 1.0342 (2016 high) has completed at 0.8756 (2020 low) already. Rise from 0.7065 (2011 low) might be ready to resume. Firm break of 1.0342 will confirm and target 38.2% retracement of 1.8305 (2000 high) to 0.7065 at 1.1359.
AUD/USD Weekly Outlook
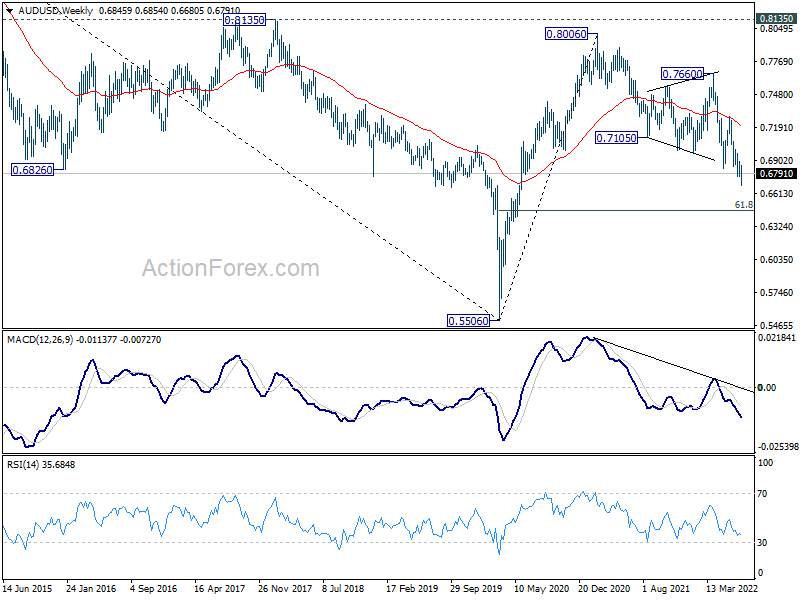
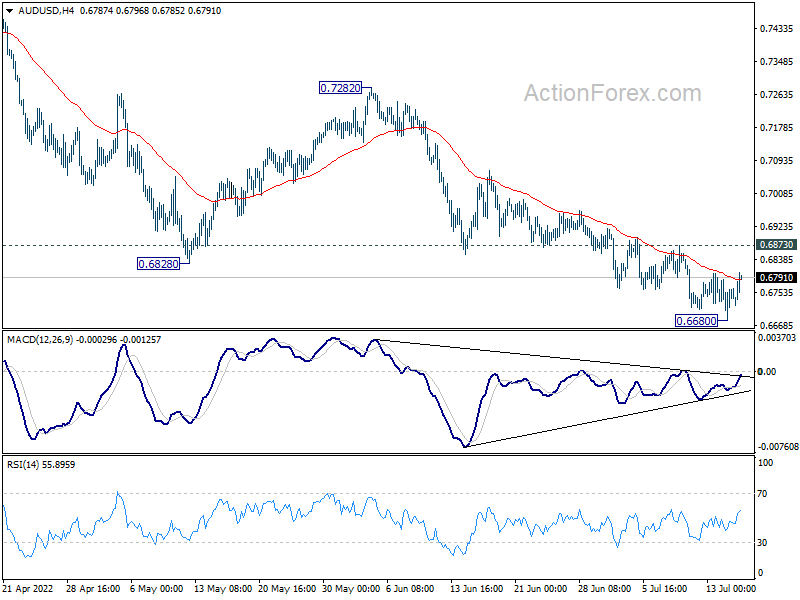
AUD/USD edged lower to 0.6680 last week but recovered since then. Initial bias is neutral this week first. Further decline is expected in AUD/USD with 0.6873 resistance intact. Break of 0.6680 will target next fibonacci level at 0.6461. On the upside, break of 0.6873 minor resistance will turn bias back to the upside for stronger rebound instead.
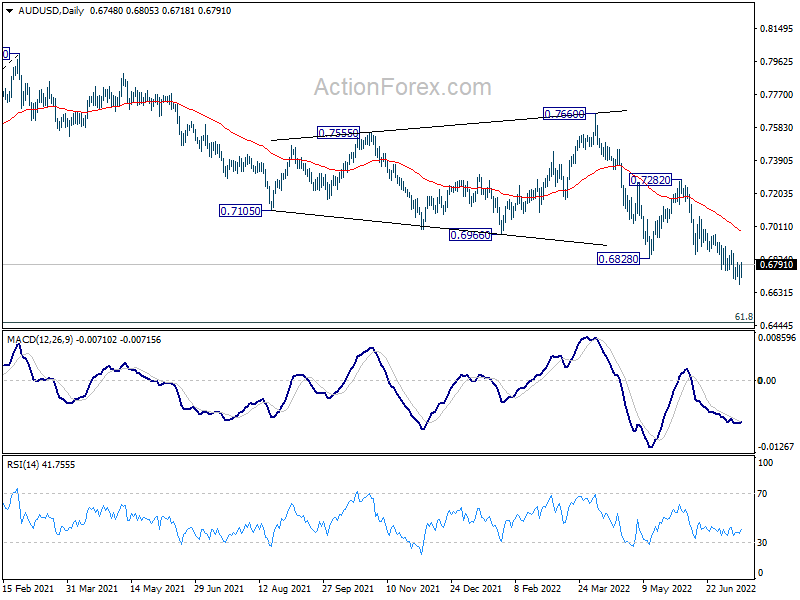
In the bigger picture, price actions from 0.8006 could still be a corrective pattern to rise from 0.5506 (2020 low). But current downside acceleration is raising the chance that it's a bearish impulsive move. In either case, outlook will remain bearish as long as 0.7282 resistance holds. Next target is 61.8% retracement of 0.5506 to 0.8006 at 0.6461.
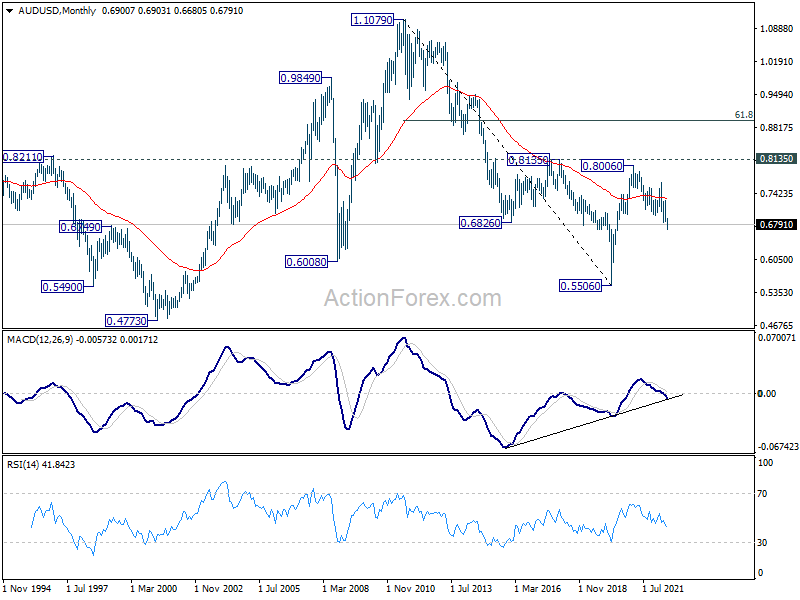
In the long term picture, rejection by 0.8135 resistance suggests that the long term down trend from 1.1079 (2011 high) is not ready to reverse. Yet, the structure of the fall from 0.8006 still argues that it's a corrective move. Hence, break of 0.5506 low is not envisaged for now. The long term outlook stays neutral first, and will be reassessed later after the fall from 0.8006 completes.