Sample Category Title
USD/CAD Weekly Outlook
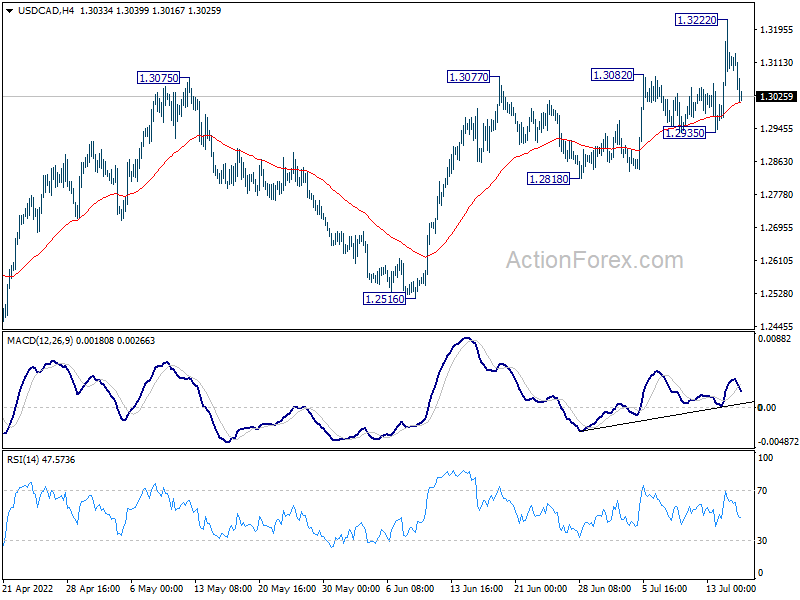
USD/CAD's up trend resumed last week and rose to as high as 1.3222. But it then retreated sharply since then. Initial bias is neutral this week first. Further rise will remains in favor as long as 1.2935 support holds. Break of 1.3222 will target 100% projection of 1.2005 to 1.2947 from 1.2401 at 1.3343. However, firm break of 1.2935 will dampen this bullish case and turn bias to the downside for 1.2818 support.
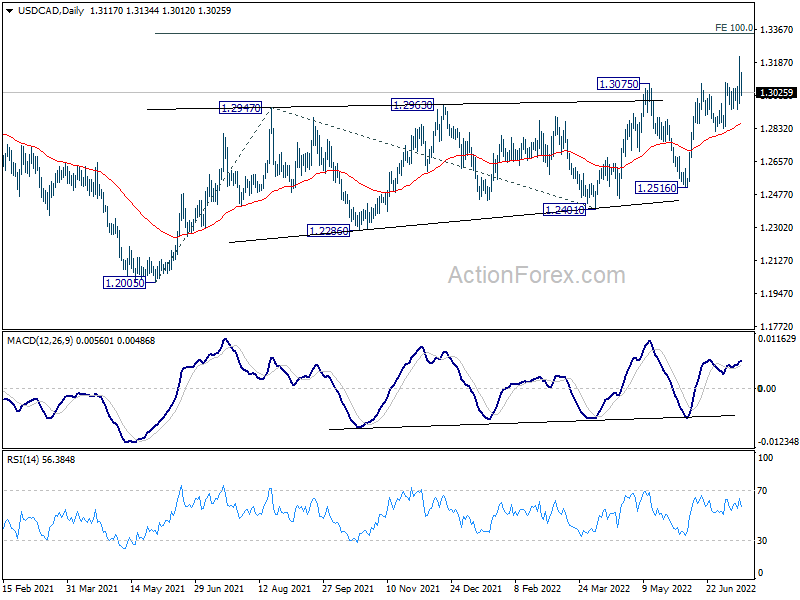
In the bigger picture, down trend from 1.4667 (2020 high) should have completed at 1.2005, after defending 1.2061 long term cluster support. Rise from there should target 61.8% retracement of 1.4667 to 1.2005 (2021 low) at 1.3650. This will remain the favored case now as long as 1.2516 support holds.
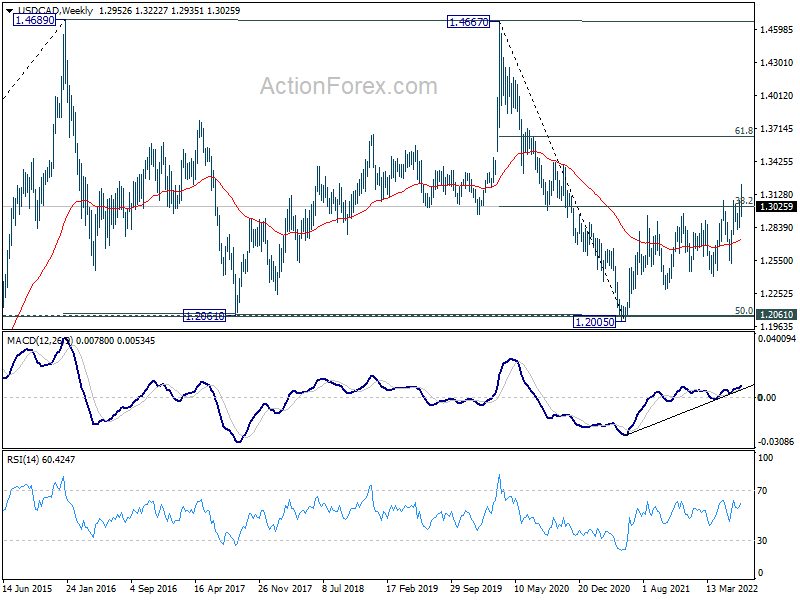
In the longer term picture, price actions from 1.4689 (2016 high) are seen as a consolidation pattern only. That is, up trend from 0.9506 (2007 low) is still expected to resume at a later stage. This will remain the favored case as long as 1.2061 support holds, which is close to 50% retracement of 0.9406 to 1.4689 at 1.2048. However, firm break of 1.2061 support will argue that USD/CAD has already started a long term down trend. Next target is 61.8% retracement of 0.9406 to 1.4689 at 1.1424.
GBP/JPY Weekly Outlook
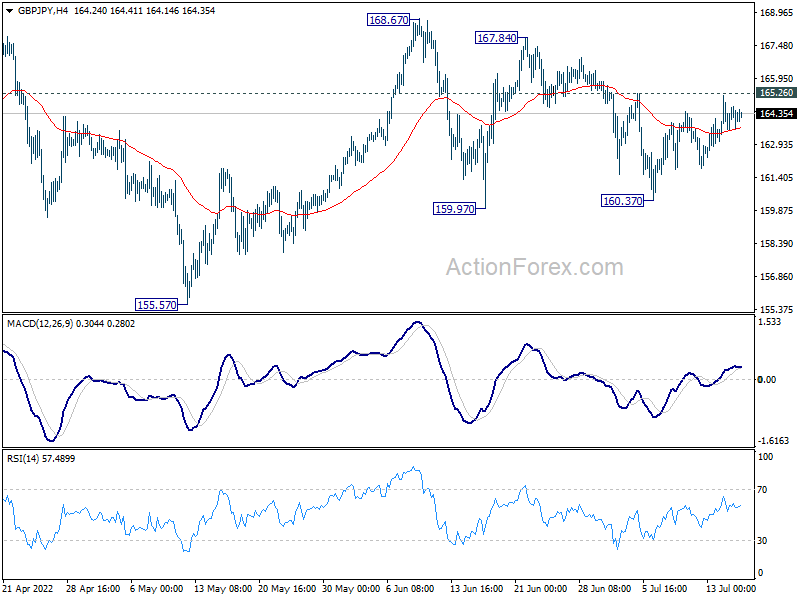
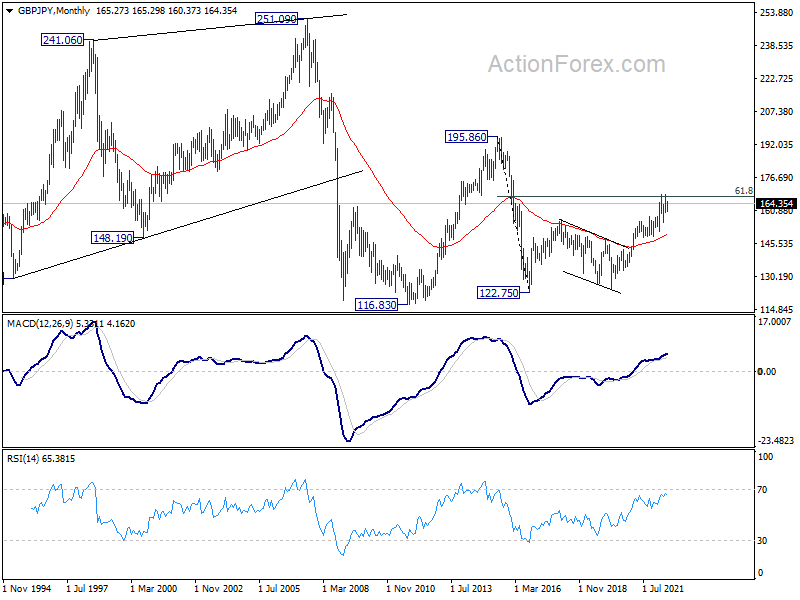
GBP/JPY recovered last week but stayed below 165.26 minor resistance. Initial bias stays neutral this week first. On the upside, firm break of 165.26 minor resistance will argue that corrective pattern from 168.67 has completed. Further rise should be seen to retest 168.67 high next. On the downside, break of 160.37 will bring deeper fall back towards 155.57 support.
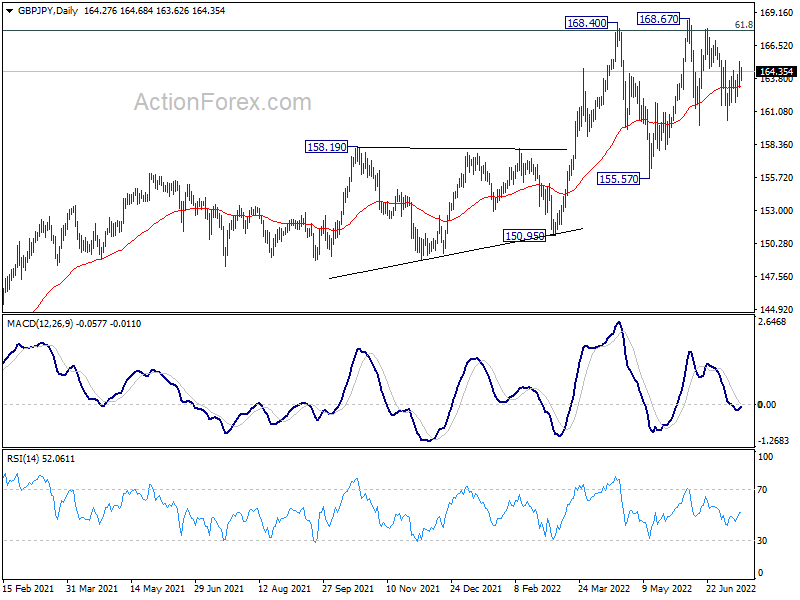
In the bigger picture, up trend from 123.94 (2020 low) is still in progress. Sustained break of 61.8% retracement of 195.86 (2015 high) to 122.75 (2016 low) at 167.93 will be a long term bullish signal, and could pave the way back to 195.86 high. This will now remain the favored case as long as 155.57 support holds, even in case of deep pull back.
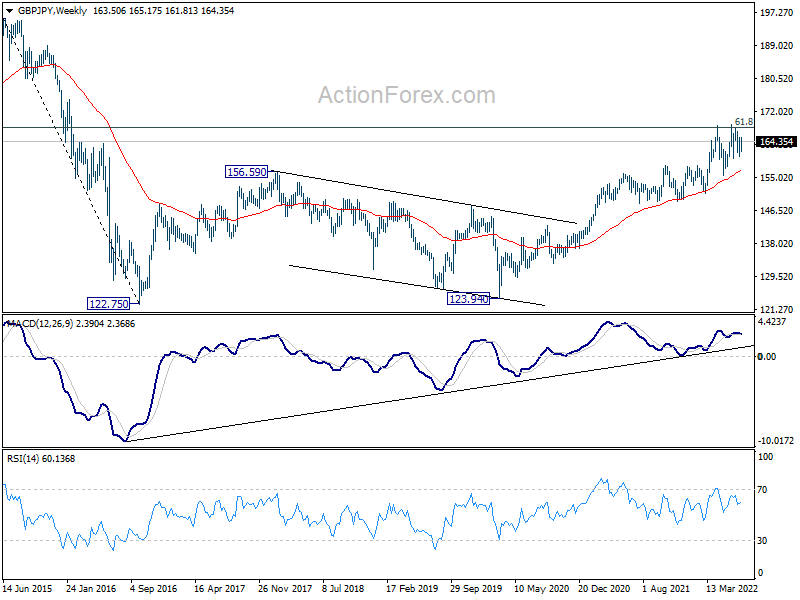
In the longer term picture, rise from 122.75 could be the third leg the the pattern from 116.83 (2011 low). Further rise will remain in favor as long as 55 month EMA (now at 149.84) holds. Sustained break of 61.8% retracement of 195.86 to 122.75 at 167.93. will pave the way to 195.86 (2015 high).
EUR/JPY Weekly Outlook
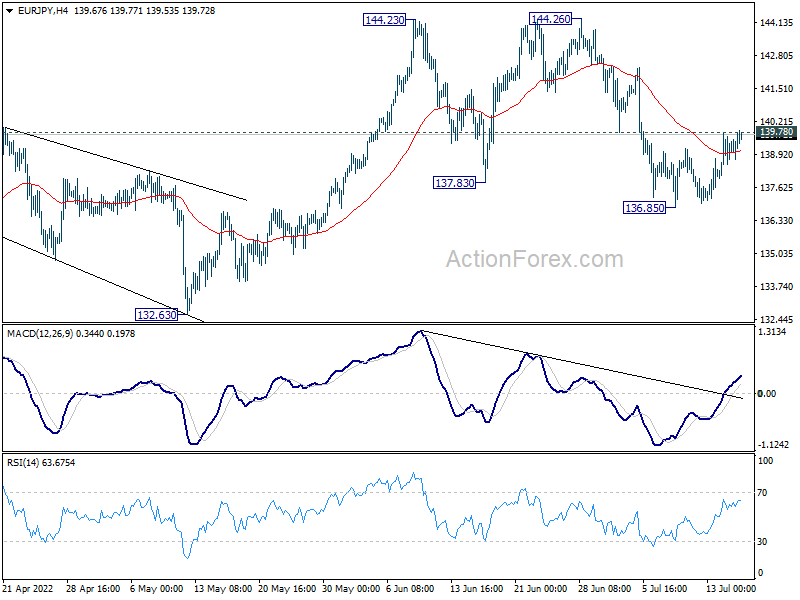
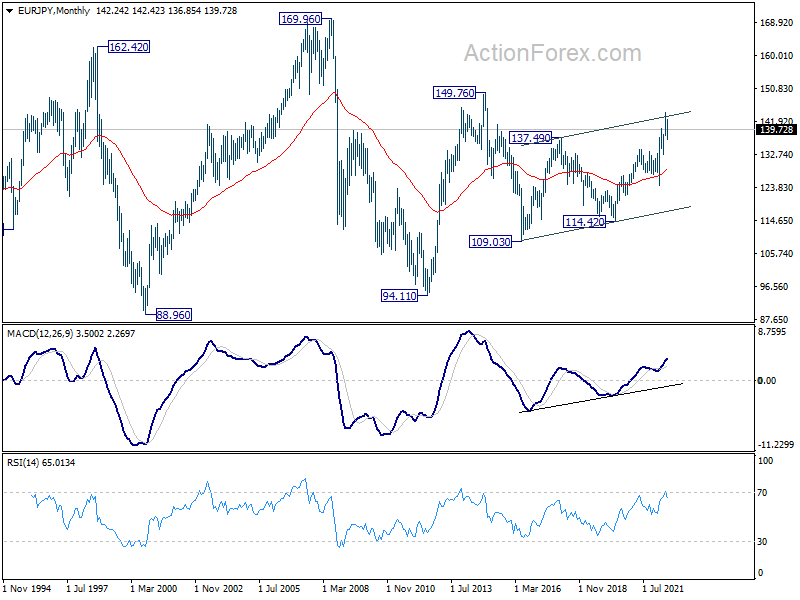
EUR/JPY recovered last week and it's now pressing 139.78 minor resistance. Firm break there will argue that pull back from 144.26 has completed at 136.85. Further rally would be seen back to retest 144.26 high. On the downside, though, below 136.85 will resume the fall back to 132.63 support.
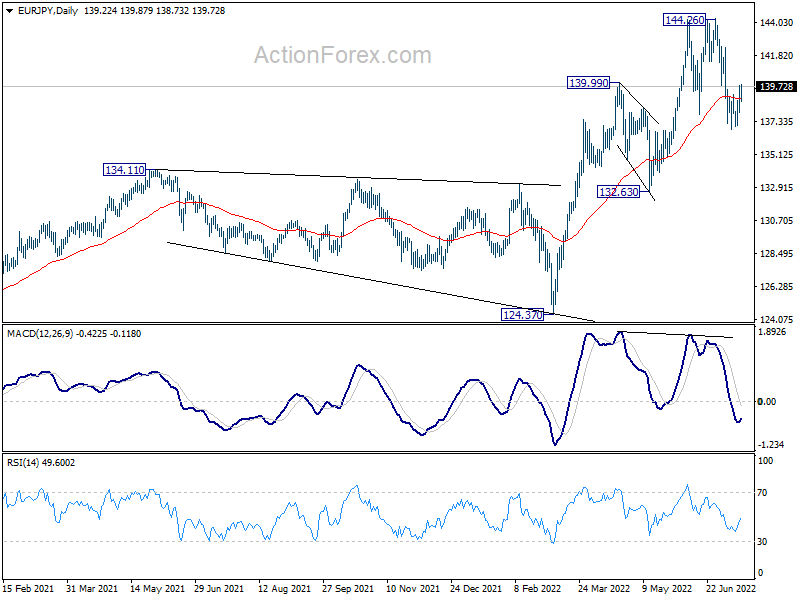
In the bigger picture, up trend from 114.42 (2020 low) is seen as the third leg of the pattern from 109.30 (2016 low). Further rally is in favor as long as 134.11 resistance turned support holds, even in case of deep pull back. Firm break of 139.78 will target 149.76 (2015 high. However, sustained break of 134.11 will be a sign of medium term bearish reversal and turn focus to 124.37 support for confirmation.
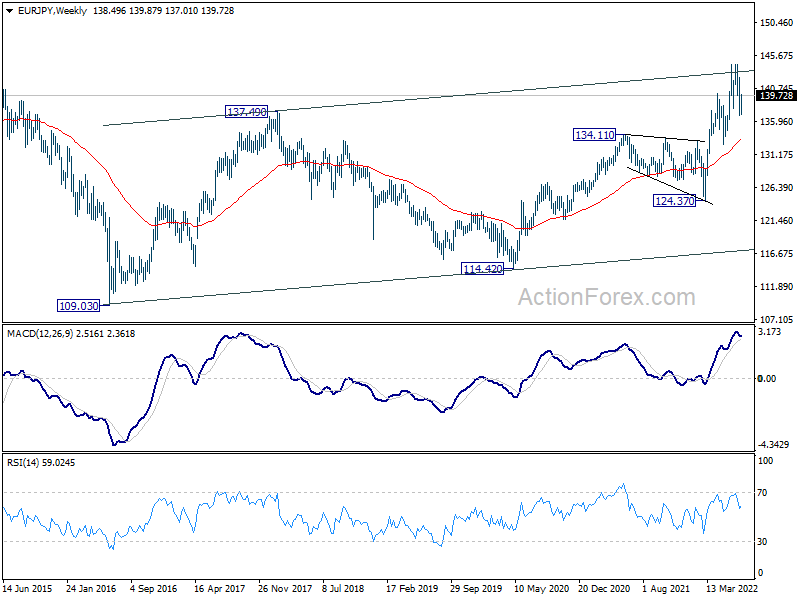
In the long term picture, current rally could be resuming whole rise from 94.11 (2012 low). Further rally would be seen to 149.76 resistance (2014 high) and above. This will remain the favored case as long as 134.11 resistance turned support holds.
EUR/GBP Weekly Outlook
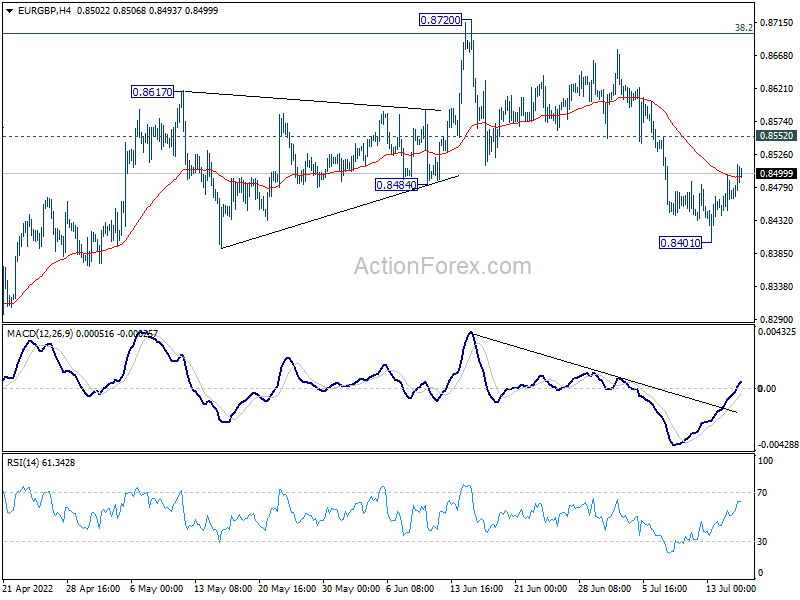
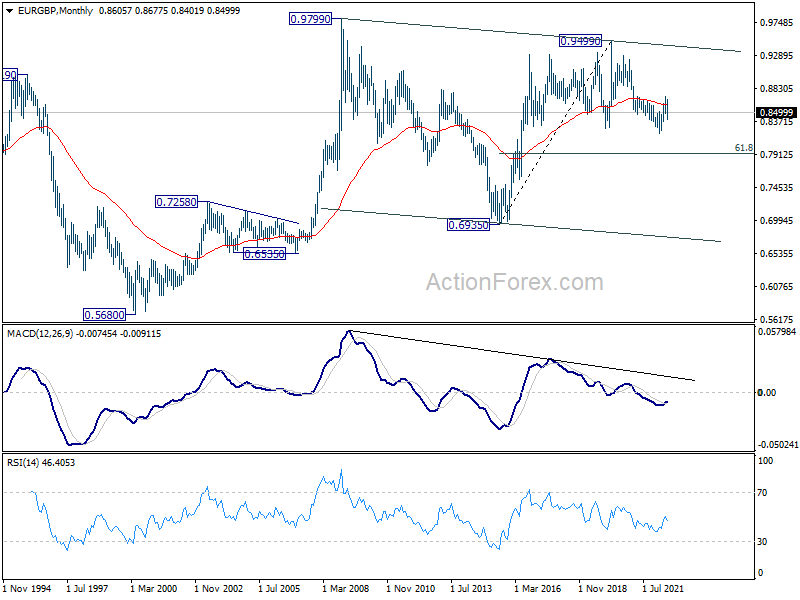
EUR/GBP dipped to 0.8401 last week but recovered since then. Initial bias stays neutral this week, and further fall is in favor with 0.8552 minor resistance intact. Rebound from 0.8201 should have completed at 0.8720, after rejection by 0.8697 medium term fibonacci level. Below 0.8401 will resume the fall from 0.8720 and target a test on 0.8201/48 support zone next. Nevertheless, break of 0.8552 will dampen this bearish view and bring retest of 0.8720 resistance instead.
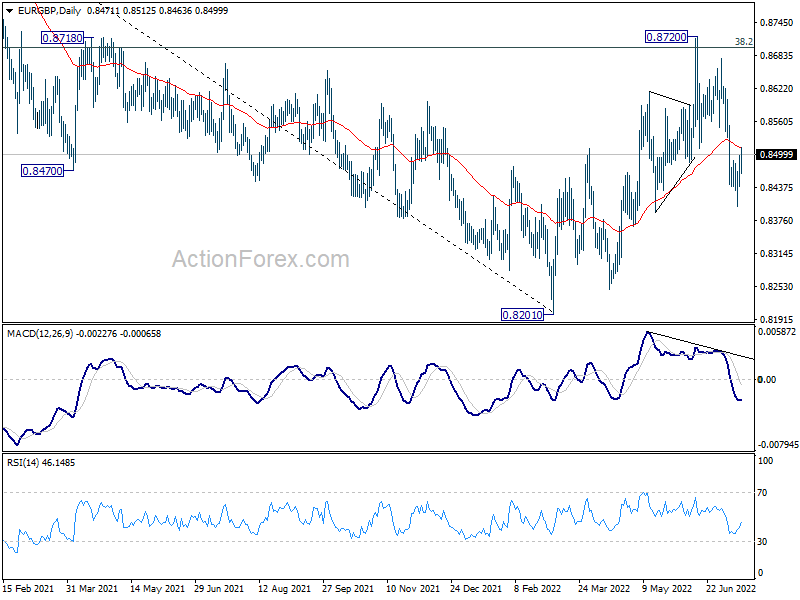
In the bigger picture, rejection by 38.2% retracement of 0.9499 to 0.8201 at 0.8697 argues that rebound from 0.8201 is merely a corrective move. That is, down trend from 0.9499 (2020 high) is now over. Sustained break of 0.8201 will resume such decline and target 61.8% retracement of 0.6935 to 0.9499 at 0.7917. This will now remain the favored case as long as 0.8720 resistance holds.
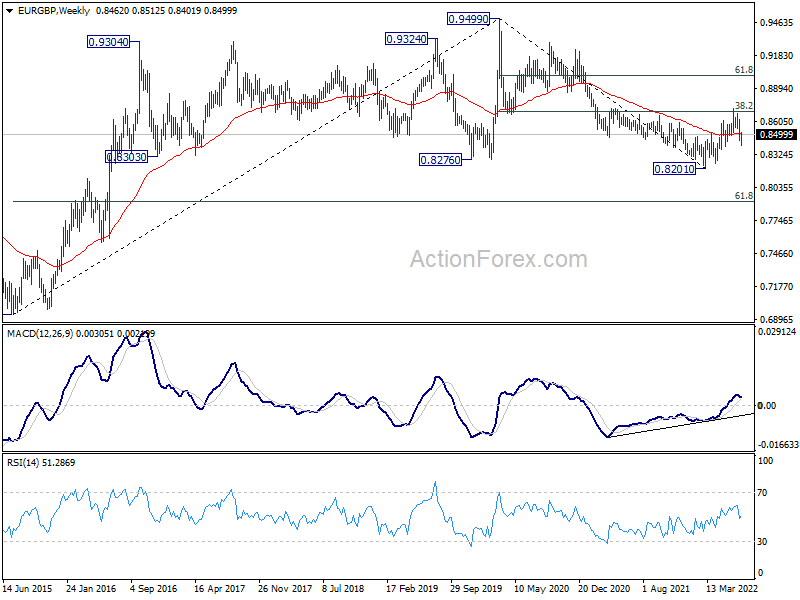
In the long term picture, the lack of medium term downside momentum suggests that fall from 0.9499 (2020 high) is merely a correction to rise from 0.6935 (2015 high). In case of another fall, downside should be contained by 61.8% retracement of 0.6935 to 0.9499 at 0.7917 to bring rebound. Sustained trading above 55 month EMA (now at 0.8604) will indicate that the correction has completed and bring retest of 0.9499.
EUR/AUD Weekly Outlook
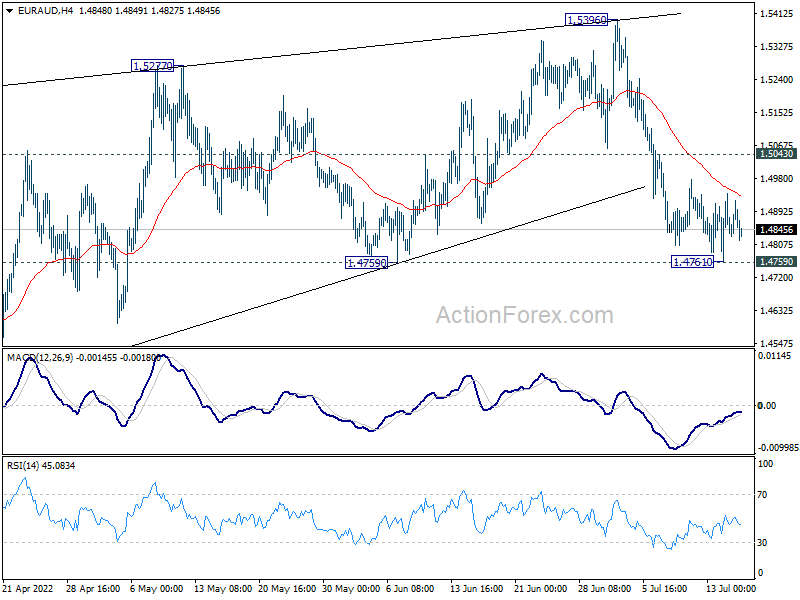
EUR/AUD edged lower to 1.4761 last week but turned sideway ahead of 1.4759 support. Initial bias remains neutral this week first, and further fall is in favor. On the downside, decisive break of 1.4759 support should confirm that corrective rise from 1.4318 has completed at 1.5396 after rejection by 1.5354 support turned resistance. Deeper fall should then be seen back to retest 1.4318 low. On the upside, however, break of 1.5043 will bring stronger rebound back towards 1.5396.
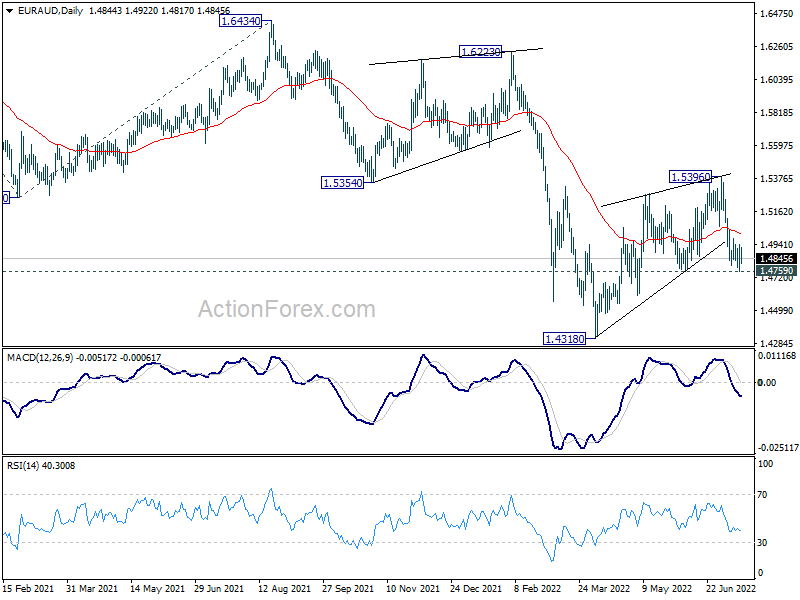
In the bigger picture, rejection by 1.5354 support turned resistance, as well as 55 week EMA (now at 1.5378), maintain medium term bearishness. That is, larger down trend from 1.9799 is not completed yet. Break of 1.4318 low will target 61.8% projection of 1.9799 to 1.5250 from 1.6434 at 1.3623, which is close to 1.3624 long term support (2017 low). This will remain the favored case now as long as 1.5396 resistance holds.
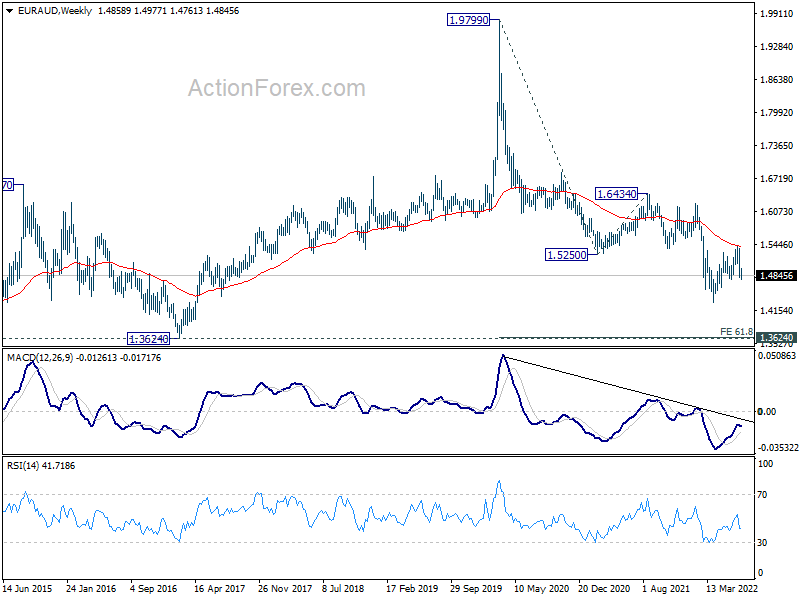
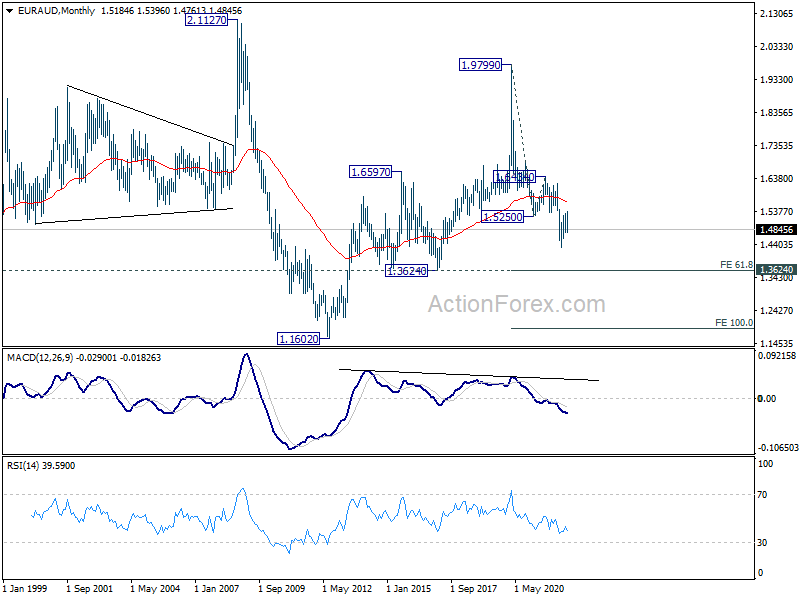
In the longer term picture, fall from 1.9799 (2020 high) is seen as the third leg of the pattern from 2.1127 (2008 high). Deeper fall should be seen to 1.3624 support. Decisive break there would pave the way back to 1.1602 (2012 low). This will remain the favored case as long as 55 month EMA (now at 1.5664) holds.
EUR/CHF Weekly Outlook
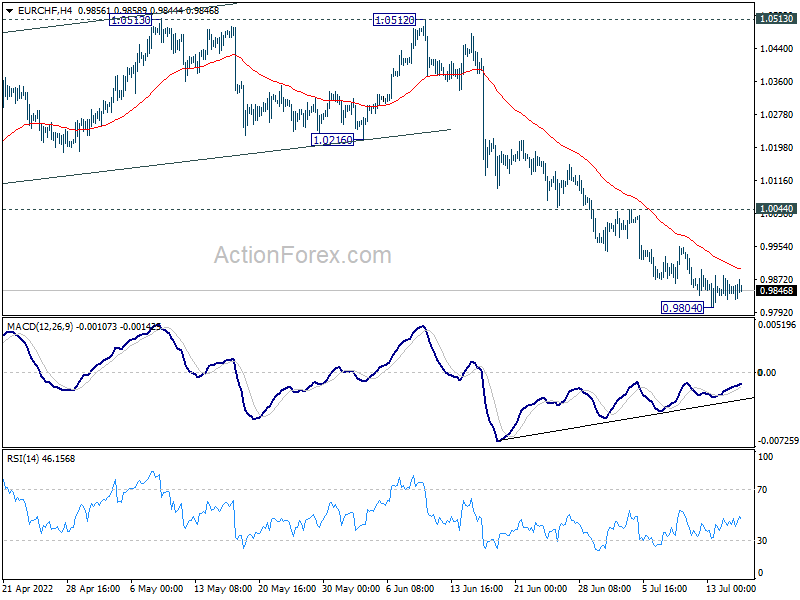
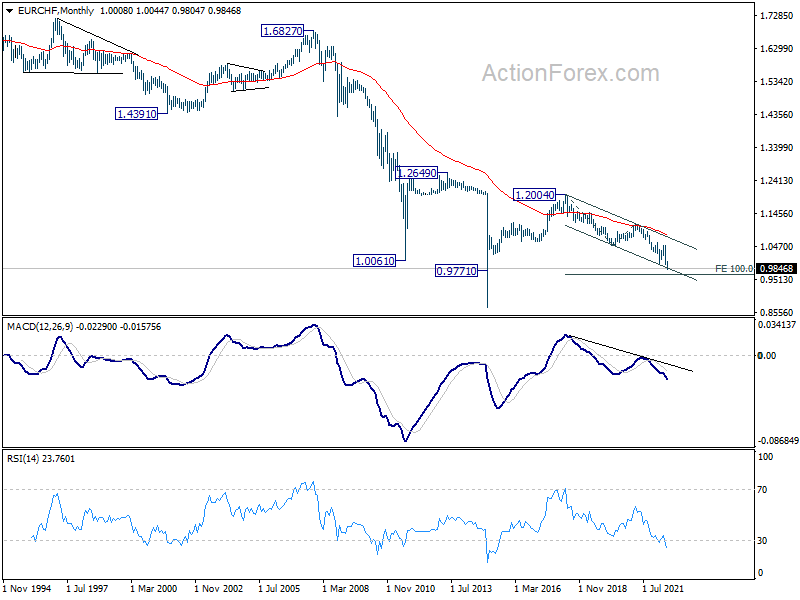
EUR/CHF's down trend continued to 0.9804 last week but turned sideway since then. As a temporary low was formed, initial bias is neutral this week for some consolidations. Upside of recovery should be limited by 1.0044 resistance. Break of 0.9804 will resume larger down trend to 0.9650 long term projection level.
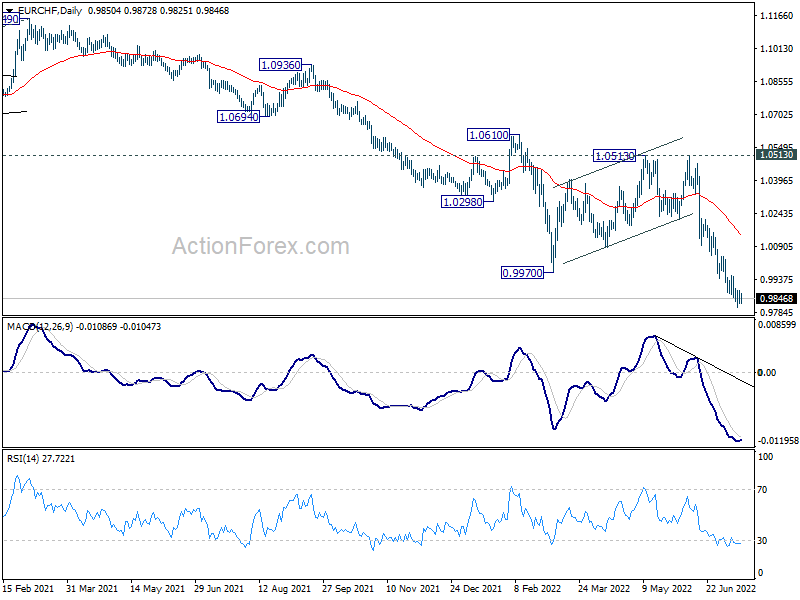
In the bigger picture,long term down trend from 1.2004 (2018 high) is expected to target 100% projection of 1.2004 to 1.0505 to 1.1149 at 0.9650. On the upside, break of 1.0513 resistance is needed to indicate medium term bottoming. Otherwise, outlook will stay bearish in case of strong rebound.
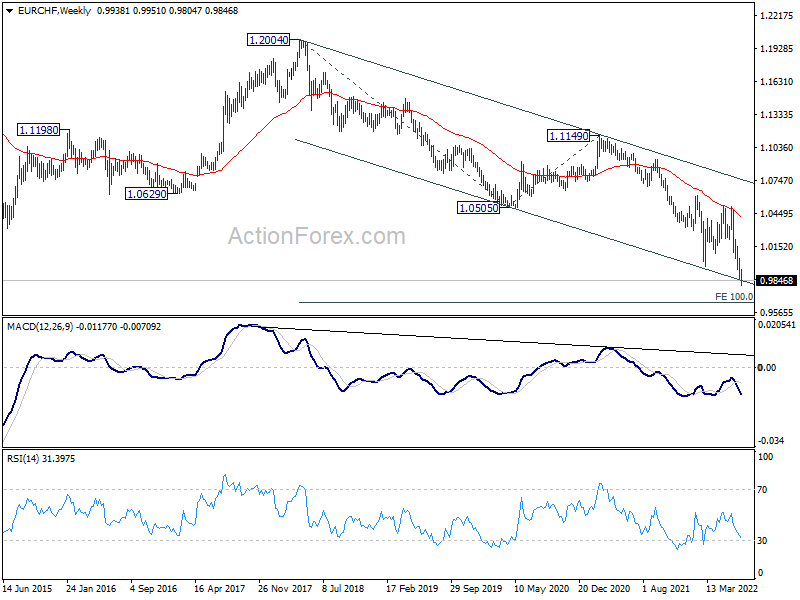
In the long term picture, capped below 55 month EMA, EUR/CHF is seen as extending the multi-decade down trend. There is no prospect of a bullish reversal until some sustained trading above the 55 month EMA (now at 1.0808).
Risk of Dollar Pull Back Growing, After Breaching Parity With Euro
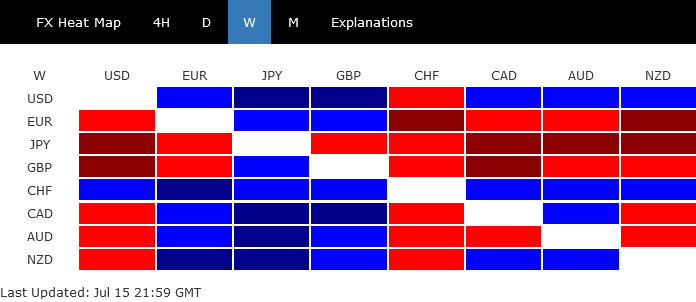
Dollar was the strongest one for most part of the week, and even breached parity against Euro. But the greenback pared gains on late turn in market sentiment, and ended as the second best only. Swiss Franc was surprisingly the best performer, while Kiwi was the third. Yen was the weakest one, as selloff continued on diverging central bank path with other peers. Sterling and Euro were the next weakest. Canadian Dollar just ended mixed even though BoC surprised the markets with a mega 100bps hike.
Investors are now still expecting "just" a 75bps rate hike by Fed this month, and that helped sentiment recovered. Considering the prospect of stronger rebound is stocks, risk of a pull back in the greenback is growing, except versus Yen. Additionally, Euro might finally rebound on short covering after failing to break through parity against Dollar decisively. Gold is also approaching a key support level.
Markets pricing in 71% chance of 75bps Fed hike in Jul
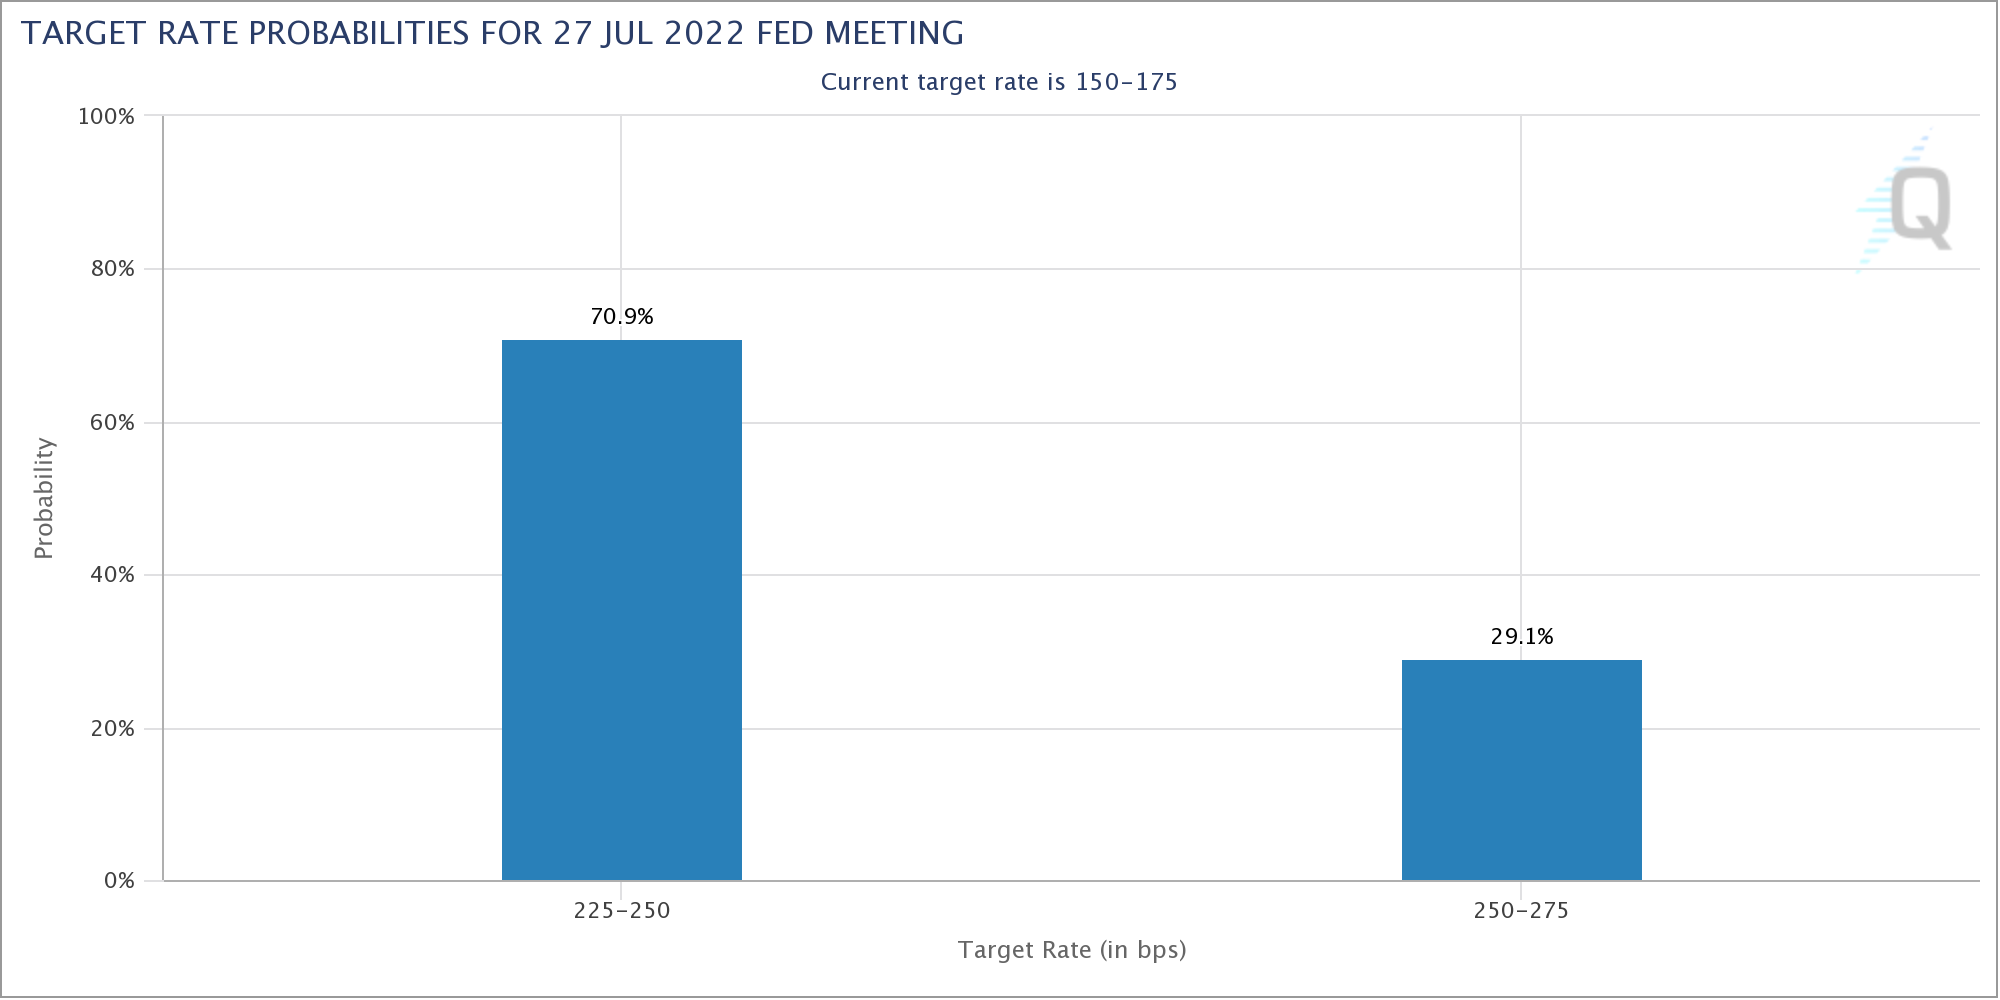
There surprised mega hike of 100bps by BoC last week prompted speculations that Fed will follow at its July 27 decision. Markets were once pricing in 50/50 chance of that happening. But such speculations receded after comments from some Fed officials. The messages are that firstly, with a 75bps hike to 2.25% to 2.50%, federal funds rate will already be in the neutral range. Secondly, a 100bps won't make a huge difference from a 75bps at this point.
Additionally, the University of Michigan consumer survey showed that inflation expectations were easing. Five-year inflation expectations dropped from 3.1% to 2.8%, hitting the lowest level in a year. One-year inflation expectation also ticked down from 5.3% to 5.2%, lowest since February. There are hopes of realized inflation data to start reverse in the upcoming periods.
Fed will have nearly two months of data between July and September FOMC meeting, with interest rate at neutral, before gauging the next move. A 75bps hike is still sensible. Anyways, Fed fund futures are pricing in 71% chance of a 75bps hike, 29% of 100bps.
DOW staged relief rebound, more upside ahead?
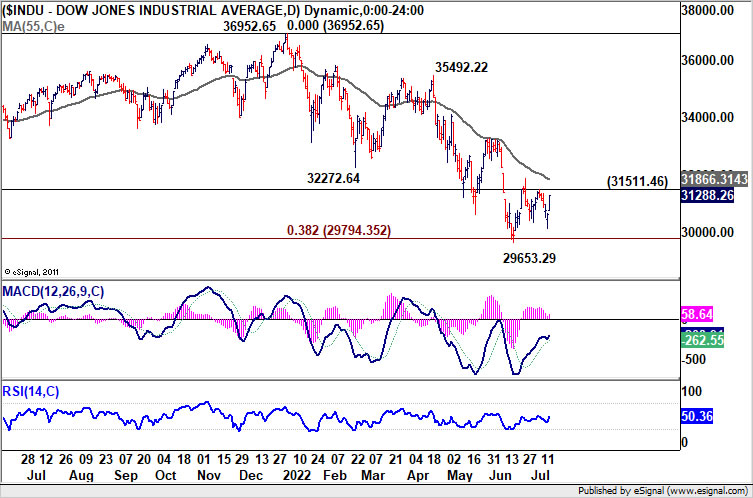
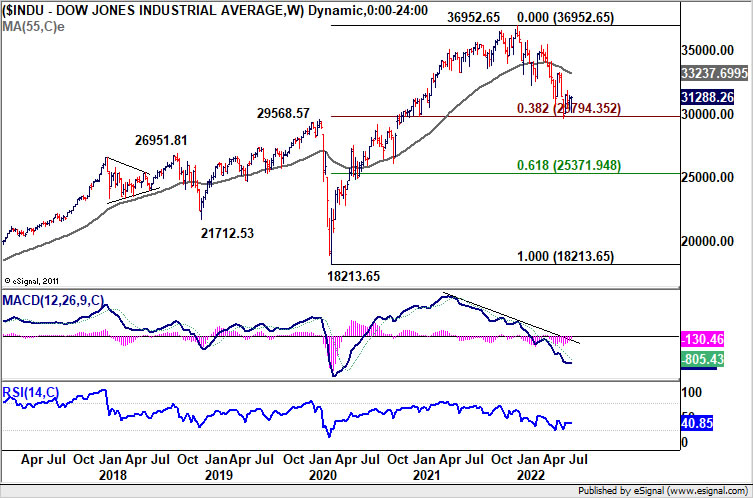
US stocks staged a relief rebound towards the end of the week. It's still early to conclude, but DOW's corrective fall from 36952.65 appears to have completed with three waves down to 29653.29. That came after hitting 30k handle, and 38.2% retracement of 18213.65 to 36952.65 at 29794.35.
Firm break of 31511.46 resistance will affirm this bullish case. Sustained trading above 55 day EMA (now at 31866.31) will pave the way to 55 week EMA (now at 33237.69). Such development could start happening in Q3, if incoming data really starts to show topping in US inflation, while keeping the economy robust, and as Fed starts to slow its pace of tightening.
10-year yield continues sideway consolidation
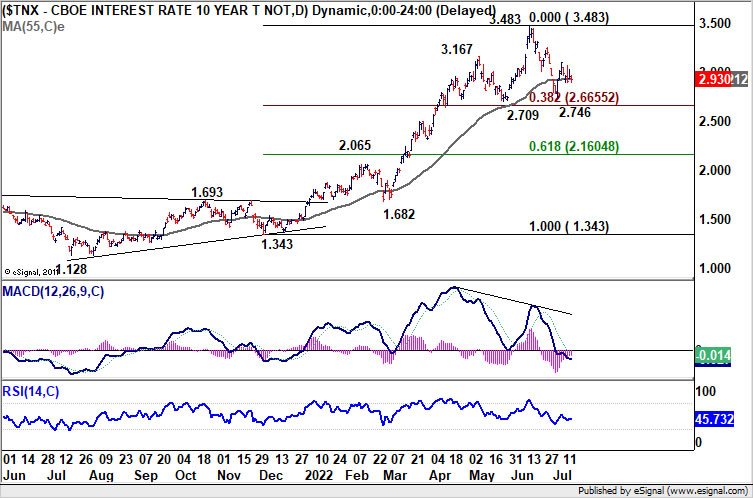
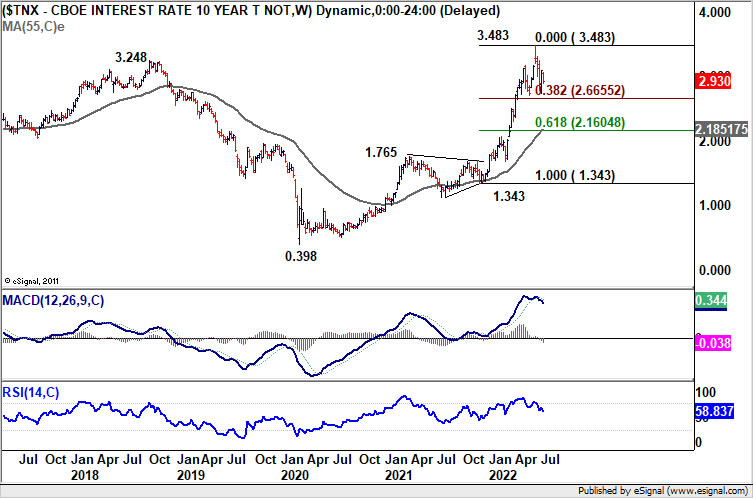
Outlook in 10-year yield is unchanged as it gyrated around 55 day EMA last week. Price actions from 3.483 are seen as a medium term consolidation pattern, with range set between 2.709 and 3.483). It's probably in the second leg of the pattern and further rise might be seen. But upside should be capped by 3.483. It will take a while more to complete the whole pattern.
Dollar index continued up trend, but looks a bit stretched
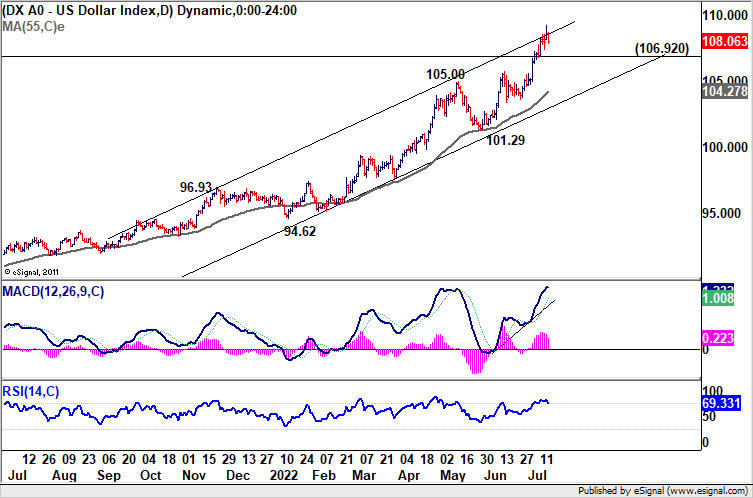
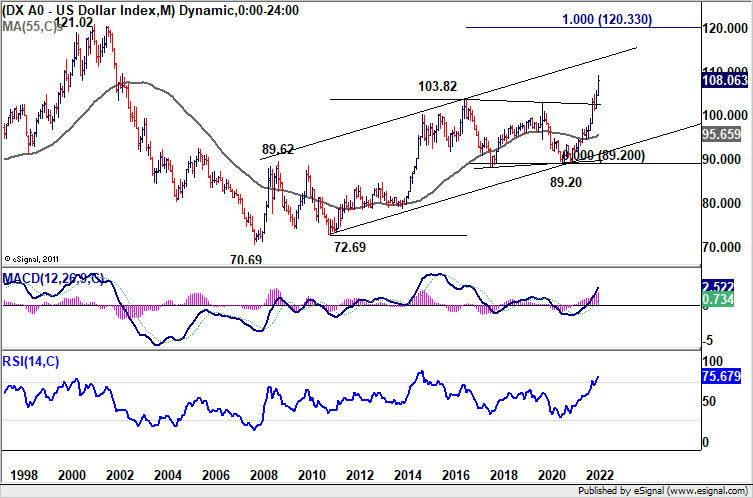
Dollar index's up trend continued last week but it's looking a bit stretched close to medium term channel resistance. Considering that risk-off sentiment might recede while treasury yield stay steady, a pull back in DXY is no unrealistic. Break of 106.92 support should indicate the start of a correction back to 55 day EMA (now at 104.27).
But of course, before break of 106.92 support, recent up trend is still in favor to continue, towards long term channel resistance (now at around 113).
EUR/USD to rebound after defending parity? Gold to reverse?
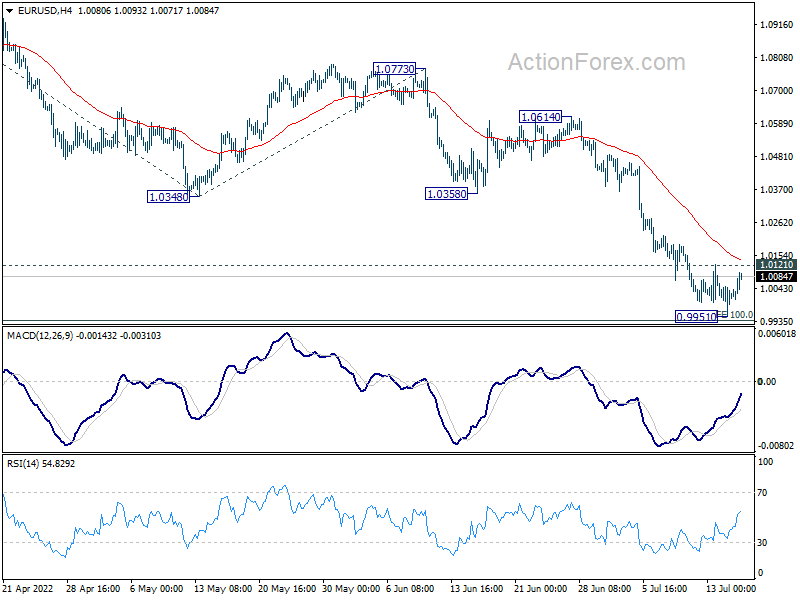
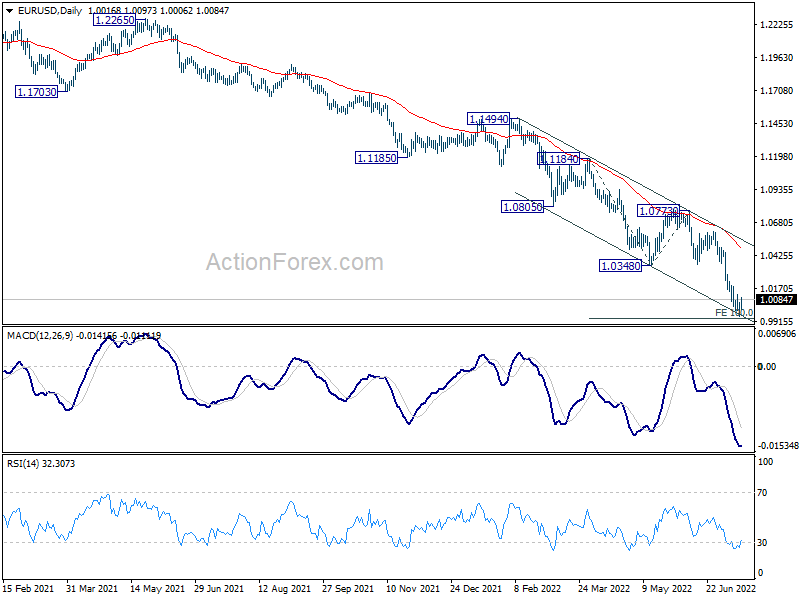
To further assess the chance of a pull back in Dollar, some attention is paid to both EUR/USD and Gold. EUR/USD is still defending parity, despite dipping to 0.9951. Downside momentum has been diminishing, as seen in 4 hour MACD, as it approached 100% projection of 1.1184 to 1.0348 from 1.0773 at 0.9937. A break above 1.0121 minor resistance will indicate short term bottoming, and bring stronger rebound back to 1.0348 support turned resistance.
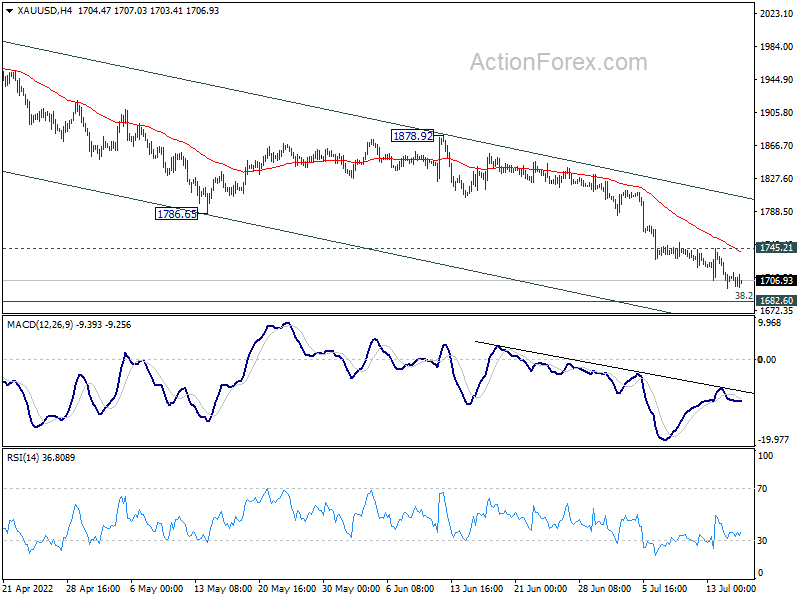
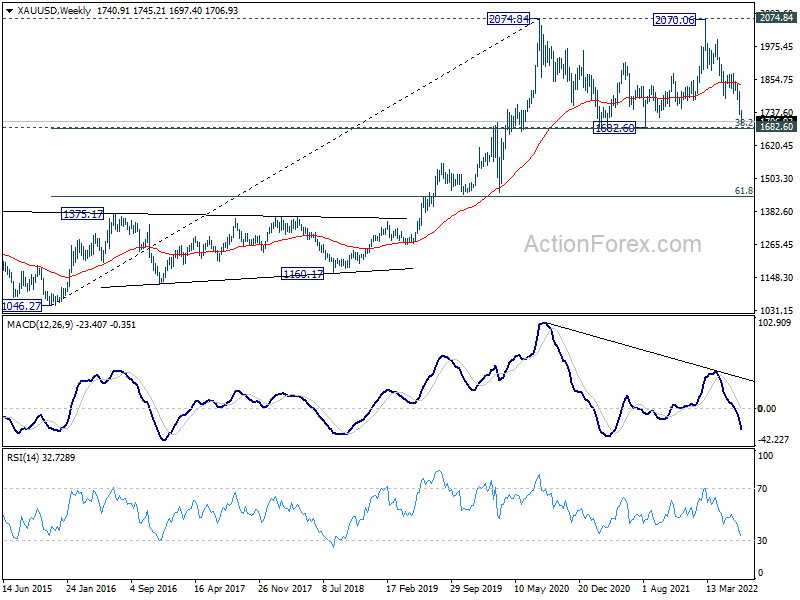
Gold is now close to an important long term support level at 1682.60, with 38.2% retracement of 1046.27 to 2074.84 at 1681.92. Strong support should be seen at this level to complete the three wave consolidation pattern from 2074.84 (2020 high). Break of 1745.21 minor resistance will be the first sign of reversal, and bring stronger rebound back to 1786.65/1878.92 resistance zone. If both EUR/USD and Gold manage to rebound, for the short term at least, Dollar should nautrally be starting a pull back.
USD/JPY Weekly Outlook
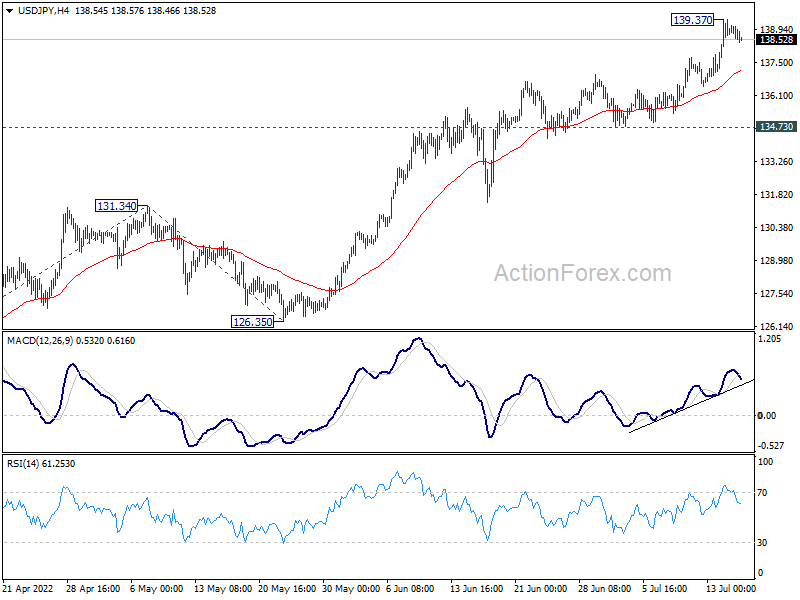
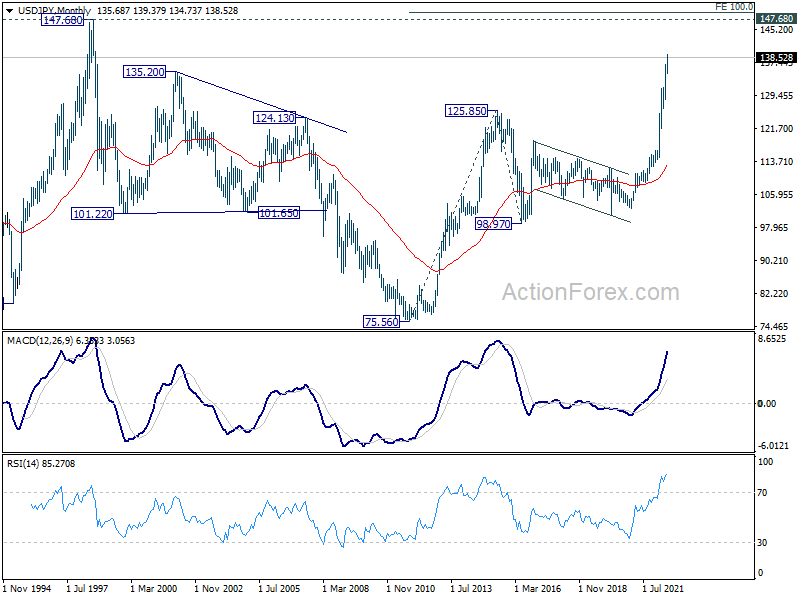
USD/JPY's up trend resumed last week and hit as high as 139.37. With a temporary top in place, initial bias is turned neutral this week for consolidations. But downside of retreat should be contained by 134.73 support. On the upside, break of 139.37 will resume larger up trend to 100% projection of 114.40 to 131.34 from 126.35 at 143.29.
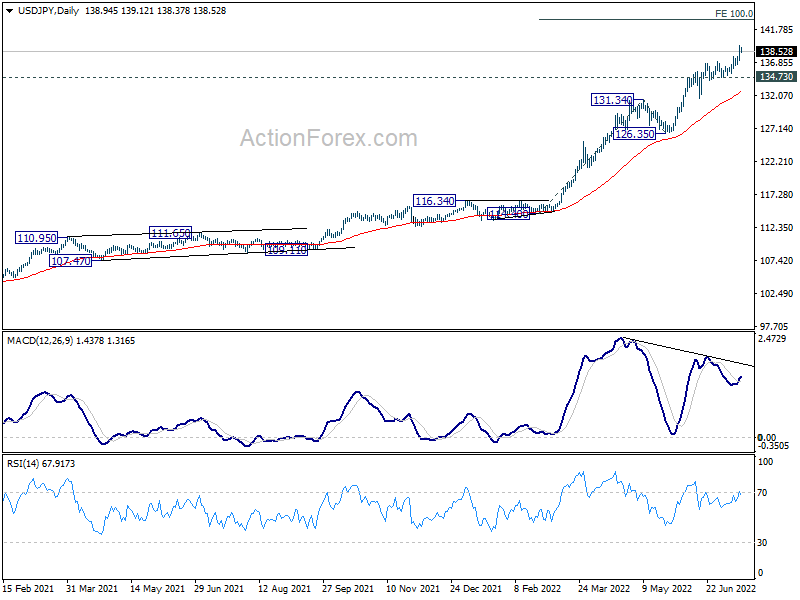
In the bigger picture, current rally is seen as part of the long term up trend from 75.56 (2011 low). Next target is 100% projection of 75.56 (2011 low) to 125.85 (2015 high) from 98.97 at 149.26, which is close to 147.68 (1998 high). This will remain the favored case as long as 126.35 support holds.
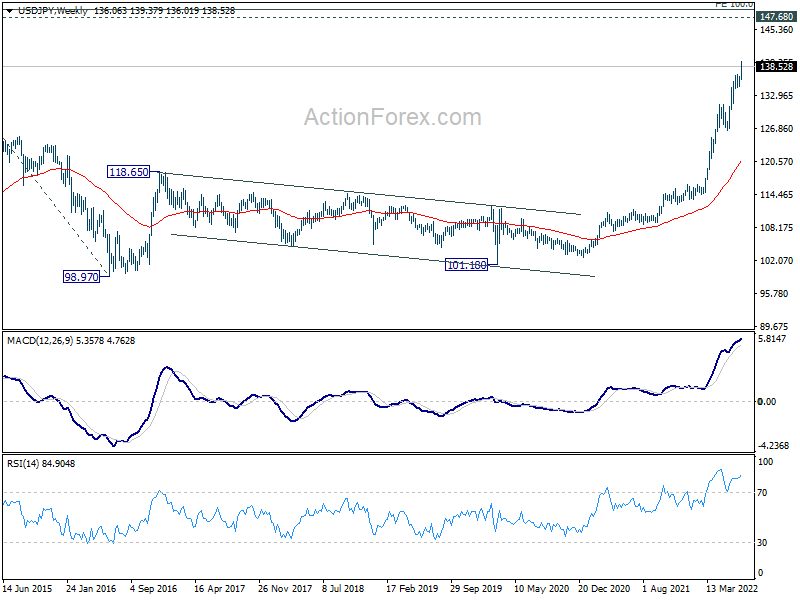
In the long term picture, the up trend from 75.56 (2011 low) long term bottom to 125.85 (2015 high) has just resumed. Next target is 100% projection of 75.56 (2011 low) to 125.85 (2015 high) from 98.97 at 149.26, which is close to 147.68 (1998 high).
Summary 7/18 – 7/22
Monday, Jul 18, 2022
[php_everywhere instance="1"]
Tuesday, Jul 19, 2022
[php_everywhere instance="2"]
Wednesday, Jul 20, 2022
[php_everywhere instance="3"]
Thursday, Jul 21, 2022
[php_everywhere instance="4"]
Friday, Jul 22, 2022
[php_everywhere instance="5"]
Weekly Economic & Financial Commentary: This Party Is Breaking Up Fast
Summary
United States: This Party Is Breaking Up Fast
- Signals of a slowdown are starting to flash across sectors. Business and consumer sentiment have faltered, real consumer spending has weakened, housing activity has stalled and business investment is downshifting in response. On the other hand, robust employment growth and solid gross domestic income suggest we are not in the hole just yet.
- Next week: Housing Starts (Tue), Existing Home Sales (Wed), Initial Jobless Claims (Thu)
International: U.K. Growth Surprises to the Upside, Bank of Canada Delivers a Super-Sized Hike
- U.K. GDP registered a gain in May, but some cracks in the economy may be starting to show, specifically with regard to the consumer sector. Elsewhere in the G10, the Bank of Canada delivered a super-sized 100 bps hike at its July monetary policy meeting, bringing the policy rate to 2.50% and signaling more rate hikes to come.
- Next week: U.K. CPI (Wed), Canada CPI (Wed), ECB Rate Decision (Thu)
Interest Rate Watch: Asset Inflation Is Already Being Curbed
- The Federal Reserve is continuing to reduce its balance sheet holdings of Treasuries and mortgage-backed securities (MBS), increasing the pace of the drawdown in September. However, the reduction of the MBS portfolio may prove to be difficult in the face of rising interest rates that have curtailed mortgage refinancing. We will also be on the lookout for liquidity challenges in the fall as the Fed's balance sheet is reduced.
Credit Market Insights: Record High for Monthly Auto Loan Payments
- The average monthly auto loan payment reached a record high of $712 in June with 12.7% of new car buyers paying at least $1,000 per month for their cars, according to Cox Automotive Inc. Ultimately, with peak inflation not yet behind us and a potential economic slowdown looming, household balance sheets may be further stressed by these large monthly payments.
Topic of the Week: Beige Book Heralds Slowing Growth, Inflation Fears, Recession Risk
- This week, the Federal Reserve released the Beige Book for its July meeting. Regional banks are describing situations seen across the country with some of the following language: slowing growth, inflation fears and even some risks of recession.
The Weekly Bottom Line: BoC Delivers Shock 1% Hike
U.S. Highlights
- Market sentiment soured this week on stronger than expected CPI data and a weak start to corporate earnings season.
- US CPI accelerated in June, rising 1.3% m/m, pushing the year-ago measure to a new multidecade high of 9.1%. Core inflation accelerated by 0.7% m/m, as hefty gains were seen across both goods (0.8% m/m) and service (0.7% m/m) categories.
- June retail sales surprised to upside, with both the headline (1% m/m) and control measure (0.8% m/m) recording decent nominal gains. However, sales were lower after adjusting for inflation.
Canadian Highlights
- The Bank of Canada delivered a surprise 1% rate hike this week as fears over high inflation persist.
- Existing home sales and house prices continue to decline as higher rates pressure markets.
- Next week, all eyes will be on the Canada CPI release, which is expected to show another leg up in inflation.
U.S. - Gotta Bend Before You Can Break
Market sentiment decisively shifted to risk-off mode this week, as a stronger than expected print on CPI and a weak start to corporate earnings season helped cast further doubt on the economic outlook. At the time of writing, the S&P 500 is down 2% on the week and has now had one of the worst starts to a year in nearly a century. The deteriorating market sentiment led to a further widening in the yield curve inversion – highlighting the growing fear among market participants that a recession may be on the horizon. The 10Y-2Y spread now sits at -20 basis points (bps). The sour market sentiment also spilled over to commodity markets, with WTI down 8% to $98 per-barrel on the week.
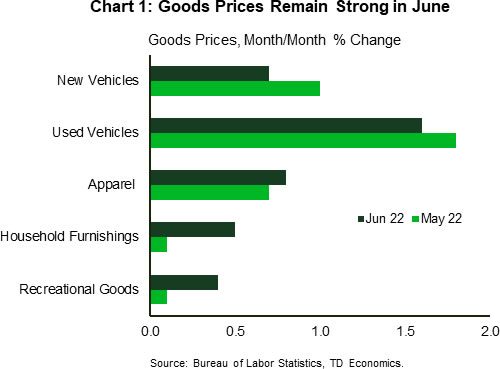
Any hopes of inflationary pressures easing in June were quickly dashed on Wednesday following the Bureau of Labor Statistics’ release of last month’s CPI data. Headline CPI accelerated by 1.3% month-on-month (m/m), pushing the year-ago measure to a new multidecade high of 9.1%. Indeed, with fuel prices having surged by 11% last month, and more recent gains in food prices showing incredible persistence, a further acceleration in the headline measure was inevitable. What was not anticipated, however, was the uptick in core inflation (0.7% m/m). Perhaps most disconcerting was the breadth in price gains across core, particularly among goods categories (Chart 1). Further gains in goods prices are at odds with more recent spending data, which has shown consumers pulling back on purchases of most discretionary goods in recent months. While inflation is notoriously a lagged indicator, it was thought that the combination of weakening demand and anecdotal reports of retailers carrying excess inventory would soon start to exert downward pressure on goods prices. That narrative has yet to come to fruition, and that detail will not be lost on policymakers when they meet later this month.
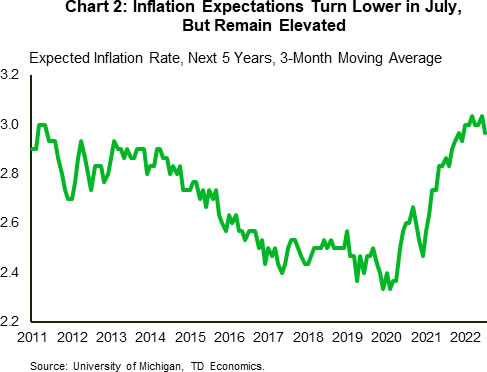
Perhaps one piece of encouraging news came from the July reading of the University of Michigan consumer confidence survey, which showed that expectations for inflation over the next five years now sit at 2.8% – down from last month’s reading of 3.1% (Chart 2). Chair Powell highlighted the recent upward drift in inflation expectations as being one of the key contributors in the FOMC’s decision to raise rates more forcefully in June. While the turn lower will provide some relief to policymakers, it won’t be enough to dissuade them from pushing ahead with another supersized hike later this month. This sentiment has been mirrored in market pricing, with odds a near coin toss on whether the Fed will raise by 75bps or 100bps.
The big question now is to what extent higher interest rates will ultimately weigh on domestic demand. Retail sales data for June showed that consumers are remaining somewhat resilient, with both headline (1.0% m/m) and the control (0.8% m/m) up on the month. That said, consumer spending is only tracking around 1% q/q (annualized) for the second quarter, which is a marked slowdown from the 4.5% averaged through the second half of last year. With inflation continuing to erode purchasing power and rates expected to move decisively higher through year-end, the hope is that consumers will only bend under the weight of the dual-income shock and not completely break.
Canada - BoC Delivers Shock 1% Hike
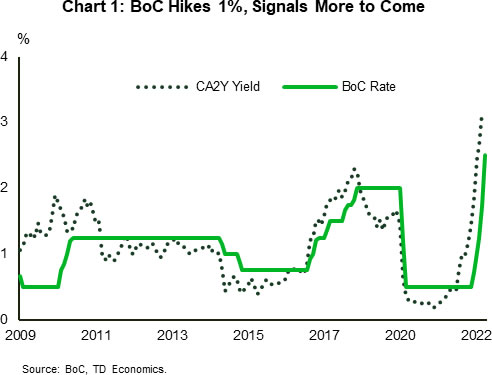
The Bank of Canada (BoC) made global headlines this week as it delivered on a super upsized rate hike of 1% (Chart 1). Though we are running out of superlatives to describe the magnitude of the BoC's actions, expectations are for more to come as inflation is poised to continue to run at elevated levels. Financial market participants are expecting 1% to 1.25% in additional rate hikes over this year.
BoC Cuts Growth, Upgrades Inflation
In the BoC's accompanying Monetary Policy Statement there were a number of nuggets the revealed insight into the Bank's thinking. The first is the change in their growth forecast. The Bank stated that economic growth will slow from 3.5% this year to 1.75% in 2023, as global economic momentum decelerates on the back of higher global interest rates and high inflation.
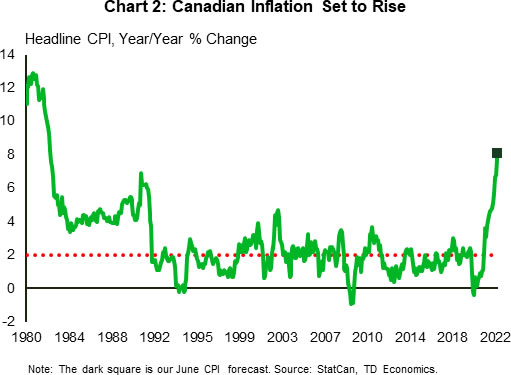
On inflation, the BoC's new forecast shows that it believes CPI will remain around 8% over the coming months and decelerate to only 7.5% by the end of this year, reaching 3.2% by the end of 2023. That means the central bank doesn't think it will be able to bring inflation down to the target band (1%-3%) within its 12-18 month monetary policy window. Given the recent Business Outlook Survey and Canadian Survey of Consumer Expectations, which showed an unmooring of inflation expectations over the forecast horizon, the Bank of Canada's forecast of higher inflation for longer hits the spot.
We also got data on Canadian existing home sales and home prices on Friday. Following the recent trend, sales declined another 5.6% month-over-month (m/m). Combined with the 4.1% m/m rise in new listings, the sales-to-listings ratio continued to fall further into balanced territory (51.7%). This caused the average Canadian home price to drop another 4.3% m/m, pushing the peak-to-trough decline to a whopping -14% since February.
Looking Ahead to Next Week
All eyes will be on Wednesday's CPI release next week. With inflation already at 7.7% year-on-year, expectations are for a +8% reading on the headline number (Chart 2). We are looking to see further increases in price pressures on food and fuel, which have been the main drivers of inflation over the last few months. Any surprise to the upside on inflation will likely cause markets to price even more hikes by the BoC. Recent re-pricing has caused the Canada 2-year to continue to rise, while the Canada 10-year has remained stable just above 3%. This has pushed the 10-year/2-year yield spread (a popular signal of recession) even deeper into negative territory. Though the BoC is still forecasting a soft landing, where it raises rates without causing recession, markets are preparing for a bumpy ride.