

Sample Category Title
CAD Dips on Weak Canadian Job Data
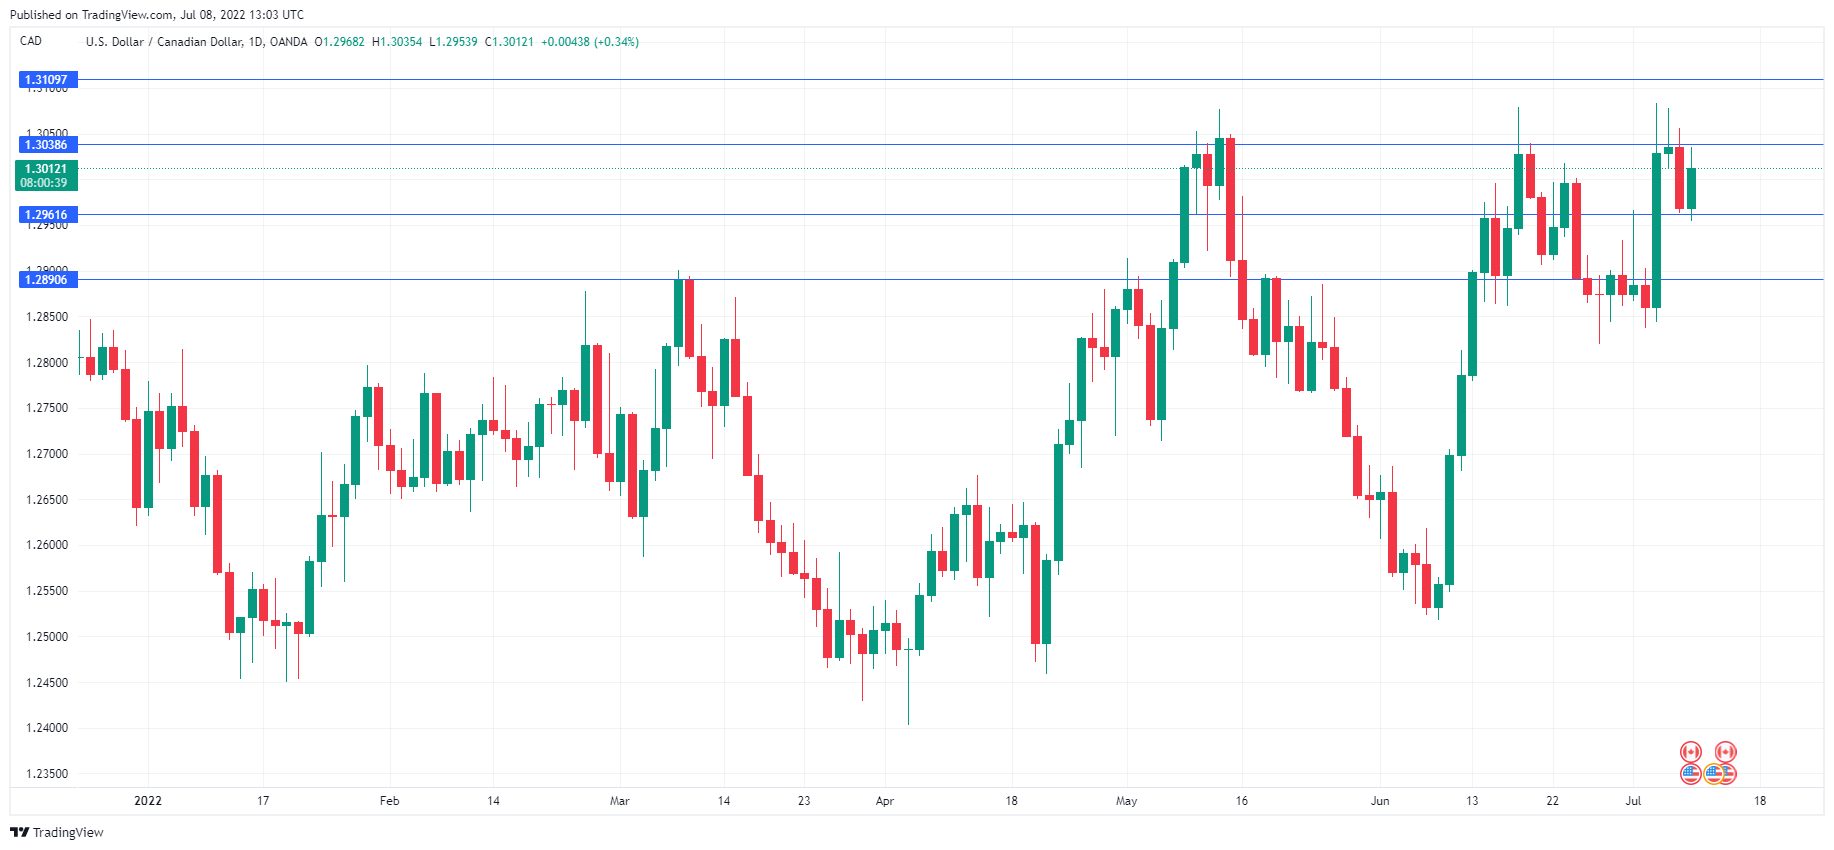
USD/CAD is back above the 1.3000 line on Friday, after weak Canadian job numbers and a strong US nonfarm payroll report.
US nonfarm payrolls outperforms
The week is wrapping up on a busy note, as Canada and the US both released employment reports for June. Canada’s numbers were a disappointment. Employment fell by 43.2 thousand, nowhere near the forecast of a 23.5 thousand gain. There was a silver lining as the unemployment rate fell to an impressive 4.9%, down from 5.1% in May (5.1% exp.).
In the US, nonfarm payrolls was much stronger than expected, with a gain of 381 thousand. This was higher than the May gain of 336 thousand and crushed the estimate of 240 thousand. Wage growth and the unemployment rate were unchanged, at 3.6% and 0.3%, respectively. We’ll have to wait for the markets to digest the impressive NFP release – if investors feel that the Fed will opt for a 50bp increase rather than another 75bp move, it would likely put pressure on the US dollar.
The Bank of Canada will be in the spotlight next week, as the BoC holds a rate meeting on Wednesday. The BoC is expected to continue its aggressive rate-hike cycle, but it’s uncertain if the increase will be 50bp or a supersize 75 bp, following the Federal Reserve’s lead. The benchmark rate is currently at 1.5% and the BoC has said that it views the “neutral” range at 2-3%, so higher rates are clearly on the way – it’s just a question of how much and how fast.
With inflation running at 7.7%, a four-decade high, the BoC will keep hiking until it sees the elusive inflation peak. The economy appears resilient enough to absorb further hikes. Growth has been boosted by high oil prices and the labour market remains robust.
USD/CAD Technical
- 1.3038 is under pressure in resistance. Above, there is resistance at 1.3109
- USD/CAD has support at 1.2961 and 1.2890
Euro Nearing Parity with Dollar
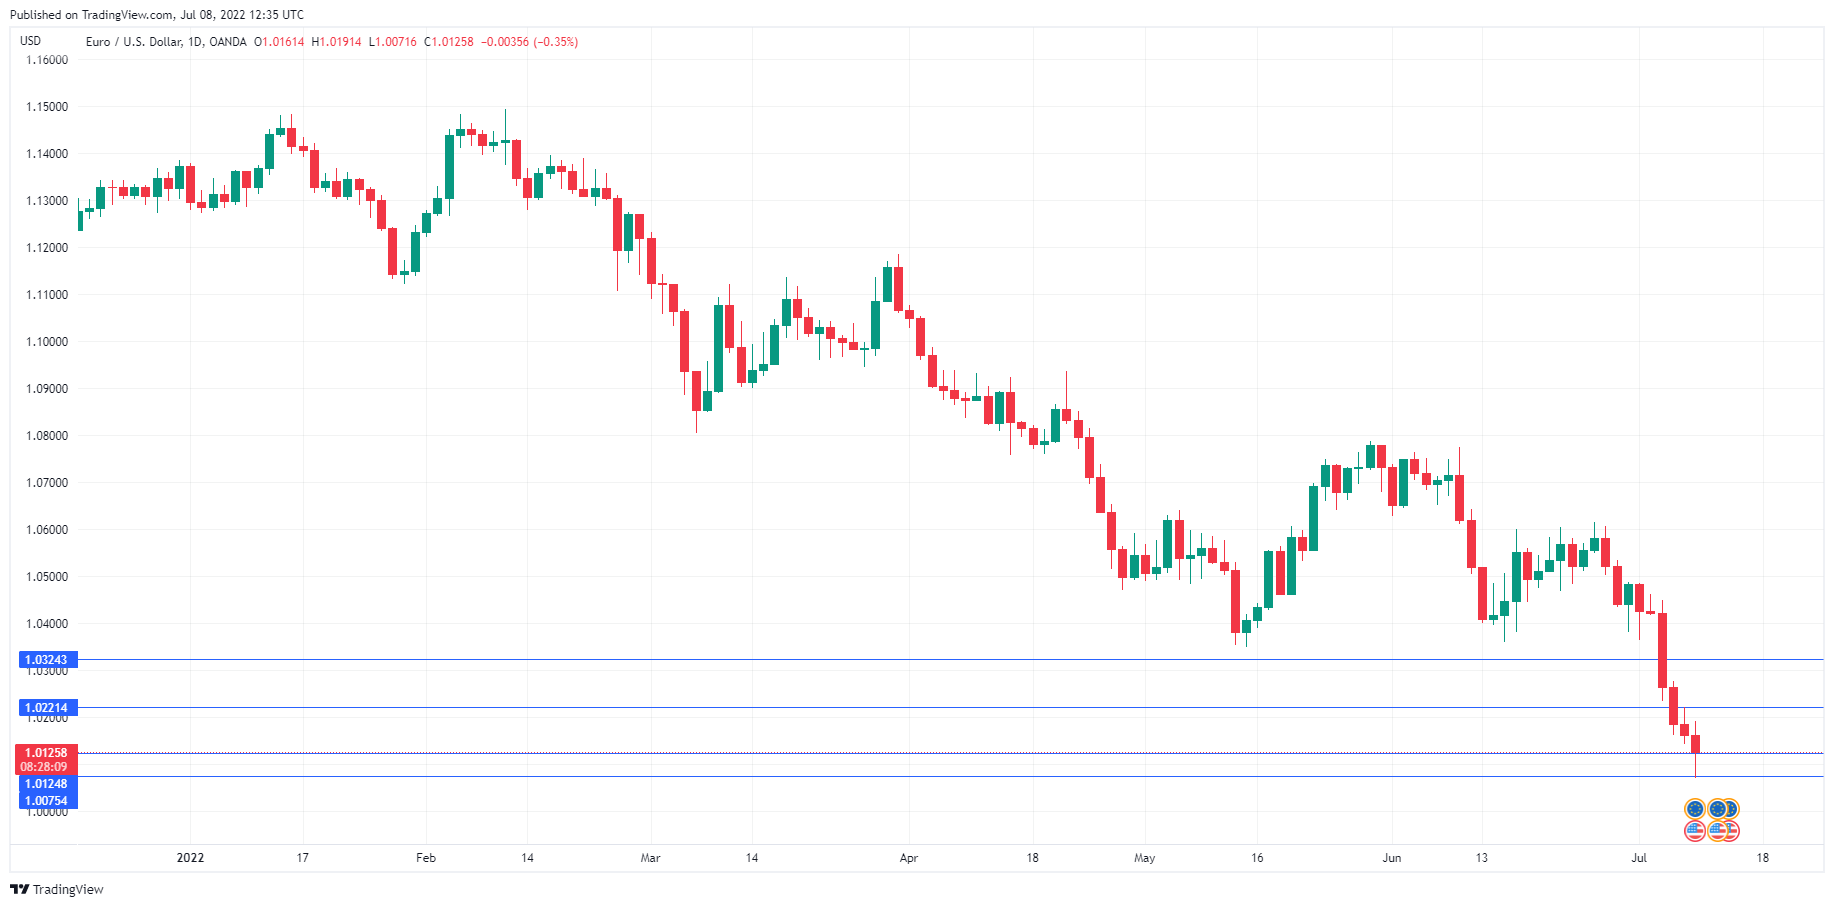
It continues to be a miserable July for EUR/USD, which has declined 3.12%. The euro continues to deliver fresh 20-year lows, dropping to 1.0071 late in the Asian session. The euro has since recovered most of today’s losses, but the psychologically-important parity line is getting closer by the day, as the euro continues to stumble. On the economic front, US nonfarm payrolls outperformed, with a reading of 381 thousand, well above the consensus of 240 thousand.
The ECB released the minutes of its June meeting on Thursday, with investors hunting for clues about the lift-off hike at the July meeting. The minutes didn’t provide any new insights, which could be a disappointment but shouldn’t really be all that surprising. The July 21st meeting will be live, with a modest 25bp increase being the most likely scenario, with another rate hike to follow in September. Still, the ECB has not shut the door on a larger hike at the upcoming meeting, and we have recently seen higher-than-expected moves by the Federal Reserve and other central banks.
Lagarde & Co. will be keeping a close eye on next week’s inflation reports out of Germany and France, the two largest economies in the eurozone. If inflation remains unchanged or dips lower, it will provide ammunition for the doves who are content with a 25bp move. Conversely, a rise in inflation will put pressure on the ECB to respond with a 50bp increase.
Another factor in the rate decision could be the exchange rate. A weak euro is attractive for exports but also contributes to inflation. The euro hasn’t been at parity with the US dollar since 2002, and some ECB members may feel that the central bank’s credibility is on the line if the euro continues to slide and falls below parity.
EUR/USD Technical
- EUR/USD tested support at 1.0124 and 1.0075 in the Asian session
- There is resistance at 1.0221 and 1.0324
EUR/USD Mid-Day Outlook
Daily Pivots: (S1) 1.0130; (P) 1.0175 (R1) 1.0207; More...
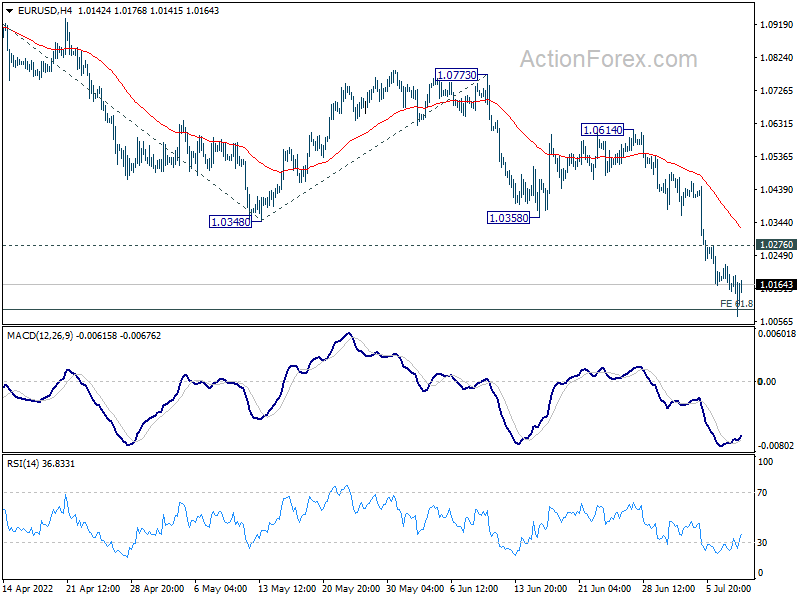
EUR/USD falls to as low as 1.0070 so far and met 1.0090 long term projection level. Intraday bias stays on the downside. Firm break of 1.0090 will target 100% projection of 1.1184 to 1.0348 from 1.0773 at 0.9937, which is close to parity. On the upside, above 1.0276 minor resistance will turn intraday bias neutral and bring consolidations first. But recovery should be limited below 1.0614 resistance to bring another fall.
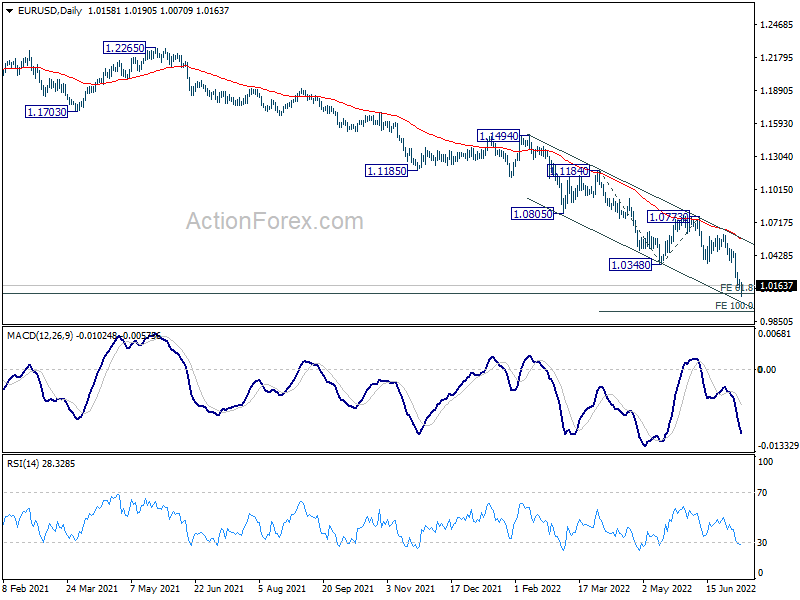
In the bigger picture, the break of 1.0339 long term support (2017 low) indicates resumption of whole down trend from 1.6039 (2008 high). Next target is 61.8% projection of 1.3993 to 1.0339 from 1.2348 at 1.0090. Sustained break there will pave the way to 100% projection at 0.8694. In any case, outlook will stay bearish as long as 1.0786 resistance holds, in case of recovery.
GBP/USD Mid-Day Outlook
Daily Pivots: (S1) 1.1945; (P) 1.1987; (R1) 1.2066; More...
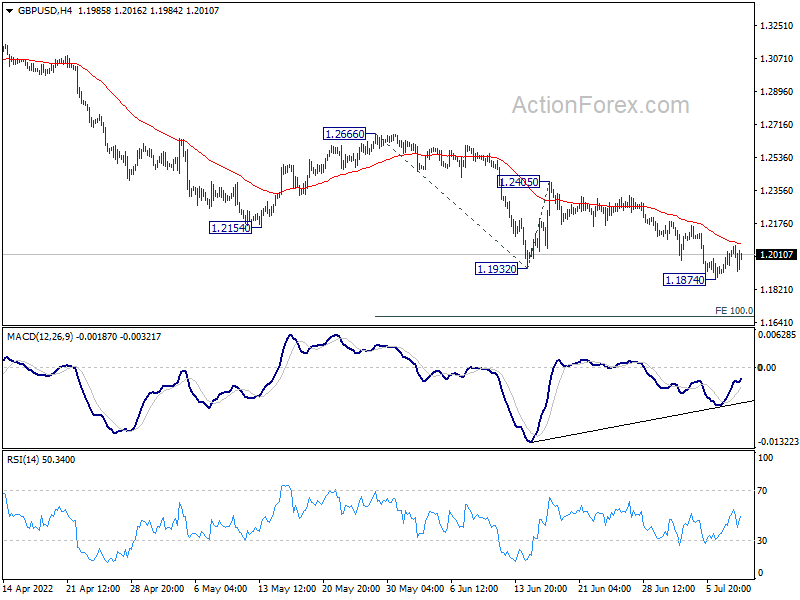
Intraday bias in GBP/USD stays neutral, and more consolidations could be seen above 1.1874. Outlook stays bearish as long as 1.2405 resistance holds. On the downside, break of 1.1874 will resume larger down trend to t 100% projection of 1.2666 to 1.1932 from 1.2405 at 1.1671. Break there will target 1.1409 long term support.
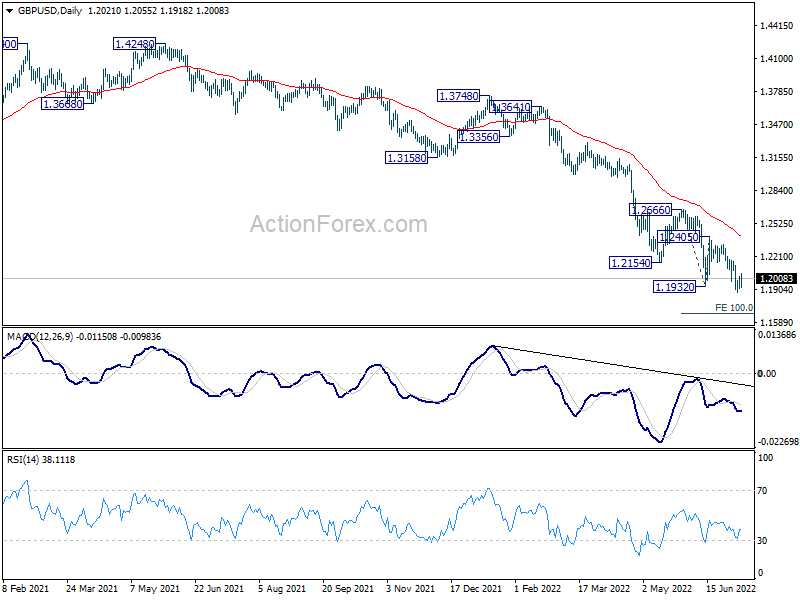
In the bigger picture, fall from 1.4248 (2018 high) could be a leg inside the pattern from 1.1409 (2020 low), or resuming the longer term down trend. Deeper decline is expected as long as 1.2666 resistance holds. Next target is 1.1409 low. However, firm break of 1.2666 will bring stronger rise back to 55 week EMA (now at 1.3103).
USD/CHF Mid-Day Outlook
Daily Pivots: (S1) 0.9699; (P) 0.9724; (R1) 0.9766; More...
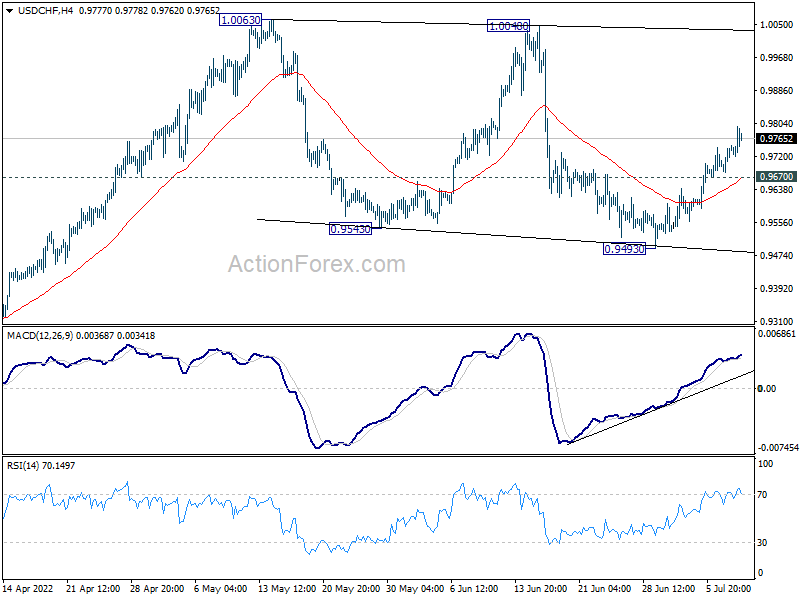
USD/CHF's break of 0.9731 resistance now suggests that consolidation pattern from 1.0063 has completed with three waves down to 0.9493. Intraday bias is back on the upside for retest 1.0063 high. Firm break there will resume larger up trend. On the downside, below 0.9670 minor support will dampen the bullish view and turn intraday bias neutral first.
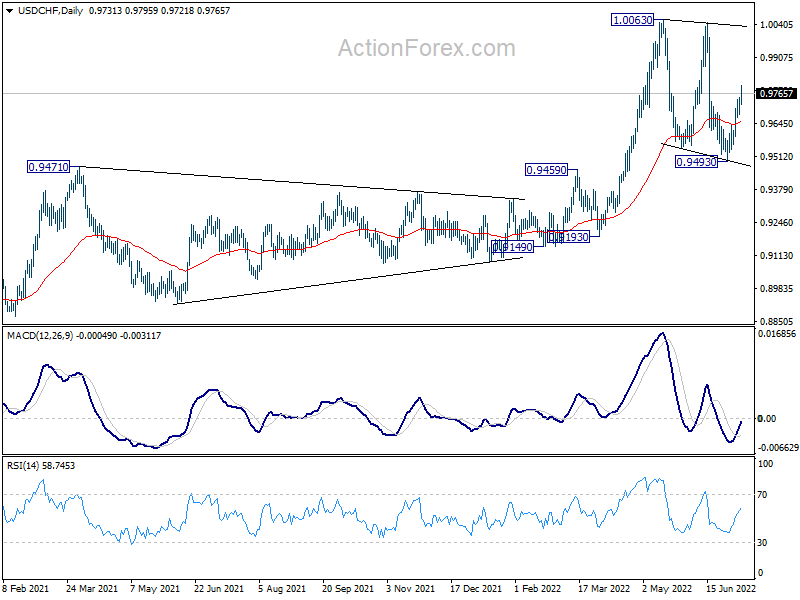
In the bigger picture, down trend from 1.0342 (2016 high) should have completed with three waves down to 0.8756 (2021 low) already. Rise from 0.8756 is likely a medium term up trend of its own. Next target is 1.0237/0342 resistance zone. This will remain the favored case as long as 0.9471 resistance turned support holds. However, sustained break of 0.9471 will extend long term range trading with another falling leg.
USD/JPY Mid-Day Outlook
Daily Pivots: (S1) 135.62; (P) 135.92; (R1) 136.29; More...
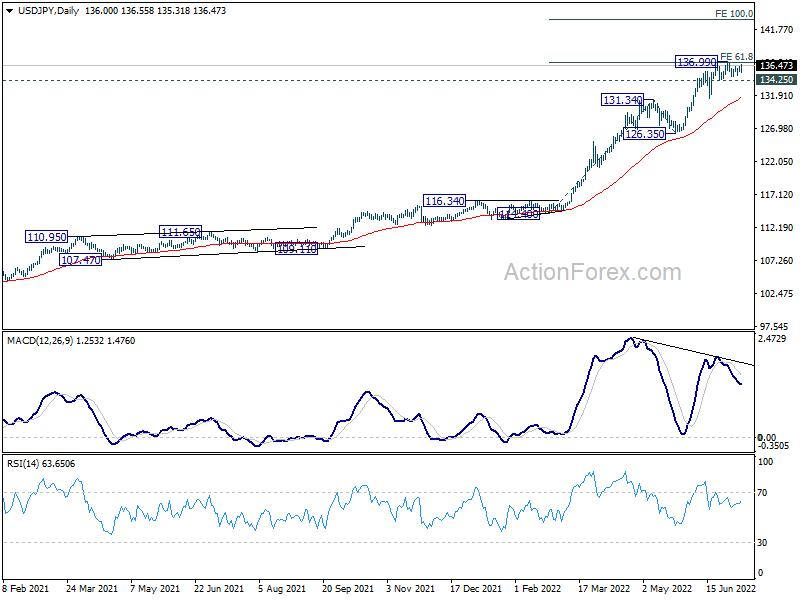
USD/JPY recovers but stays below 136.99 resistance. Intraday bias remains neutral first. On the upside, sustained break of 136.99 will resume larger up trend to 100% projection of 114.40 to 131.34 from 126.35 at 143.29. On the downside, however, break of 134.25 will turn bias to the downside for deeper pull back to 131.34 resistance turned support.
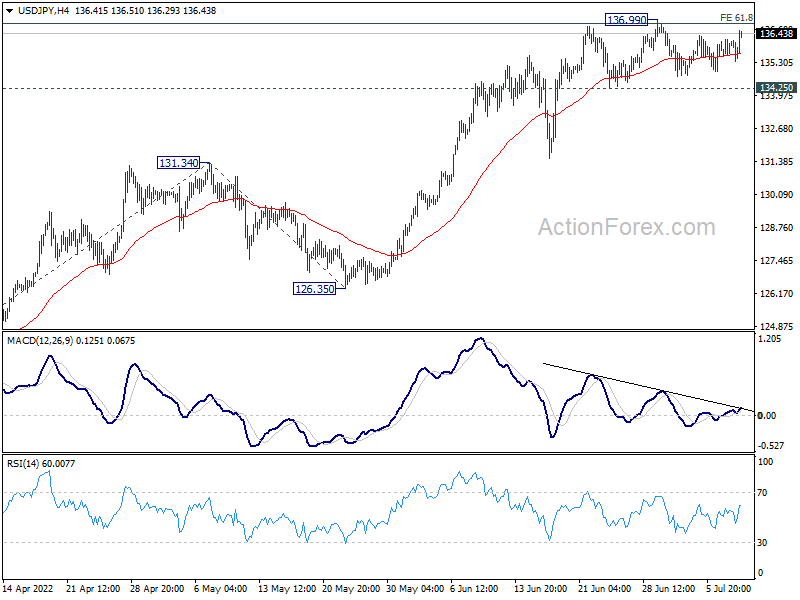
In the bigger picture, current rally is seen as part of the long term up trend from 75.56 (2011 low). Next target is 100% projection of 75.56 (2011 low) to 125.85 (2015 high) from 98.97 at 149.26, which is close to 147.68 (1998 high). This will remain the favored case as long as 126.35 support holds.
Dollar Rising Again on Strong NFP Data
Dollar rises in early US session after stronger than expected non-farm payroll data. It's also supported by extended rebound in 10-year yield, which reclaims 3%. Euro also follows German yield higher. On the other hand, Canadian Dollar turns softer after poor employment data. Yen is mixed after the tragic death of former Prime Minister Shinzo Abe.
In Europe, at the time of writing, FTSE is down -0.35%. DAX is up 0.65%. CAC is down -0.09%. Germany 10-year yield is up 0.033 at 1.298. Earlier in Asia, Nikkei rose 0.10%. Hong Kong HSI rose 0.38%. China Shanghai SSE dropped -0.25%. Singapore Strait Times rose 0.06%. Japan 10-year JGB yield dropped -0.0053 to 0.251.
US non-farm payroll grew 372k, unemployment rate unchanged at 3.6%
US non-farm payroll employment rose 372k in June, well above expectation of 250k. That's in line with the average monthly gain over the prior three months at 383k. Total non-farm employment was still down by 524k, or -0.3%, from pre-pandemic level in February 2020.
Unemployment rate was unchanged at 3.6%, matched expectations. Number of unemployed persons was essentially unchanged at 5.9m, comparing to prepandemic level at 5.7m in February 2020. Labor force participation rate ticked down form 62.3% to 62.2%.
Average hourly earnings rose 0.3% mom, matched expectations.
Canada employment dropped -43k, unemployment rate dropped to 4.9%
Canada employment dropped -43k, or -0.2% in June, much worse than expectation of 20k growth. Services-producing jobs dropped -76k while goods-producing jobs rose 33k.
Unemployment rate dropped from 5.1% to 4.9%, below expectation of 5.1%. Participation rate dropped -0.4% to 64.9%.
Total hours worked rose 1.3%. Average hourly waves rose 5.2% yoy.
USD/JPY Mid-Day Outlook
Daily Pivots: (S1) 135.62; (P) 135.92; (R1) 136.29; More...
USD/JPY recovers but stays below 136.99 resistance. Intraday bias remains neutral first. On the upside, sustained break of 136.99 will resume larger up trend to 100% projection of 114.40 to 131.34 from 126.35 at 143.29. On the downside, however, break of 134.25 will turn bias to the downside for deeper pull back to 131.34 resistance turned support.
In the bigger picture, current rally is seen as part of the long term up trend from 75.56 (2011 low). Next target is 100% projection of 75.56 (2011 low) to 125.85 (2015 high) from 98.97 at 149.26, which is close to 147.68 (1998 high). This will remain the favored case as long as 126.35 support holds.
Economic Indicators Update
| GMT | Ccy | Events | Actual | Forecast | Previous | Revised |
|---|---|---|---|---|---|---|
| 23:50 | JPY | Bank Lending Y/Y Jun | -0.50% | 0.90% | 0.70% | |
| 23:50 | JPY | Current Account (JPY) May | 0.01T | 0.16T | 0.51T | |
| 05:00 | JPY | Eco Watchers Survey: Current Jun | 52.9 | 55 | 54 | |
| 06:45 | EUR | France Trade Balance (EUR) May | -13.0B | -12.5B | -12.2B | -12.7B |
| 08:00 | EUR | Italy Industrial Output M/M May | -1.10% | -1.10% | 1.60% | 1.40% |
| 12:30 | CAD | Net Change in Employment Jun | -43.2K | 20.0K | 39.8K | |
| 12:30 | CAD | Unemployment Rate Jun | 4.90% | 5.10% | 5.10% | |
| 12:30 | USD | Nonfarm Payrolls Jun | 372K | 250K | 390K | 384K |
| 12:30 | USD | Unemployment Rate Jun | 3.60% | 3.60% | 3.60% | |
| 12:30 | USD | Average Hourly Earnings M/M Jun | 0.30% | 0.30% | 0.30% | 0.40% |
| 14:00 | USD | Wholesale Inventories May F | 2.00% | 2.00% |
Canada employment dropped -43k, unemployment rate dropped to 4.9%
Canada employment dropped -43k, or -0.2% in June, much worse than expectation of 20k growth. Services-producing jobs dropped -76k while goods-producing jobs rose 33k.
Unemployment rate dropped from 5.1% to 4.9%, below expectation of 5.1%. Participation rate dropped -0.4% to 64.9%.
Total hours worked rose 1.3%. Average hourly waves rose 5.2% yoy.
US non-farm payroll grew 372k, unemployment rate unchanged at 3.6%
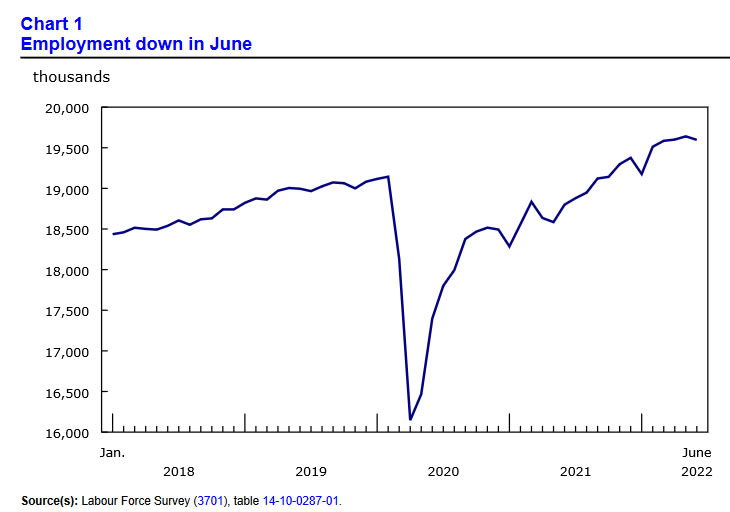
US non-farm payroll employment rose 372k in June, well above expectation of 250k. That's in line with the average monthly gain over the prior three months at 383k. Total non-farm employment was still down by 524k, or -0.3%, from pre-pandemic level in February 2020.
Unemployment rate was unchanged at 3.6%, matched expectations. Number of unemployed persons was essentially unchanged at 5.9m, comparing to prepandemic level at 5.7m in February 2020. Labor force participation rate ticked down form 62.3% to 62.2%.
Average hourly earnings rose 0.3% mom, matched expectations.
Euro Oversold, But Far from a Final Sell-off
The single currency fell to 1.0071 in the early European session on Friday. For EURUSD, it is a new low since December 2002 and a continuation of the massive sell-off that started last Tuesday.
Looking solely at the technical picture, the pressure on the EURUSD intensified after touching the 50-day average last Monday – the informal resistance line for the previous 13 months. The pair has been selling after several touches of this line since late February.
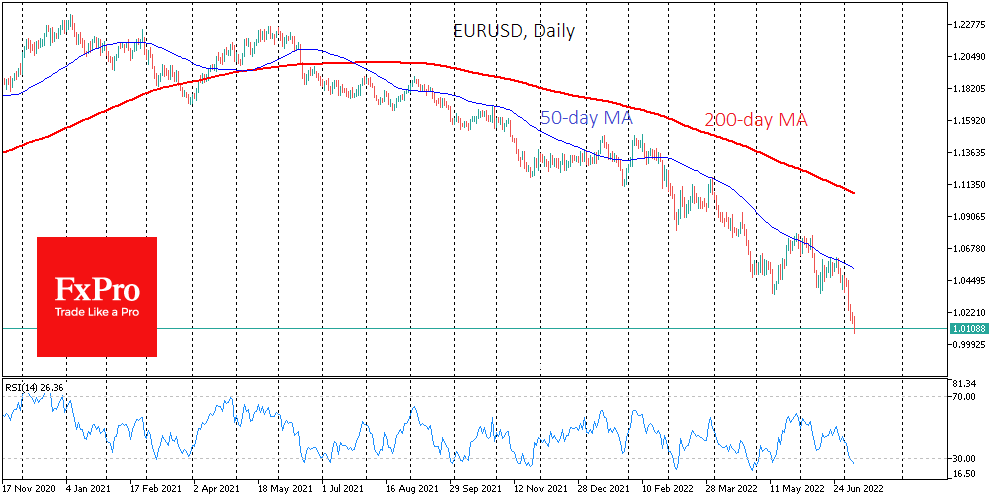
The parity is in a couple of steps, and so far, it is difficult to find any reason why the Euro might not fall below this psychological level. Furthermore, although the weaker Euro is pro-inflationary, policymakers in the Eurozone may see it as a tool for boosting export competitiveness.
Although EURUSD is over-sold in the short term on the daily charts, the pair’s break away from the trend has not been anything out of the ordinary in recent months, suggesting a relatively orderly sell-off.
The RSI index has entered oversold territory at weekly and monthly intervals. Contrary to the indicator’s logic, historically, we have seen an acceleration of the sell-off and not the rebound.
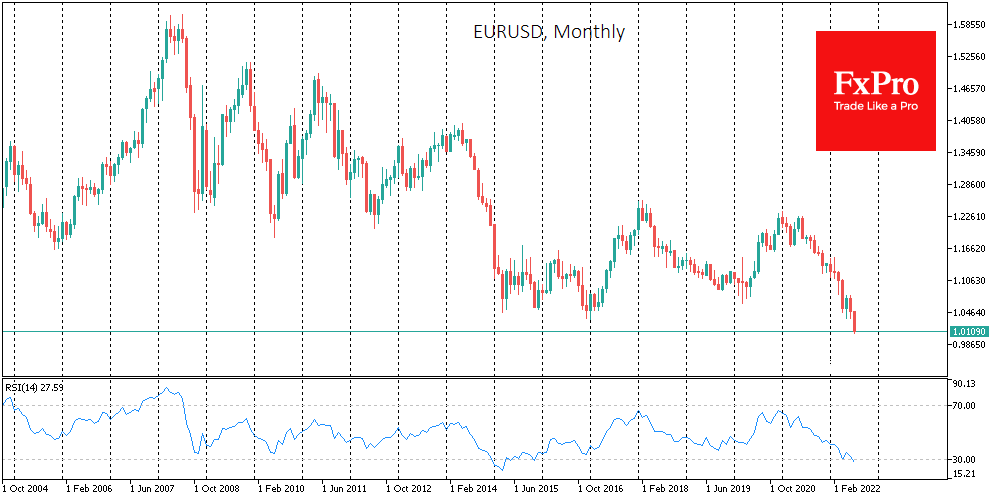
The Euro remains a falling knife, which is very dangerous to catch despite seeming oversold. The current strong trend is one of those cases where it is more prudent to wait for reliable signs of a reversal and not rush to “catch the bottom”.
EURUSD does not recover sharply from such devastating falls, as it is the most liquid pair, with tens of trillions of dollars in turnover. In 2000 and 2015, it took more than two years for the EURUSD to recover above levels where it fell into oversold territory on the RSI monthly charts in a month. A reliable signal, in this case, was the divergence of the price chart and the said index.
The following important stop for the EURUSD looks like the area of 0.97, where the pair might find itself before the end of the month. However, we should not be surprised if the decline continues up to 0.85-0.87 and lasts for another 2-4 quarters.