Sample Category Title
Yen Selloff Resumes, RBNZ and BoC to Hike This Week
Yen's selloff resumes in Asian session with USD/JPY making new recent high. The ruling coalition of Liberal Democratic Party and its junior partner Komeito scored a strong victory in Japan's upper house elections. There might be sympathetic votes for the tragic death of former Prime Minister Shinzo Abe. But it's also seen as a nod to Abe's legacy on bringing Japan back as a "normal" country with stronger military and alliance with the US. Dollar is currently the stronger one, followed by Swiss Franc and then Kiwi. On the other hand, Aussie is the second weakest following Yen, followed by Sterling.
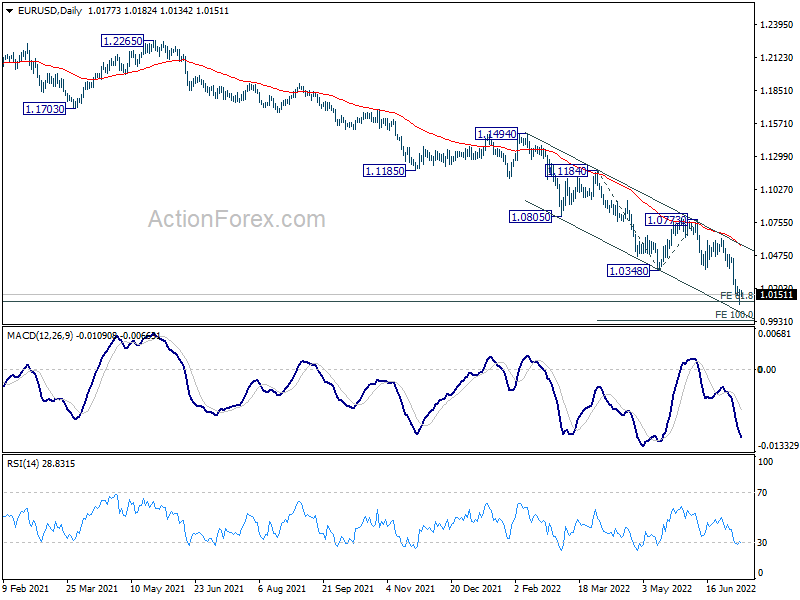
Technical, a major focus for the week is on whether EUR/USD's down trend would pick up more momentum from the current level. The key level to watch is parity. Break of 1.0348 support turned resistance will be the first sign of stabilization, and bring consolidations. But sustained break of parity could prompt even deeper selloff, risking more downside acceleration.
In Asia, at the time of writing, Nikkei is up 1.26%. Hong Kong HSI is down -2.74%. China Shanghai SSE is down -1.46%. Singapore Strait Times is up 0.06%. Japan 10-year JGB yield is down -0.005 at 0.246.
BoJ Kuroda: We won't hesitate to take additional monetary easing steps as necessary
BoJ Governor Haruhiko Kuroda warned of the "very high uncertainty" on economic outlook due to surging commodity prices. While the economy is showing some signs of weakness, overall it's still picking up as a trend.
"We won't hesitate to take additional monetary easing steps as necessary," he added, repeating that short- and long-term interest rate targets to "move at current or lower levels."
Released from Japan, M2 rose 3.3% yoy in June versus expectation of 3.4% yoy. Machine orders dropped -5.6% mom in May, versus expectation of -5.5% mom.
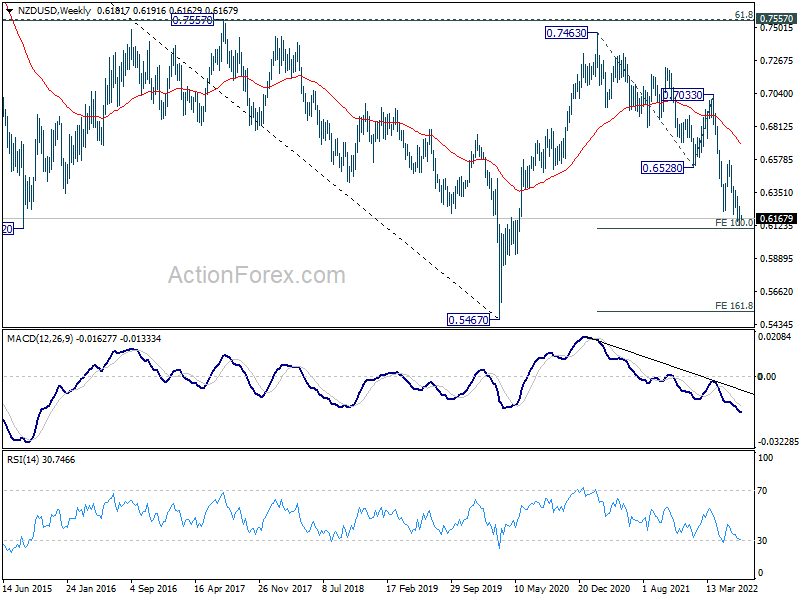
NZD/USD in tight range, eyeing support from 0.6098 projection level
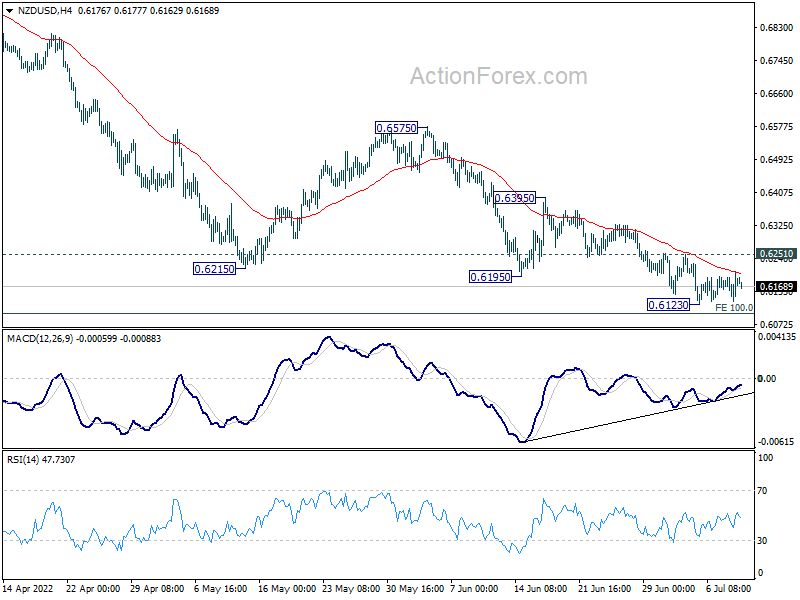
NZD/USD is staying in tight range above 0.6123 temporary low, looking forward to RBNZ rate hike later in the week. There is prospect of a rebound from medium term projection level at 0.6098 (100% projection of 0.7463 to 0.6528 from 0.7033). But break of 0.6251 minor resistance is needed to be the first sign of bottoming, while firm break of 0.6395 resistance is needed to confirm. However, sustained break of 0.6098 would risk more downside acceleration to 161.% projection at 0.5520, which is close to 0.5467 (2020 low).
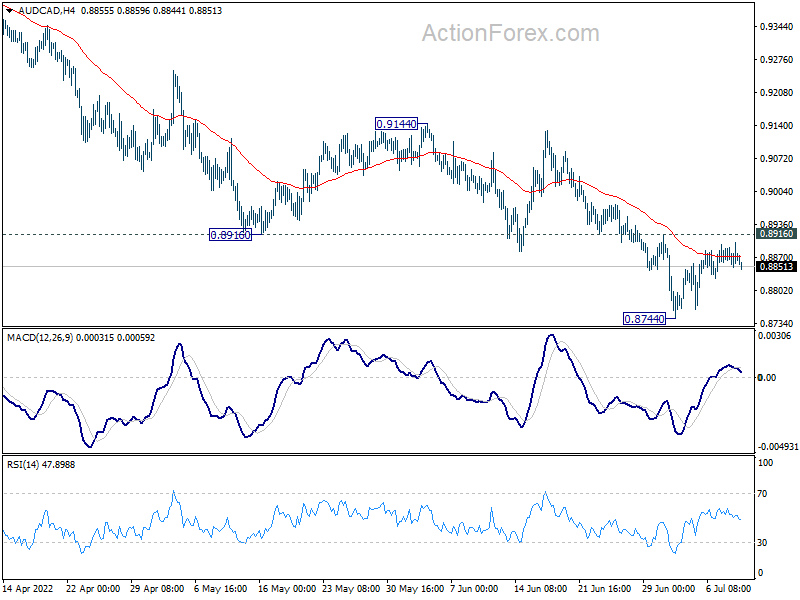
AUD/CAD staying in down trend, risks more downside
Canadian Dollar has been outperforming other commodity currencies recently and stays generally firm. There is prospect of further rally in the Loonie if BoC opts for a 75bps rate hike this week, instead of 50bps.
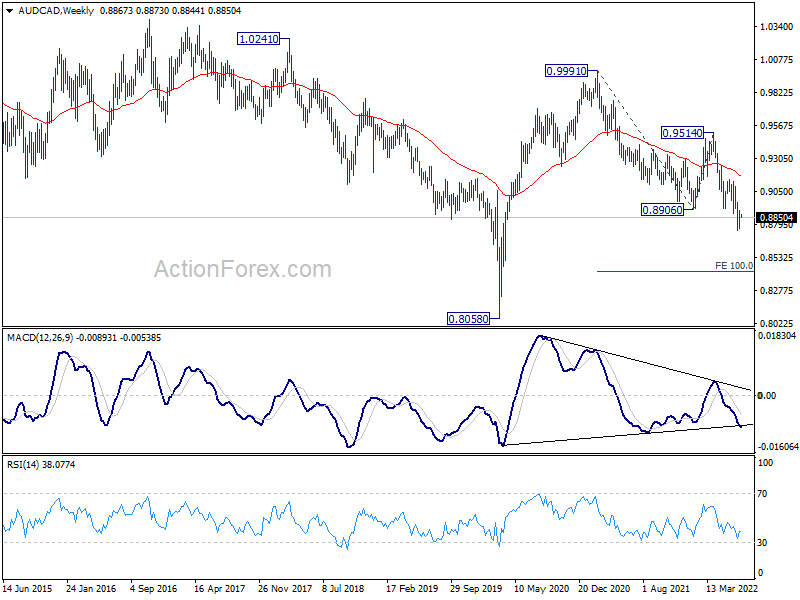
Looking at AUD/CAD, it's staying well in the down trend from 0.9991 (2021 high). Outlook stays bearish as long as 0.8916 minor resistance holds. Break of 0.8744 temporary low will indicate down trend resumption. Next medium term target will be 100% projection of 0.9991 to 0.8906 from 0.9514 at 0.8429.
Nevertheless, firm break of 0.8916 will indicate short term bottoming and bring stronger rebound first.
RBNZ and BoC rate hike, US CPI and retail sales
Two central banks are expected to deliver rate hikes this week. RBNZ should raise the official cash rate by another 50bps to 2.50%. According to RBNZ's own forecast variables in May, OCR could reach as high as 3.9% in Q2 2023, before gradually falling back in the second half of 2024. There is little that suggests RBNZ would deviate from is. So, a hawkish stance should be maintained.
Opinions on whether BoC would hike by 50bps or 75bps this week is divided. Governor Tiff Macklem noted back in June 9, "we may need to take more interest rate steps to get inflation back to target. Or we may need to move more quickly, we may need to take a larger step." But ti's unsure whether that would really translate into a larger hike this time. BoC will also publish new monetary policy report with economic projections.
On the data front, US CPI and retail sales will probably catch most attention. But attention will also be on Germany ZEW, UK GDP, and a batch of data from China, including trade balance, GDP, retail sales and industrial production. Here are some highlights for the week:
- Monday: Japan machine orders; Italy retail sales.
- Tuesday: Japan PPI; Australia Westpac consumer sentiment, NAB business confidence; Germany ZEW.
- Wednesday: RBNZ rate decision; China trade balance; Germany CPI final; UK GDP, productions, trade balance; Eurozone industrial production; US CPI; BoC rate decision; Fed's Beige Book.
- Thursday: Australia inflation expectations, employment; Swiss PPI; Canada manufacturing sales; US PPI, jobless claims.
- Friday: New Zealand BusinessNZ manufacturing; China GDP, retail sales, industrial production, fixed asset investment; Japan tertiary industry index; Eurozone trade balance; Canada wholesales sales; US retail sales, Empire State manufacturing, import prices, industrial production, U of Michigan consumer sentiment, business inventories.
USD/JPY Daily Outlook
Daily Pivots: (S1) 135.42; (P) 136.00; (R1) 136.66; More...
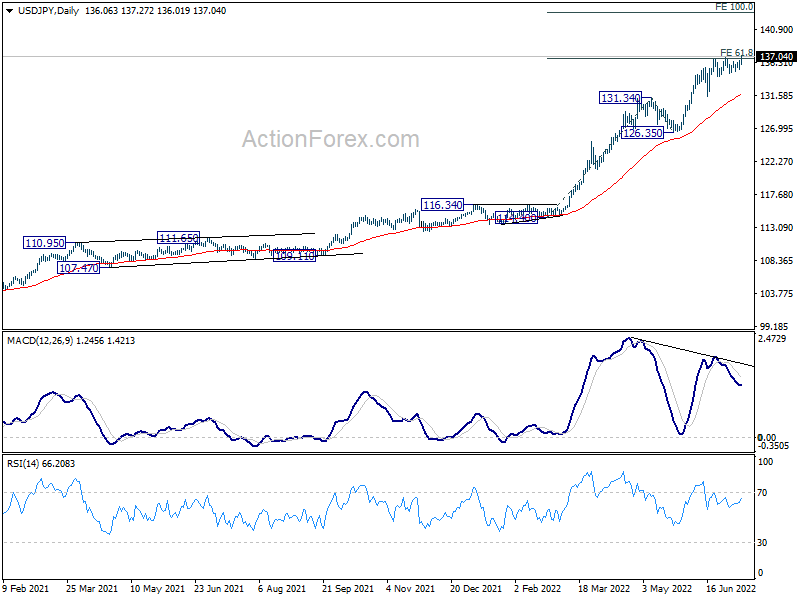
Break of 136.99 suggests up trend resumption in USD/JPY and intraday bias is back on the upside. Sustained trading above 136.99 will confirm and target 100% projection of 114.40 to 131.34 from 126.35 at 143.29. For now, outlook will remain bullish as long as 134.73 support holds, in case of retreat.
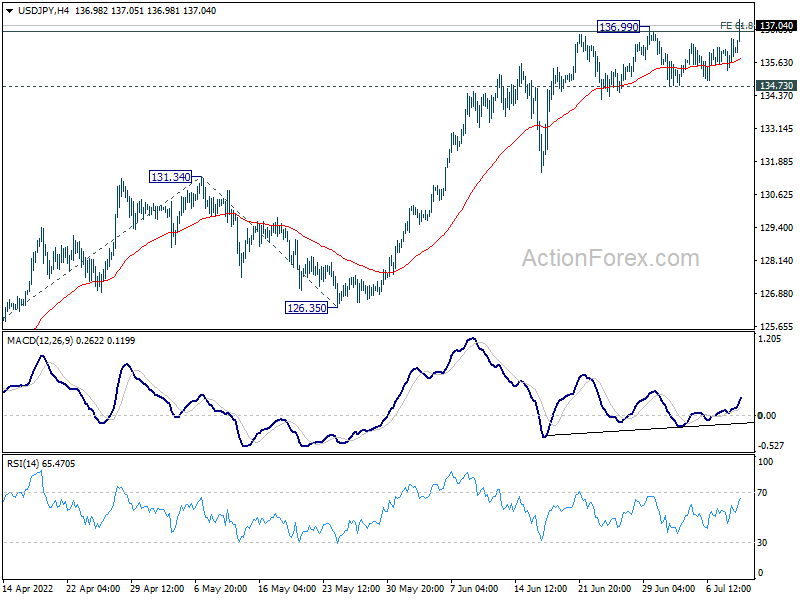
In the bigger picture, current rally is seen as part of the long term up trend from 75.56 (2011 low). Next target is 100% projection of 75.56 (2011 low) to 125.85 (2015 high) from 98.97 at 149.26, which is close to 147.68 (1998 high). This will remain the favored case as long as 126.35 support holds.
Economic Indicators Update
| GMT | Ccy | Events | Actual | Forecast | Previous | Revised |
|---|---|---|---|---|---|---|
| 23:50 | JPY | Money Supply M2+CD Y/Y Jun | 3.30% | 3.40% | 3.20% | 3.10% |
| 23:50 | JPY | Machinery Orders M/M May | -5.60% | -5.50% | 10.80% | |
| 06:00 | JPY | Machine Tool Orders Y/Y Jun P | 23.70% | |||
| 08:00 | EUR | Italy Retail Sales M/M May | 0.70% | 0.00% |
AUD/CAD staying in down trend, risks more downside
Canadian Dollar has been outperforming other commodity currencies recently and stays generally firm. There is prospect of further rally in the Loonie if BoC opts for a 75bps rate hike this week, instead of 50bps.
Looking at AUD/CAD, it's staying well in the down trend from 0.9991 (2021 high). Outlook stays bearish as long as 0.8916 minor resistance holds. Break of 0.8744 temporary low will indicate down trend resumption. Next medium term target will be 100% projection of 0.9991 to 0.8906 from 0.9514 at 0.8429.
Nevertheless,firm break of 0.8916 will indicate short term bottoming and bring stronger rebound first.
NZD/USD in tight range, eyeing support from 0.6098 projection level
NZD/USD is staying in tight range above 0.6123 temporary low, looking forward to RBNZ rate hike later in the week. There is prospect of a rebound from medium term projection level at 0.6098 (100% projection of 0.7463 to 0.6528 from 0.7033). But break of 0.6251 minor resistance is needed to be the first sign of bottoming, while firm break of 0.6395 resistance is needed to confirm. However, sustained break of 0.6098 would risk more downside acceleration to 161.% projection at 0.5520, which is close to 0.5467 (2020 low).
BoJ Kuroda: We won’t hesitate to take additional monetary easing steps as necessary
BoJ Governor Haruhiko Kuroda warned of the "very high uncertainty" on economic outlook due to surging commodity prices. While the economy is showing some signs of weakness, overall it's still picking up as a trend.
"We won't hesitate to take additional monetary easing steps as necessary," he added, repeating that short- and long-term interest rate targets to "move at current or lower levels."
Forex and Cryptocurrencies Forecast
EUR/USD: One Step to 1.0000
We have repeatedly written about the dollar's desire to achieve parity with the euro 1:1. But we did not expect that this could happen so quickly: the EUR/USD pair found a local bottom at the level of 1.0071 on Friday, July 08. Only 71 points remained until 1.0000. The last time it was so low was in December 2002.
The week's high was recorded at 1.0462. Thus, the US currency squeezed out the European currency by almost 400 points from July 04 to July 8. And there are two reasons for this.
The first is the general strengthening of the dollar, whose DXY index has renewed 20-year highs and reached a height of 107.77 on July 08. As before, the main reason for such dynamics lies in the tightening of the monetary policy (QT) of the US Central Bank. The minutes of the June meeting of the FOMC (Federal Open Market Committee) published on Wednesday, July 06 confirmed once again the regulator's desire to curb inflation at any cost. The main tool here should be a sharp increase in the refinancing rate for federal funds. Recall that the rate was raised immediately by 0.75% in June, for the first time since 1994. As follows from the FOMC minutes, the members of the Committee believe that the rate will be increased by another 50-75 basis points at the next meeting on July 27.
Recall that the head of the Fed, Jerome Powell, who participated in the ECB forum in the Portuguese city of Sintra, assured the audience that the US economy is well positioned to cope with the active tightening of monetary policy, which is being implemented by his department.
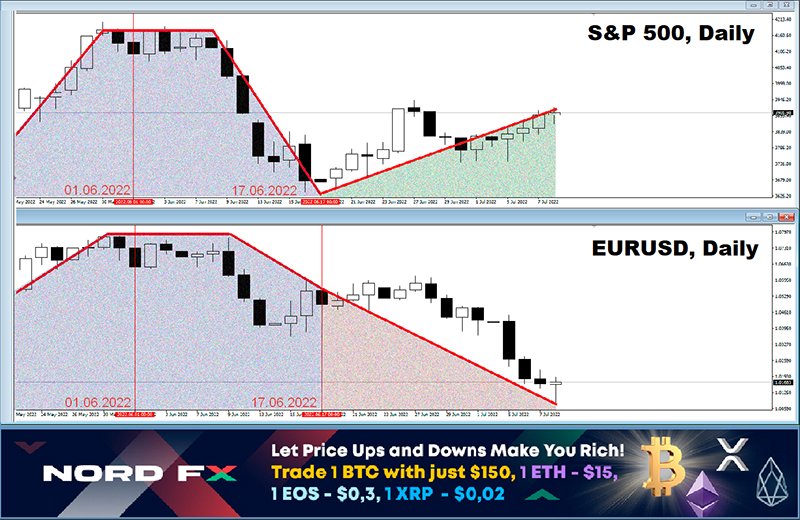
It should be noted here that there is a rather rare situation in the markets when US stock indices also grow along with the growth of the dollar. Thus, the S&P500 grew by 7.5% (from 3635.60 to 3910.60) since June 17, and the Dow Jones - by 6.1% (29646.60 to 31463.00). The reason for this, most likely, is that investors invest part of the dollars received from the sale of the euro, other currencies, as well as risky assets of other countries, in shares of American companies. And this is despite the fact that Jerome Powell made it clear at the press conference in Sintra that a recession in the US economy is inevitable, and the Federal Reserve Bank of Atlanta announced that US GDP could decline by 2.1% in the current quarter. But, apparently, the situation in other countries is even worse, so investors have very limited choice.
The second factor putting pressure on the EUR/USD pair is the problems of the European economy related to the sanctions imposed on Russia because of its armed invasion of Ukraine, which threaten the EU with a protracted energy crisis.
ECB President Christine Lagarde said a week ago that "inflation expectations in the Eurozone are much higher than before", that "we are unlikely to return to conditions of low inflation soon", and that the regulator "will go as far as necessary to reduce inflation to the target of 2%". But less than a few days later, Bundesbank chief Joachim Nagel urged the ECB to be extremely cautious in terms of tightening monetary policy, as raising interest rates would push the eurozone's weakest economies to the brink of bankruptcy. As a result, the market decided that the regulator would raise the key rate very slowly and responded to the words of Joachim Nagel with an even more active sale of the euro.
It should be noted that the release of macro statistics has recently become just an excuse for a correction or, conversely, for a return to the general bearish trend: in total, the pair has lost about 2,200 points since January 2021, and the fall has been more than 5,800 points since July 2008. After a small correction, the last chord sounded at the level of 1.0177 last week. At the time of writing the review, on the evening of July 08, the voices of experts are divided as follows: 65% of experts expect the resumption of movement to the south, 15% side with the bulls and 20% cannot decide on the forecast. The indicator readings on D1 give a completely unambiguous signal: all 100% of oscillators and trend indicators are colored red. The only thing worth noting is that 15% of the oscillators are in the oversold zone.
With the exception of support at 1.0160 and last week's low at 1.0071, bears' task No.1 is to celebrate the victory by hitting 1.0000. With a certain degree of probability, due to inertia, the pair may fall even lower, to a strong support/resistance zone of 200, 0.9900-0.9930. In this case, the level of 1.0000 will have to be attacked not by bears, but by bulls. Although this may not happen. Suffice it to recall 2017, when, having fallen to 1.0340, the EUR/USD pair reversed and soared to 1.2555. The immediate target of the bulls is a return to the zone 1.0350-1.0450, then there are zones 1.0450-1.0600 and 1.0625-1.0760. If successful, the bulls will try to rise to the 1.0750-1.0770 zone, the next target is 1.0800.
As for the economic calendar for the coming week, Wednesday 13 July can be highlighted, when data from the consumer markets in Germany and the US will arrive. Another portion of macro statistics can be expected on Friday, July 15, when retail sales and the US University of Michigan Consumer Confidence Index become known.
GBP/USD: Battle for 1.2000
Unlike the collapsed euro, the GBP/USD managed to cling to the 1.2000 level. Having started the week at 1.2095, it first rose to 1.2164, then fell to 1.1875, but eventually managed to complete the five-day period at 1.2030. This is despite the political crisis in the UK and the statement of a number of ministers, including Prime Minister Boris Johnson himself, about their resignation.
Other factors, including economic ones, logically, should also put downward pressure on the pound. Problems related to Brexit are among them. Recall that there is a bill in the country's Parliament that allows to unilaterally change the customs procedures between Britain and Northern Ireland, which had been agreed as part of the deal to exit the EU. In response, the outraged foreign ministers of Germany and Ireland have already accused the United Kingdom of violating international agreements and predicted the severing of most trade ties between the countries.
The highest inflation in 40 years is also depressing. And although the UK is much less dependent on Russian energy supplies than the EU, this does not exclude the possibility that inflation in the country by November could exceed 11%, pushing the economy into a deep recession.
However, this threat may have served as support for the pound, as it pushes the Bank of England (BOE) to tighten monetary policy more quickly. Thus, the hawkish statements of the leadership of the British regulator, made on Thursday, July 07, stopped the fall of the GBP/USD pair and even managed to reverse it to the north.
First, a member of the Monetary Policy Committee (MPC) Katherine Mann said that the uncertainty about the inflationary process strengthens the arguments in favor of an outstripping increase in interest rates. And soon the Chief Economist of the Bank of England, Hugh Pill, announced that, if necessary, he was ready to accept a faster pace of tightening the policy of the Central Bank.
At the moment, 60% of experts believe that the GBP/USD pair will continue to decline in the near future, 15%, on the contrary, expect a rebound upwards, and 25% have taken a neutral position.
The readings of the indicators on D1 are as follows. Among the trend indicators on D1, the ratio of forces is 85:15% in favor of the reds. Among the oscillators, the advantage of the bears is slightly less: 75% indicate a fall, the remaining 25% have turned their eyes to the north. The nearest support is at 1.2000, followed by the 1.1875-1.1930 zone. The mid-term target for the bears could be the March 2020 low of 1.1409. In case of growth, the pair will meet resistance in the zones and at the levels of 1.2100, 1.2160-1.2175, 1.2200-1.2235, 1.2300-1.2325, 1.2400-1.2430, 1.2460, then the targets in the area of 1.2500 and 1.2600 follow.
As for the macroeconomic calendar for the UK, we advise you to pay attention to Tuesday, July 12, when the speech of the head of the Bank of England Andrew Bailey is expected. Data on manufacturing production and GDP of the UK will be published the next day, Wednesday, on July 13.
USD/JPY: The Calm Before the Storm?
USD/JPY did not renew its 24-year high for the first time in five weeks. As we predicted, it took a breather, spent five days in the trading range 134.77-136.55 and ended it at 136.06.
Recall that the bulls failed to take the height of 137.00 on June 29, stopping just one step away from it: at the level of 136.99. Will they go on a new assault? The number of supporters of such a scenario among the surveyed experts turned out to be... 5%. 35% are waiting for the side trend to continue. The majority of analysts (60%) are still counting on a decisive downward movement of the pair: what if, finally, the long-awaited dream of Japanese importers and housewives finally comes true, and the yen goes on the offensive, regaining the status of a sought-after safe-haven currency?
For indicators on D1, the picture is very different from the opinion of experts. For oscillators, 65% are green, 10% are red, and the remaining 25% are neutral. For trend indicators, 100% point north.
The nearest support is at 135.50, the next one is at 134.75, followed by zones and levels at 134.00, 133.50, 133.00, 132.30, 131.50, 129.70-130.30, 128.60 and 128.00. Apart from overcoming the immediate resistance at 136.35 and taking the height of 137.00, it is difficult to determine further targets for the bulls. Most often, such round levels as 137.00, 140.00 and 150.00 appear in the forecasts. And if the pair's growth rates remain the same as in the last 3 months, it will be able to reach the 150.00 zone in late August or early September.
No important events, be it the release of macroeconomic statistics or political factors, are expected in Japan this week. The only thing to note is the speech by the head of the Bank of Japan, Haruhiko Kuroda, on Monday, July 11. However, one should not expect any sensational statements from him.
CRYPTOCURRENCIES: Run or Wait?
Fight for $20,000 does not subside for more than three weeks. At times, it seemed that a catastrophe was imminent, and the BTC/USD pair would fly further into the abyss in a moment. Moreover, some analysts predicted that it would lose another 50-80% of the current value. And Robert Kiyosaki, author of the bestselling book Rich Dad Poor Dad, predicted an even more powerful collapse, by 95%, to $1,100. But the bulls have managed to hold this front line so far.
We already wrote that $20,000 is historically the most important level for the main cryptocurrency. Suffice it to recall the disaster of December 2017, when bitcoin approached this mark, reaching a height of $19,270, and then collapsed by 84%. True, the attack on $20,000 came from the south then, and it is from the north now.
Some crypto enthusiasts are still trying to insist on the independence of the digital asset market. They believe that the reason for the large-scale sale of coins and the collapse of the market three times was the collapse of a number of projects. But, in our opinion, the causal relationship is violated in this statement. In fact, global risk aversion is at the heart of all the problems. Frightened by the expectation of a global recession and a sharp tightening of the US Federal Reserve's monetary policy, they are actively getting rid of all risky assets. Global stock markets are under pressure from sellers, which is clearly seen on the charts of such stock indices as S&P500, Dow Jones and Nasdaq Composite, with which BTC is in direct correlation. Where they go, bitcoin goes, and there has long been no talk of any independence of it. It was these global problems of the world economy that led to the collapse of a number of important crypto projects, which, in turn, only increased panic among digital asset holders.
Analyzing the situation, Former hedge fund manager Cramer & Co and host of CNBC's Mad Money show Jim Cramer announced the US Fed has won a "remarkable victory" in the fight against cryptocurrencies. "There is a front in the war against inflation with the Fed's outstanding victory: it's a battle against financial speculation. [...] The work on destroying cryptocurrencies is almost complete, but they don't seem to know about it yet," he said.
According to Glassnode, bitcoin's record price decline in June almost took the rest of the "market tourists" out of the game, leaving only hodlers "at the front". In the context of monthly dynamics, the situation was worse only in 2011. The number of daily active addresses has dropped from over 1 million in November to the current 870,000. The growth rate of the number of participants decreased to the anti-records of 2018-19. and do not currently exceed 7,000 new users per day.
The largest outflow is recorded among institutional investors (companies with investments from $1 million), public miners (expanding production on credit), as well as speculators and casual players. Institutions withdrew a record $188 million from crypto funds in June, and the volume of "illiquid supply" rose to the highest level since July 2017 at 223,000 BTC.
Thanks to a correction in the US stock market, bitcoin managed to rise above $20,000 last week. At the time of writing this review (Friday evening, July 08), the coin is trading in the $21,800 zone. The total capitalization of the crypto market is $0.966 trillion ($0.876 trillion a week ago). The Crypto Fear & Greed Index has slightly improved over the week, rising from 11 to 20 points, but is still in the Extreme Fear zone.
What is the future of the main cryptocurrency? According to Timothy Peterson, investment manager at Cane Island Alternative Advisors, the price of bitcoin will continue to fall in the coming months under the pressure of the American factor. According to the expert's calculations, the probability of a recession in the United States has increased to 70%, respectively, capital will continue to leave risky assets, and the BTC price may collapse by 20% or even 40% by the end of summer. Recall that, according to Arcane Research researchers, the potential for a decrease in the price of bitcoin remains until the level of $10,350.
The financier Michael Burry, who predicted the 2007 mortgage crisis, also admits that the current market situation is only the middle of a bearish cycle. This investor, who became the prototype of the hero of the movie "The Big Short", believes that the first cryptocurrency can continue to fall. «Adjusted for inflation, 2022 first half S&P500 down 25-26%, and Nasdaq down 34-35%, Bitcoin down 64-65%. That was multiple compression. Next up, earnings compression. So, maybe halfway there," wrote Burry.
Deutsche Bank specialists believe that the price of bitcoin may rise to the level of $28,000 only by the end of 2022. And they also attribute this growth with the growth of the US stock market. In their opinion, the Nasdaq-100 and S&P500 indices will be able to recover to January levels by the end of the year and pull bitcoin with them.
The forecast of Nikolaos Panigirtsoglou, a representative of another bank, JPMorgan strategist, looks quite accurate. He admits that the worst of the bear market may be over now, as the strong players in the crypto industry "rescue" the weak ones to contain the "infection". The specialist could have in mind the interest of the FTX cryptocurrency exchange in buying the BlockFi landing platform. The media also mentioned the online broker Robinhood as a target for the takeover. Previously, the FTX exchange supported the cryptocurrency broker Voyager Digital. Panigirtzoglou also added that "the echoes of the deleveraging process will continue for some time yet," citing the default of hedge fund Three Arrows Capital.
Crypto trader Rekt Capital is waiting for the market to run out of sellers at some point, and long-term investors will be able to buy BTC in a price range that offers the maximum reward. "Historically, the 200-week moving average has been considered a bottom indicator for BTC. Things may be a little different in the current cycle. Instead of bottoming out at the SMA200, bitcoin could form a macro range below it. In fact, anything below will represent a peak buying opportunity," wrote Rekt Capital.
The trader noted that while bitcoin remains in a strong downtrend, the prerequisites for a new bull cycle will eventually open up: "Bitcoin may still be in the acceleration phase downtrend, and it will precede the stage of multi-month consolidation, followed by the stage of a new upward macro trend."
All of the above forecasts indicate that it will take at least several months to wait for a new bullish rally. But former stockbroker Jordan Belfort advises to be patient not for months, but for years. "If you look beyond the 24-month horizon, you can definitely make money if you're lucky. If you take a three- or five-year period, I will be shocked if you do not make money, because the basic principles of bitcoin are unshakable," he said, explaining that the supply of the first cryptocurrency is limited to 21 million digital coins, and inflation in the world continues to grow.
Recall that earlier Jordan Belfort was convicted of fraud related to the securities market. His memoir inspired director Martin Scorsese to create the famous film The Wolf of Wall Street. But if earlier this broker violated the law, now he actively advocates for a clear regulation of crypto assets.
Charlie Erith, CEO of investment firm ByteTree, shared a view similar to Belfort's. Like The Wolf of Wall Street, he looked far into the future, identifying bitcoin and gold as important components of long-term investment portfolios. Not because they are guaranteed to increase in price, but because they work as insurance against mistakes in an era of inflation. However, according to the financier, much will depend on the policy of the US Federal Reserve and other central banks.
EUR/USD Weekly Outlook
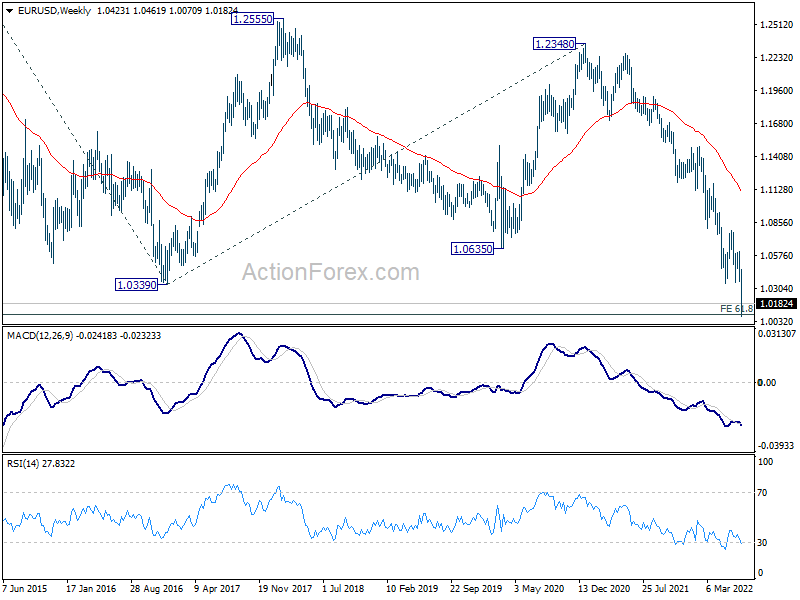
EUR/USD's long term down trend finally resumed last week and hit as long as 1.0070, meeting long term projection level at 1.0090. A temporary low was formed and initial bias is turned neutral this week first. Some consolidations could be seen but upside should be limited by 1.0358 support turned resistance to bring another fall. Break of 1.0070 will target 100% projection of 1.1184 to 1.0348 from 1.0773 at 0.9937, which is close to parity.
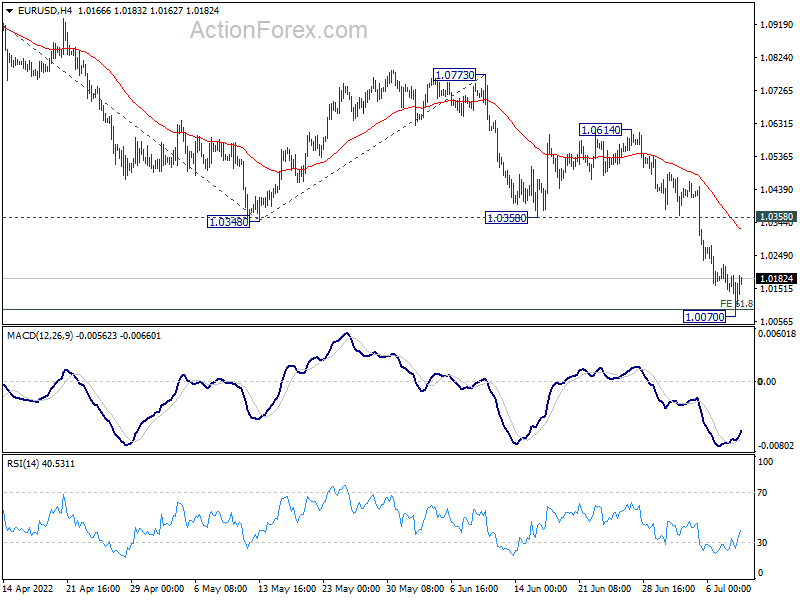
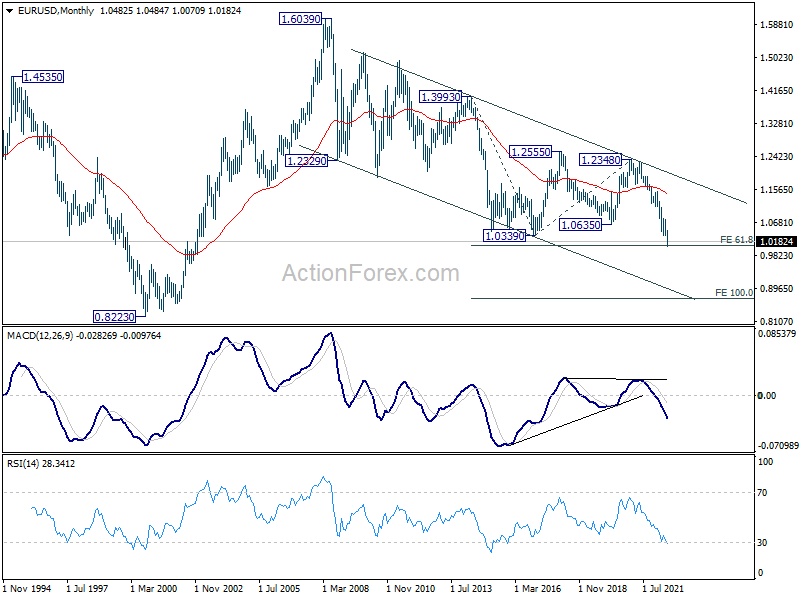
In the bigger picture, the break of 1.0339 long term support (2017 low) indicates resumption of whole down trend from 1.6039 (2008 high). Sustained break of 61.8% projection of 1.3993 to 1.0339 from 1.2348 at 1.0090 will pave the way to 100% projection at 0.8694. In any case, outlook will stay bearish as long as 1.0773 resistance holds, in case of rebound.
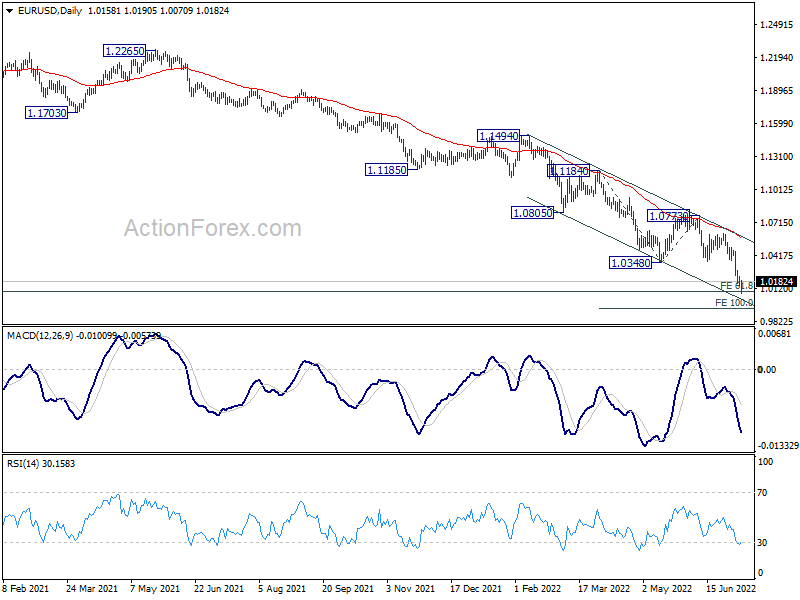
In the long term picture, long term down trend from 1.6039 (2008 high) resuming. Sustained break of 61.8% projection of 1.3993 to 1.0339 from 1.2348 at 1.0090 will pave the way to 100% projection at 0.8694.
USD/JPY Weekly Outlook
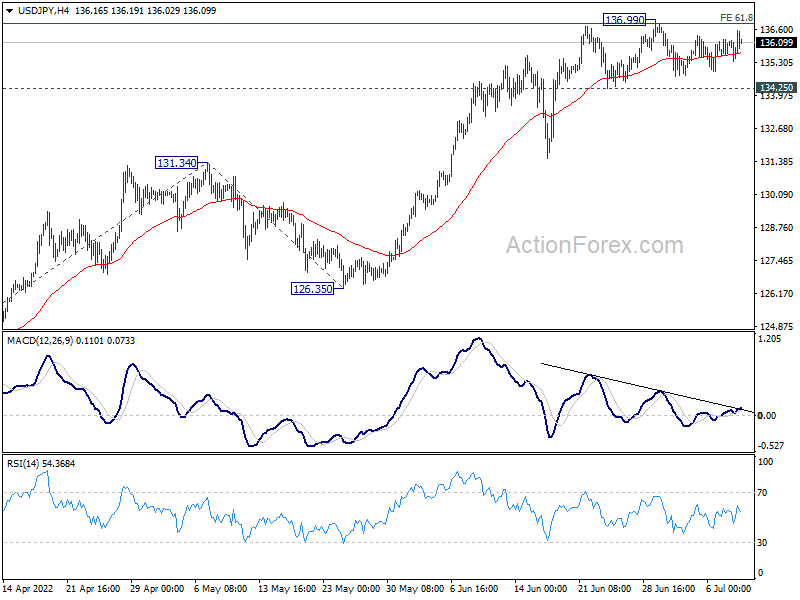
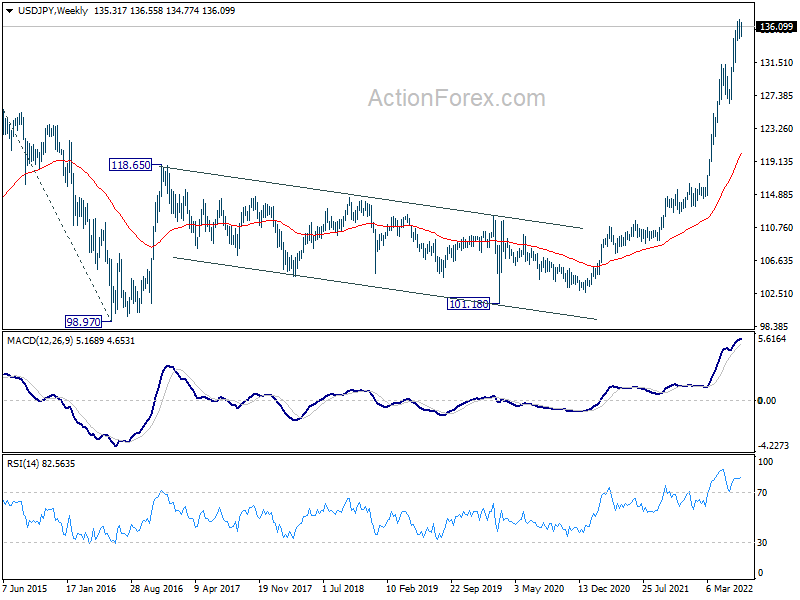
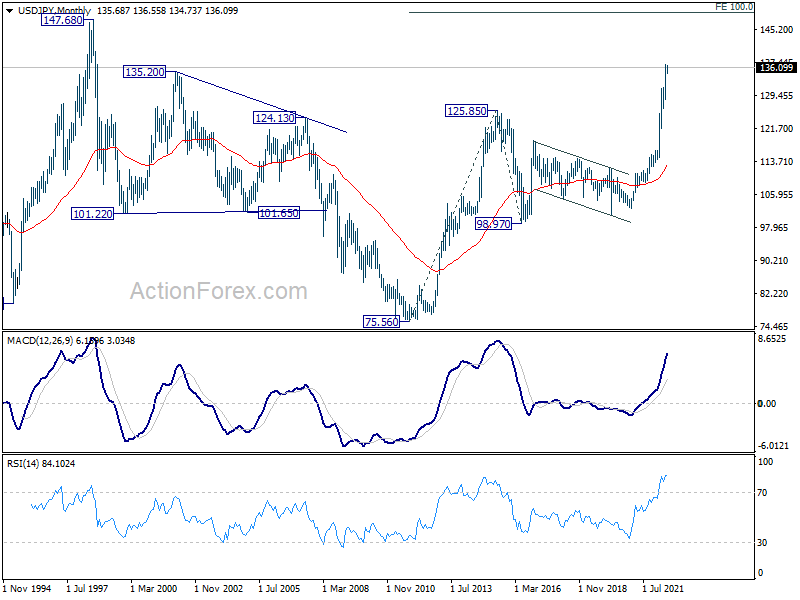
USD/JPY stayed in range below 136.99 last week and outlook is unchanged. Initial bias remains neutral this week first. On the upside, sustained break of 136.99 will resume larger up trend to 100% projection of 114.40 to 131.34 from 126.35 at 143.29. On the downside, however, break of 134.25 will turn bias to the downside for deeper pull back to 131.34 resistance turned support.
In the bigger picture, current rally is seen as part of the long term up trend from 75.56 (2011 low). Next target is 100% projection of 75.56 (2011 low) to 125.85 (2015 high) from 98.97 at 149.26, which is close to 147.68 (1998 high). This will remain the favored case as long as 126.35 support holds.
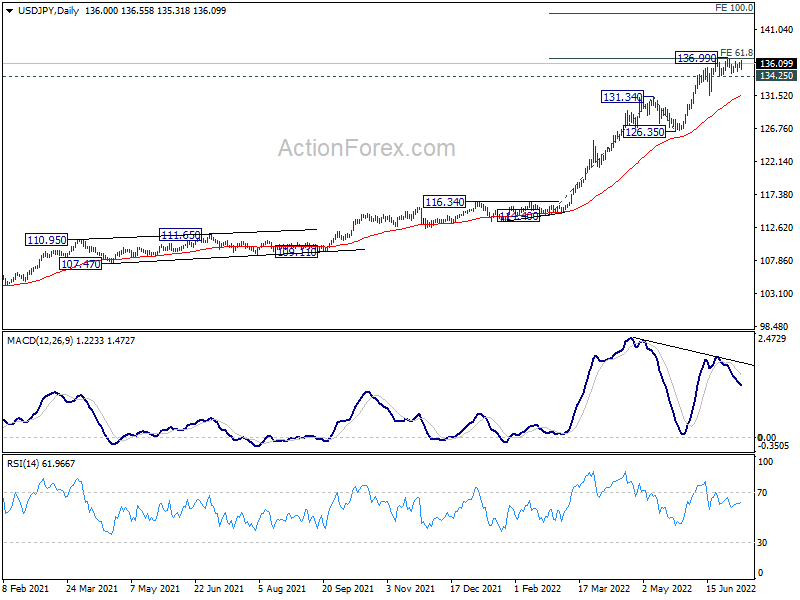
In the long term picture, the up trend from 75.56 (2011 low) long term bottom to 125.85 (2015 high) has just resumed. Next target is 100% projection of 75.56 (2011 low) to 125.85 (2015 high) from 98.97 at 149.26, which is close to 147.68 (1998 high).
GBP/USD Weekly Outlook
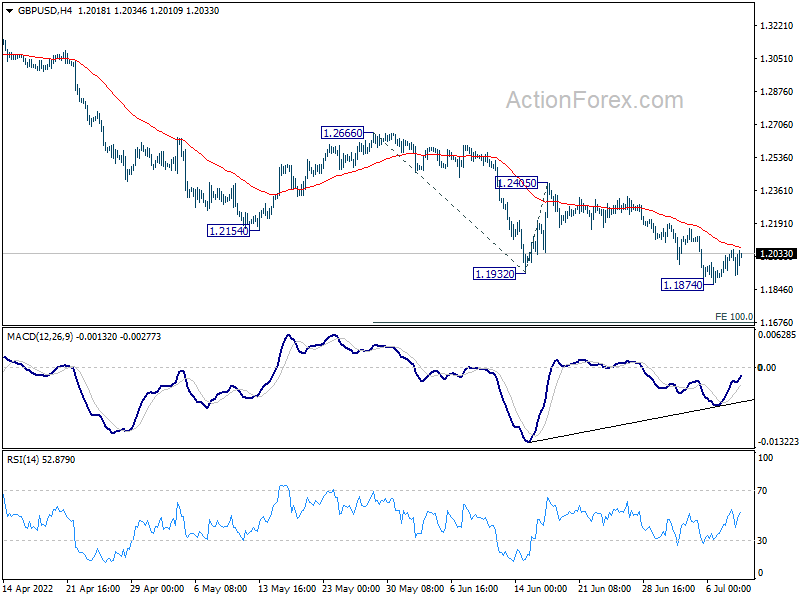
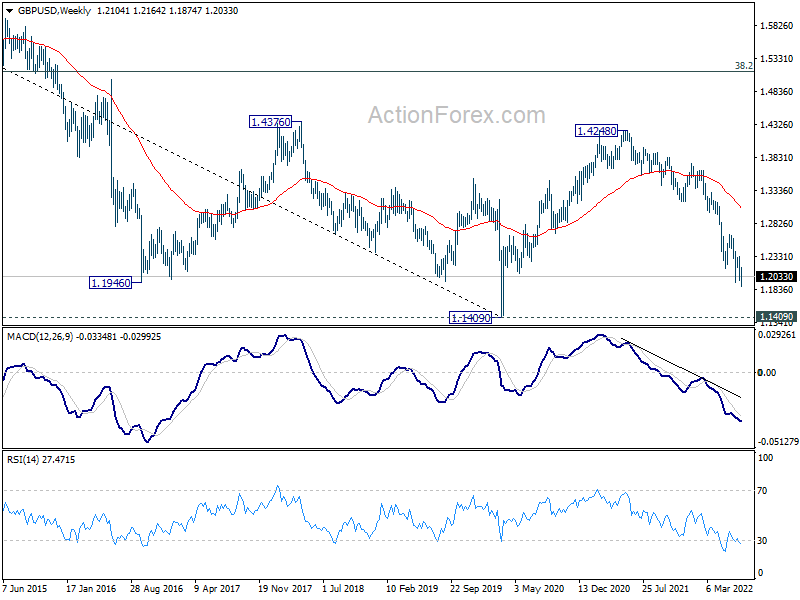
GBP/USD's down trend resumed last week and edged lower to 1.1874, but recovered since then. Initial bias remains neutral this week for some consolidations first. Outlook stays bearish as long as 1.2405 resistance holds. On the downside, break of 1.1874 will resume larger down trend to t 100% projection of 1.2666 to 1.1932 from 1.2405 at 1.1671. Break there will target 1.1409 long term support.
In the bigger picture, fall from 1.4248 (2018 high) could be a leg inside the pattern from 1.1409 (2020 low), or resuming the longer term down trend. Deeper decline is expected as long as 1.2666 resistance holds. Next target is 1.1409 low. However, firm break of 1.2666 will bring stronger rise back to 55 week EMA (now at 1.3065).
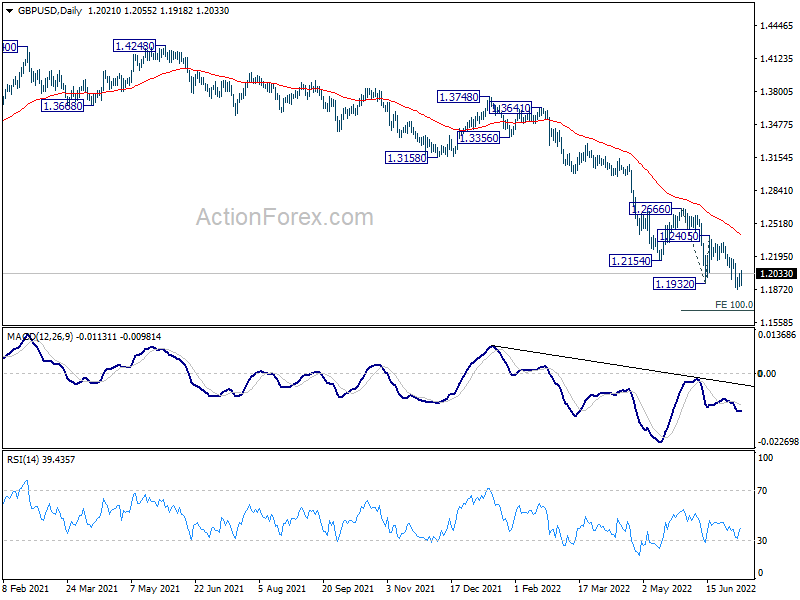
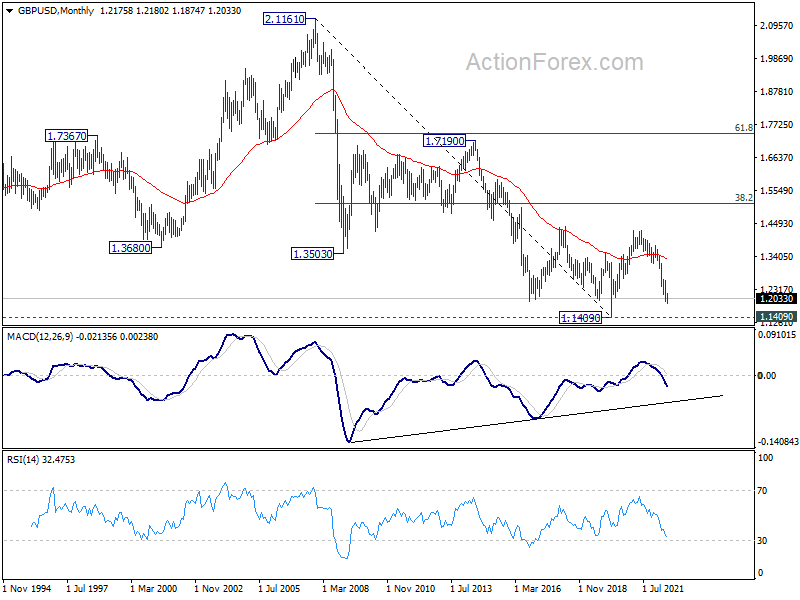
In the longer term picture, rebound from 1.1409 long term bottom should have completed at 1.4248 already, well ahead of 38.2% retracement of 2.1161 to 1.1409 at 1.5134. The development argues that price actions from 1.1409 are developing into a corrective pattern only. That is, long term bearishness is retained for resuming the down trend from 2.1161 (2007 high) at a later stage.
USD/CHF Weekly Outlook
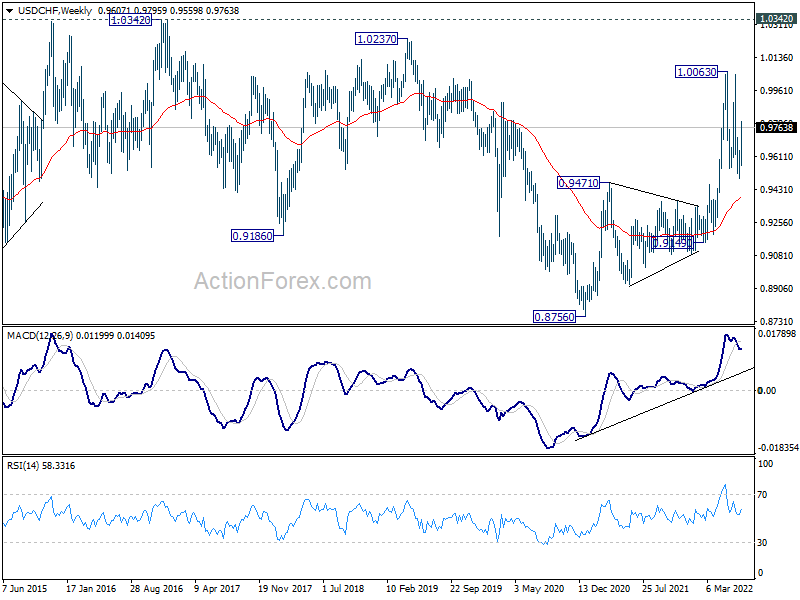
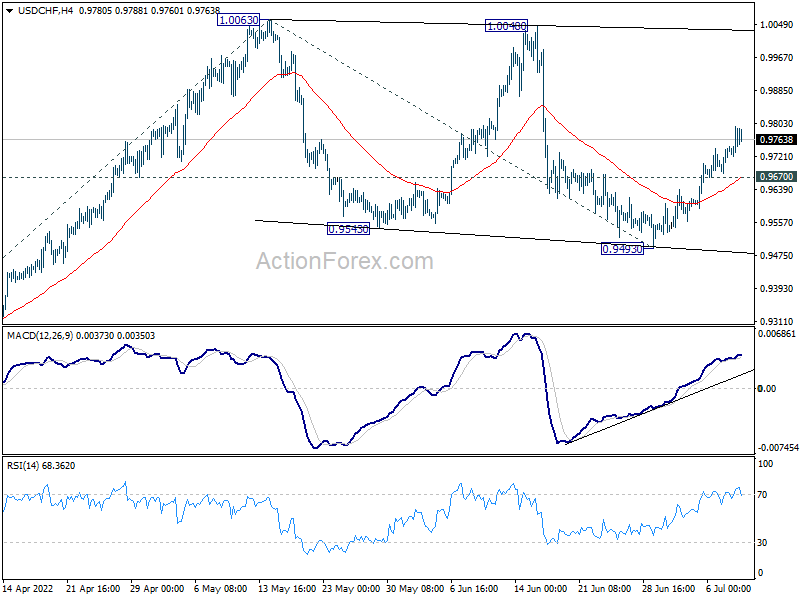
USD/CHF's rebound from 0.9493 extended higher last week. The development argues that consolidation pattern from 1.0063 high has completed with three waves down to 0.9493 already. Initial bias stays on the upside this week for retesting 1.0063 first. Decisive break there will resume larger up trend. On the downside, break of 0.9670 minor support will dampen this bullish view and turn intraday bias neutral first.
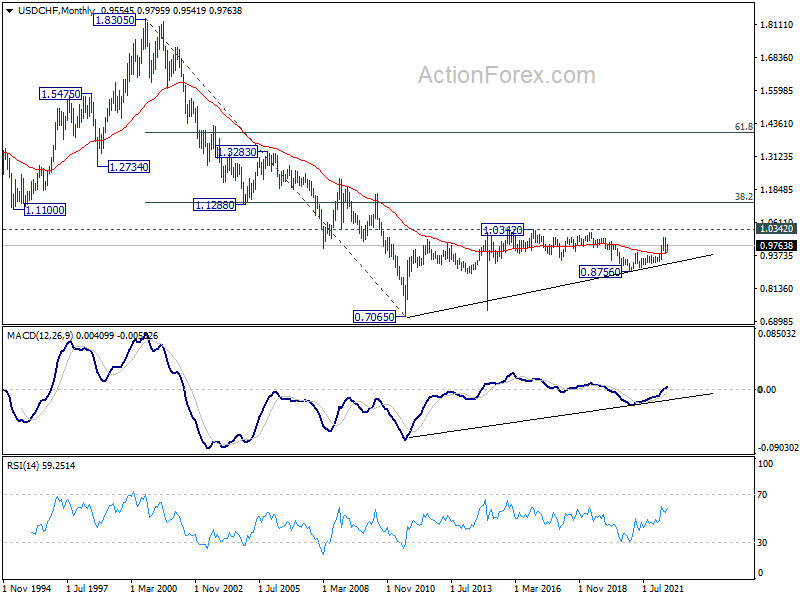
In the bigger picture, medium term up trend from 0.8756 (2021 low) is still in progress. Next target is 1.0342 (2016 high). Sustained break there will resume long term up trend from 0.7065 (2011 low). This will remain the favored case as long as 0.9471 resistance turned support holds.
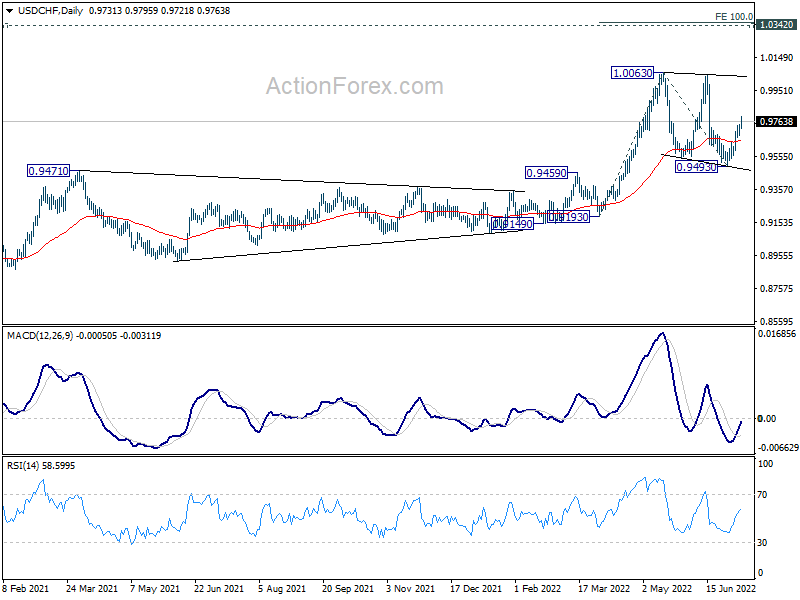
In the long term picture, current development argues that the correction from 1.0342 (2016 high) has completed at 0.8756 (2020 low) already. Rise from 0.7065 (2011 low) might be ready to resume. Firm break of 1.0342 will confirm and target 38.2% retracement of 1.8305 (2000 high) to 0.7065 at 1.1359.