Sample Category Title
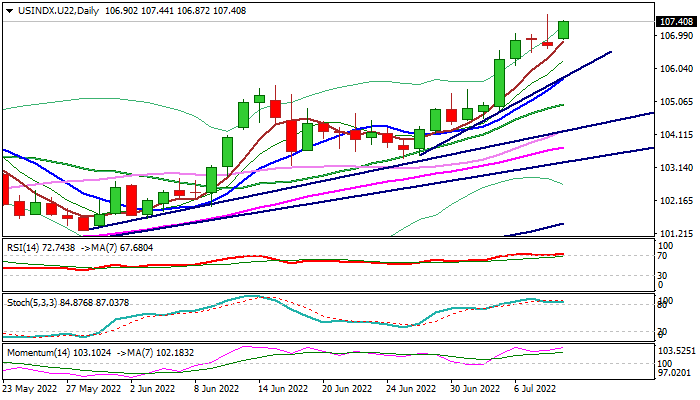
Dollar Index: Dollar Remains Supported by Hawkish Fed and Global Growth Fears
Bulls return to play on Monday after a brief consolidation on Thu/Fri and eye new 20-year high at 107.60, as dollar remains well supported by global growth concerns, weak Euro and strong signals that the Fed will remain on strong hawkish path.
Traders focus on US June inflation report (due on Wednesday) as inflation is expected to rise further that would add to Fed’s hawkish stance ahead of policy meeting at the end of the month.
Probe through Dec 2002 peak at 107.31 requires close above this level to confirm bullish signal and expose next target at 108.74 (Oct 2002 peak) and 109.67 (Sep 2002), which guards psychological 110 barrier.
Bullish daily studies support the action, but overbought conditions warn that bulls may face headwinds.
Rising 5 DMA offers immediate support at 106.82, followed by bull-trendline off 103.49 (June 28 trough) at 106.00, which should keep the downside protected and maintain strong bullish bias
Res: 107.60; 108.74; 109.67; 110.00.
Sup: 106.82; 106.27; 106.00; 105.75.
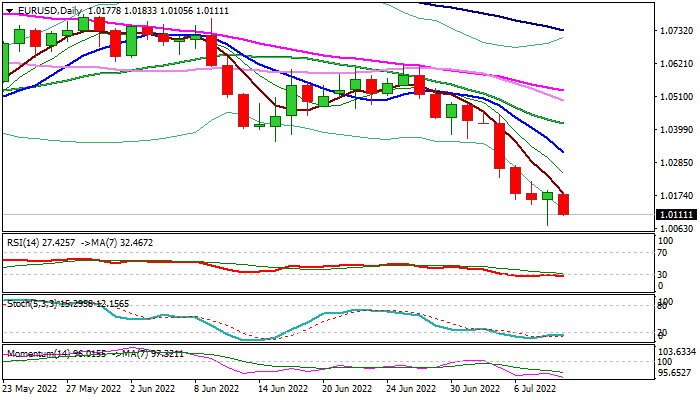
EUR/USD: Bears Keep Control But May Delay Final Push Towards Parity on Oversold Studies
The Euro remains in red at the start of the week after 2.2% drop last week and pressures new 2022 low (1.0071), also near Fibo 76.4% of 0.8225/1.6039 (1.0069), where bears faced headwinds on Friday.
Oversold conditions on daily chart and Friday’s hammer candle suggest that bears may struggle at this zone, however very limited upside action signals that downside pressure remains strong.
Last Friday’s jobs data showed that US labor sector remains tight and add to Fed’s decision for further aggressive approach to policy tightening that continues to lift dollar and keep Euro in strong defensive.
Firm break of Fibo support at 1.0069 would open way towards parity and risk drop towards 0.9607 (Sep 2002 low).
Res: 1.0154; 1.0191; 1.0221; 1.0275.
Sup: 1.0069; 1.0000; 0.9859; 0.9607.
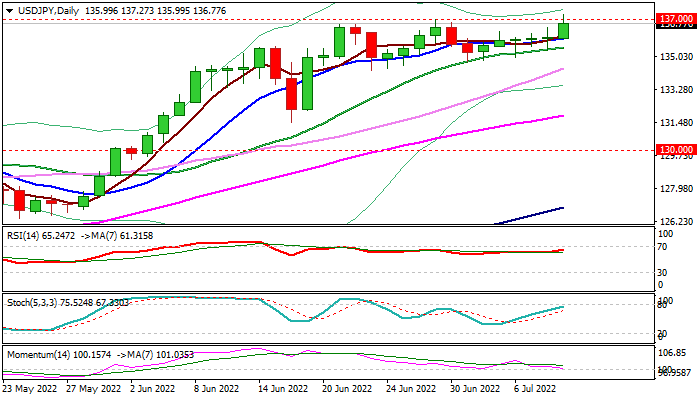
USD/JPY Hits New 24-Year High on Solid NFP and Dovish BoJ
The USDJPY regained traction on Monday and rose to new 24-year high on probe through recent range top at 137.00.
The dollar gained support from Friday’s better-than-expected US jobs data, while pressure on yen increased after BoJ reaffirmed its ultra-easy monetary policy.
Sustained break of 137.00 pivot is needed to trigger stops parked above and signal continuation of larger uptrend towards 140 zone (Sep 1998 high / psychological).
Although fundamentals are supportive, technical studies on daily chart are losing bullish momentum and weeklies are overbought that warns of difficulties bulls may face at 137 resistance zone.
Prolonged range trading should hold above daily Tenkan-sen (136.01) to keep immediate bias with bulls and keep intact next pivotal supports at 135.49 (20DMA) and 134.30 (recent range floor).
Res: 137.00; 137.27; 137.63; 138.21.
Sup: 136.01; 135.49; 134.74; 134.49.
Daily Technical Analysis
EUR/USD
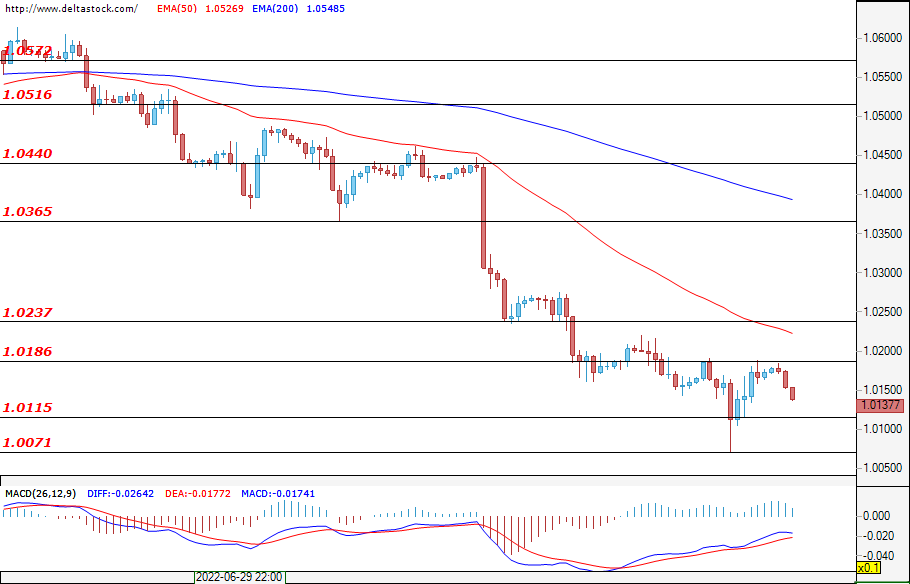
The euro posted its second straight week of losses against the U.S. dollar. The bears managed to break the annual support around 1.0350 and the breakout has not yet been tested. The market is in a strong downtrend and for now the bulls are unable to even trigger a deep pullback. On Friday, the pair was close to parity with a low at 1.0071. The recovery was then capped by the resistance at 1.0186, with the bearish pressure likely to continue. First daily support for the pair is 1.0115 and the next one is the low at 1.0071. This week, the market may test the breakout of the 1.0350 zone, but it will also need support from the macro environment to trigger a rally. Sentiment remains negative and the more likely scenario for the pair is a decline to 1.0071 and 1.0000 subsequently. No significant events are expected in the economic calendar today.
USD/JPY
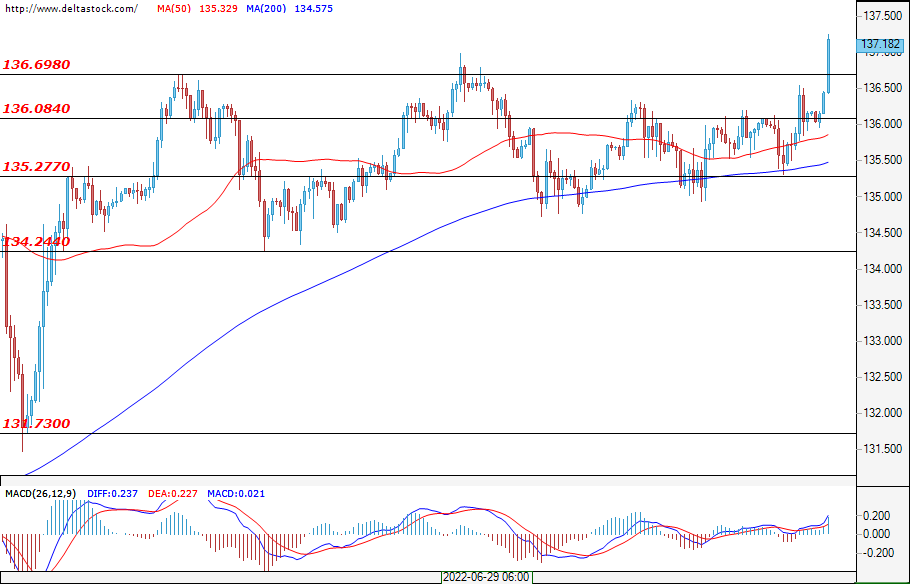
The dollar demonstrated strength against the Japanese yen and early this morning the pair broke through the resistance at 136.70. Expectations are for a test of the breakout zone. If the breakout is validated, a rally to 138.00 is possible. In its attempts to limit bond yields, the Bank of Japan appears to have lost control of the currency markets, and they are clearly reflecting the stress from credit markets. In a longer term, an attack on the top of the summer of 1998 at 146.80 is not excluded. In alternative scenarios and the rally petering out, the break of 136.70 could prove to be false. For now, there are no fundamental factors to reverse the uptrend, but technically a deeper correction to 131.70 can be observed. First supports for the bulls are 136.70, 136.00, 135.30 and the most important of the series is at 134.24.
GBP/USD
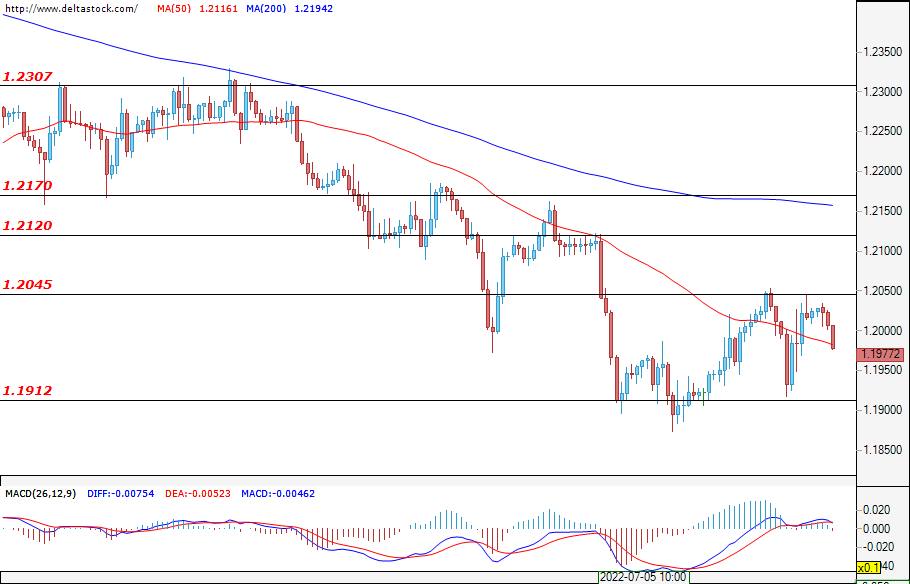
The Sterling is also struggling against the strong dollar. Last week, declines remained limited around support at 1.1910, with this area also being the first daily support. First resistance for the bulls is the area around 1.2045 and the weekly resistance is at 1.2170. The downtrend remains strong and any rallies should be sold off. If the 1.1910 support is broken, a drop to 1.1700 can be expected. The higher frames show that prices are still above the annual support around 1.1910, which does not rule out deep corrections. If the Sterling follows the Euro weakness, this zone could be broken, opening the door for deeper declines towards 1.1470 - the March 2020 low.
EUGERMANY40
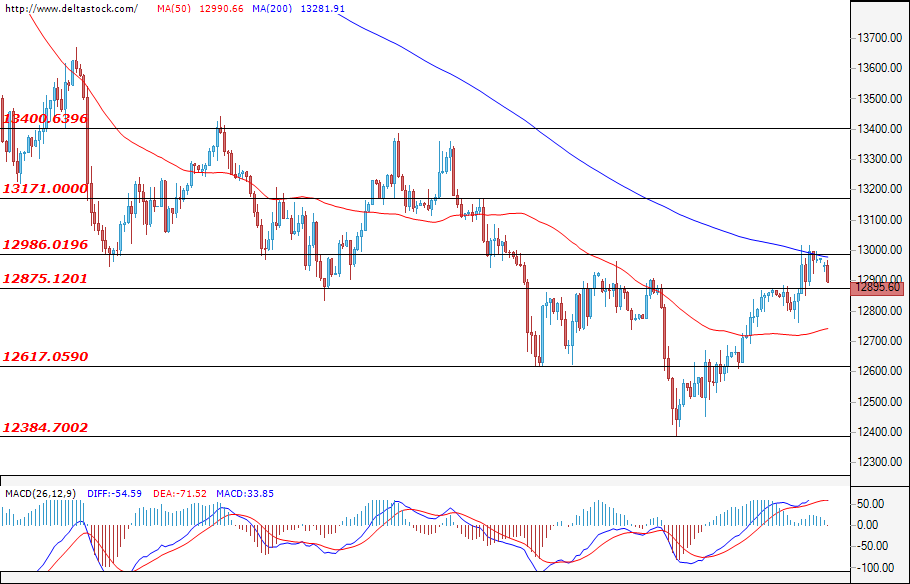
The German index managed to end last week with a small gain. Losses in the early hours today brought prices back around last week's opening levels. It is likely that the rally of the previous days will lose its strength and the bearish pressure will continue. The market is trading in a descending channel and sharp rallies are followed by equally relentless declines. For this cycle, the upper limit of the channel is around 13035 and it is possible that prices will reach it before the real attack of the bears. The first support for buyers is the area at 12875, with the next more significant one being at 12620. It is possible that the market will also form local support around 12750. It is characteristic of the price channels that supports and resistances are violated, and in such situations a good indicator for the areas of interest remain the extreme points of the market.
US30
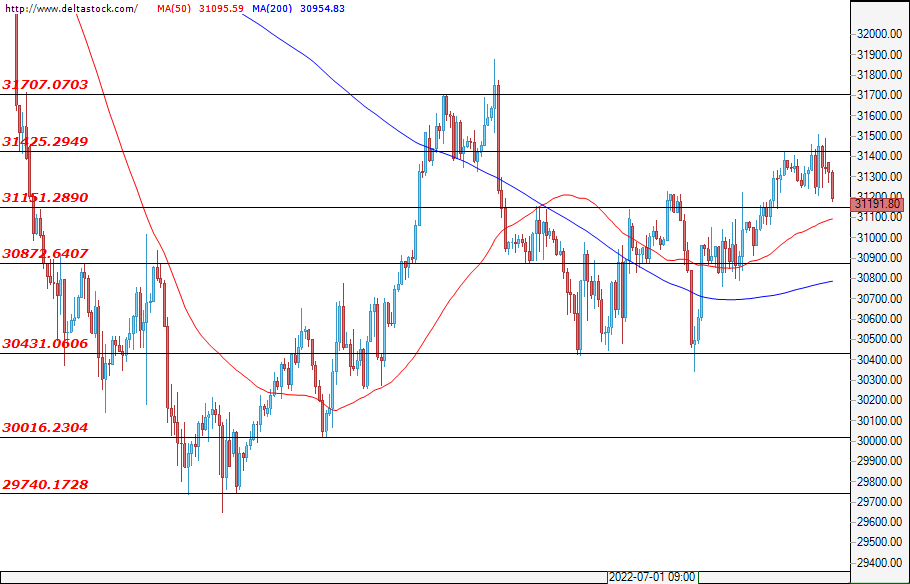
The recovery of the U.S. blue chips remained capped by the resistance at 31425. Prices are likely to test the support at 31150 and, if it fails, the declines are likely to deepen with a target of 30430. First significant resistance areas are 31425 and 31700. Expectations remain rather negative and an eventual growth may prove unsustainable. The U.S. markets are on the cusp of corporate earnings season and the volatility is likely to remain high in the coming weeks.
Gold Struggles to Tick Up after Bullish Doji Candles
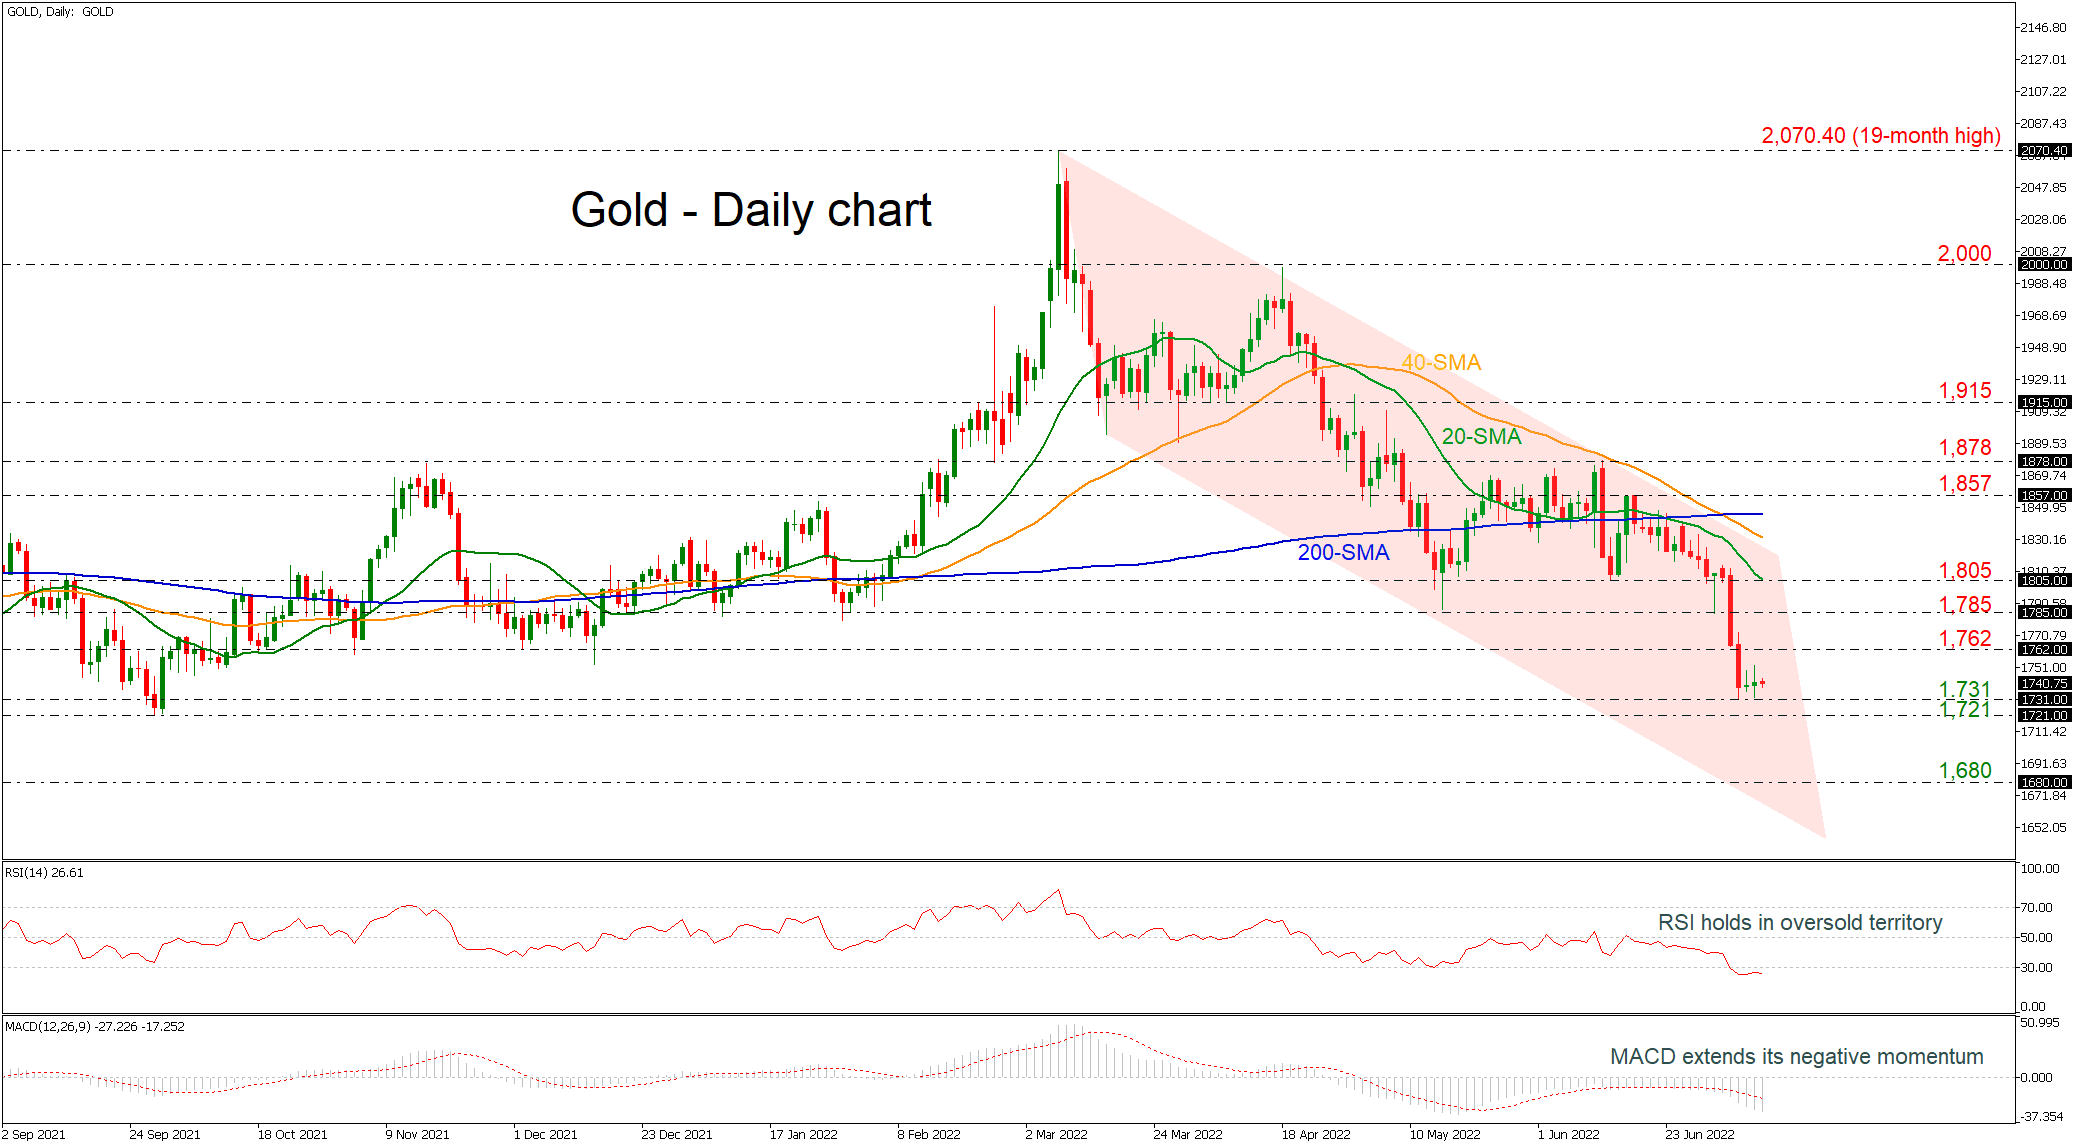
Gold posted two consecutive bullish doji candles, suggesting than an upside retracement may be on cards in the next few sessions. The commodity has continued to develop within a downward sloping channel since March 8 and the technical indicators are holding within their oversold levels. The RSI is flattening below the 30 level, while the MACD is strengthening its bearish momentum below its trigger and zero lines.
Another step lower may reach a key support zone at 1,721-1,731, where the price stopped in September 2021. Should this prove a weak obstacle, the selling could pick up speed until the 1,680 bottom, taken from the trough in August 2021.
Alternatively, in case of a rebound, immediate resistance could come from 1,762 before the focus shifts to the 1,785 inside swing low of the latest bottoms. Higher, the 20-day simple moving average (SMA), which overlaps with the 1,805 resistance could also restrict upside movements, though only a close above the 200-day SMA at 1,846 would confirm a bullish correction.
In the medium-term picture the pair is still increasingly bearish as long as it holds well below the 1,800 round number and more importantly within the descending channel.
All Eyes on Earnings and iInflation
The week starts on mixed sentiment, as European and US futures are down, and the US dollar is up this morning.
A mixture of micro and macro events will set the tone for this week and onward, as the earnings season kicks off this week, and the latest US inflation figures will be released, as well.
First, reaction to jobs data was good
The US economy added 372’000 new nonfarm jobs, more than 100’000 penciled in by analysts. The unemployment rate was steady near the 3.6% level, which is a five-decade high. Moreover, the average earnings didn’t increase much, just around 5.1% year-on-year.
As a result, the strong jobs figures washed out a part of the recession fears and the limited increase in salaries contained the inflation worries. The US indices went up and down again, the S&P500 closed the session near flat on Friday, but all three major US indices were up for the week. The S&P500 gained close to 2% last week, Nasdaq jumped more than 4.5%, while Dow Jones added a slim 0.8% over the week, as oil stocks came under pressure, as oil prices fell all the way to $95 a barrel.
Investors needed that puff of fresh air, and preferred cheering the fact that the jobs market remained resilient to the rate hikes, rather than worrying about the Federal Reserve (Fed), which could get more aggressive on its rate policy, convinced that the jobs market could take on more in the coming quarters.
But inflation will see the last word
But of course, investor sentiment could rapidly turn around. This Wednesday’s inflation data, particularly, carries the risk of killing the post-jobs data joy.
Due Wednesday, the US inflation data is expected to print a further advance to 8.8% in June, from 8.6% printed a month earlier. If that’s the case, or if we see a bigger number, the Fed hawks will be out for hunt again. We will perhaps see a further rise in US yields, and that could force investors to give back a part of last week’s gains.
Activity on US fed funds hint at 100% chance of seeing at least a 75bp hike in the next FOMC meeting, and started pricing in the possibility of a 100bp hike, which currently stands around 7%.
Oil under pressure
Oil bulls’ reluctance to extend gains above the 50-DMA, and the bears motivation to sell the tops hint that oil prices may have gone far enough to warn that, near the $120 levels and above, the recession fear and the demand side worries take the upper hand.
This being said, the bearish market remains vulnerable to supply side news. Therefore, I am cautiously neutral, to negative on oil, and believe that in the absence of an unexpected supply shock, we could see the barrel of US crude retreat toward the $85 mark.
Earnings
Earnings season kicks off to give a concrete insight on how well the US companies deal with rising inflation and stronger US dollar.
The S&P profit estimates have been pushing higher this year, despite a major dive in stock prices. Either the analysts are well behind the curve, and the earnings will come as confirmation that inflation, and the strong US dollar are having an ugly impact on profits. Or they are right, the US company profits are resilient to economic shocks, as the jobs market is.
In the FX
The US dollar extends its steep rally. The EURUSD almost hit parity last Friday, and is again under pressure this morning.
In Japan, the yen is also weakening as the ruling coalition in Japan extended a majority in last weekend’s upper house elections. The current government is up for more fiscal easing, while the Bank of Japan (BoJ) doesn’t seem in hurry to tighten its purse’s strings.
GBP/JPY Daily Outlook
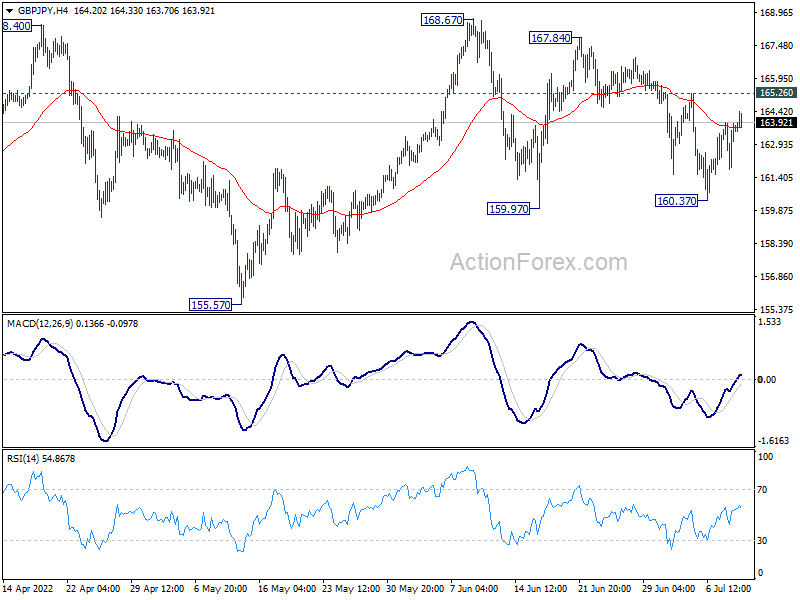
Daily Pivots: (S1) 162.45; (P) 163.19; (R1) 164.56; More...
Intraday bias in GBP/JPY remains neutral for the moment. On the downside, below 160.37 support will target 155.57 key support level next. On the upside, above 165.26 minor resistance will turn bias back to the upside and bring retest of 168.67 high instead.
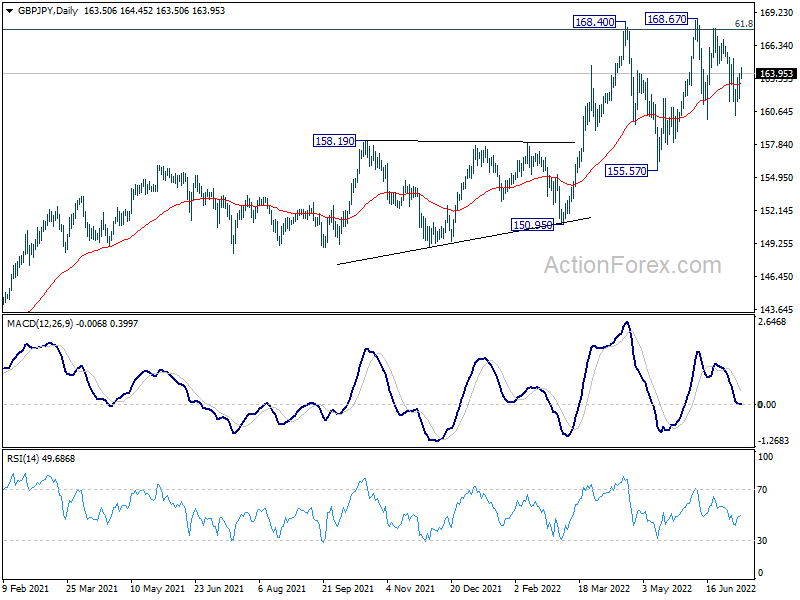
In the bigger picture, up trend from 123.94 (2020 low) is still in progress. Sustained break of 61.8% retracement of 195.86 (2015 high) to 122.75 (2016 low) at 167.93 will be a long term bullish signal, and could pave the way back to 195.86 high. This will now remain the favored case as long as 155.57 support holds, even in case of deep pull back.
EUR/JPY Daily Outlook
Daily Pivots: (S1) 137.42; (P) 138.06; (R1) 139.26; More....
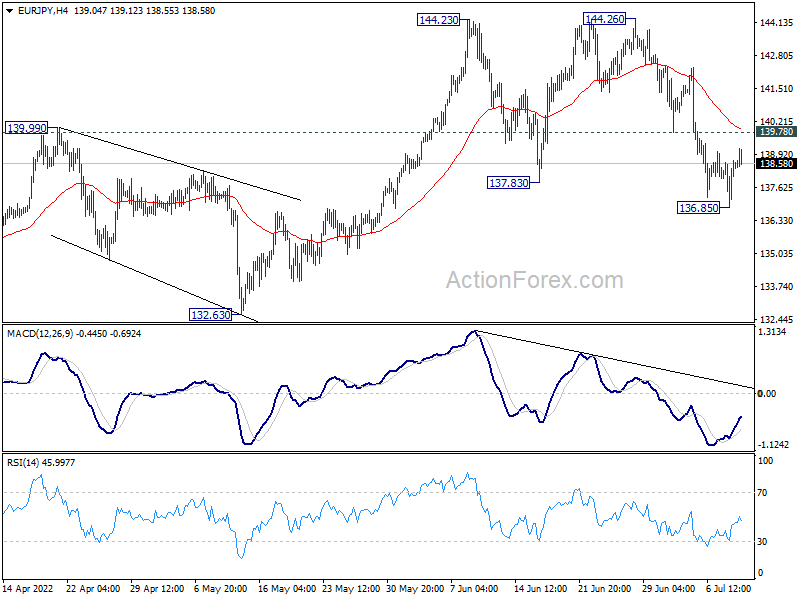
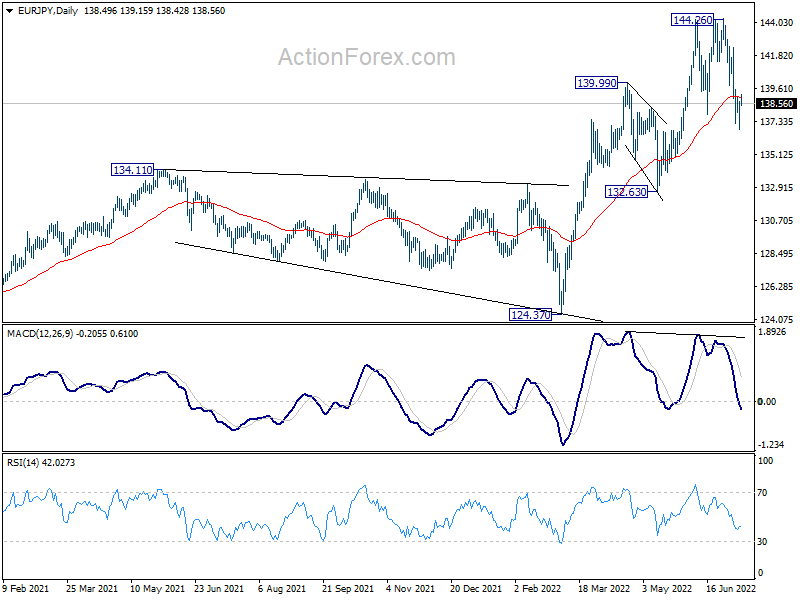
Intraday bias in EUR/JPY remains neutral for the moment. On the downside, below 136.86 will target 132.63 support. Decisive break will turn outlook bearish for 124.37 support. On the upside, above 139.78 minor resistance will turn bias to the upside for stronger recovery.
In the bigger picture, up trend from 114.42 (2020 low) is seen as the third leg of the pattern from 109.30 (2016 low). Further rally is in favor as long as 134.11 resistance turned support holds, even in case of deep pull back. Firm break of 139.78 will target 149.76 (2015 high. However, sustained break of 134.11 will be a sign of medium term bearish reversal and turn focus to 124.37 support for confirmation.
EUR/GBP Daily Outlook
Daily Pivots: (S1) 0.8444; (P) 0.8460; (R1) 0.8477; More...
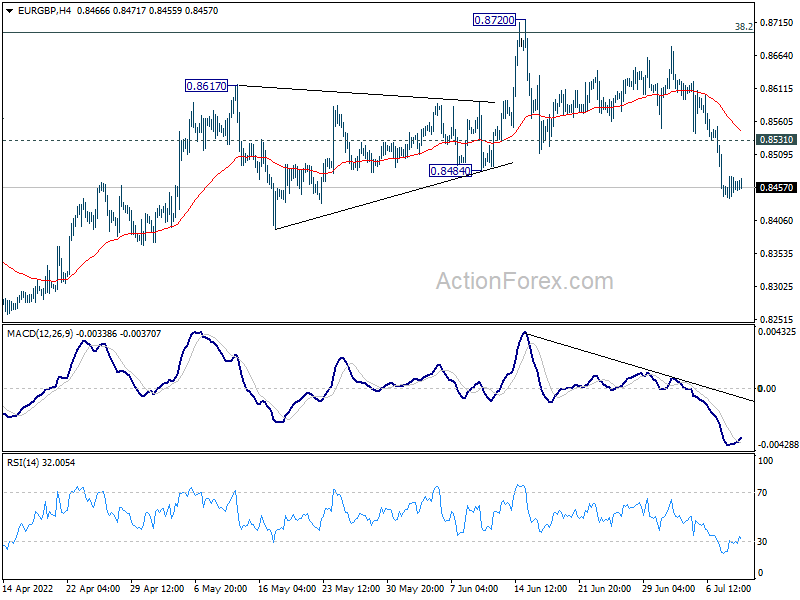
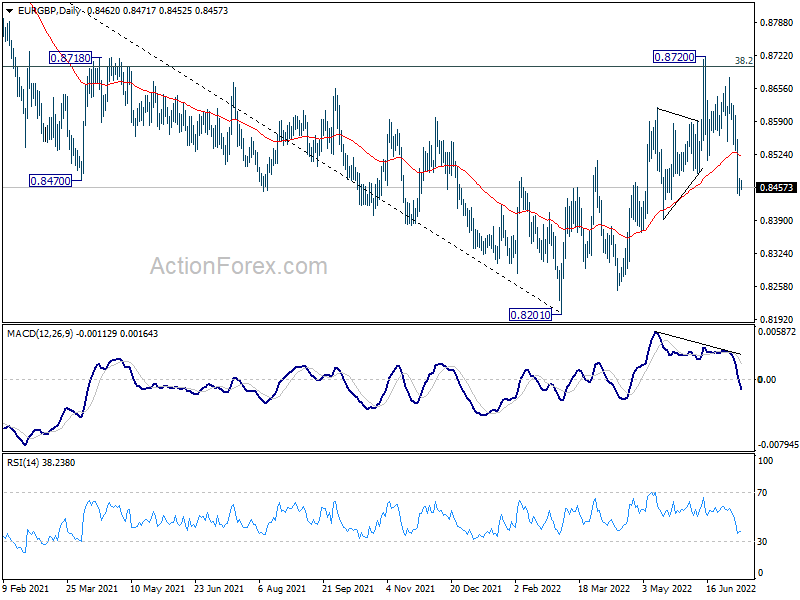
Intraday bias in EUR/GBP stays mildly on the downside for the moment. Rebound from 0.8201 should have completed at 0.8720, after rejection by 0.8697 medium term fibonacci level. Further fall would be seen to retest 0.8201/48 support zone next. On the upside, above 0.8531 minor resistance will turn intraday bias neutral first.
In the bigger picture, rejection by 38.2% retracement of 0.9499 to 0.8201 at 0.8697 argues that rebound from 0.8201 is merely a corrective move. That is, down trend from 0.9499 (2020 high) is now over. Sustained break of 0.8201 will resume such decline and target 61.8% retracement of 0.6935 to 0.9499 at 0.7917. This will now remain the favored case as long as 0.8720 resistance holds.
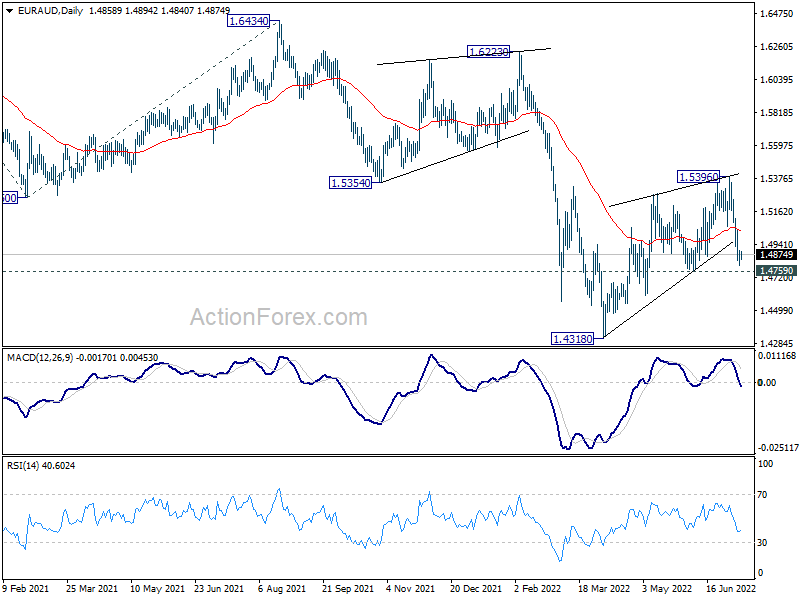
EUR/AUD Daily Outlook
Daily Pivots: (S1) 1.4809; (P) 1.4856; (R1) 1.4906; More...
Intraday bias in EUR/AUD stays mildly on the downside for 1.4759 support. Corrective rise from 1.4318 should have completed at 1.5396 after rejection by 1.5354 support turned resistance. Sustained break of 1.4759 will affirm this bearish case and bring retest of 1.4318 low. On the upside, above 1.5043 minor resistance will turn intraday bias neutral first.
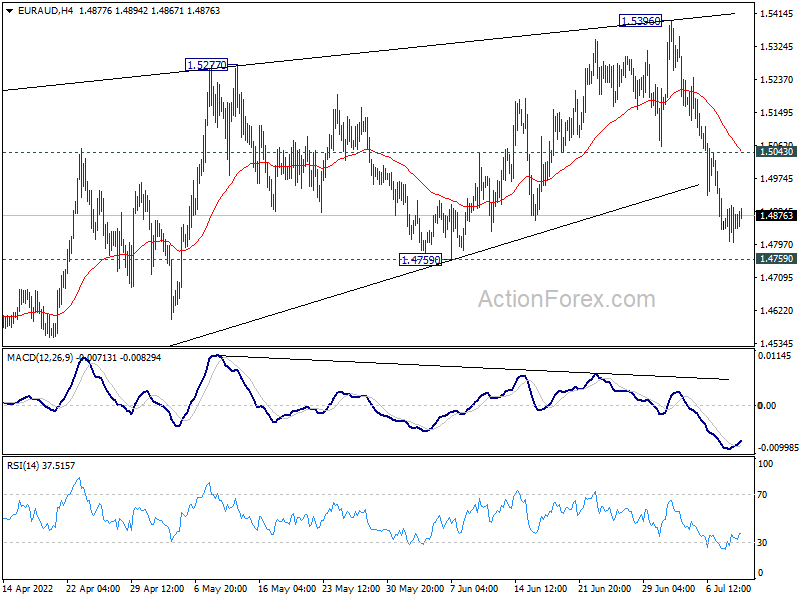
In the bigger picture, rejection by 1.5354 support turned resistance, as well as 55 week EMA (now at 1.5398), maintain medium term bearishness. That is, larger down trend from 1.9799 is not completed yet. Break of 1.4318 low will target 61.8% projection of 1.9799 to 1.5250 from 1.6434 at 1.3623, which is close to 1.3624 long term support (2017 low). This will remain the favored case now as long as 1.5396 resistance holds.