Sample Category Title
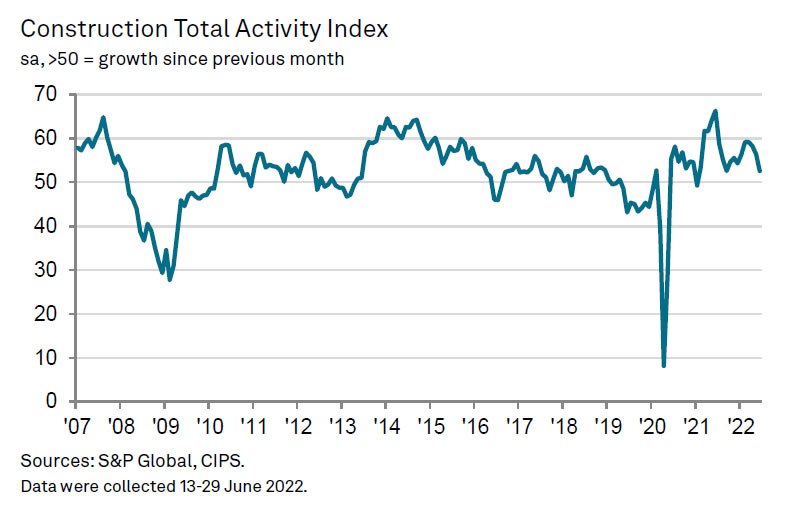
UK PMI construction dropped to 52.6, gloomy business outlook and worsening consumer demand
UK PMI Construction dropped from 56.4 to 52.6 in June, below expectation of 55.2. S&P Global noted that it's the weakest rise in construction output since September 2021. House building declined for the first time since May 2020. Business optimism dropped for the fifth month running.
Tim Moore, Economics Director at S&P Global Market Intelligence, said: "The gloomy UK business outlook and worsening consumer demand due to the cost of living crisis combined to put the brakes on construction growth in June. Commercial construction saw a considerable loss of momentum as clients exercised greater caution on new spending, while long-term infrastructure projects ensured a relatively resilient trend for civil engineering activity."
BoE Pill unpacks MPC’s most recent communications
In a speech, BoE Chief Economist Huw Pill unpacked the MPC's most recent communication about the outlook for monetary policy decisions.
The latest statement widened the discussions beyond the interest rate decision at August meeting. It reflected the "uncertainties" and "likelihood that we will have to take finely-balanced decisions over rates not just in August but also beyond that, in the face of two-sided risks to the economic outlook into next year."
By referring to "'any further increases in Bank Rate", the BoE talked about rate increases, not decreases. But at the same time, the reference to "any" increases "allows for the possibility of remaining on hold".
The focus on "indications of more persistent inflationary pressures" places emphasis on " identifying potential second-round effects in price and wage setting behavior". Thar prioritizes "the more persistent component of inflation developments over the headline spot measure."
By signaling preparedness to 'if necessary act forcefully in response' to indications of greater persistence in inflation, the statement reflected "both my willingness to adopt a faster pace of tightening than implemented thus far in this tightening cycle".
BoE Cunliffe sees signs UK economy is already slowing
BoE Deputy Governor Jon Cunliffe told BBC Radio today, "What we expect is, the cost of living squeeze will hit people's spending, and that will start to cool the economy. We can see signs that the economy is already slowing."
"We forecast over the next year or so that economic growth will be essentially flat," he said. "That's a very different picture to the picture we saw from 2009 to 2011. It's a picture of a slowing economy where people cut back on spending."
"It's our job to make sure that as this inflationary shock passes through the economy, at a time when we have also have a tight labor market, we don't find that a combination of a strong shock from abroad and energy prices combines with domestic factors and leaves us inflation being the new normal," he said. "People can have confidence that we will act to make sure that doesn't happen."
Bitcoin Tightened to $20,000 for the Time Being
Bitcoin rose 3.5% on Tuesday, ending the day around $20,400, but continued pressure on risky assets in Asia brought the price of the first cryptocurrency back below $20,000 on Wednesday morning. Ethereum has lost 3% in the past 24 hours, with prices for the leading altcoins ranging from -3.1% (DogeCoin) to -1% (BNB).
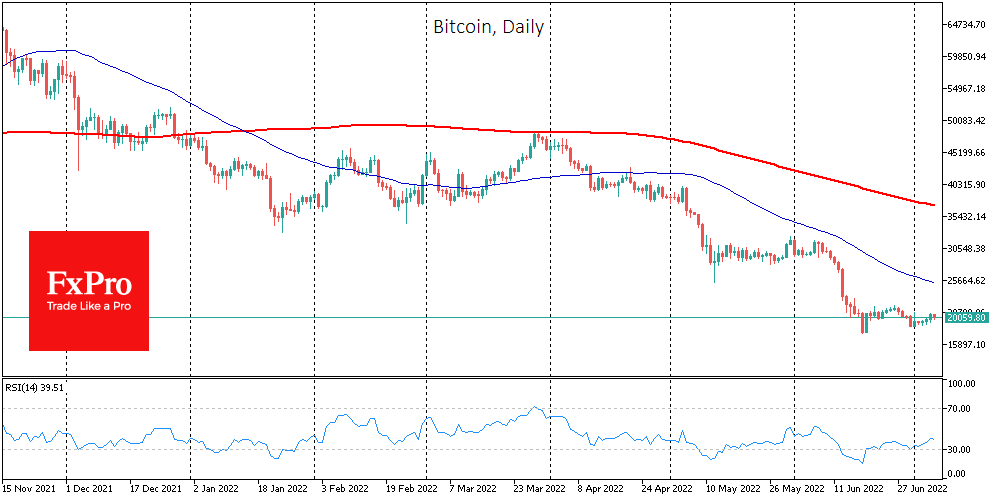
Total cryptocurrency market capitalisation, according to CoinMarketCap, declined 2% overnight to $898bn.
The Cryptocurrency Fear and Greed Index was down 1 point to 18 by Wednesday and remains in a state of “extreme fear”.
The dynamics of bitcoin and the Dollar in the coming days could be a prologue to the crypto market behaviour in the coming weeks. On the one hand, it is tough to be bullish on cryptocurrencies in an environment of a sharply strengthening dollar and a sell-off in risk. A rising dollar and an aggressive Fed are significant current obstacles to buying cryptocurrencies.
On the other hand, Bitcoin is historically relatively cheap, attracting the interest of long-term buyers. However, it is still tricky for anything more than the formation of a bottom. It will probably take months before a rally, as we saw in 2020, starts.
BTC could fall another 20-40% by the end of the summer, according to Cane Island Alternative Advisors. The US economy is entering a recessionary phase, and capital will leave risky assets accordingly.
The massive fall in cryptocurrency has led to the flight of “market tourists” and margin traders. Only the most committed enthusiasts remain, according to Glassnode. Meanwhile, HODLers continue to accumulate bitcoins.
According to The Telegraph, electric car maker Tesla suffered a loss of $440 million due to the bitcoin collapse. The company invested $1.5 billion in bitcoin in early 2021.
According to Charles Erith, CEO of investment firm ByteTree, bitcoin and gold are the best insurance against economic shocks during inflation.
The European Central Bank (ECB) has demanded that EU countries comply with uniform standards when drafting national laws to regulate the cryptocurrency industry.
USDJPY Appears Overbought; Neutral-to-Negative Bias
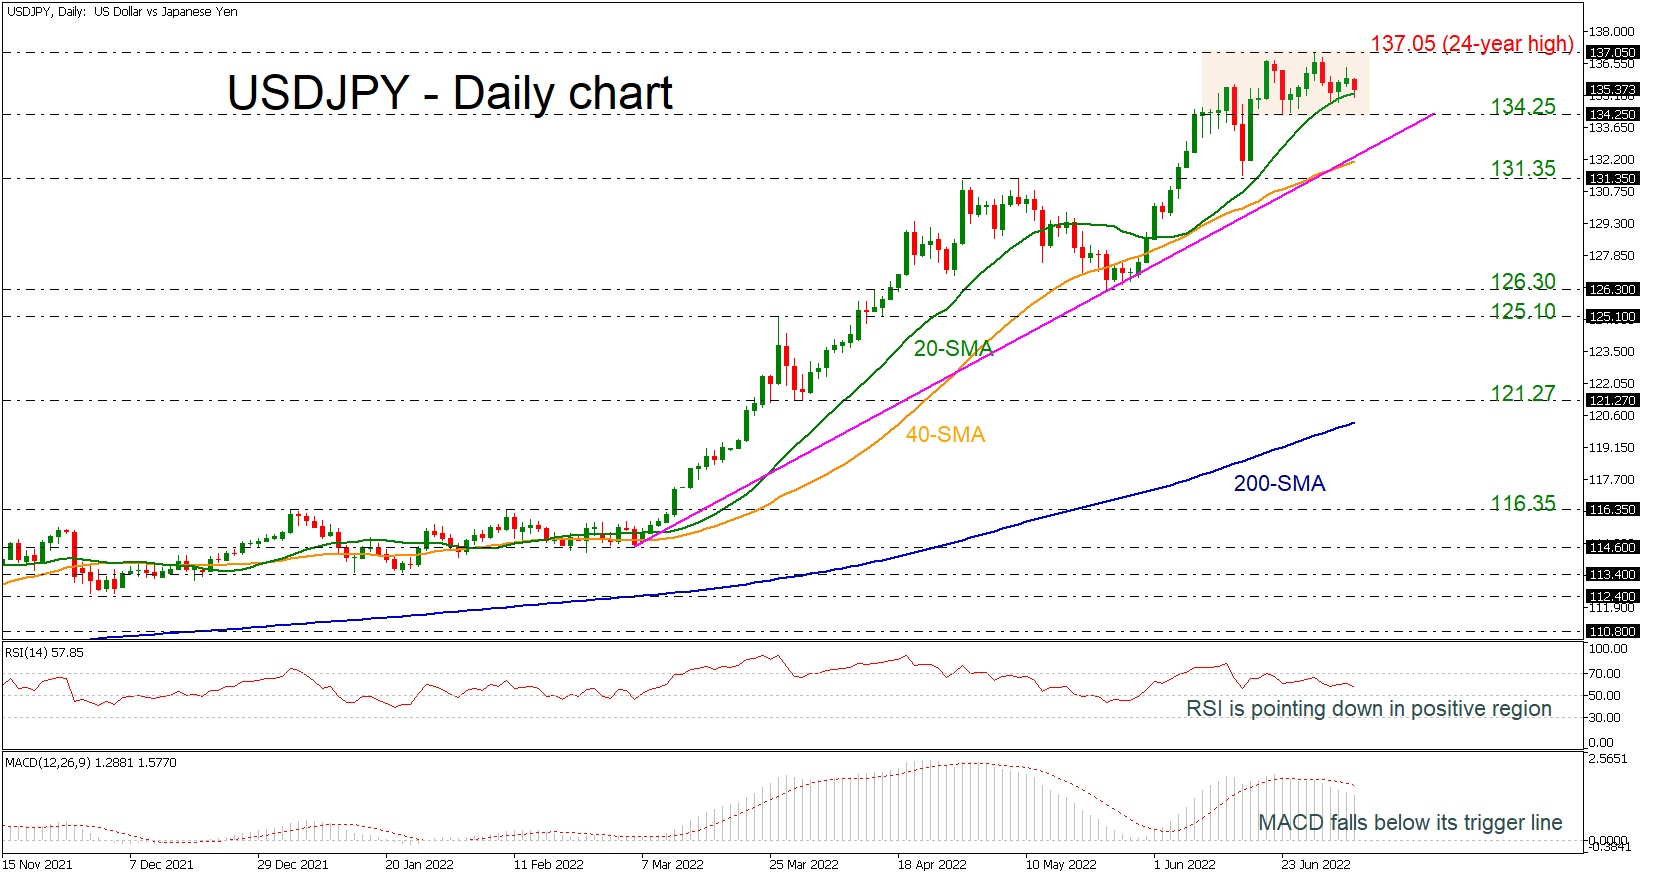
USDJPY is moving sideways within a tight range of the 134.25 support and the 24-year high of 137.05, failing to post a higher high, suggesting an overbought market.
The RSI indicator is pointing down in the positive region, while the MACD oscillator is holding below its trigger line above the zero level, indicating a weak momentum. In trend indicators, the 20-day simple moving average (SMA) is turning lower, while the 40-day SMA is still following the medium-term uptrend line.
Further declines may meet support around the lower boundary of the channel, before tumbling to the ascending trend line around 133.00 and the 40-day SMA at 132.10. Not far below, support could occur around the 131.35 barrier ahead of the 126.30 level.
On the upside, resistance could come from the 24-year high of 137.05 before rallying towards the 140.00 psychological level. Higher still, the 146.83 resistance, taken from August 1998 would increasingly come into scope.
The medium-term picture continues to look predominantly bullish, with trading activity taking place above the short-term SMAs and the 200-day SMA. However, the short-term outlook appears overstretched.
Gold Outlook: Held at Balance or Near Tipping Point?
Not much has changed in the past month as the precious metal is stuck in limbo, confined by equally strong support and resistance forces. Gold has been caught in a balancing act influenced by various complexly intricate and interconnected relationships, playing a game of tug of war. In this report we are going to shed light on those relationships, taking them apart and closely examining the components, for a fresh perspective to appear. Tying those relationships to current and future economic developments will provide us with an understanding on where gold stands, and whether the balancing act continues or whether we reached a tipping point. Let’s dive right in.
After rising to near all-time highs in the beginning of March 2022, partially due to the Russian invasion in Ukraine, gold performance has been losing steam, plunging lower over the next three months marking its biggest quarterly percentage decline in more than a year. Its price maintained a rather stable and consistent sideways action for the months of May and June, trading between the bounds of $1784 as support and $1878 as resistance. Recently however, according to our analysis, we observed a steady decline initiated at the $1878 upper bound, formulating a descending trendline and is currently edging closer to the support $1784 level.
As the overall market conditions appear to be grim at best, investors’ expectations foresee no improvement in the near horizon. “Pressures on gold seem likely to persist in the second half of the year, investors and analysts said” according to a Wall Street Journal article. As robust inflation ravishes the economic scene, spurred central banks across the world to act by aggressively hiking interest rates, some more than others, in an attempt to contain the overspilling. In broader terms, the relationship of rampant inflation urges market participants to seek refuge to gold, as historically it has shown to be a safe haven. As the US markets continue to appear beaten down, the migration to gold seems attractive, nonetheless. Market turmoil and war could also boost the price of gold and without a doubt we experienced plenty of that in the Q1. Having stated the above, the outlook for a price appreciation of gold seems imminent yet remains to be seen.
Despite the persistent inflation and market turmoil which favors it, gold is being weighed down by rising bond yields, as a consequence of aggressive hikes and the subsequent strengthening of the US dollar. More specifically, the accelerated rate increases of the Federal Reserve presents a dilemma for investors, whether to flee from the safe haven asset and choosing the higher-yield Treasuries option instead as they provide relatively steady regular payouts. On the other hand, the strengthening of the dollar sets overseas buyers in a disadvantaged position as it is more expensive to purchase gold.
Of particular importance for the future development of gold this week are the upcoming news releases on Friday the 8th of July by the US, in regard to the Non-Farm Payrolls, the Unemployment Rate and the yearly Average Earnings reports. As of today, according to preliminary results provided by the surveys, should the release of the US employment report for June actually disappoint traders and weaken the USD, we may see the precious metal actually gaining some ground, as the negative correlation of gold to the greenback could come into play. Therefore, traders will be looking closely on how to interpret the actual finalized figures of the above releases and reassess their future outlooks on gold. We tend advise caution when trading the precious metal at the time of the release as high volatility may occur. Also, before that on Wednesday the Fed is to release the minutes of its June meeting and market participants are expected to scrutinize the document for any clues regarding the Fed’s intentions. Hence once again we may see increased volatility for gold’s price.
Technical Analysis
XAUUSD H4
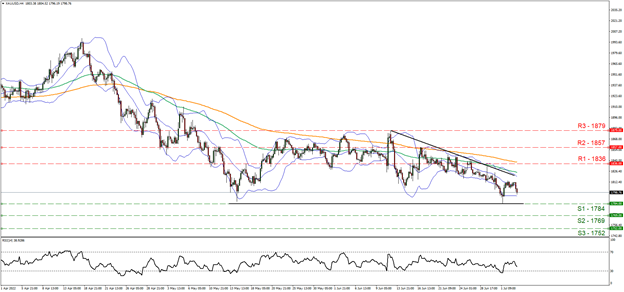
Gold is currently trading in a downward trend since the 13th of June where it attempted to move past the 1879 resistance (R1) line but failed to do so. As shown by the downward trendline it has been reaching lower peaks and on the 1st of July it fell to the 1784 level where it found support (S1), with similar levels seen near the end of January 2022. Having said that, we hold a bearish outlook bias for Gold for the short-term horizon. Supporting our case is the RSI indicator below our 4-hour chart, which exceeded the oversold bound of 30 on the 1st of July with a reading of 26, quickly bouncing back towards the 50 level. However, on today’s session we can see it point downwards once again. Also worth pointing out is the price action flirting with the lower bound of the Bollinger bands on July 1st. Should the bears continue to reign over, then we might see a definitive break below the 1784 support (S1) line and the price action moving towards the 1769 support (S2) line and possibly beyond, a level once seen before in December of 2021. Should the bulls take over, we would require a break of the downward trend line as first sign of a trend reversal and the 1836 resistance (R1) line and a move near the 1857 resistance (R2) level.
WTI Oil: Bears Consolidating after a 10% Acceleration on Tuesday
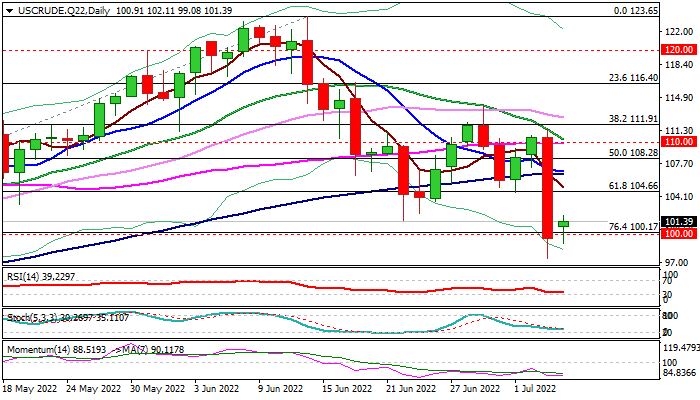
WTI oil edges higher in early Wednesday after falling nearly 10% previous day (the biggest daily loss since Mar 9), as renewed supply concerns of growing recession signals slashed oil prices.
Profit-taking pushed the price higher, though technical studies are bearish and sentiment remains weak, suggesting limited recovery before bears fully re-take control.
From technical point of view, Tuesday’s marginal close below psychological $100 level was an initial negative signal, in addition to a massive bearish candle which was left on Tuesday and weighs on near-term action, which could retest a higher base of Mar/Apr at $92.64/92, on sustained break of $100 trigger.
Fundamentals add to negative outlook as growing fears that the global economy is heading towards recession that would hurt demand and offset threats about supply shortage after OPEC refused to increase output on US request.
Upticks face solid barriers at $104.66 (broken Fibo 61.8% of $92.92/$123.65); $105.71 (daily Tenkan-sen) and $106.44 (base of thick daily cloud), where rebound should be capped to keep near-term bears in play.
Res: 102.11; 104.66; 105.71; 106.44.
Sup: 100.00; 99.08; 97.42; 95.27.
GBP/JPY Daily Outlook
Daily Pivots: (S1) 160.96; (P) 163.12; (R1) 164.65; More...
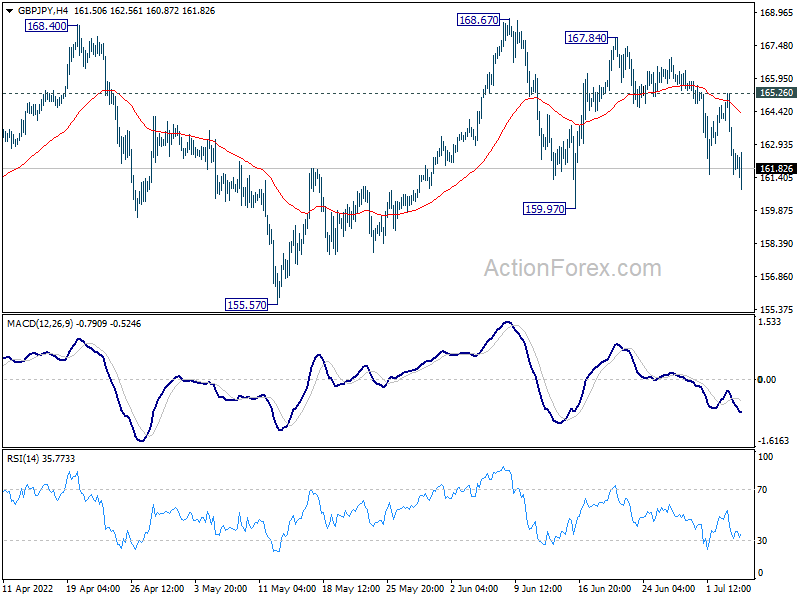
Intraday bias in GBP/JPY is back on the downside as fall from 167.84 resumes. Firm break of 159.97 support will raise the chance of rejection by 167.93 long term fibonacci resistance. Deeper fall would be seen to 155.57 support for confirmation. On the upside, break of 165.26 minor resistance will turn bias back to the upside for retesting 168.67 high.
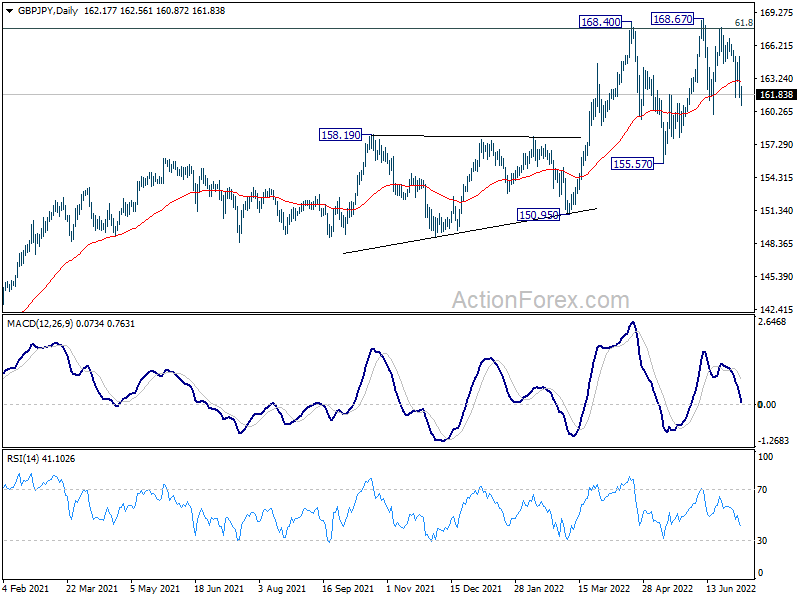
In the bigger picture, up trend from 123.94 (2020 low) is still in progress. Sustained break of 61.8% retracement of 195.86 (2015 high) to 122.75 (2016 low) at 167.93 will be a long term bullish signal, and could pave the way back to 195.86 high. This will now remain the favored case as long as 155.57 support holds, even in case of deep pull back.
EUR/JPY Daily Outlook
Daily Pivots: (S1) 138.17; (P) 140.27; (R1) 141.59; More....
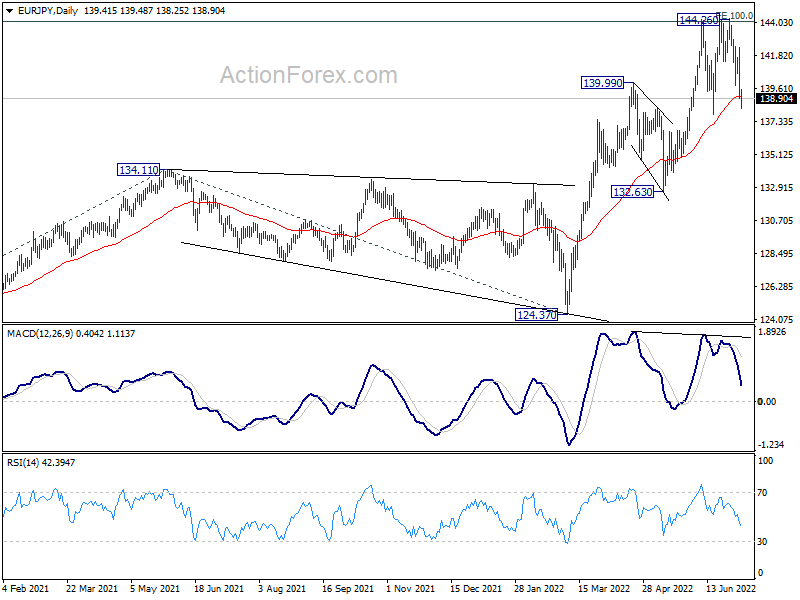
Intraday bias in EUR/JPY is back on the downside as fall from 144.26 resumes. Sustained break of 137.83 support will raise the chance of rejection by 144.06 long term projection level and target 132.63 support. On the upside, above 142.36 minor resistance will bring retest of 144.26 high instead.
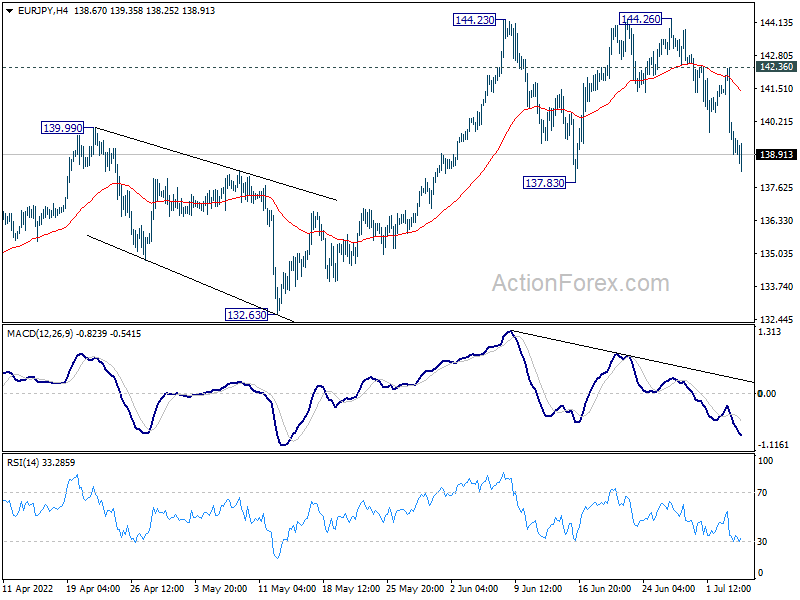
In the bigger picture, up trend from 114.42 (2020 low) is in progress. Such rise is seen as the third leg of the pattern from 109.30 (2016 low). Sustained trading above 100% projection of 114.42 to 134.11 from 124.37 at 144.06 will indicate upside acceleration and target 149.76 long term resistance (2014 high). In any case, outlook will remain bullish as long as 132.63 support holds, in case of deep pull back.
EUR/GBP Daily Outlook
Daily Pivots: (S1) 0.8545; (P) 0.8584; (R1) 0.8625; More...
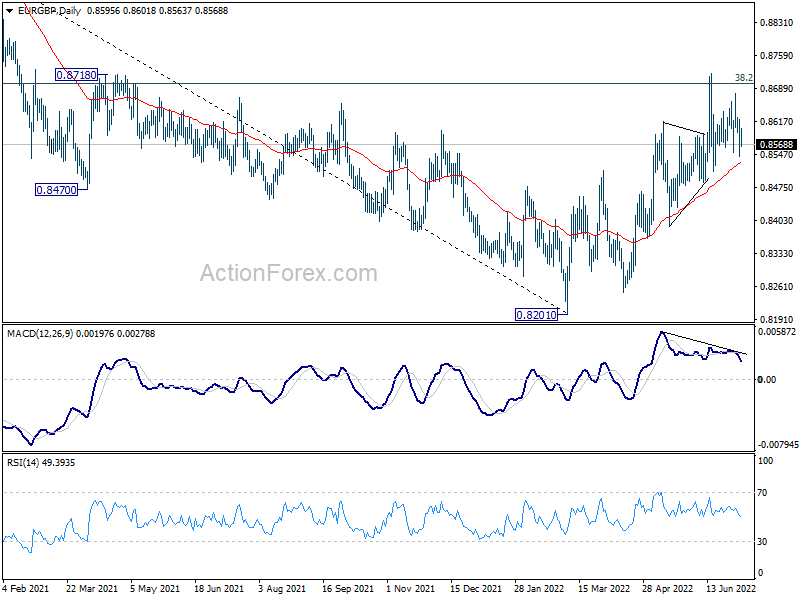
EUR/GBP is staying in range trading and intraday bias remains neutral. As long as 0.8484 support holds, further rise is in favor. Break of 0.8720 and sustained trading above 0.8697 medium term fibonacci level will carry larger bullish implication. Next target is 0.9003 fibonacci level. However, break of 0.8484 will indicate rejection by 0.8697 and turn near term outlook bearish.
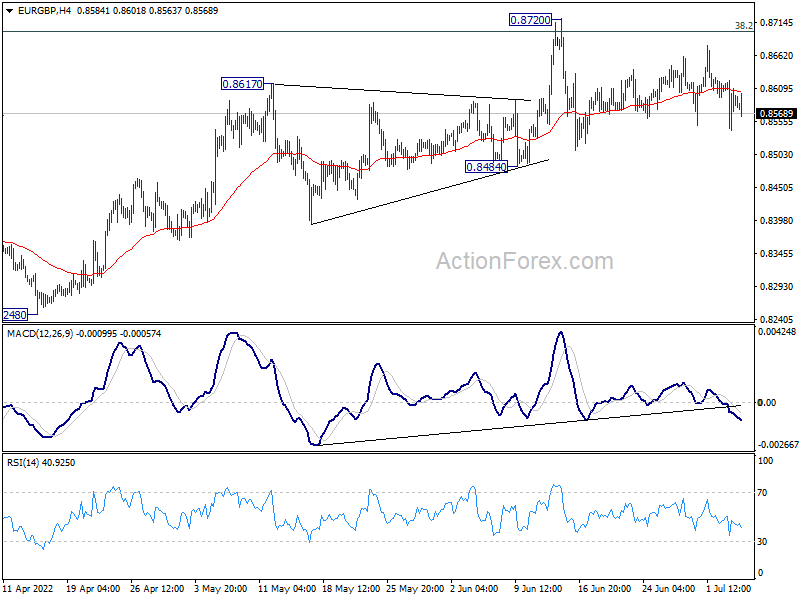
In the bigger picture, rise from 0.8201 medium term bottom could could either be a correction to the down trend from 0.9499 (2020 high), or a medium term up trend itself. Sustained break of 38.2% retracement of 0.9499 to 0.8201 at 0.8697 will affirm the latter case, and pave the way to 61.8% retracement at 0.9003. However, rejection by 0.8697 will maintain medium term bearishness.