Sample Category Title
New Zealand BusinessNZ services rose to 55.2, back above average
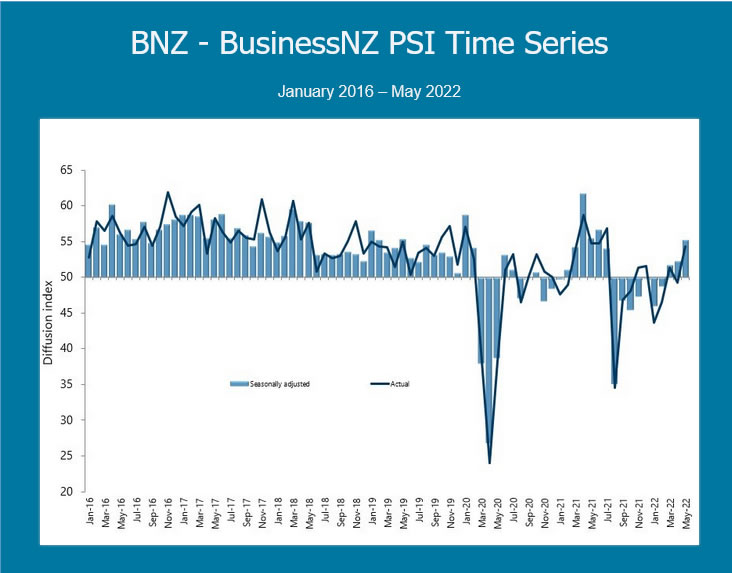
New Zealand BusinessNZ Performance of Services Index rose from 52.2 to 55.2 in May. Activity/sales rose sharply from 53.3 to 59.6. But employment dropped from 51.0 to 48.5. New orders/business rose from 55.2 to 62.0. Stocks/inventories ticked down from 55.0 to 54.6. Supplier deliveries rose from 40.5 to 45.0.
BNZ Senior Economist Doug Steel said that "while the improvement was far from universal across components, reflecting many ongoing challenges across segments of the service sector, the overall outcome was the first above average result since the outbreak of Delta in August last year."
Fed Waller: Fed is all in on re-establishing price stability
Fed Governor Christopher Waller said in a speech over the weekend that "if the data comes in as I expect, I will support a similar-sized move at our July meeting," referring to the 75bps hike at the June meeting. He added, "the Fed is 'all in' on re-establishing price stability."
"It should not have been a surprise that the policy rate would rise fast in 2022. Rate hikes would need to be larger and more frequent, relative to the 2015-2018 tightening pace, to get back to neutral."
"Looking back, should the Committee have signaled a steeper rate path once the liftoff criteria had been met? Perhaps another lesson is that giving forward guidance about liftoff should also include forward guidance about the possible path of the policy rate after liftoff."
Technical Outlook and Review
DXY:
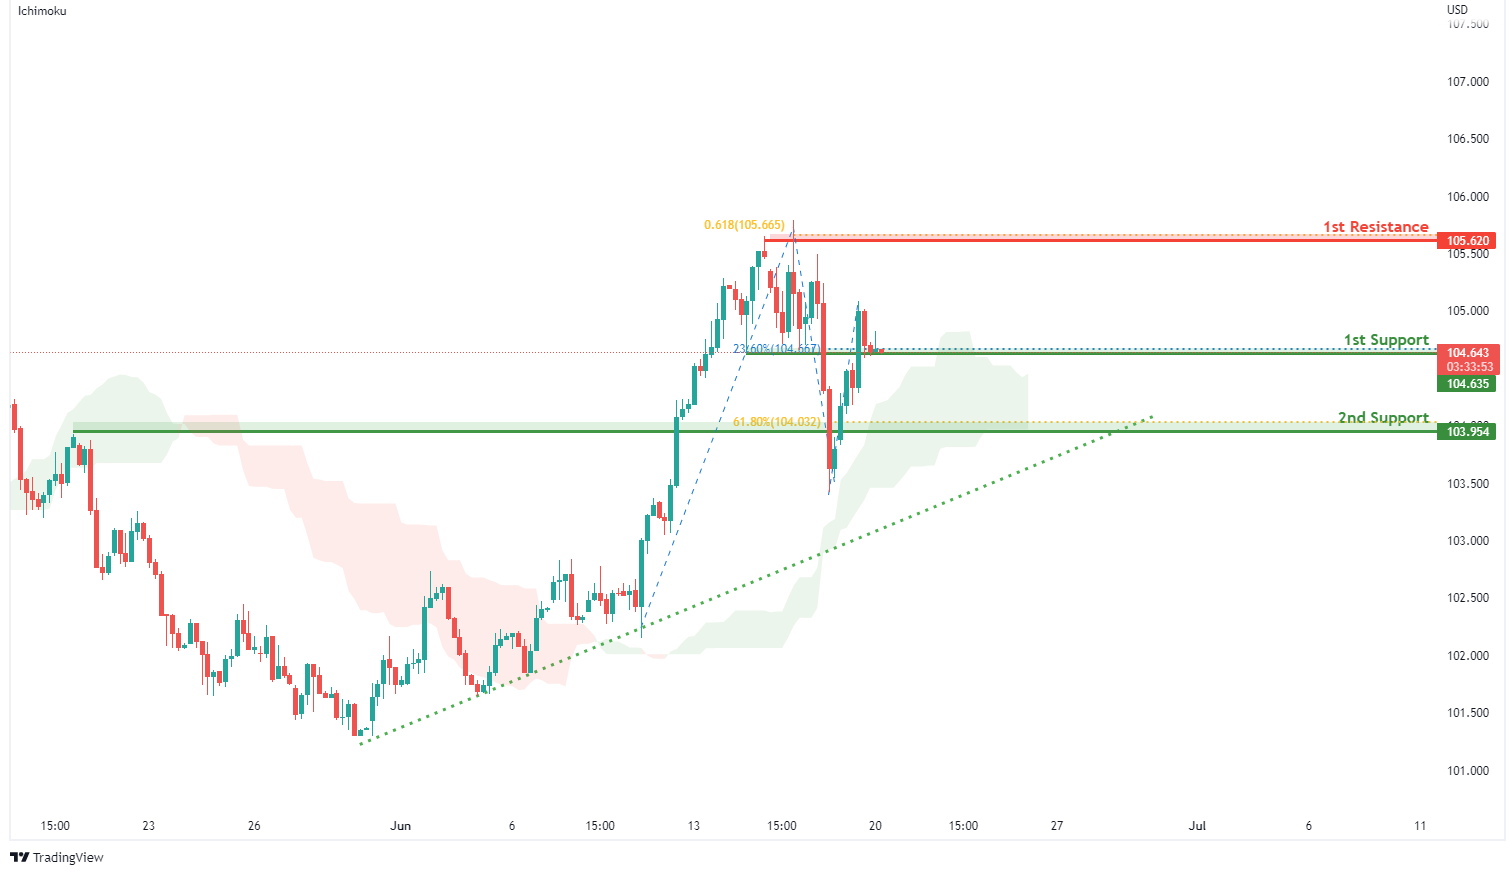
On the H4, with prices moving above the ichimoku indicator and along the ascending trendline, we have a bullish bias that price will rise to our 1st resistance at 105.620 where the 61.8% fibonacci projection and swing high resistance are from our 1st support at 104.635 in line with the horizontal pullback support and 23.6% fibonacci retracement. Alternatively, price may break 1st support structure and head for 2nd support at 103.954 where the horizontal pullback support and 61.8% fibonacci retracement.
Areas of consideration:
- H4 time frame, 1st resistance at 105.620
- H4 time frame, 1st support at 104.635
XAU/USD (GOLD):
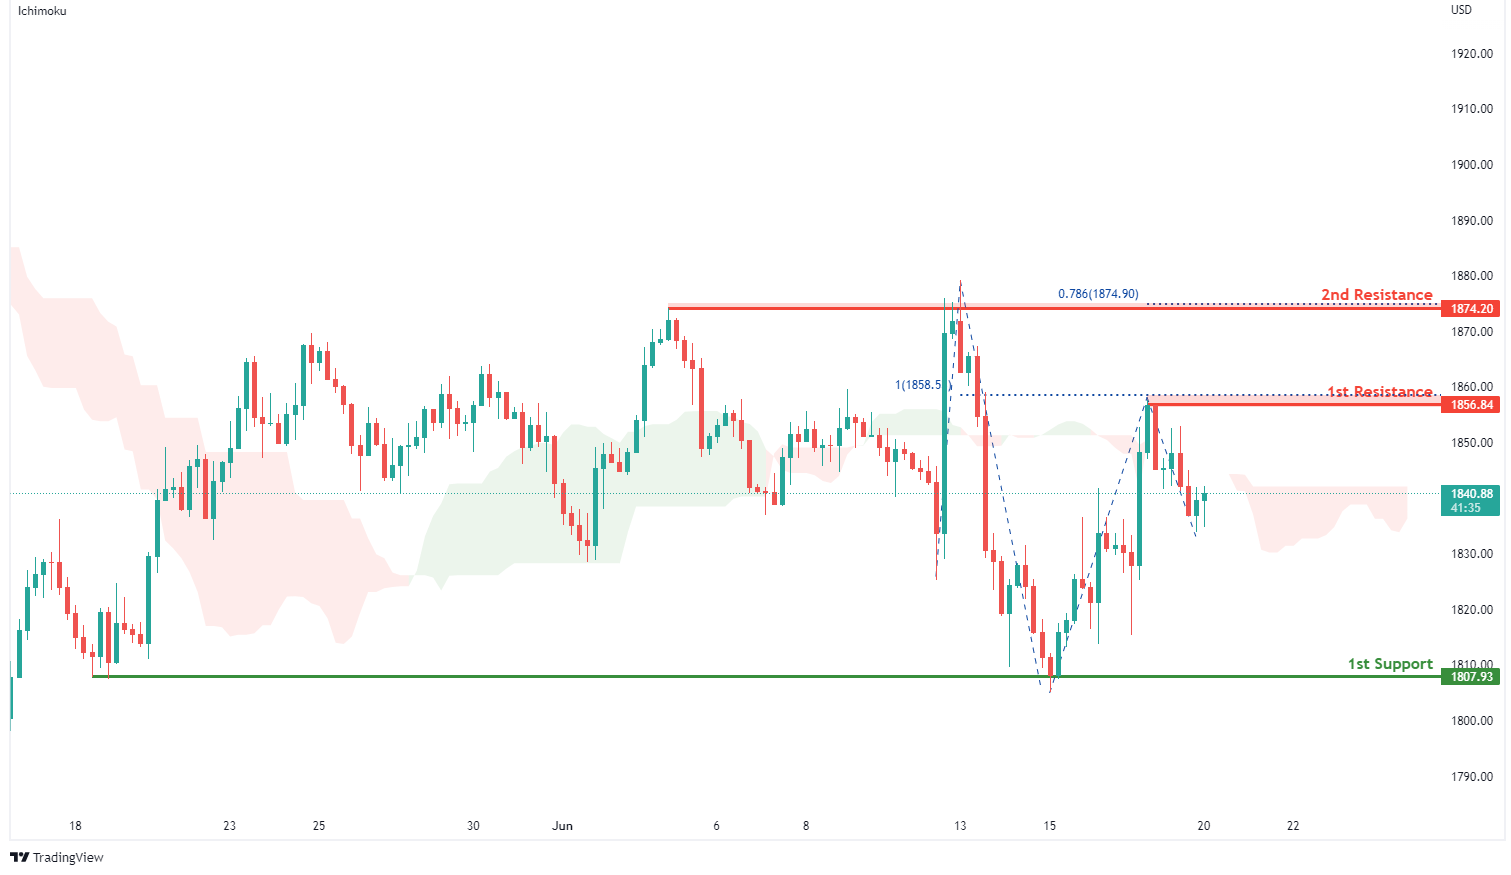
On the H4, with prices moving below the ichimoku indicator, we have a bearish bias that prices will drop from our 1st resistance at 1856.84 where the horizontal swing high resistance and 100% fibonacci projection are to our 1st support at 1807.93 in line with swing low support. Alternatively, price may break 1st resistance structure and head for 2nd resistance at 1874.20 in line with swing high resistance and 78.6% fibonacci projection.
Areas of consideration:
- H4 time frame, 1st Resistance at 1856.84
- H4 time frame, 1st Support at 1807.93
GBP/USD:
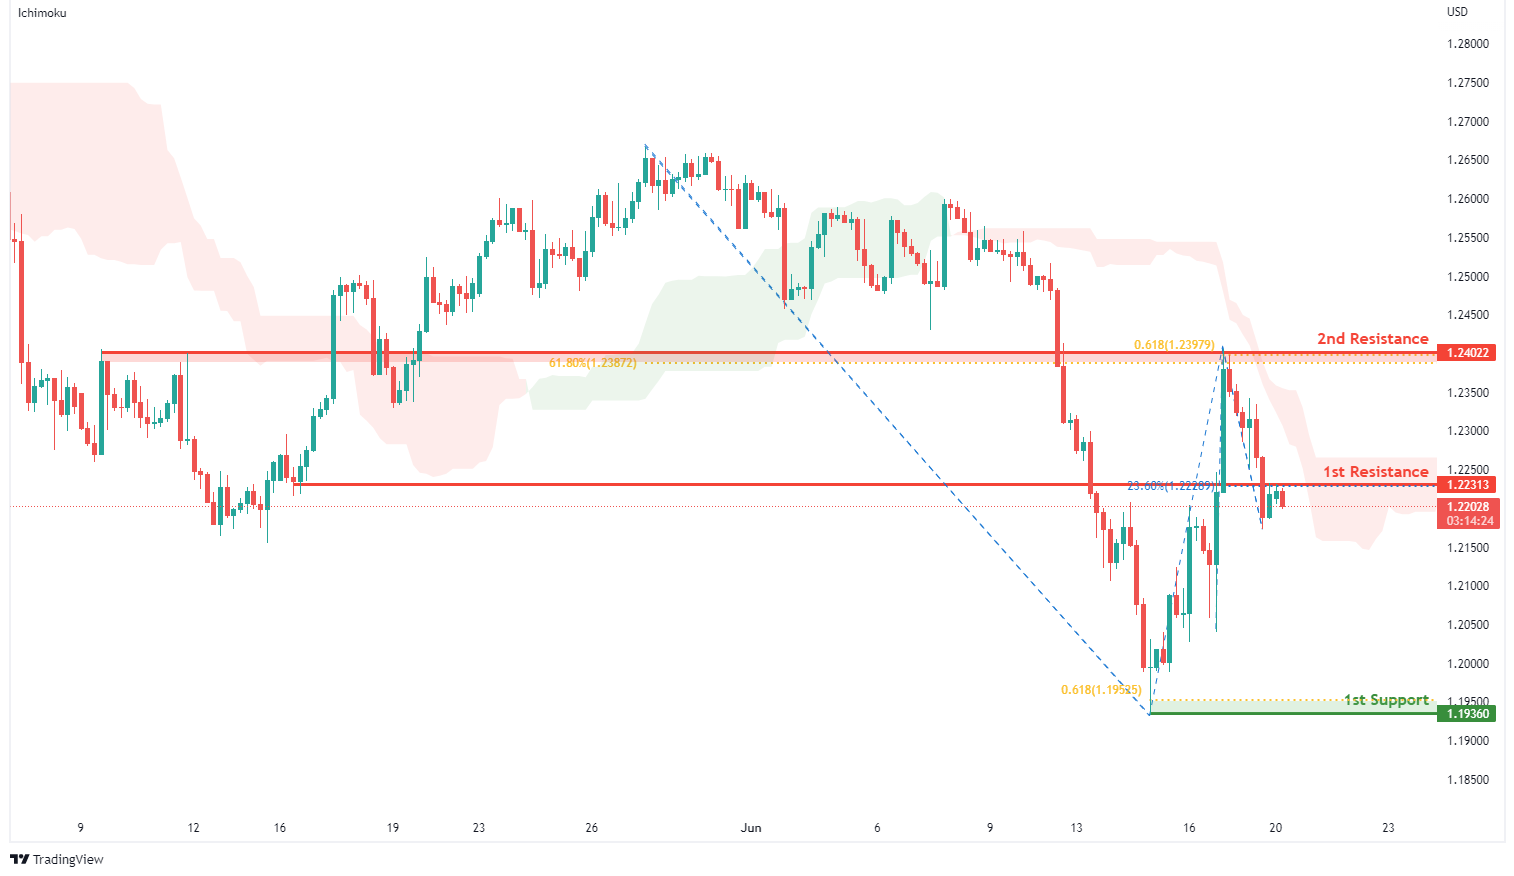
On the H4, with prices moving below the ichimoku indicator, we have a bearish bias that price will drop from our 1st resistance at 1.22313 where the horizontal overlap resistance and 23.6% fibonacci retracement are to our 1st support at 1.19360 in line with the 61.8% fibonacci projection and swing low support. Alternatively, price may break 1st resistance structure and head for 2nd resistance at 1.24022 where the horizontal overlap resistance, 61.8% fibonacci projection and 61.8% fibonacci retracement are.
Areas of consideration:
- H4 1st resistance at 1.22313
- H4 1st support at 1.19360
USD/CHF:
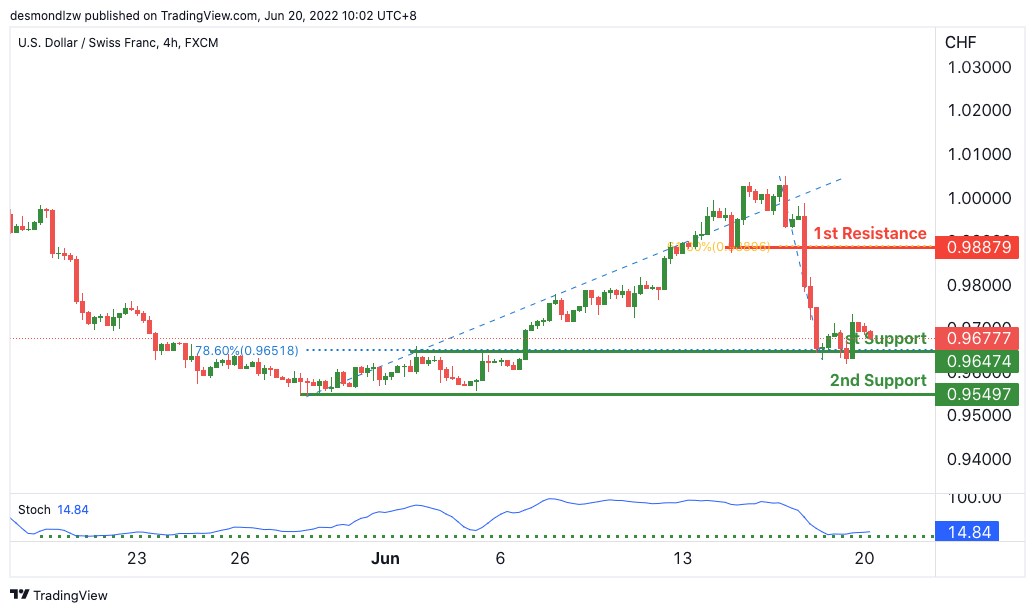
On the H4, with price expected to bounce off the stochastics indicator, we have a bullish bias that price will rise from our 1st support at 0.96474 where the horizontal pullback support and 78.6% Fibonacci retracement is to our 1st resistance at 0.98879 in line with the horizontal pullback resistance and 61.8% Fibonacci retracement. Alternatively, price may break structure and head for 2nd support where the horizontal swing low support is.
Areas of consideration
- 1st support level at 0.96474
- 1st resistance level at 0.98879
EUR/USD :
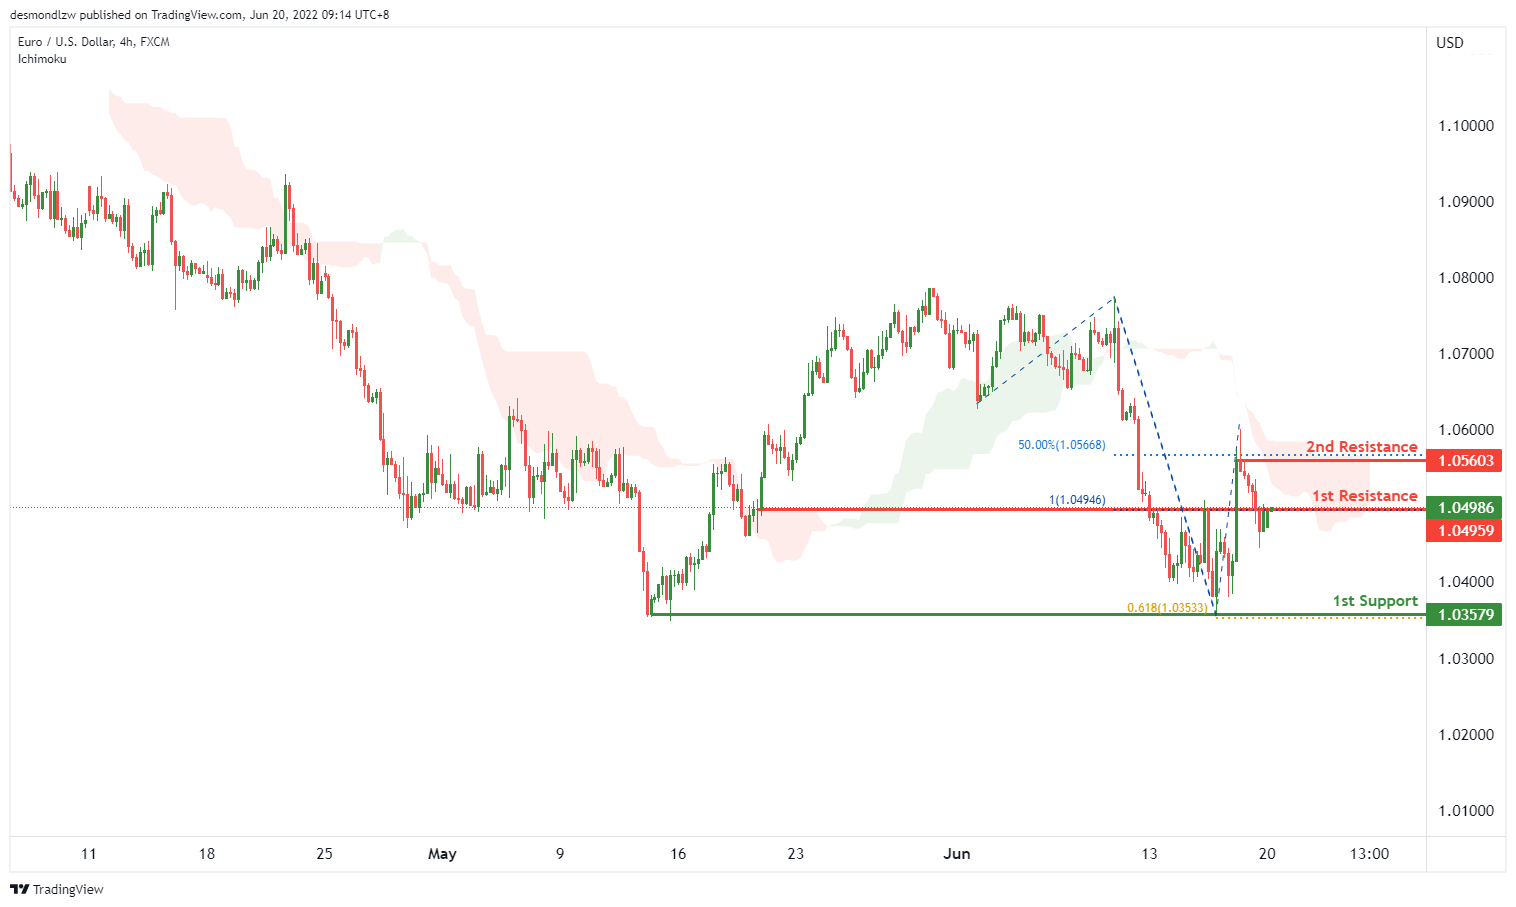
On the H4, with price moving below the ichimoku cloud, we have a bearish bias that price will continue to drop from the 1st resistance at 1.04959 in line with the 100% fibonacci projection and pullback resistance to the 1st support at 1.03579 in line with the 61.89% fibonacci projection and horizontal swing low. Alternatively price may reverse off the 1st resistance and rise to the 2nd resistance at 1.05603 in line with the swing high and 50% fibonacci retracement.
Areas of consideration :
- H4 1st resistance at 1.04959
- H4 1st support at 1.03579
USD/JPY:
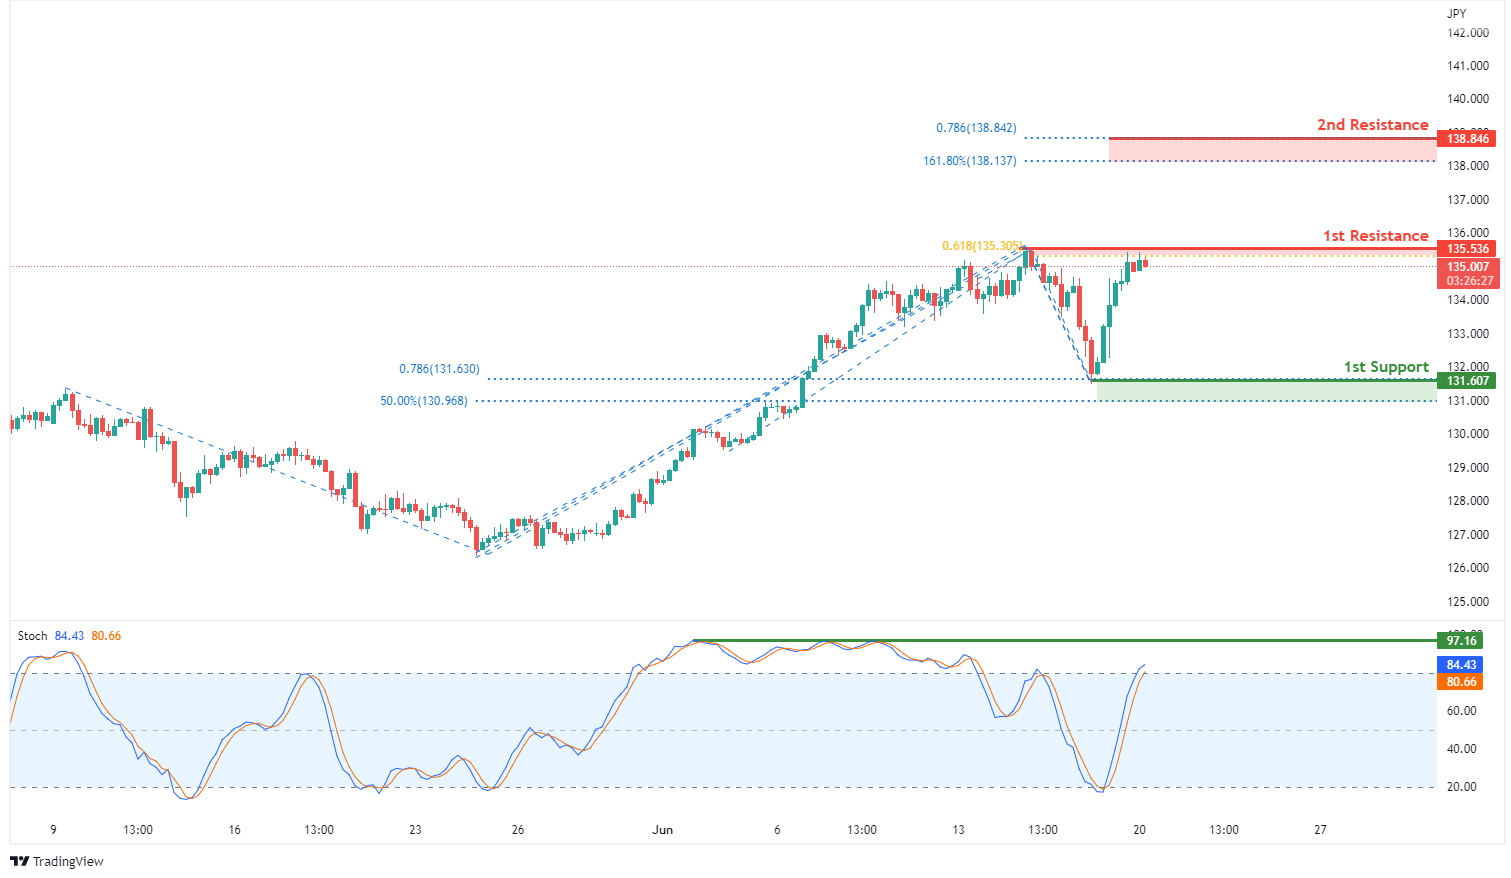
On the H4, with price approaching and expected to reverse off stochastic indicator, we have a bearish bias that price will drop from our 1st resistance at 135.536 in line with the swing high resistance and 61.8% fibonacci projection to our 1st support at 131.607 in line with the swing low support,78.6% fibonacci projection and 50% fibonacci retracement . Alternatively, price may break 1st resistance structure and head for 2nd resistance at 138.846 where the 161.8% fibonacci extension and 78.6% fibonacci projection are.
Areas of consideration:
- H4 time frame, 1st resistance at 135.536
- H4 time frame, 1st support at 131.607
AUD/USD:
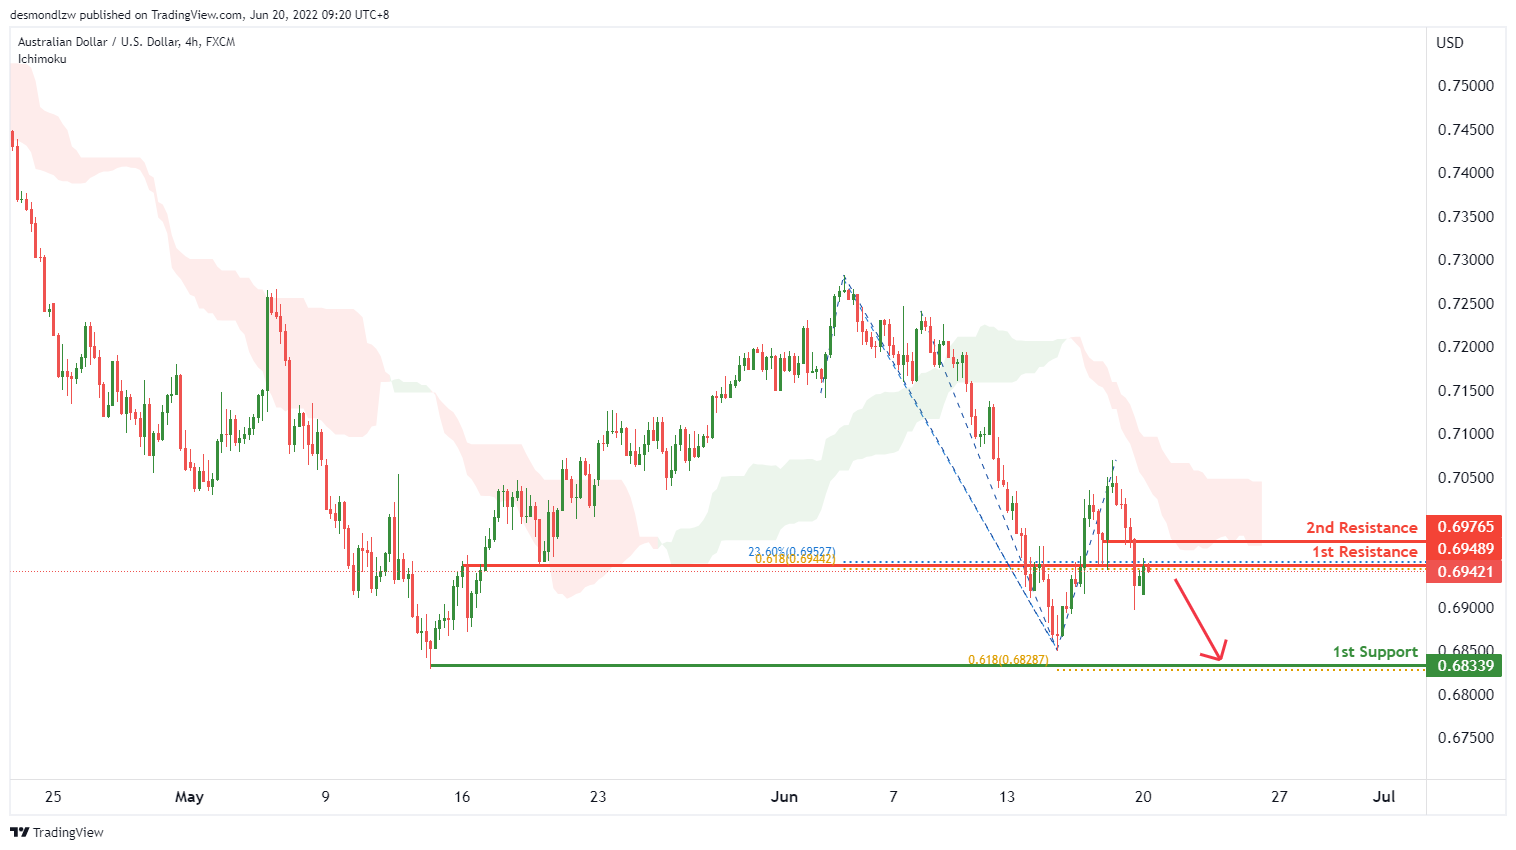
On the H4, with price moving below the ichimoku cloud, we have a bearish bias that price will continue to drop from the 1st overlap resistance at 0.69489 in line with the 61.8% fibonacci projection and 23.6% fibonacci retracement to the 1st support at 0.68339 in line with the 61.8% fibonacci projection and horizontal swing low. Alternatively price may reverse off the 1st resistance and rise to the 2nd resistance at 0.69765 in line with the pullback resistanc
Areas of consideration
- H4 1st resistance at 0.69489
- H4 1st support at 0.6833
NZD/USD:
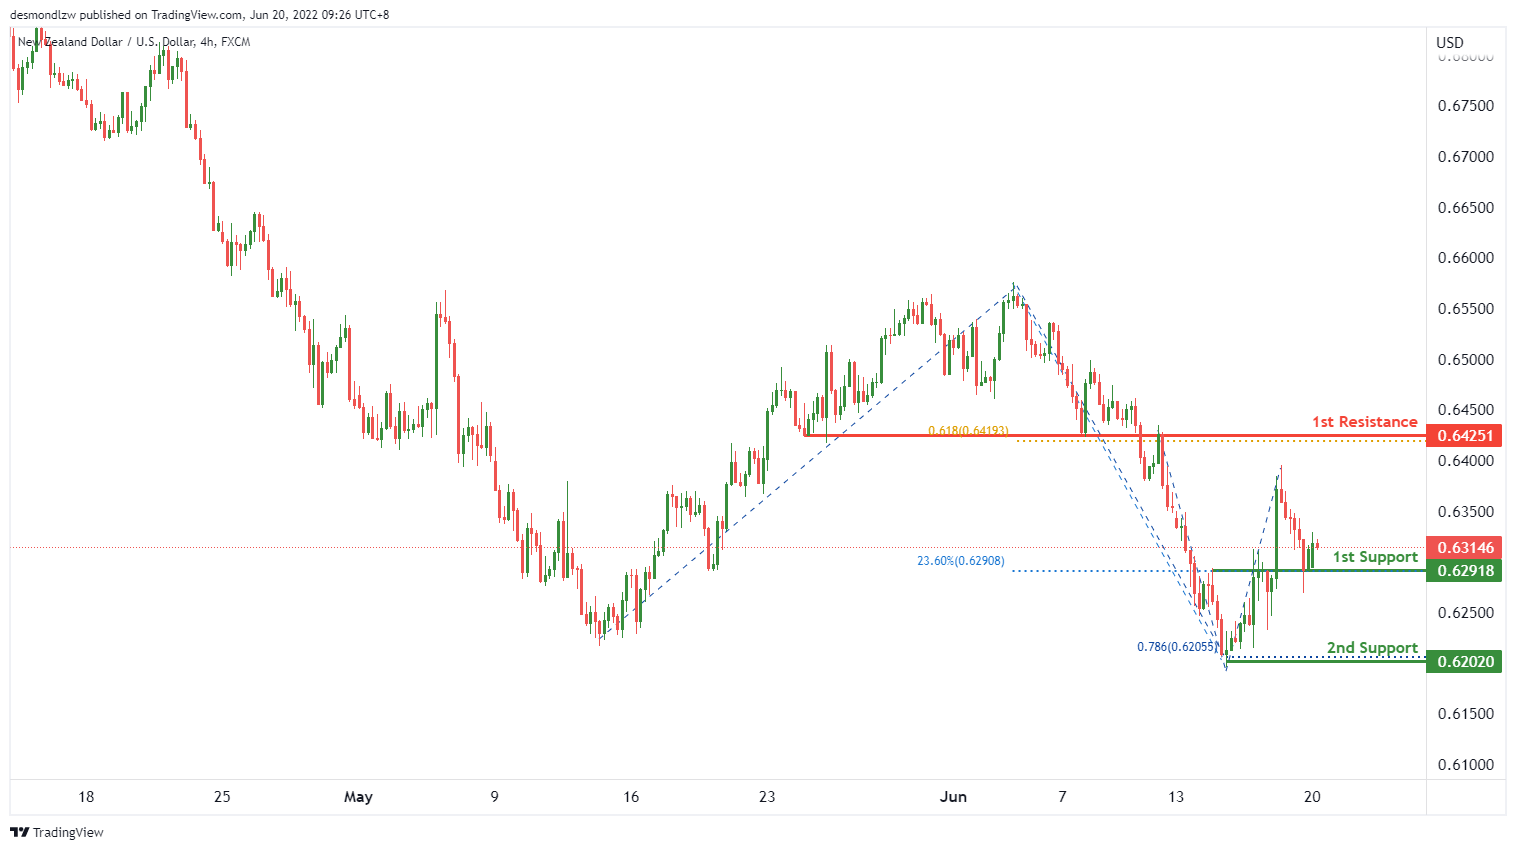
On the H4, we have a bullish bias that price will continue to rise from the 1st overlap support at 0.62918 in line with the 23.6% fibonacci retracement to the 1st resistance at 0.62451 in line with the 61.8% fibonacci projection at the overlap resistance. Alternatively, price may drop form the 1st support to 2nd support at 0.62020 in line with 78.6% fibonacci projection and horizontal swing low.
Areas of consideration:
- H4 time frame, 1st support at 0.62918
- H4 time frame, 1st resistance at 0.62451
USD/CAD:
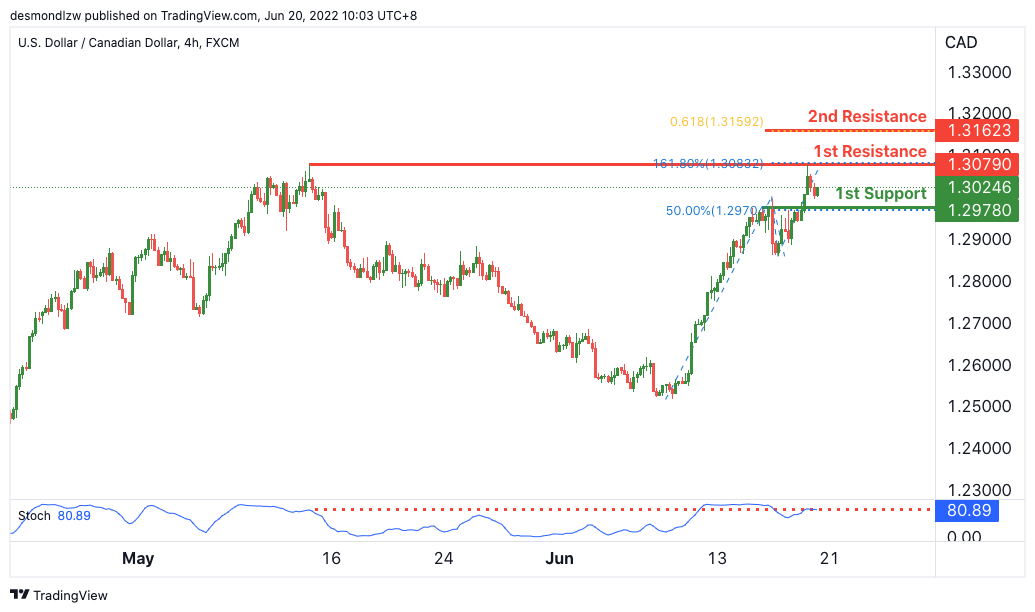
On the H4, with price expected to reverse off the stochastics indicator, we have a bearish bias that price will rise from our 1st resistance where the horizontal swing high resistance and 161.8% Fibonacci projection is to our 1st support at 1.29780 in line with the horizontal pullback support and 50% Fibonacci retracement. Alternatively, price may head for 2nd resistance where the 61.8% Fibonacci projection is.
Areas of consideration:
- H4 time frame, 1st resistance at 1.30780
- H4 time frame, 1st support at 1.29780
OIL:
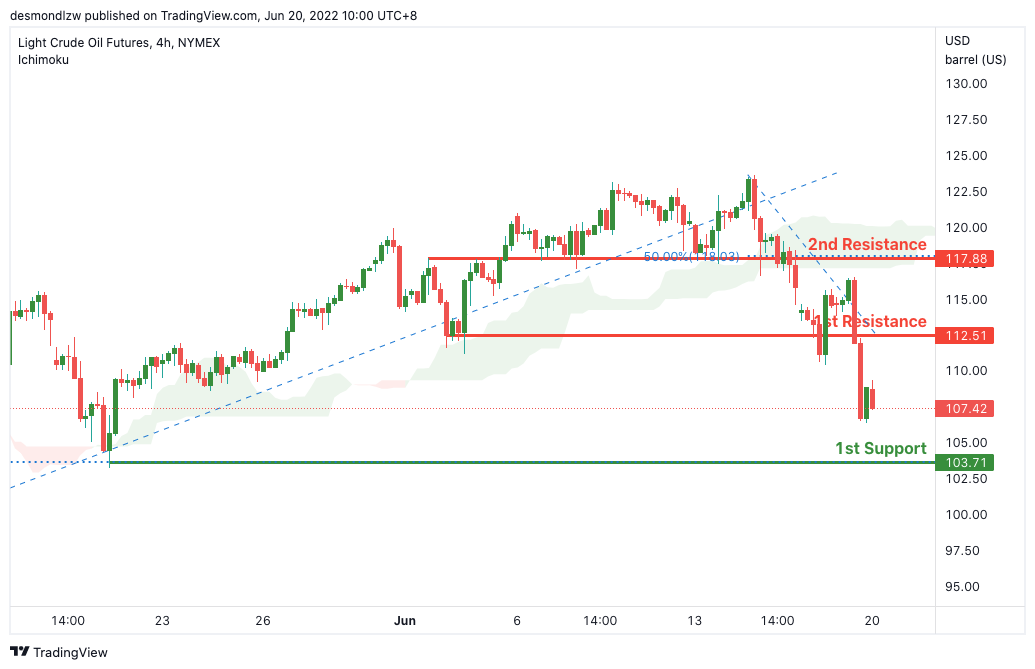
On the H4, with price moving below the ichimoku cloud, we have a bearish bias that price will rise from our 1st resistance at 112.51 where the horizontal swing low support is to our 1st resistance at 103.71 in line with the horizontal swing low support. Alternatively, price may head for 2nd resistance where the horizontal pullback resistance and 50% Fibonacci retracement is. Take note that we are waiting for the break of 1st resistance to confirm the bearish continuation.
Areas of consideration:
- H4 time frame, 1st resistance of 112.51
- H4 time frame, 1st support of 103.71
Dow Jones Industrial Average:
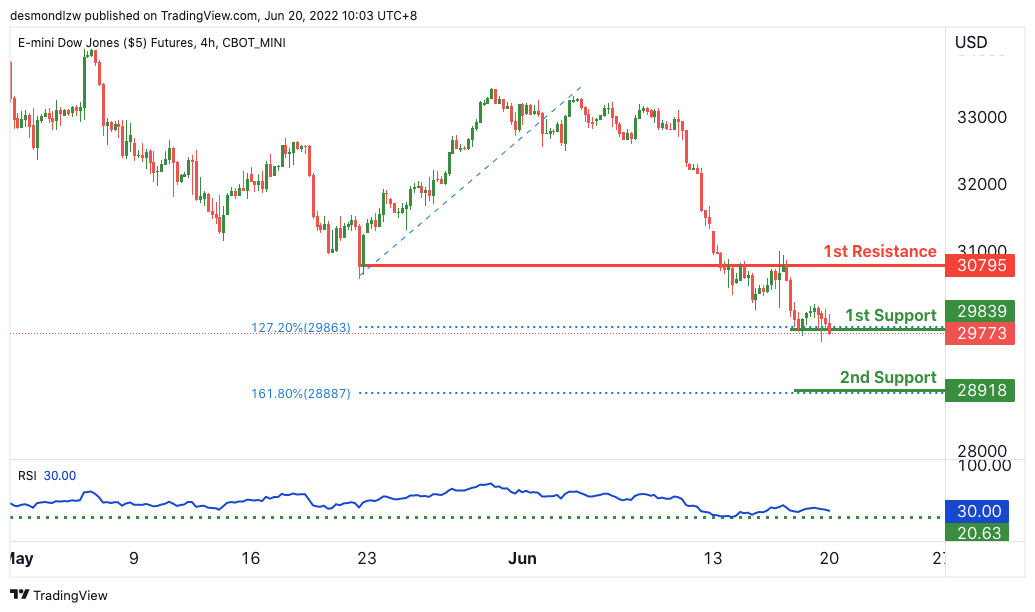
On the H4, with price expected to bounce off the stochastics indicator, we have a bullish bias that price will rise from our 1st support at 29839 where the 127.2% Fibonacci extension is to our 1st resistance at 30795 in line with the horizontal pullback support. Alternatively, price may break structure and head for 2nd support where the 161.8% Fibonacci extension is.
Areas of consideration :
- H4 time frame, 1st resistance at 30795
- H4 time frame, 1st support at 29839
Forex and Cryptocurrency Forecast
EUR/USD: Fed FOMC Meeting Results
Last week's events were based on Friday, June 10, when US inflation statistics were released, which amounted to 8.6% against the expected 8.3%. Having learned these disturbing data, market participants began to include in dollar quotes the possibility of raising the interest rate by 0.75% instead of the previously predicted 0.5%. Some hotheads even talked about its increase by 1.0% straight away. As a result, the FOMC (Federal Open Market Committee) at its meeting on Wednesday, June 15, raised the key rate to 1.75%, that is, by 0.75%.
According to Fed Chairman Jerome Powell, this was the most aggressive round of monetary tightening since 1994. Moreover, the US Central Bank, despite the threat of a recession, intends to follow the chosen course further, raising the rate by another 50 or 75 basis points at the next meeting.
Following the FOMC meeting, the inflation estimates for 2022 were revised from 3.4% to 5.2%, and the forecast for the key rate was raised from 1.9% to 3.4%. At the same time, Jerome Powell hopes that this will not be a shock to the economy, given the strength of the consumer sector and the US labor market. True, despite the optimism of the head of the Fed, the expected rate of economic growth for 2022 was reduced from 2.8% to 1.7%, and the forecast for the unemployment rate, on the contrary, was raised from 3.5% to 3.7%.
In general, Jerome Powell's comments on the regulator's plans turned out to be rather vague, and the market did not understand how strong quantitative tightening (QT) would be and what the prospect of raising the federal funds rate to 4.0% was. As the head of the Fed said, "a rate hike of 75 basis points is unusually large," so he does not think "such hikes will happen often."
As a result, the DXY dollar index reached its maximum (105.47), and the EUR/USD pair reached its minimum (1.0358) not following the FOMC meeting, but directly during it. The reason for the rapid strengthening of the dollar at the beginning of the week was not only the expectations of an unprecedented rate hike, but also poor macroeconomic statistics from Europe. The rate of decline in industrial production in the Eurozone accelerated from -0.5% to -2.0%, although it had been expected that they would slow down on the contrary. The main reason is still the energy crisis caused by anti-Russian sanctions due to Russia's military invasion of Ukraine.
The dollar seemed to have exhausted its upside potential on the evening of June 15, resulting in a rapid bounce on June 16, sending EUR/USD soaring to 1.0600. As for the last day of the working week, the trend changed again after the ECB promised new support to contain the cost of borrowing among the southern countries of the Eurozone. The pair placed the final chord of the five-day period in the zone of 1.0500, at the level of 1.0495.
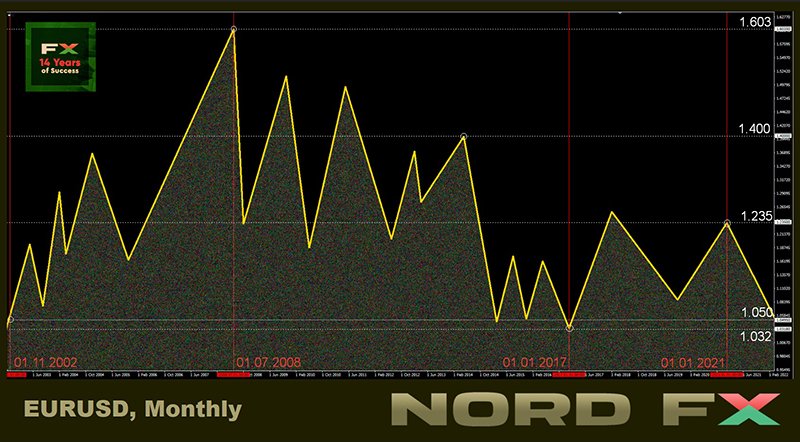
Many analysts believe that the US and European currencies will reach 1:1 parity by the end of the year (or maybe even earlier). In the meantime, the votes of experts are divided as follows on the evening of June 17: 30% side with the bulls, 20% - with the bears, and 50% cannot decide on the forecast. The indicators on D1 give quite unambiguous signals. Among oscillators, 100% are colored red, among trend indicators, 90% are red and 10% are green. Except for 1.0500, the nearest strong resistance is located in the 1.0600 zone, if successful, the bulls will try to break through the 1.0640 resistance and rise to the 1.0750-1.0760 zone, the next target is 1.0800. For the bears, task number 1 is to break through the support in the 1.0460-1.0480 area, and then update the May 13 low at 1.0350. If successful, they will move on to storm the 2017 low of 1.0340, there is only support from 20 years ago below.
As for the events of the upcoming week, Monday, June 20 is a public holiday in the US, the country celebrates Juneteenth. Data from the housing market will come on Tuesday, June 21 and Friday, June 24, and from the US labor market on Thursday. In addition, we will have two speeches by Fed Chairman Jerome Powell in Congress on June 22 and 23. Also we recommend paying attention to the publication of data on business activity in Germany and the Eurozone as a whole on June 23.
GBP/USD: A Pleasant Surprise from BoE
Ahead of the US Fed meeting, the dollar appreciated against the pound by 585 points in just 3 business days, from June 10 to 14, and the GBP/USD pair fell to 1.1932, the lowest level since March 2020. But then the regulator of the United Kingdom stepped in.
At its meeting on Thursday, June 16, the Bank of England (BoE) raised its key rate from 1.00% to 1.25%. It would seem that 25 basis points is only a third of the 75 bp that the Fed raised the rate the day before, but the pound flew up and the pair fixed a local high at 1.2405. The British currency strengthened by 365 points in just a few hours.
The reason for this rally, as often happens, is expectations. First, 3 out of 9 members of the Bank's Management Board supported an increase in the refinancing rate not by 25, but by 50 basis points at once. And secondly, the comments published after the meeting clearly indicated the possibility of accelerating the pace of tightening of monetary policy, starting from the next meeting of the regulator. That is, the rate may reach 1.75%, as early as August 4, which is significantly higher than market forecasts. In addition, the Bank of England intends not to stop there and raise interest rates further.
In contrast to the Fed's vague comments, the BoE was clear enough about its monetary policy that made a positive impression on investors. Analysts also noted that, unlike their colleagues on the other side of the Atlantic, the Bank of England leaders did not shift all the blame for rising inflation to China and Russia.
The pound retreated from the gained positions at the end of the week, and the pair ended the trading session at the level of 1.2215. At the moment, 50% of experts believe that in the near future the pair will try to test the resistance at 1.2400 again, 10%, on the contrary, are waiting for a test of support around 1.2040, the remaining 40% of analysts have taken a neutral position.
Both among trend indicators and among oscillators, 90% indicate a fall, while the remaining 10% look in the opposite direction. Supports are located at the levels 1.2155-1.2170, then 1.2075 and 1.2040. The pair's strong foothold lies at the psychologically important 1.2000 level, followed by the June 14 low at 1.1932. In case of growth, the pair will meet resistance in the zones and at the levels of 1.2255, 1.2300-1.2325, 1.2400-1.2430, 1.2460, then the targets in the area of 1.2500 and 1.2600 follow.
Among the macroeconomic events of the upcoming week concerning the United Kingdom, we can highlight the publication of the May value of the Consumer Price Index (CPI) on Wednesday, June 22, and of a whole package of PMI Indices, reflecting business activity in individual sectors and in the economy of the country generally the next day, on June 23. Retail sales in the UK for May will be announced on Friday, June 24.
USD/JPY: No Surprises from the Bank of Japan
Rising dollar pushes USD/JPY again and again to fresh 20-year highs. Last week, having reached the height of 135.58, it broke the January 01, 2002 record of 135.19. This was followed by a powerful pullback to the level of 131.48 and a no less powerful new upswing, after which the pair finished near the level of 135.00, at around 134.95.
A weak yen, especially in the face of high inflation, is a big problem not only for households, but for the entire Japanese economy, as it increases the cost of raw materials and natural energy imported into the country. However, the Bank of Japan is stubborn to maintain its ultra-soft monetary policy, in contrast to the sharp tightening by the Central banks of other countries. After the US Federal Reserve, the Swiss National Bank and the Bank of England raised interest rates last week, the Japanese Central Bank left its rate at the previous negative level - minus 0.1% at its meeting on Friday June 17, while promising to maintain the yield of 10-year government bonds at around 0%. There have been several attempts to test the 0.25% yield on government debt over the past weeks, but aggressive buybacks of these securities immediately followed in response.
Japanese officials tried to give some support to the yen on the morning of June 17. The government and the Bank of Japan issued a joint (rarely seen) statement that they were concerned about the sharp fall in the national currency. These words were supposed to indicate to investors that the possibility of adjusting monetary policy is not ruled out at some point. But there was not a word in the statement about when and how this could happen, so the market reaction to it was close to zero.
A number of specialists, such as, for example, strategists at the largest banking group in the Netherlands ING, believe that there is still "an increased risk that USD/JPY will significantly exceed 135.00 in the coming days if the Japanese authorities do not step up and carry out currency intervention".
Most analysts (55%) have long been waiting for the intervention of the authorities, or at least a revival of interest in the yen as a safe-haven currency. However, this forecast has not come true for several weeks. Although it is possible that a strong correction will be repeated, as happened on June 15-16, when the pair fell by 410 points. 35% of experts are counting on updating the high at 135.58, and 10% believe that the pair will take a breather, moving in a sideways trend. For indicators on D1, the picture is very different from the opinion of experts. For trend indicators, all 100% are colored green, for oscillators, 90% of them are, 10% of which are in the overbought zone, and another 10% vote for the red. The nearest support is located at 134.50, followed by zones and levels at 134.00, 133.50, 133.00, 132.30, 131.50, 129.70-130.30, 128.60 and 128.00. It is difficult to determine the further targets of the bulls after the new update of the January 01, 2002 high. Most often, such round levels as 136.00, 137.00, 140.00 and 150.00 appear in the forecasts. And if the pair's growth rates remain the same as in the last 3 months, it will be able to reach the 150.00 zone in late August or early September.
With the exception of the release of the Bank of Japan Monetary Policy Committee meeting report on Wednesday, June 22, no other major events are expected this week.
CRYPTOCURRENCIES: Bloodbath or the Battle for $20,000
Anthony Scaramucci, founder of $3.5 billion investment fund SkyBridge Capital, called it a "bloodbath." And it's hard to disagree with him.
In total, bitcoin lost 70% between November 11, 2021 and June 15, 2022. It has lost about a third of its value in the past week alone. According to some experts, the trigger this time was the announcement of the crypto-lending platform Celsius Network to suspend the withdrawal of funds, their exchange and transfer between accounts "due to extreme market conditions." (As of May, the platform managed $11 billion in user assets.)
However, the general negative macroeconomic background is most likely to blame. This opinion was expressed by industry participants in a survey conducted by The Block. Many experts believe that the crypto markets "would have fallen regardless of Celsius." Bloomberg notes that the market has entered "a period of selling everything except the dollar." Traders are leaving for a "safe harbor" due to more aggressive tightening of the monetary policy of the US Federal Reserve (QT), caused by rising inflation. The market is actively getting rid of risky assets, the S&P500, Dow Jones and Nasdaq stock indices are falling, and bitcoin and other cryptocurrencies along with them.
The price of BTC fell to almost $20,000 on Wednesday June 15, ethereum quotes fell to $1,000, and the capitalization of the crypto market fell to $0.86 trillion. Recall that it had reached $2.97 trillion 7 months ago, in November 2021.
The bear market upsets all investors. But the two largest institutional bitcoin holders have been particularly distinguished. They lost a total of about $1.4 billion on this asset. According to the analytical resource Bitcointreasuries.net, almost 130,000 bitcoins owned by Microstrategy and 43,200 bitcoins owned by Tesla made their owners significantly poorer (we are talking about an unrealized loss yet).
MicroStrategy CEO Michael Saylor spent almost $4 billion ($3,965,863,658) on 129,218 BTC, which is approximately 0.615% of the total issuance of the first cryptocurrency. The fall in the price of bitcoin depreciated the company's investment to $3.1 billion, thus the loss amounted to $900 million. Apart from this, Microstrategy shares also fell to their lowest levels in recent months.
The investment of Elon Mask, whose car company Tesla bought more than 40,000 bitcoins during the 2021 bull market, has also taken a big hit. He lost about $500 million on his investments.
Of course, Michael Saylor and Elon Musk aren't the only ones struggling. The fall of the crypto market hit the largest US crypto exchange as well. Coinbase Global announced the layoff of 1,100 employees (approximately 18% of the entire staff). Shares of Coinbase itself fell in price by 26% over the past week, and its capitalization decreased to $11.5 billion. Director and co-founder of the company Brian Armstrong said that "a recession can cause a new crypto winter that will last for a long time."
Stablecoins also add cold to investors' hearts. The passions for UST (Terra) have not subsided yet, as the USDD of the Tron network has faced a systemic crisis. USDD lost touch with the dollar on June 13, and TRX fell by 22%.
As of this writing, the BTC/USD bull/bear fight is for the 200-week moving average (200WMA). This WMA used to serve as strong support in all previous bear market phases. Until now, bitcoin has never managed to gain a foothold below this line, and we will find out on Monday June 20 if it managed to do so this time. (By "gaining a foothold" traders mean the closing of a candle below a certain level).
Arcane Research believes that the $20,000 level is critical for bitcoin in the context of technical analysis. "Therefore, a possible visit below this level could lead to the capitulation of many hodlers and deleverages." There is also significant open interest in bitcoin options around the $20,000 mark. This is a factor of additional pressure on the spot market if the above level does not withstand the onslaught of bears.
Renowned trader and analyst Tone Vays cites the Bitcoin Momentum Reversal Indicator (MRI), which predicts the life cycles of a trend. At the moment, MRI points to a few more days (4-5) of falling, after which a market reversal may occur.
According to Vays, most likely, the BTC rate will not fall below $19,000. But a further fall is not ruled out: "Is it possible to reach $17,180? I think so. But if the downward movement continues, the next level could be around $14,000. However, in my opinion, bitcoin will not fall so much, and the level of $19,000 will be the lowest mark," the expert said.
This forecast can be considered optimistic. For example, the president of the brokerage company Euro Pacific Capital, Peter Schiff, predicted a fall to $8,000 a month ago. And the American economist and Nobel Prize winner Paul Krugman called cryptocurrencies a fraud and a bubble that will soon burst.
As of Friday evening, June 17, the total crypto market capitalization is at $0.895 trillion ($1.192 trillion a week ago). The BTC/USD pair is trading at $20,500. Bitcoin's Crypto Fear & Greed Index is firmly entrenched in the Extreme Fear zone and was falling to 7 points out of 100 possible (13 weeks ago). This value is comparable to March 2020 values. Then the price of bitcoin bottomed out at $3,800. According to Arcane Research analysts, the index has been in the Fear zone since April 12, which is a duration record. "Market participants are undoubtedly tired of this, many capitulate. Historically, buying has been a profitable strategy in times of fear. However, it is not easy to catch a falling knife," the researchers shared their thoughts.
And finally, a bit of optimism from the founder of SkyBridge Capital, Anthony Scaramucci, with whose words we began this review. In an interview with CNBC, the former politician and White House director of communications not only called what was happening a "bloodbath," but also added that he had survived seven bear markets and he hopes that he will be able to "crawl out" of the eighth.
"All crypto assets have a long-term perspective, as long as they do not face short-term losses," the financier said. "Then investors start tearing their hair out and hitting the wall. It is better to buy a quality crypto asset without being distracted by others and maintain discipline without looking back at the bear markets that sometimes happen. If you remain calm during these periods, you will get rich," Scaramucci encouraged investors.
EUR/USD Weekly Outlook
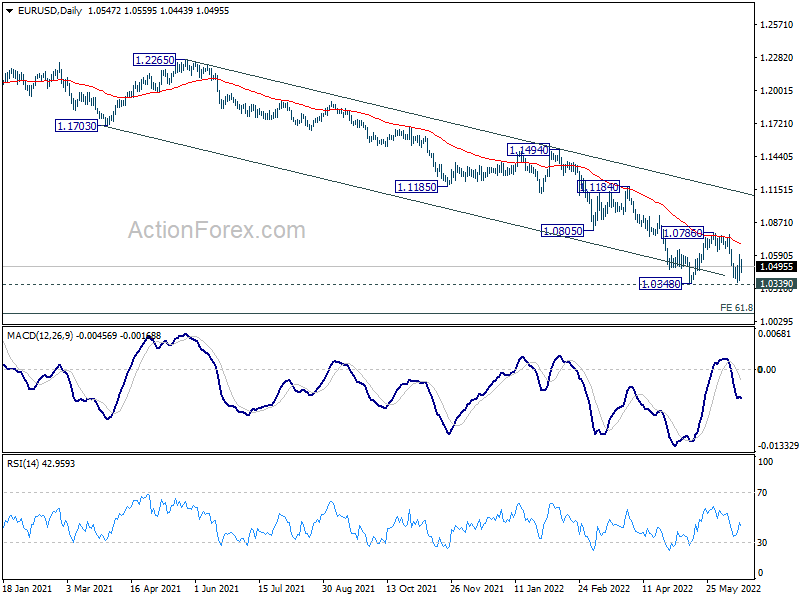
EUR/USD recovered ahead of 1.0339 lower last week but stayed well below 1.0786 resistance. Initial bias remains neutral this week first and further fall is in favor. On the downside, sustained break of 1.0339/48 will resume larger down trend. Next target is long term projection level at 1.0090.
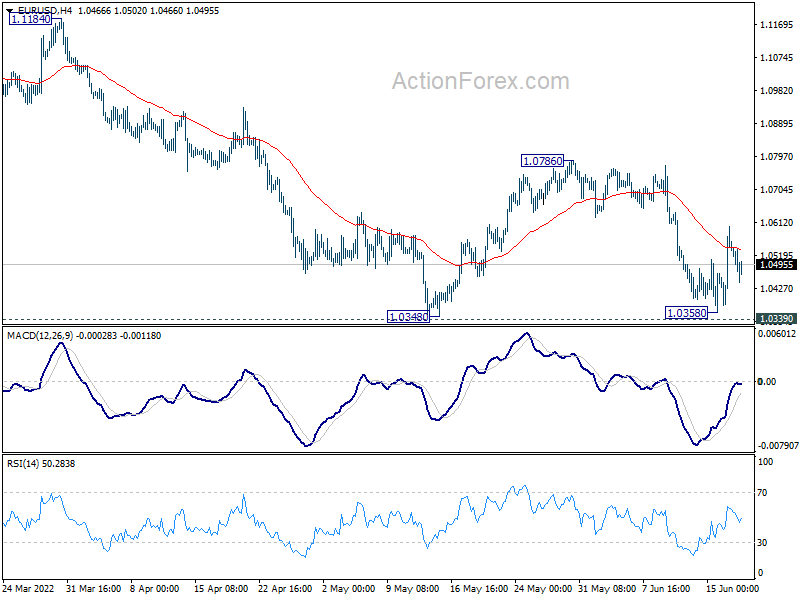
In the bigger picture, focus stays on 1.0339 long term support (2017 low). Decisive break there will resume whole down trend from 1.6039 (2008 high). Next target is 61.8% projection of 1.3993 to 1.0339 from 1.2348 at 1.0090. However, firm break of 1.0805 support turned resistance will delay this bearish case, and bring stronger rebound first.
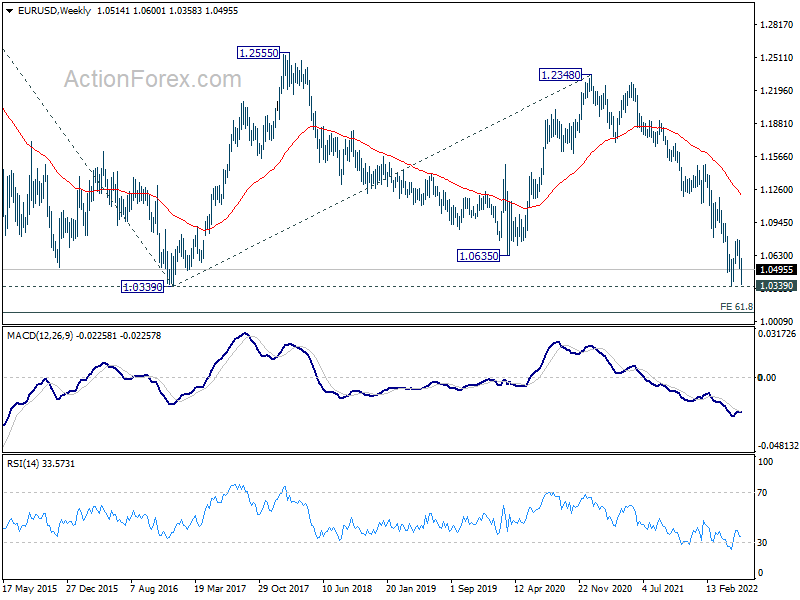
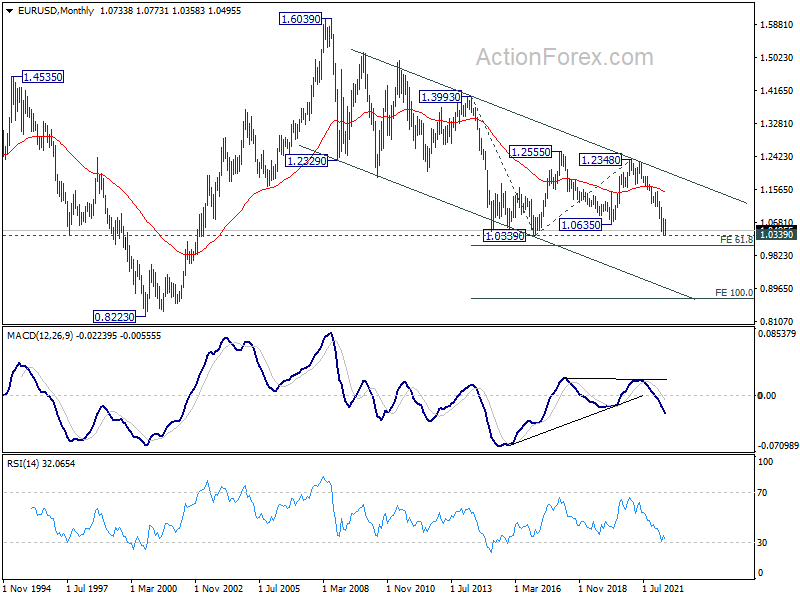
In the long term picture, current development suggests that long term down trend from 1.6039 (2008 high) is ready to resume. Break of 1.0339 will target 61.8% projection of 1.3993 to 1.0339 from 1.2348 at 1.0090. Decisive break there could bring downside acceleration towards 100% projection at 0.8694.
USD/JPY Weekly Outlook
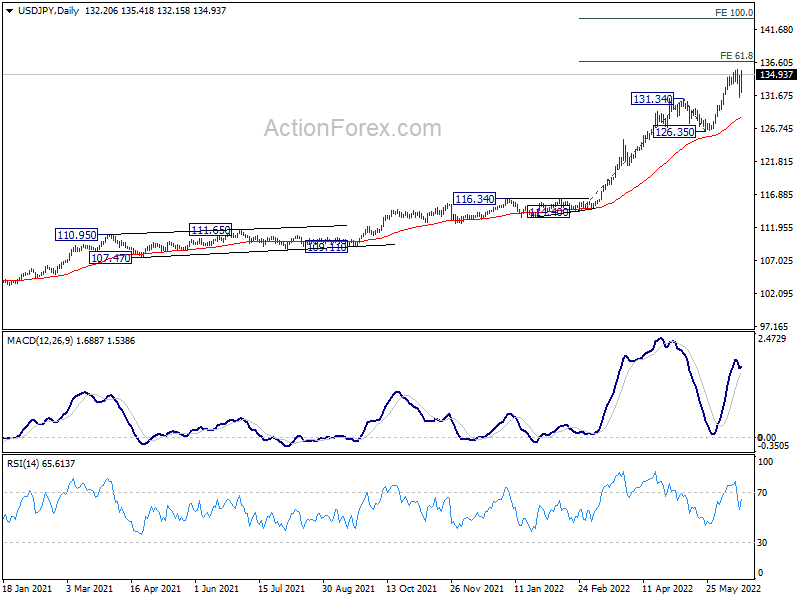
USD/JPY edged higher to 135.58 last week but retreated since then. Initial bias remains neutral this week and some more consolidation cannot be ruled out. But further rally is expected as long as 131.34 support holds. On the upside, break of 135.58 will resume larger up trend to 61.8% projection of 114.40 to 131.34 from 126.35 at 136.81. Firm break there will target 100% projection at 143.29.
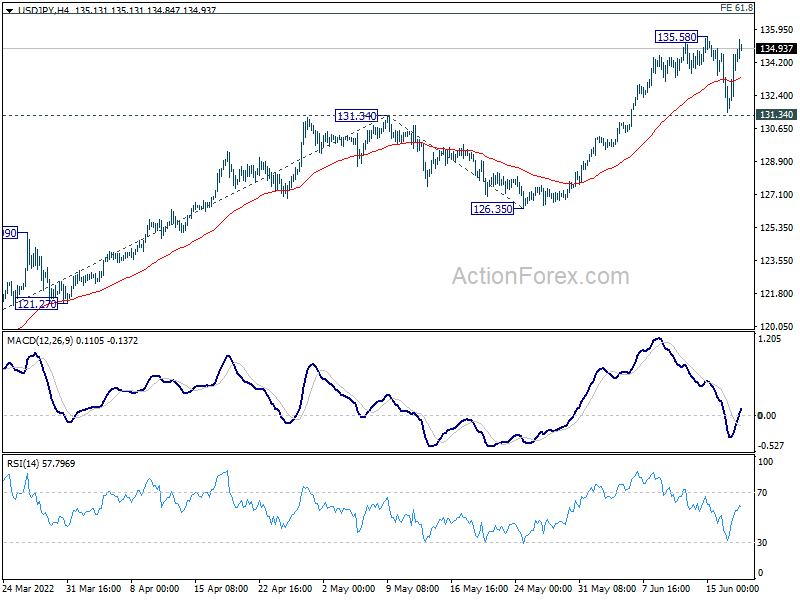
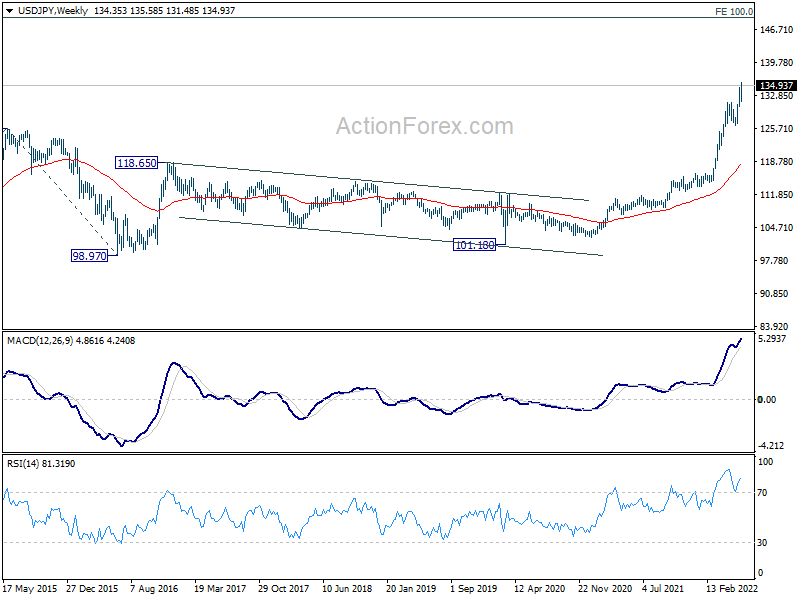
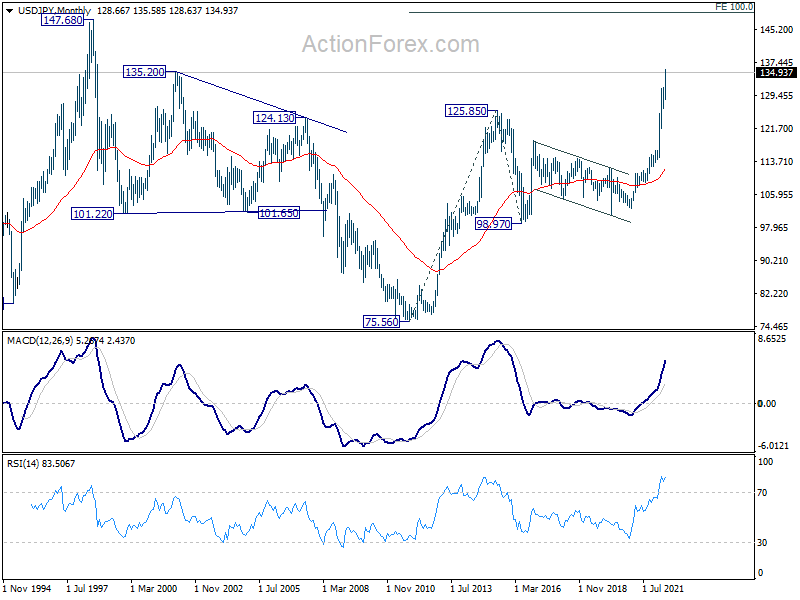
In the bigger picture, current rally is seen as part of the long term up trend from 75.56 (2011 low). Next target is 100% projection of 75.56 (2011 low) to 125.85 (2015 high) from 98.97 at 149.26, which is close to 147.68 (1998 high). This will remain the favored case as long as 126.35 support holds.
In the long term picture, the up trend from 75.56 (2011 low) long term bottom to 125.85 (2015 high) has just resumed. Next target is 100% projection of 75.56 (2011 low) to 125.85 (2015 high) from 98.97 at 149.26, which is close to 147.68 (1998 high).
GBP/USD Weekly Outlook
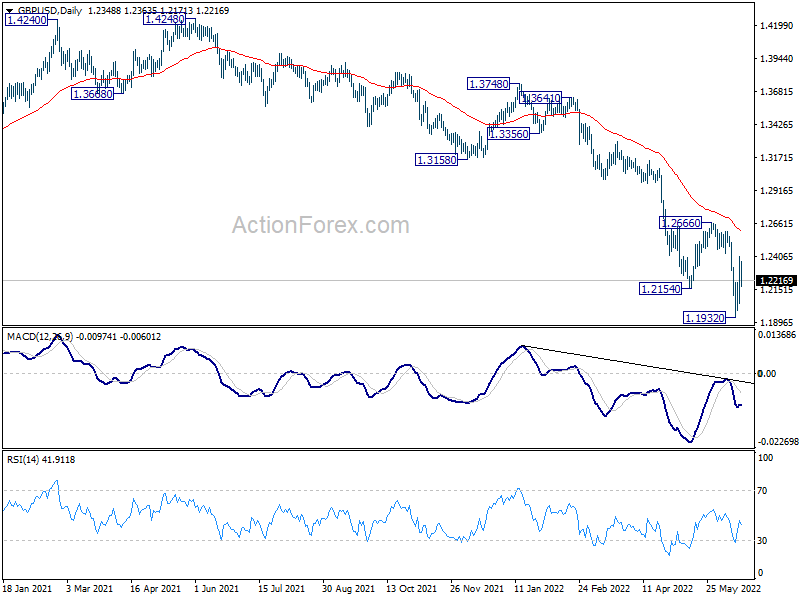
GBP/USD dived further to as low as 1.1932 last week but quickly recovered. Initial bias remains neutral this week for some consolidations. But outlook stays bearish as long as 1.2666 resistance holds. On the downside, break of 1.1932 will resume larger down trend from 1.4248. However, firm break of 1.2666 will suggest medium term bottoming and bring stronger rebound back towards 1.3158 support turned resistance.
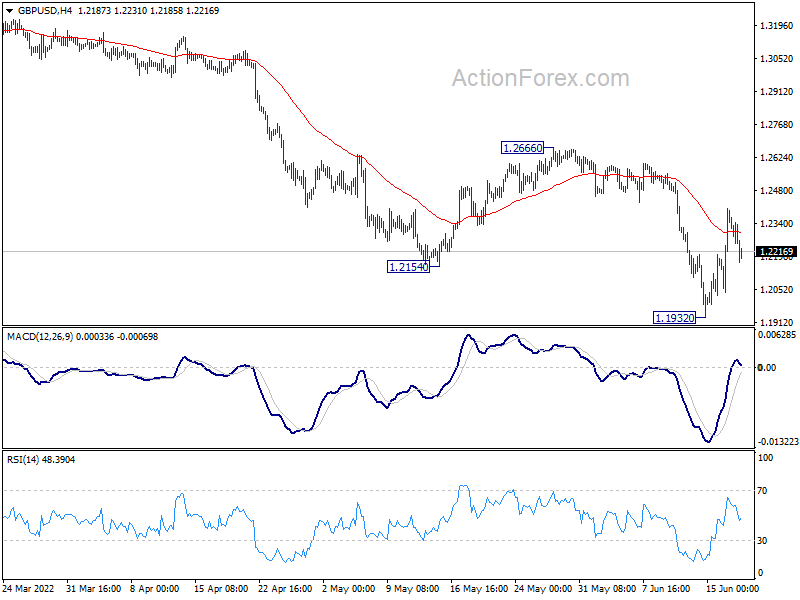
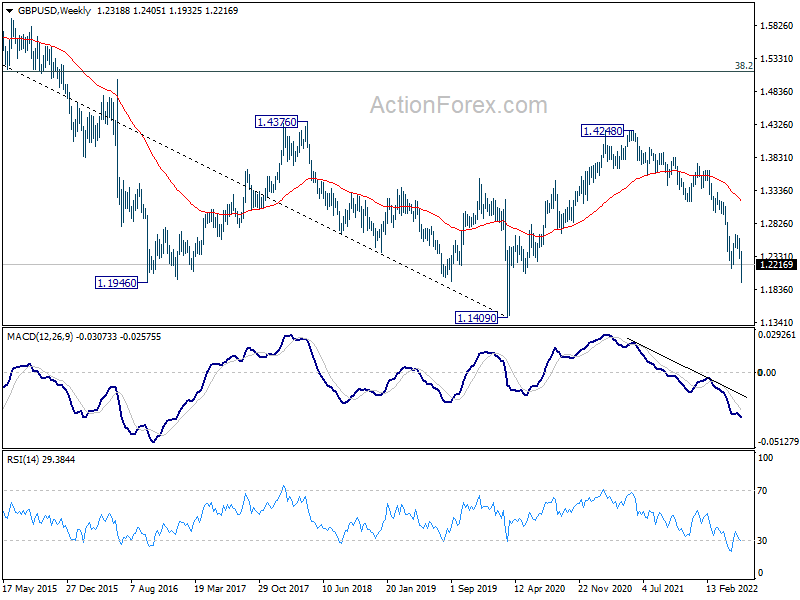
In the bigger picture, fall from 1.4248 (2018 high) could be a leg inside the pattern from 1.1409 (2020 low), or resuming the longer term down trend. Deeper decline is expected as long as 1.2666 resistance holds. Next target is 1.1409 low. However, firm break of 1.2666 will bring stronger rise back to 55 week EMA (now at 1.3175).
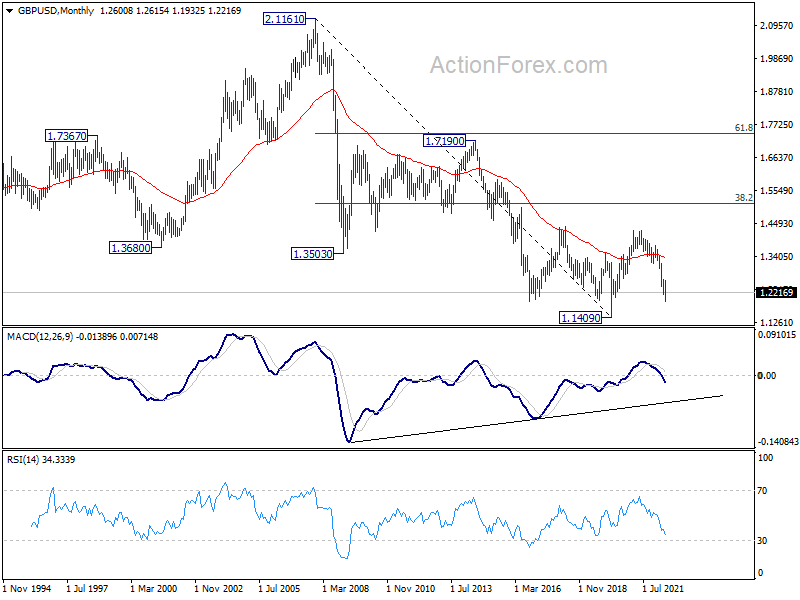
In the longer term picture, rebound from 1.1409 long term bottom should have completed at 1.4248 already, well ahead of 38.2% retracement of 2.1161 to 1.1409 at 1.5134. The development argues that price actions from 1.1409 are developing into a corrective pattern only. That is, long term bearishness is retained for resuming the down trend from 2.1161 (2007 high) at a later stage.
USD/CHF Weekly Outlook
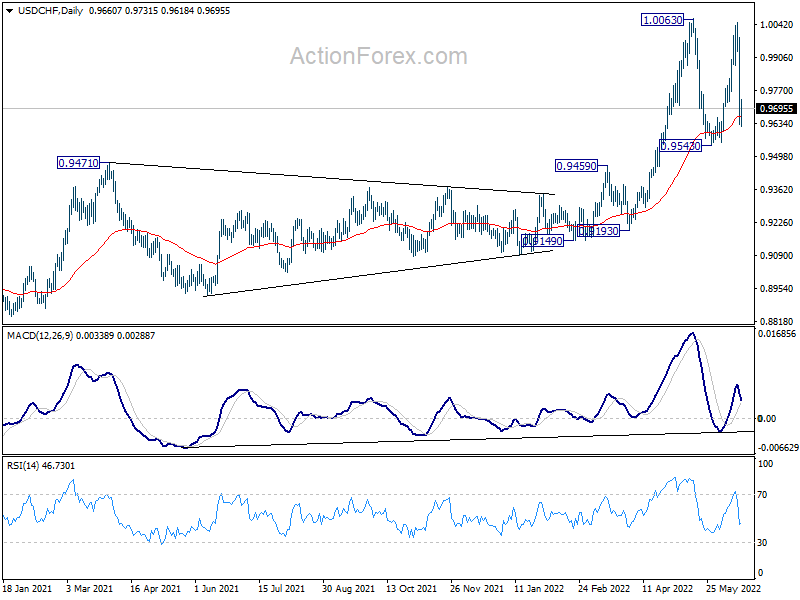
USD/CHF was rejected below 1.0063 resistance last week and dropped sharply. Further fall could be seen this week. However, fall from 1.0048 is viewed as the third leg of the corrective pattern from 1.0063. Strong support should be seen at around 0.9543 to contain downside to bring rebound. On the upside, above 0.9815 minor resistance will turn bias back to the upside for retesting 1.0063 resistance.
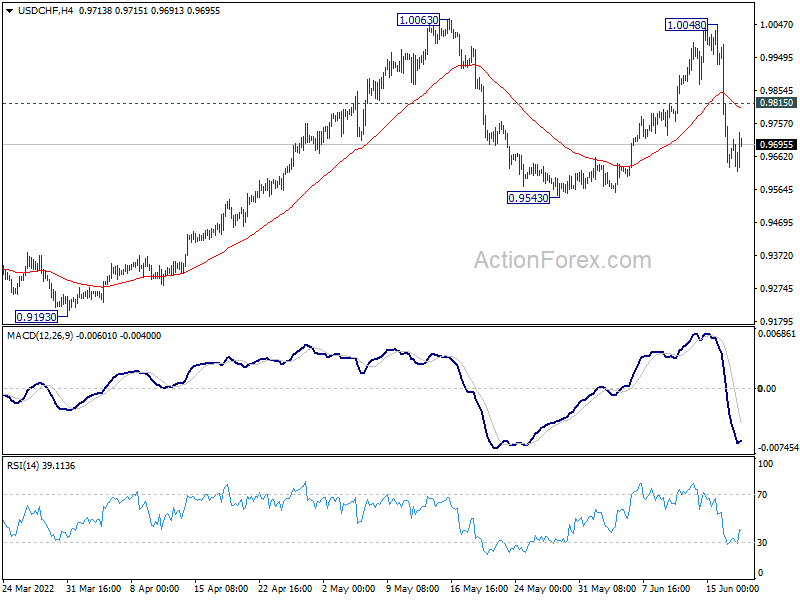
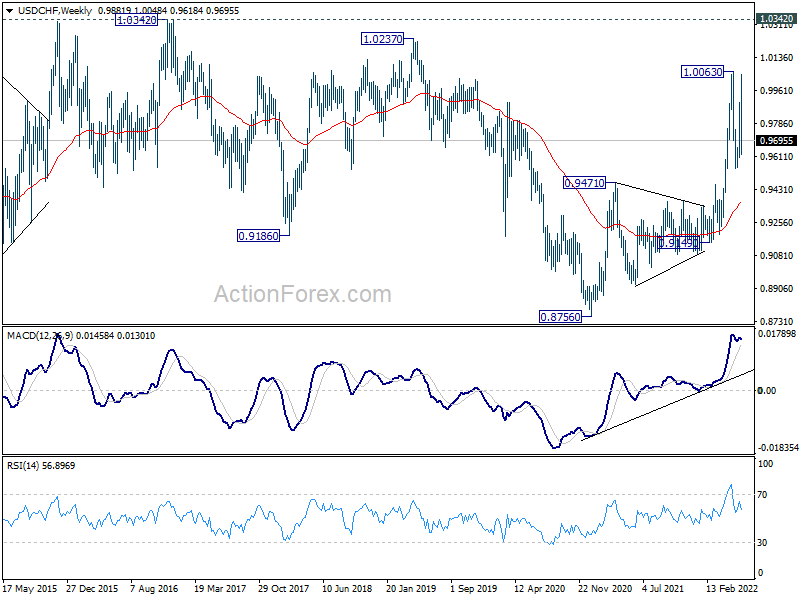
In the bigger picture, down trend from 1.0342 (2016 high) should have completed with three waves down to 0.8756 (2021 low) already. Rise from 0.8756 is likely a medium term up trend of its own. Next target is 1.0237/0342 resistance zone. This will remain the favored case as long as 0.9471 resistance turned support holds. However, sustained break of 0.9471 will extend long term range trading with another falling leg.
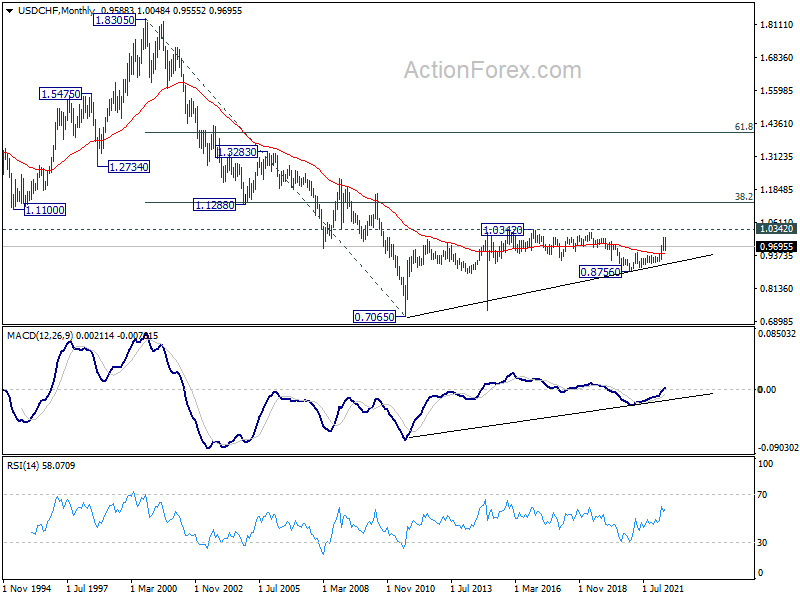
In the long term picture, current development argues that the correction from 1.0342 (2016 high) has completed at 0.8756 (2020 low) already. Rise from 0.7065 (2011 low) might be ready to resume. Firm break of 1.0342 will confirm and target 38.2% retracement of 1.8305 (2000 high) to 0.7065 at 1.1359.
AUD/USD Weekly Outlook
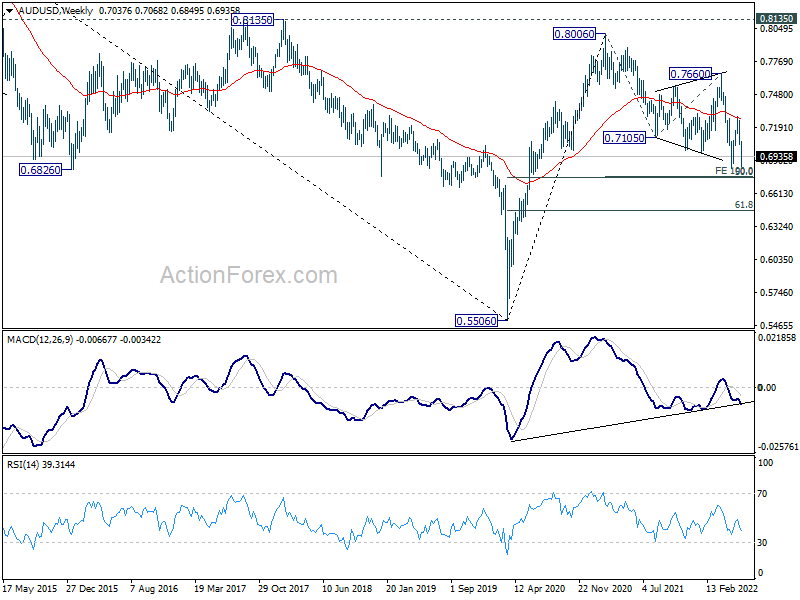
AUD/USD's fall from 0.7282 extended lower last week but recovered ahead of 0.6828 support. Initial bias remains neutral this week first. On the downside, firm break of 0.6828 support will resume larger fall from 0.8006. Next target is 0.6756/60 cluster support. However, firm break of 0.7282 will be a sign of bullish reversal and bring stronger rebound to 0.7666 resistance.
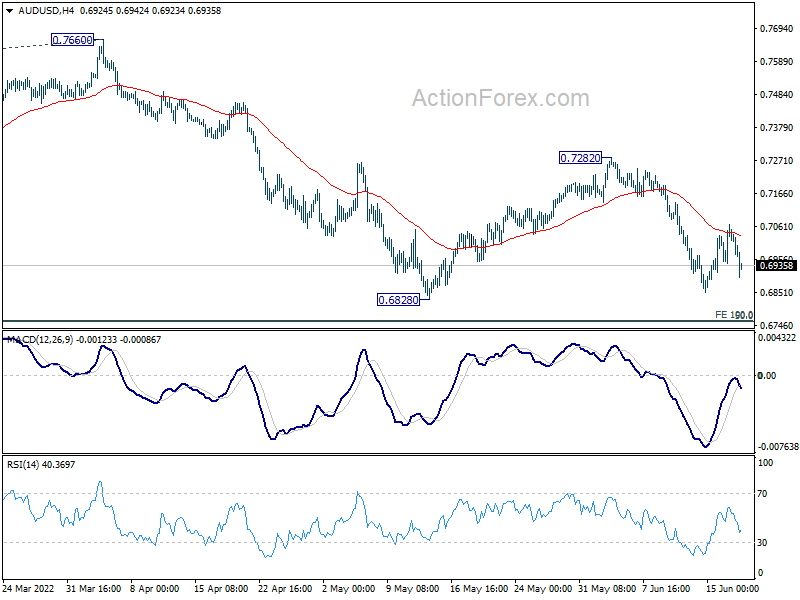
In the bigger picture, price actions from 0.8006 are seen as a corrective pattern to rise from 0.5506 (2020 low). Deeper fall could still be seen to 50% retracement of 0.5506 to 0.8006 at 0.6756. This coincides with 100% projection of 0.8006 to 0.7105 from 0.7660 at 0.6760. Strong support is expected from 0.6756/60 cluster to contain downside to complete the correction. Meanwhile, firm break of 0.7660 resistance will confirm that such corrective pattern has completed, and larger up trend is ready to resume.
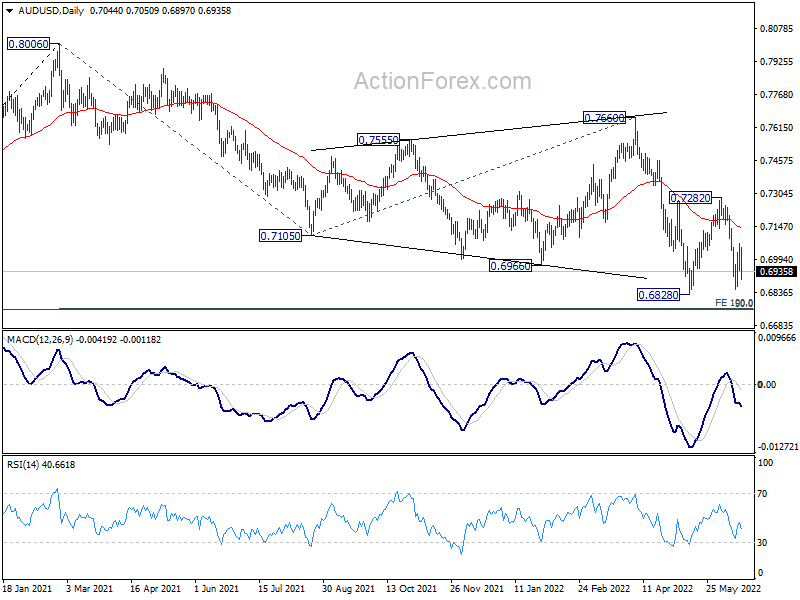
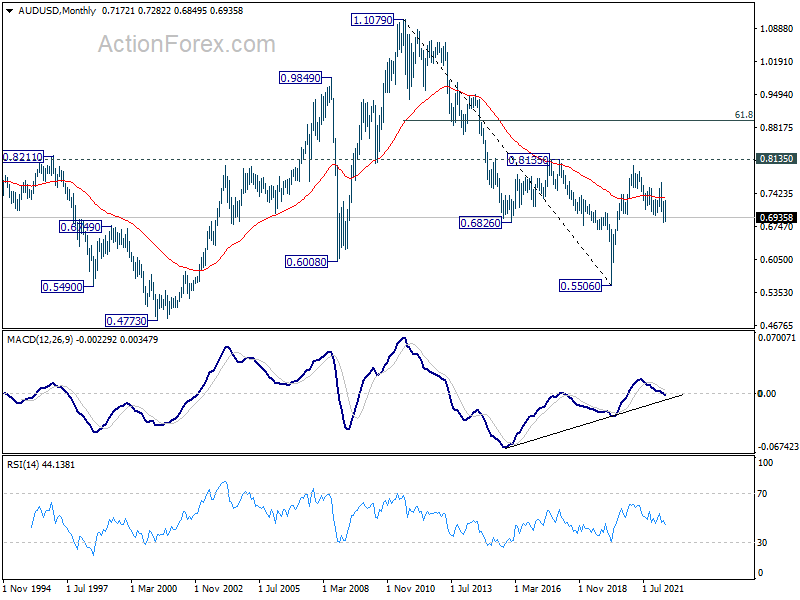
In the longer term picture, focus remains on 0.8135 structural resistance. Decisive break there will argue that rise from 0.5506 is developing into a long term up trend that reverses whole down trend from 1.1079 (2011 high). However, rejection by 0.8135 will keep long term outlook neutral at best.