Sample Category Title
USD/JPY Daily Outlook
Daily Pivots: (S1) 133.61; (P) 134.41; (R1) 135.21; More...
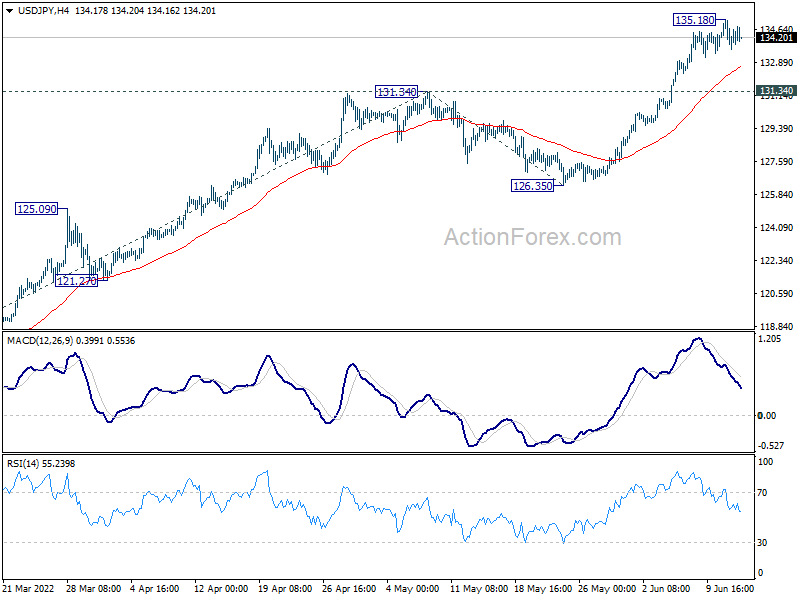
Intraday bias in USD/JPY remains neutral for consolidation below 135.18. Downside should be contained by 131.34 resistance turned support to bring another rally. On the upside, break of 135.18 will resume larger up trend to 61.8% projection of 114.40 to 131.34 from 126.35 at 136.81. Firm break there will target 100% projection at 143.29.
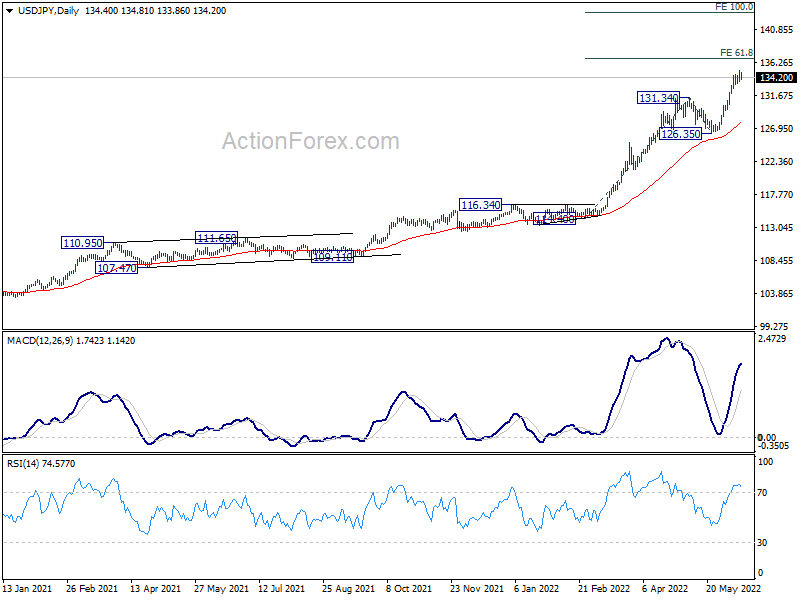
In the bigger picture, current rally is seen as part of the long term up trend from 75.56 (2011 low). Next target is 100% projection of 75.56 (2011 low) to 125.85 (2015 high) from 98.97 at 149.26, which is close to 147.68 (1998 high). This will remain the favored case as long as 126.35 support holds.
USD/CHF Daily Outlook
Daily Pivots: (S1) 0.9898; (P) 0.9946; (R1) 1.0019; More...
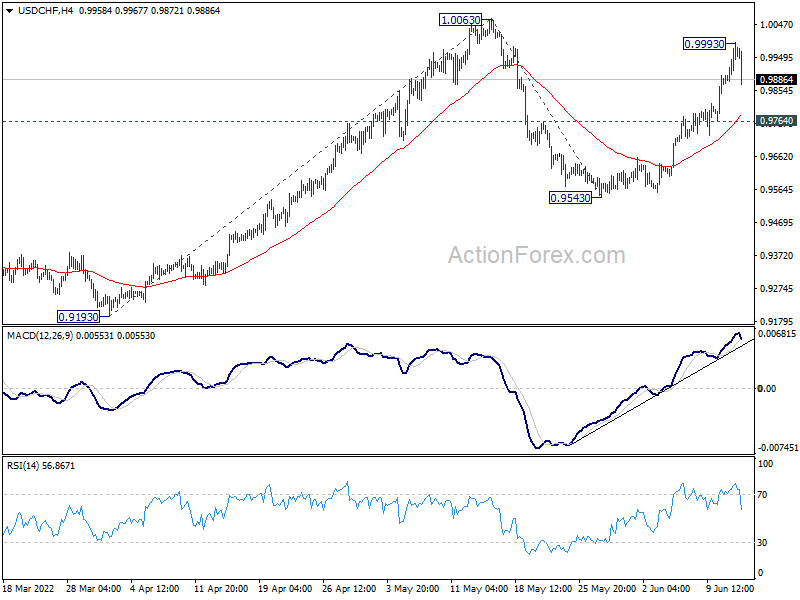
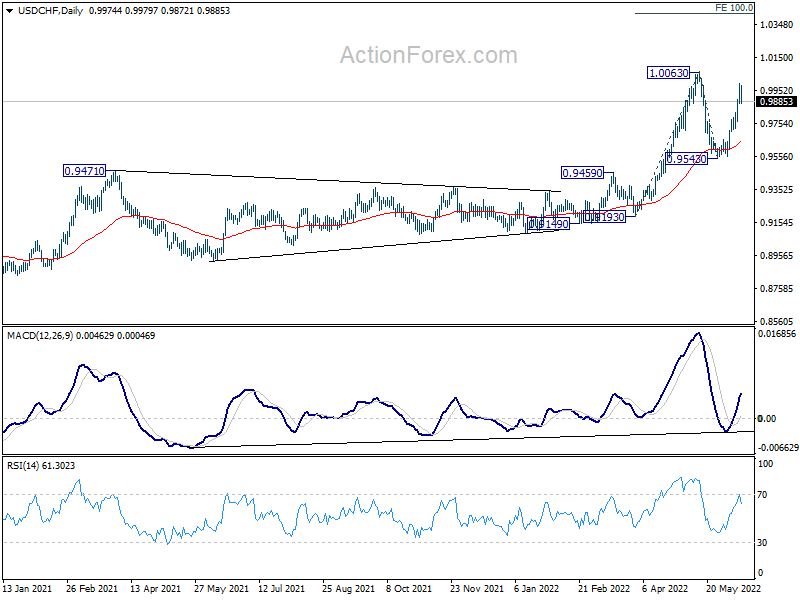
A temporary top is in place at 0.9993 and intraday bias in USD/CHF is turned neutral first. On the upside, above 0.9993 will target 1.0063 resistance. Firm break there will resume larger up trend. Next target is 100% projection of 0.9193 to 1.0063 from 0.9543 at 1.0413. On the downside, below 0.9764 minor support will extend the corrective pattern from 1.0063 with another falling leg, and turn intraday bias to the downside.
In the bigger picture, down trend from 1.0342 (2016 high) should have completed with three waves down to 0.8756 (2021 low) already. Rise from 0.8756 is likely a medium term up trend of its own. Next target is 1.0237/0342 resistance zone. This will remain the favored case as long as 0.9471 resistance turned support holds. However, sustained break of 0.9471 will extend long term range trading with another falling leg.
GBP/USD Daily Outlook
Daily Pivots: (S1) 1.2051; (P) 1.2188; (R1) 1.2269; More...
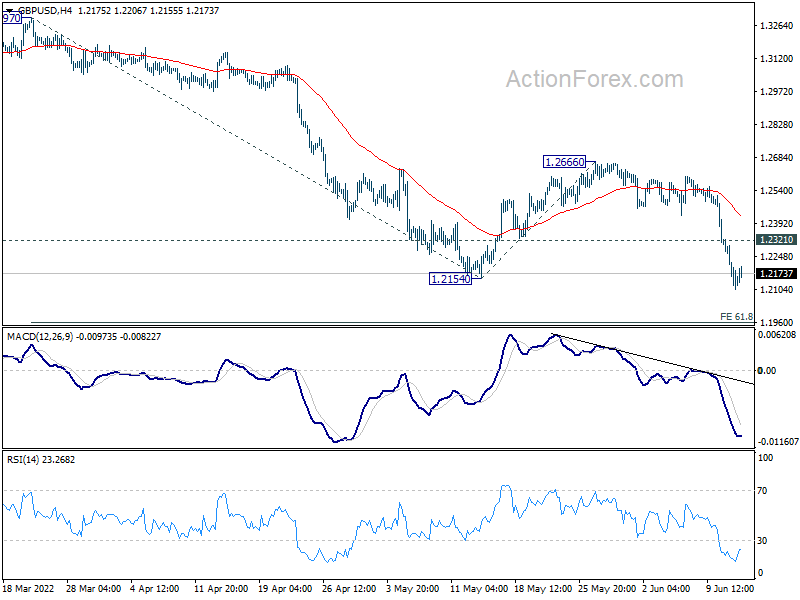
Intraday bias in GBP/USD remains on the downside at this point. Break of 1.2154 confirms down trend resumption. Next target is Next target is 61.8% projection of 1.3297 to 1.2154 from 1.2666 at 1.1960. Break there will target 100% projection at 1.1523 next. On the upside, above 1.2310 minor resistance will turn intraday bias neutral and bring consolidations first, before staging another decline.
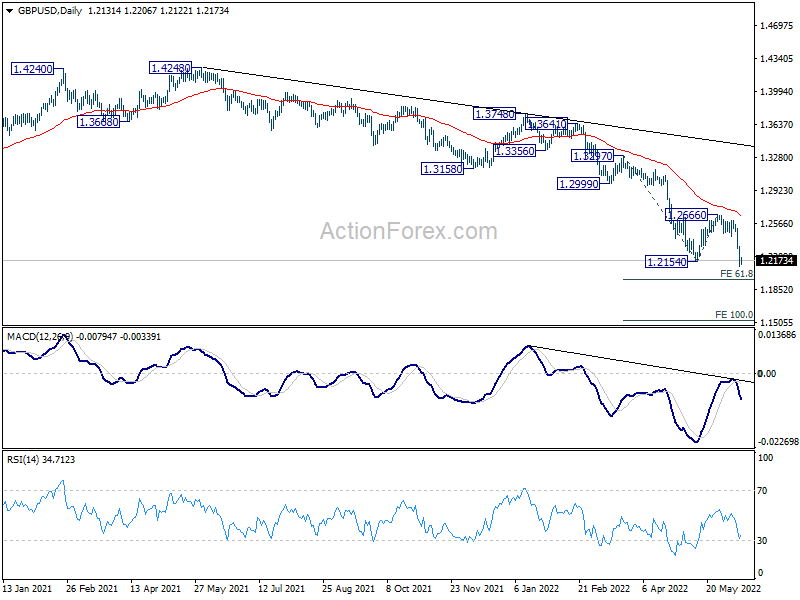
In the bigger picture, fall from 1.4248 (2018 high) could be a leg inside the pattern from 1.1409 (2020 low), or resuming the longer term down trend. Deeper decline is expected as long as 1.2666 resistance holds. On resumption, next target is 1.1409 low.
Bitcoin and Ether Reached Two of Three Bears’ Targets
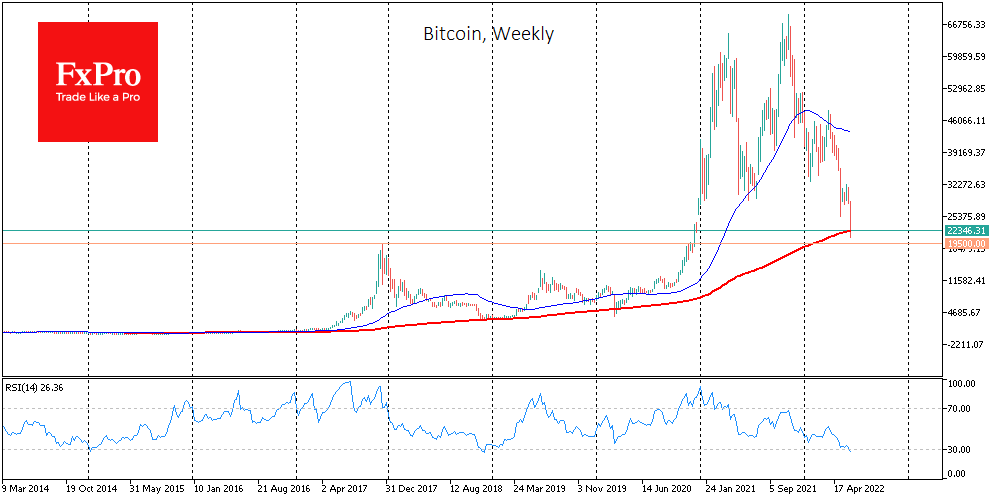
Bitcoin collapsed 15.1% on Monday, ending the day around $23,200 and slipped another 10% on Tuesday morning on inertia before finding support from buyers after touching $20,800.
Ethereum has lost 7.8% in the past 24 hours and more than 30% in the week. The top ten altcoins show buyer optimism, with Solana up 9.5% and Cardano up 7.3%. Among the decline, leaders are Tron with -8% and BNB with -3.5%.
The total capitalisation of the crypto market, according to CoinMarketCap, sank 6% overnight to $0.965 trillion. The Cryptocurrency Fear and Greed Index was down 3 points to 8 by Tuesday and remains in “extreme fear”.
Bitcoin collapsed on Monday at its highest since the March 2020 crisis amid falling stock markets and a rising US dollar. Bitcoin closed the December 2020 gap by feeling the area below the 200-week simple moving average. But in our view, Bitcoin needs to touch levels near 19500: the 2017 peak, which is also where the most aggressive growth phase started at the end of 2020, for a definitive return of long-term buyers.
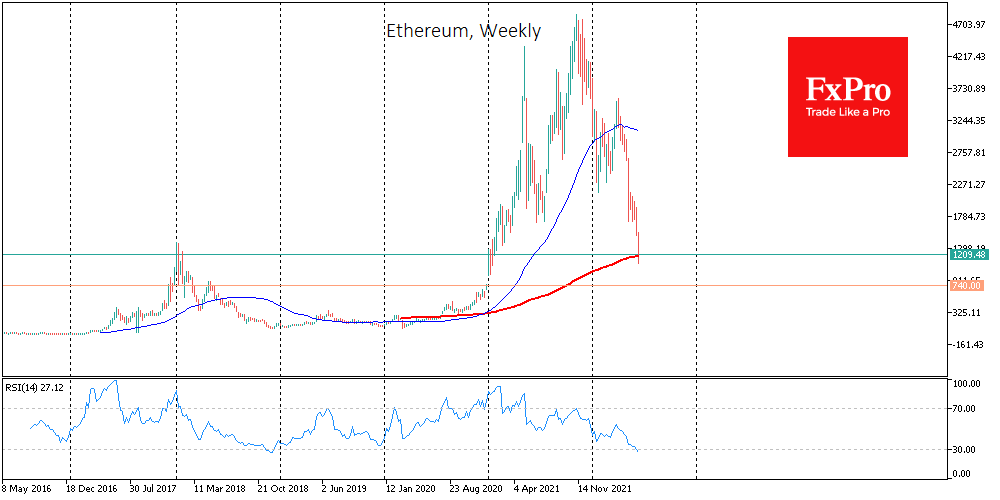
A similar three-point checklist for Ether is also incomplete. ETHUSD touched the 200-week average and dived below the peak levels of the previous cycle in 2018. However, the most aggressive rally at the end of 2020 came from $740, which is well below the day’s lows today at $1075. However, the latter target may prove too ambitious for the bears.
Along with BTC, cryptocurrency-focused stocks also collapsed. MicroStrategy shares lost 25.2%, while Coinbase dropped 11.4%.
The key trigger for the sell-off in the crypto sphere is the US inflation hike to 8.6% on Friday, followed by speculation that the Fed could raise rates by 75 points at Wednesday’s meeting or at the end of July.
According to IntoTheBlock, about half of cryptocurrency holders are now incurring losses. According to Crypto.com CEO Chris Marszalek, the market has entered a phase of “crypto winter” that could drag on, according to Crypto.com CEO Chris Marszalek.
Cryptocurrency lending platform Celsius has suspended withdrawals, exchanges and transactions of digital assets due to “extreme market conditions”. Tether has ruled out the impact of the Celsius incident on USDT reserves.
The US Office of the Comptroller of the Currency has warned of the risks associated with Stablecoin, citing the collapse of the Terra project. The US Treasury Department believes that the country’s authorities should be more proactive in seeking to regulate the crypto industry, given the active digitalisation of the financial sector.
EURJPY Bounces Off 23.6% Fibo and Jumps Above 140.00
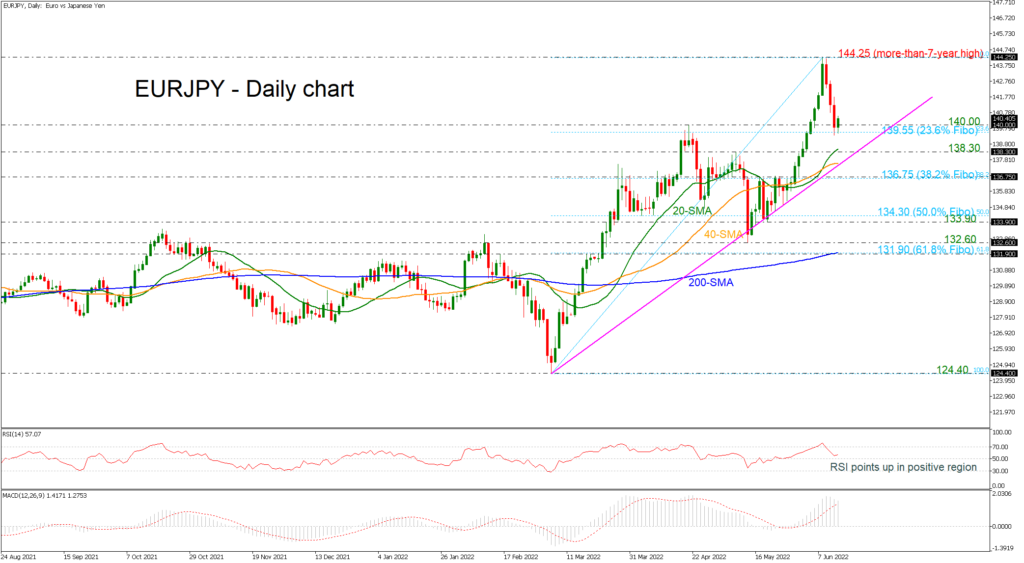
EURJPY is rebounding off the 23.6% Fibonacci retracement level of the up leg from 124.40 to 144.25 at 139.55 and is returning above the 140.00 round number.
According to the MACD, negative momentum could push for further losses in the short-term as the indicator tries to fall below its trigger line. However, the RSI is advancing and is holding above its neutral threshold of 50, confirming the latest bullish movement.
On the upside, resistance could occur around the more-than-seven-year-high of 144.25 ahead of the high of December 2014 at 149.25. Higher still, the inside swing low of March 2008 at 151.70 would increasingly come into scope.
Further declines may meet support around the 140.00 psychological mark and the 23.6% Fibonacci of 139.55. Not far below, support could come from the three-month uptrend line around 138.00. Even lower, a break of the diagonal line may open the way for a test of the 40-day simple moving average (SMA) near 137.60, ahead of the 38.2% Fibonacci of 136.75.
Overall, the very short-term outlook appears mostly bearish, but the broader outlook remains bullish for the most part.
GBPUSD Bearish Outlook Worsens; Signals Discouraging
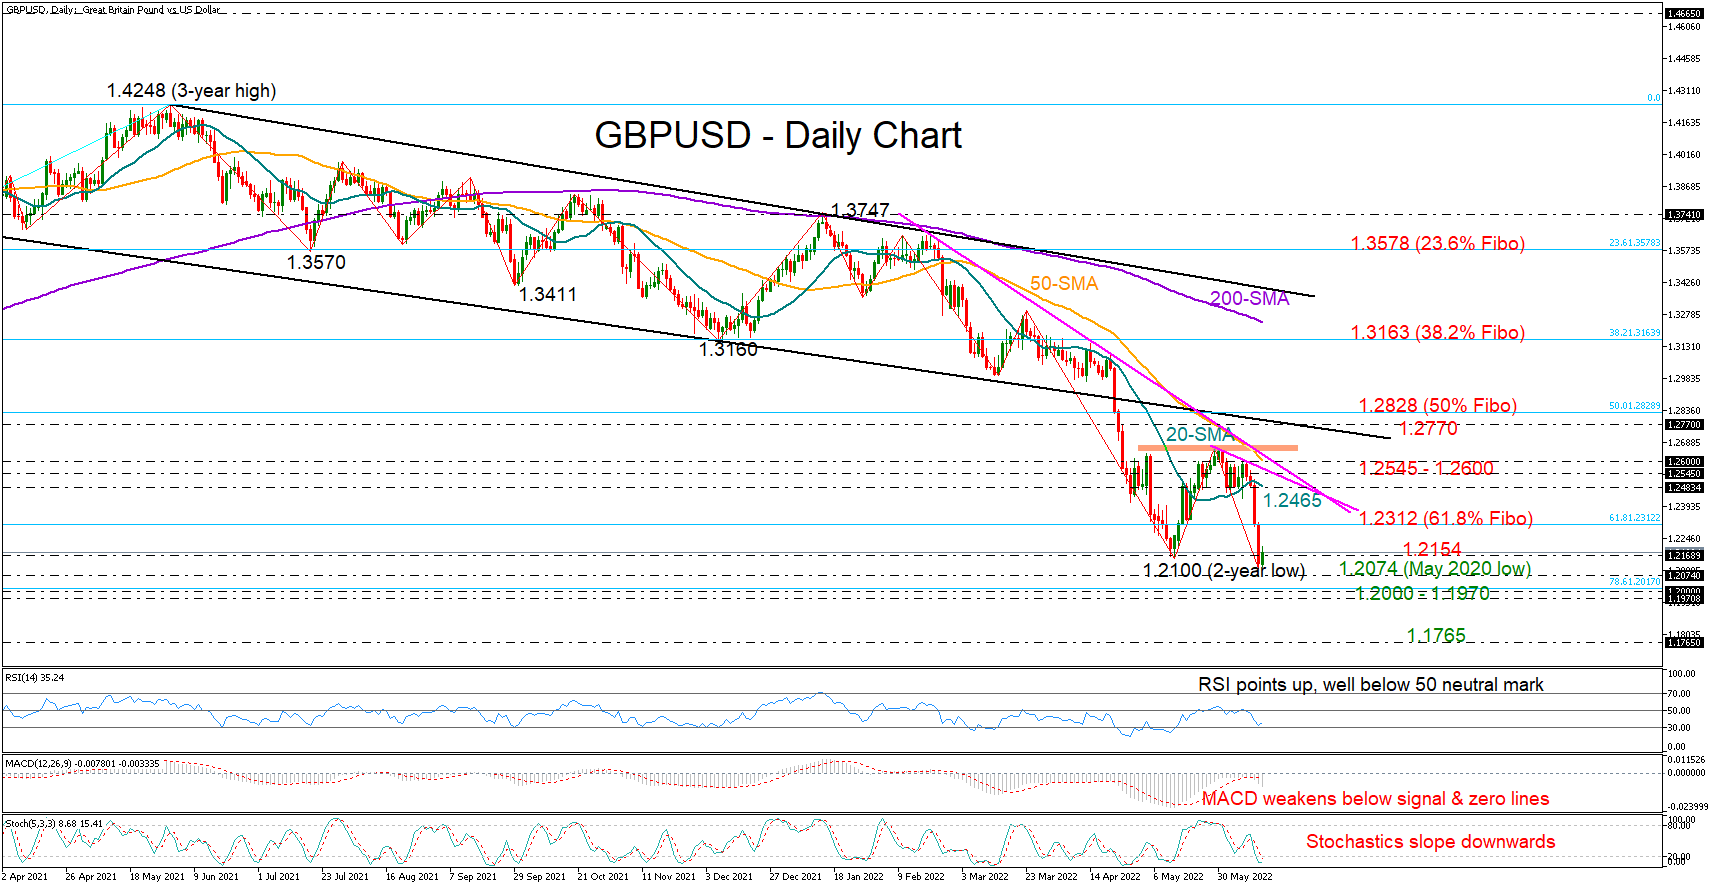
GBPUSD switched to a recovery mode on Monday following last week’s brutal sell-off, which worsened the broad outlook and squeezed the price to a new two-year low of 1.2100.
The previous low of 1.2154 is currently limiting upside pressures as the momentum indicators provide little hope for a meaningful rally. Explaining that, the slight upturn in the RSI is not convincing yet since the indicator remains well dipped in the bearish area, while the negative slope in the Stochastics suggests that the bears have more fuel in the tank. Moreover, the MACD seems to have started a new bearish round below its red signal and zero lines.
If sellers dominate below the 1.2100 round-level, the next pivot point could develop somewhere between the 1.2074 low from May 2020 and the 1.2000 psychological number, where the 78.6% Fibonacci retracement of the 2020 – 2021 uptrend is also placed. The 1.1970 restrictive zone may immediately attract attention before the decline sharpens towards the 1.1765 handle.
In the positive scenario, where the pair snaps the nearby block at 1.2154, the recovery could continue towards the 61.8% Fibonacci of 1.2312. An extension higher could initially pause near the 20-day simple moving average (SMA) at 1.2483 and then face a more challenging battle within the 1.2545 – 1.2600 zone, formed by two tentative descending trendlines and the 50-day SMA. If the latter proves easy to claim and the price crawls above May’s high of 1.2665, the next target could be the bottom-line of the broken bearish channel seen around 1.2770.
In short, although GBPUSD is pushing for some recovery, buying interest is currently looking weak. Hence, the market is expected to face some extra losses before the next bullish phase takes place.
USD/JPY: Bulls Pausing Under Key Long-Term Support
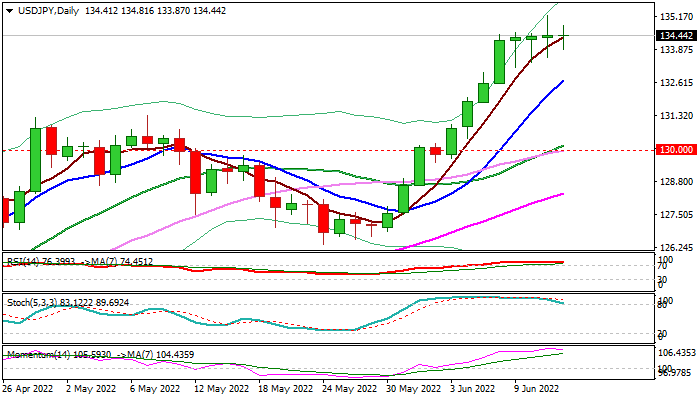
Triple daily Doji and early Tuesday’s action moving within a narrow range suggest that bulls faced headwinds after initial attempt through key long-term barrier at 135.06 (2002 high).
Overbought daily studies and strong bullish momentum starting to fade, add to initial signals that the pair may hold in extended consolidation or even correct the latest upleg from 126.36 (May 24 trough).
Overall structure remains bullish, with dollar supported by rising expectations of more aggressive than expected Fed rate hike, as well as widening gap between Fed and BoJ policies.
Shallow dips should be ideally contained by rising 10DMA (132.69) with extended downticks to find ground above pivotal Fibo support at 131.82 (38.2% of 126.36/135.19 upleg) to keep bulls in play.
Only firm break here would put bulls on hold for deeper correction.
Res: 135.16; 136.32; 138.22; 139.39.
Sup: 133.11; 132.69; 131.82; 131.34.
Daily Technical Analysis
EUR/USD
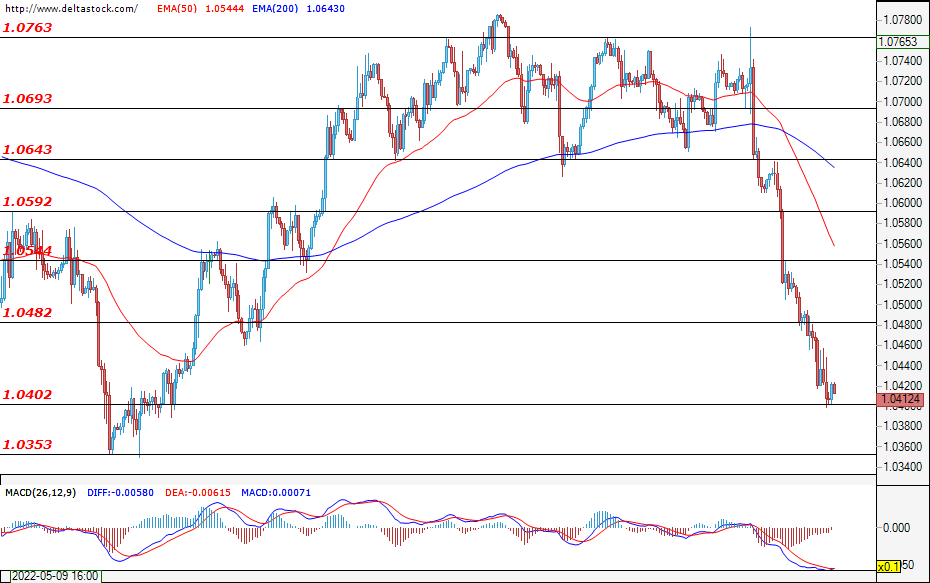
The single European currency continues to lose ground against the U.S. dollar as the breach of the 1.0480 support zone from the previous session gave additional impetus to the bears. They, in turn, without hesitation led the market towards the area of the next significant support at 1.0400. The return of the bulls will be relatively difficult with such a predominantly bearish sentiment. The first important resistance for the buyers is the 1.0480 zone, with the most likely scenario at the moment being for a consolidation at around the current level. Today, volatility will most likely spike after the announcement of the PPI for the U.S. at 12:30 GMT.
USD/JPY
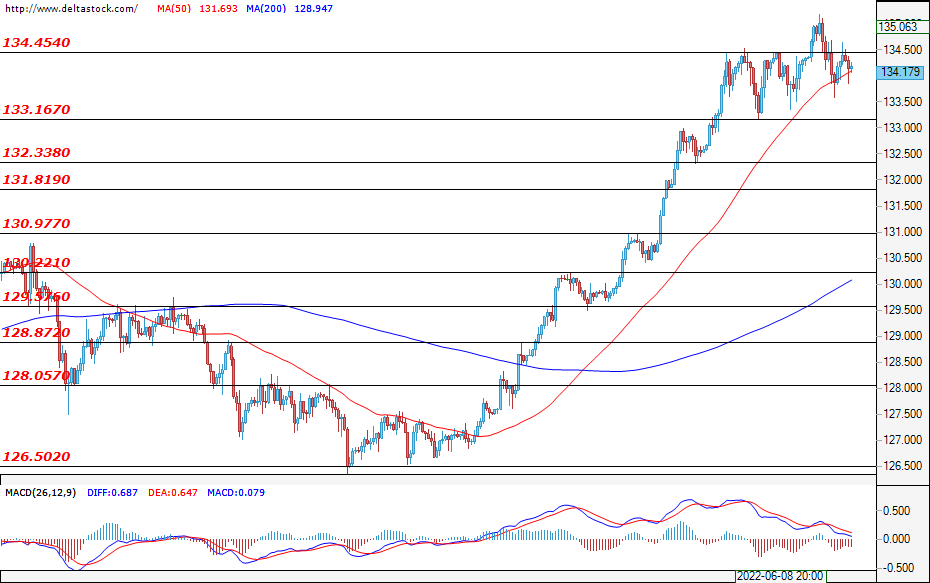
After the significant appreciation of the U.S. dollar against the Japanese yen, the currency pair formed a support level at 134.45, which managed to withstand the bulls’ pressure and the currency pair is currently consolidating in the range of 133.16 – 134.45. In case the bulls manage to regain control over the market and successfully violate the mentioned support, then this would strengthen the positive expectations for a continuation of the uptrend and the next target for the bulls would be the psychological level at 135.00. On the other hand, if the bulls’ attack is thwarted, then the first significant support level for the sellers would be at 133.16.
GBP/USD
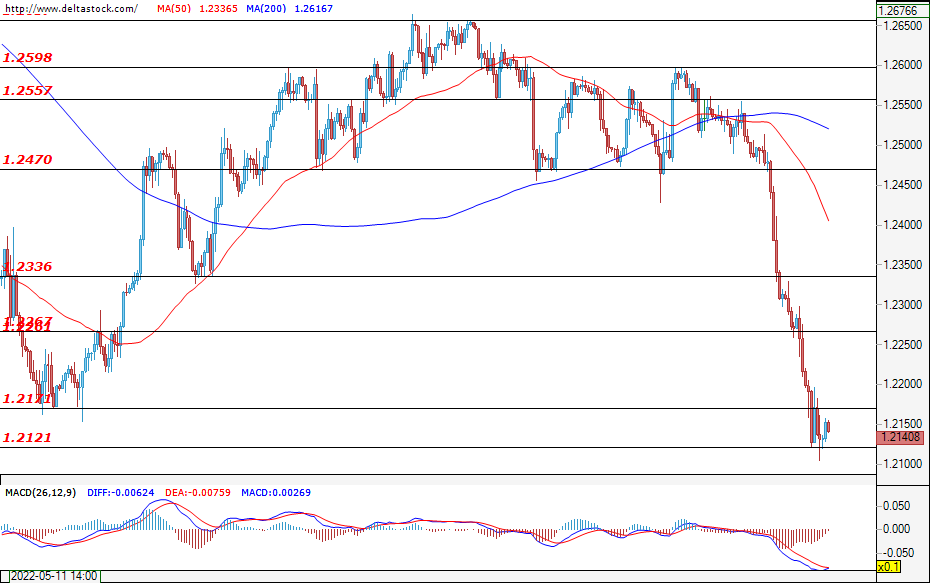
After the successful breach of the critical support at 1.2260, the bears’ momentum was strong enough to lead the pair towards a test of the support at 1.2120. At the time of writing this analysis, the pair is hovering just above this level, and the expectations for today’s trading session are for the pair to bounce back from this level and for us to witness a slight correction towards the local resistance at 1.2200. However, a successful breach of the critical support at 1.2120 may result in another decline towards the key one at 1.2040.
EUGERMANY40
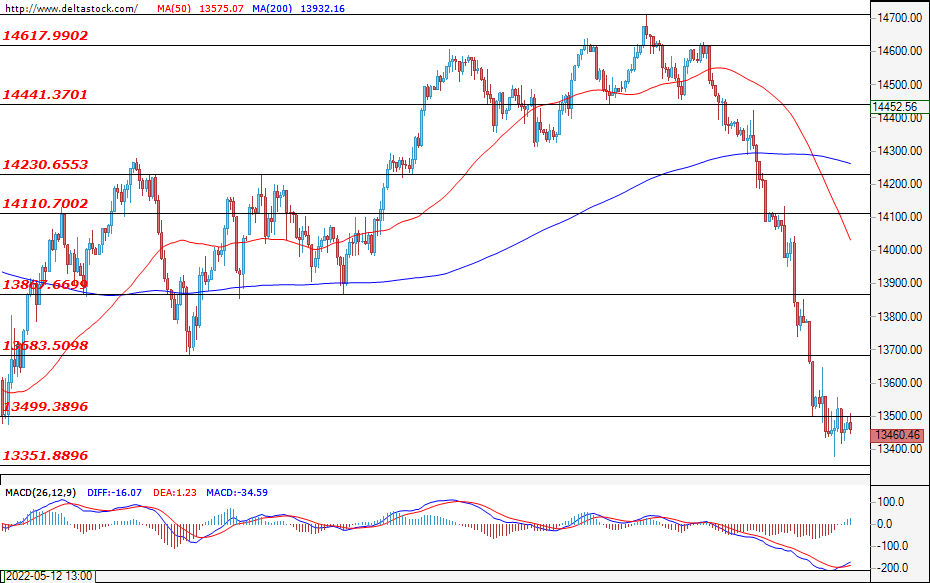
The bears continued to dominate the European markets, as over the past week they managed to deepen the sell-off and caused a decline of almost 700 points in the German index. During yesterday’s trading session, the bulls managed to limit the decline to around the support at 13350 and a corrective move towards 13683 is shaping up to be a highly likely scenario before the bearish pressure is to continue. Nevertheless, the expectations are for the sell-offs to deepen and for the index to head towards a test of the psychological level at 13000, but this scenario would become possible only after a successful breach of the support at 13350.
US30
During yesterday’s trading session, the decrease in the price of the index continued, but at the time of writing, the bulls have managed to limit the sell-offs to just above the support level at 30500. If the bears prevail and overcome this level, then we may expect a further decline towards the support at 30000. However, before a possible resumption of the downtrend is to take place, we could first witness a price correction towards the resistance zone at 31000. The market sentiment remains strongly negative and the most probable scenario at the moment is for the index to continue to lose its value as a result of the rising interest rates, Russia’s war on Ukraine, and China’s COVID-related lockdowns.
US Dollar and VIX Index Maintain Bullish Momentum
American stocks continued falling as investors refocused on the upcoming interest rate decision by the Federal Reserve. The Dow Jones crashed by more than 600 points on Monday after falling by 800 points on Friday. The tech-heavy Nasdaq 100 index declined below $11,000 while the small-cap heavy Russel 2000 declined by 4%. As stocks crashed, the CBOE volatility index jumped by over 20% while bond yields rose as the bond sell-off continued. Yield of the 10-year rose to 3.32% while the 2-year rose to 3.22%. Investors are concerned that the Fed will be more aggressive this week.
Cryptocurrencies tumbled as investors reacted to additional issues in the industry. The market cap of all cryptocurrencies crashed below $1 trillion for the first time in years. Bitcoin fell below $22,000 while Ethereum declined below $1,300. The decline was mostly because of the rising fear of monetary and fiscal crisis in the US and other developed countries. It also fell as investors reacted to the decision by Celsius to suspend withdrawals and swaps. Celsius is one of the biggest companies in the blockchain industry with billions in assets under management.
The British pound crashed sharply after weak economic numbers from the United Kingdom. On Monday, data by the ONS revealed that the economy was struggling. It experienced a contraction for the second straight month as consumer spending weakened. Manufacturing and industrial production declined sharply on a month-on-month basis. The next key catalyst will be the upcoming UK jobs numbers. With inflation rising, analysts expect the data to show that the unemployment rate continued dropping. The Bank of England will start its monetary meeting on Wednesday.
GBPUSD
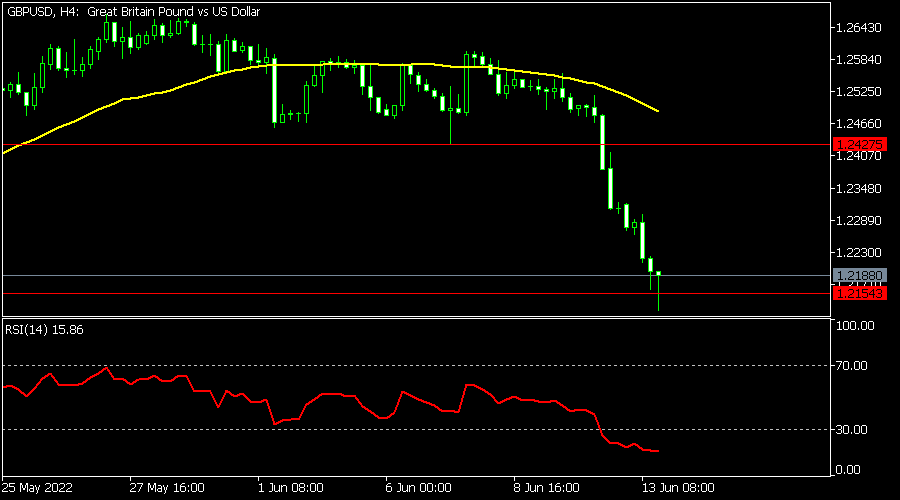
The GBPUSD pair crashed hard after weak UK GDP numbers. It is now trading at 1.2190, which is substantially below last month’s high of 1.2560. The shares moved below the 25-day and 50-day moving averages while the Relative Strength Index (RSI) dropped below the oversold level. Therefore, while the overall outlook is bearish, there is a likelihood that the pair will have a relief rally on Tuesday.
EURUSD
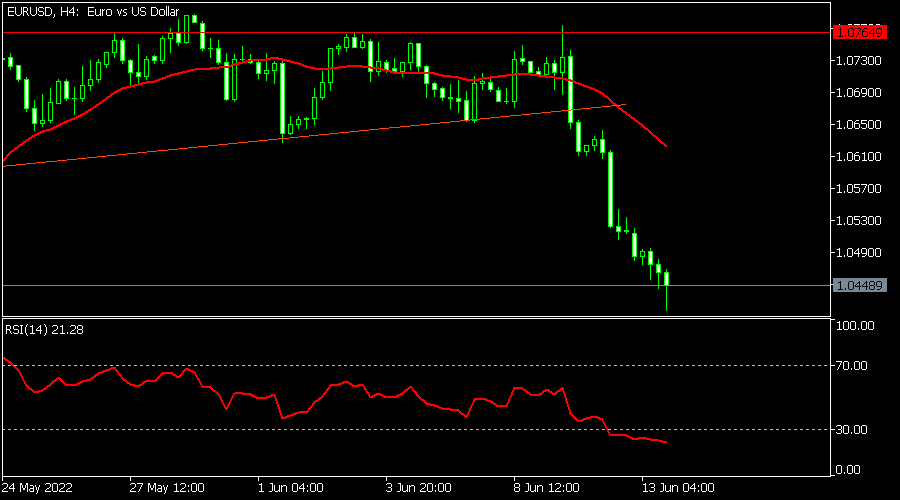
The EURUSD pair declined to a low of 1.0400, which was the lowest level since May 18. On the four-hour chart, the pair continued moving further below its 25-day and 50-day moving average. The RSI has moved below the oversold level. It also declined below the 23.6% Fibonacci retracement level. Therefore, the pair will likely continue falling as investors wait for the upcoming Fed interest rate decision.
USDJPY
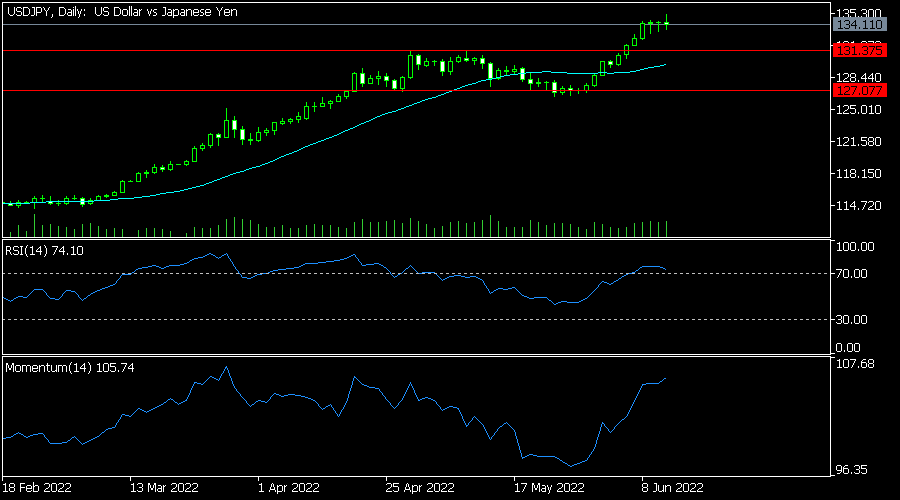
The USDJPY pair rose to a multi-decade high as the Japanese yen sell-off continued. It rose to a high of 135.21, which was higher than the important support level at 131.37. On the daily chart, the pair moved above the 25-day and 50-day moving averages. The Relative Strength Index and the momentum oscillator continued rising. The pair will likely keep rising as bulls target the key resistance at 136.
US 30 Breaks Critical Support
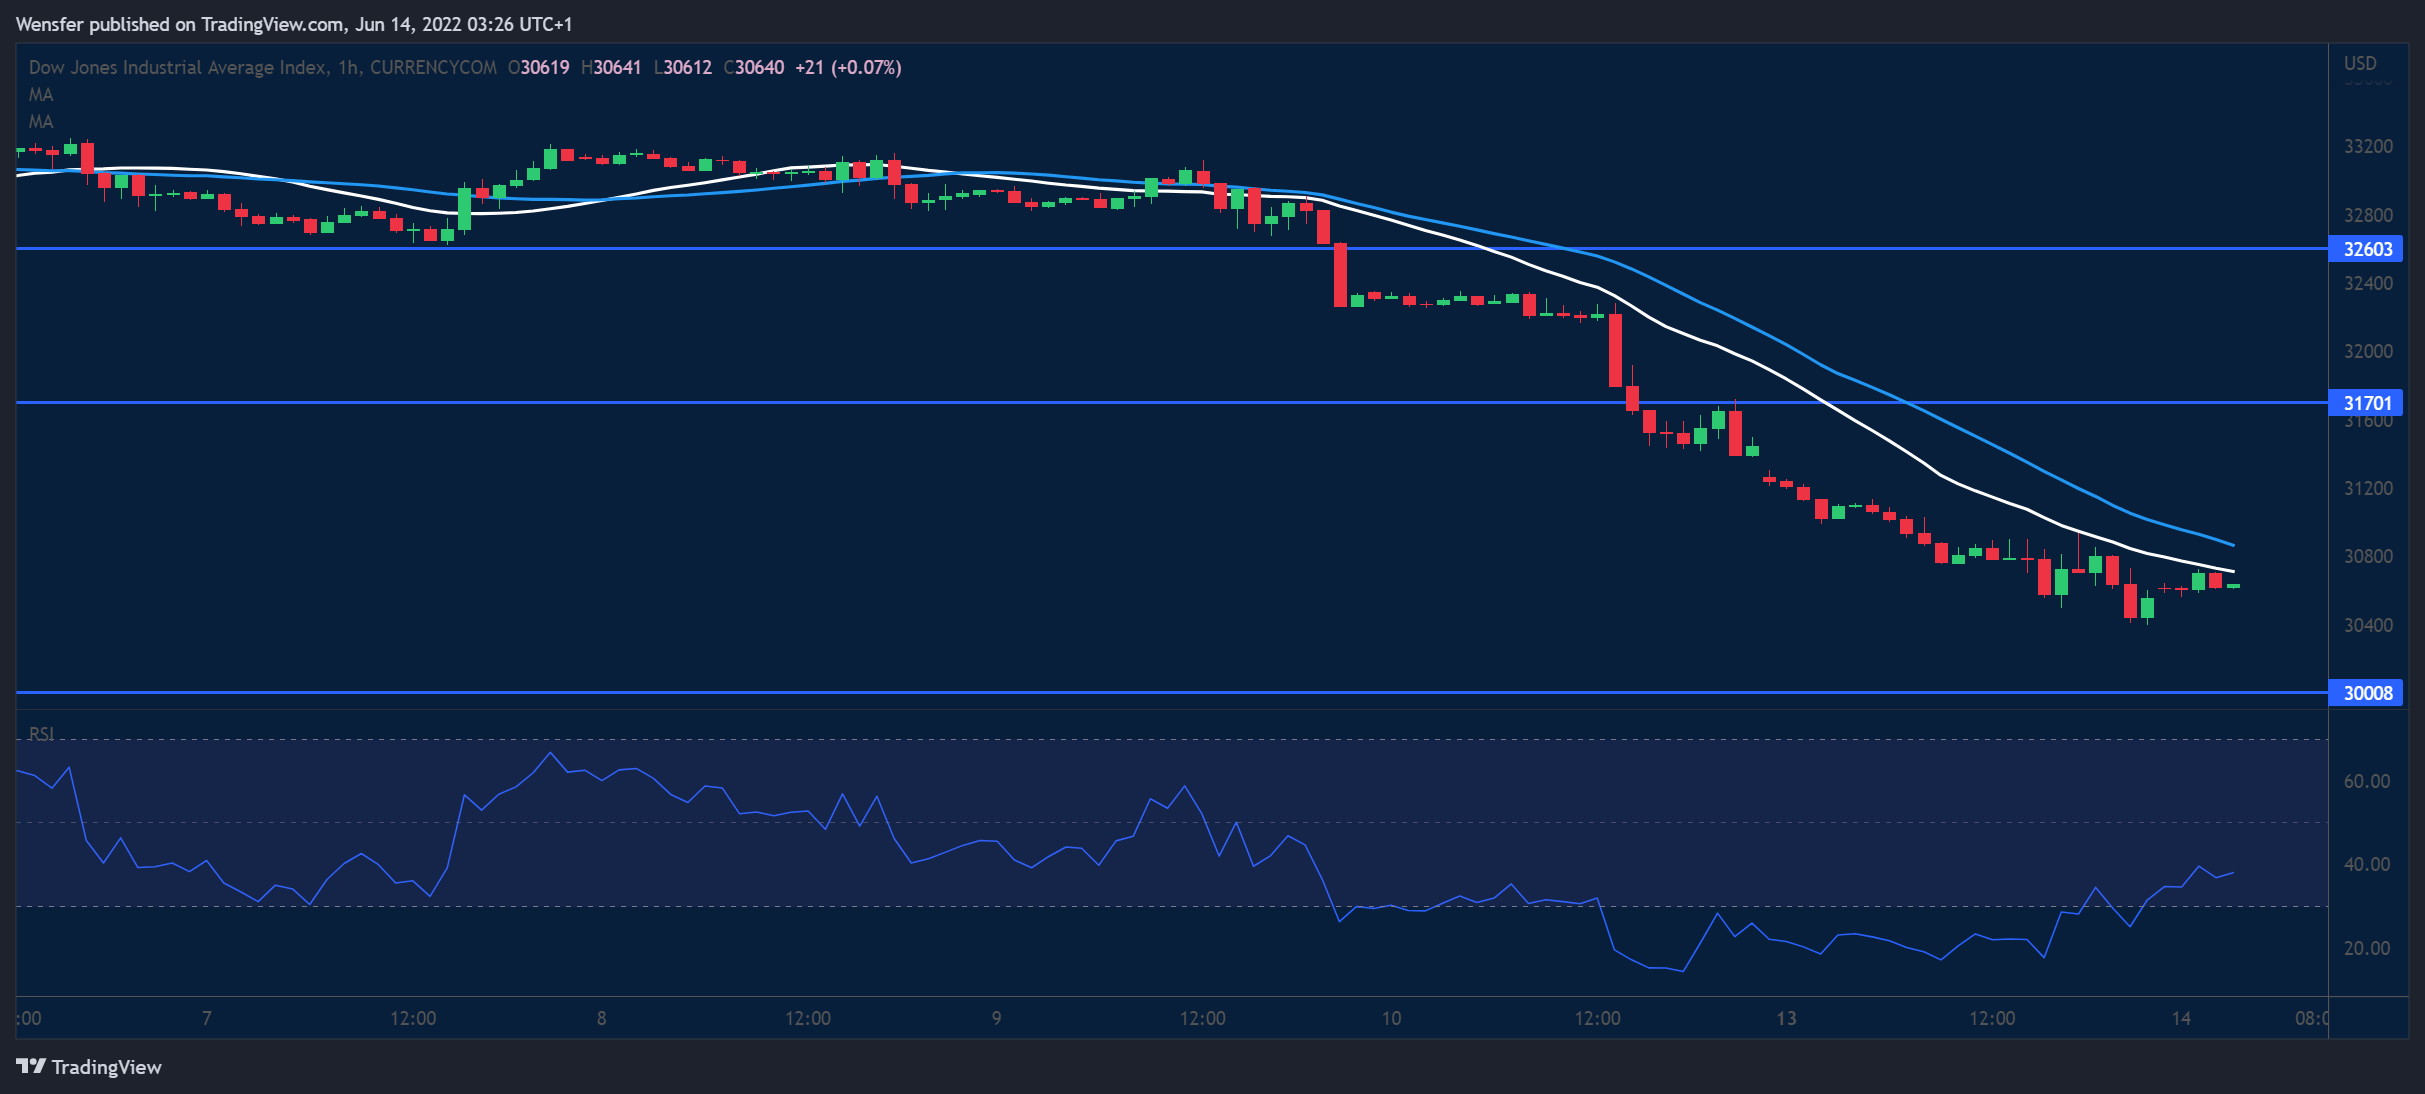
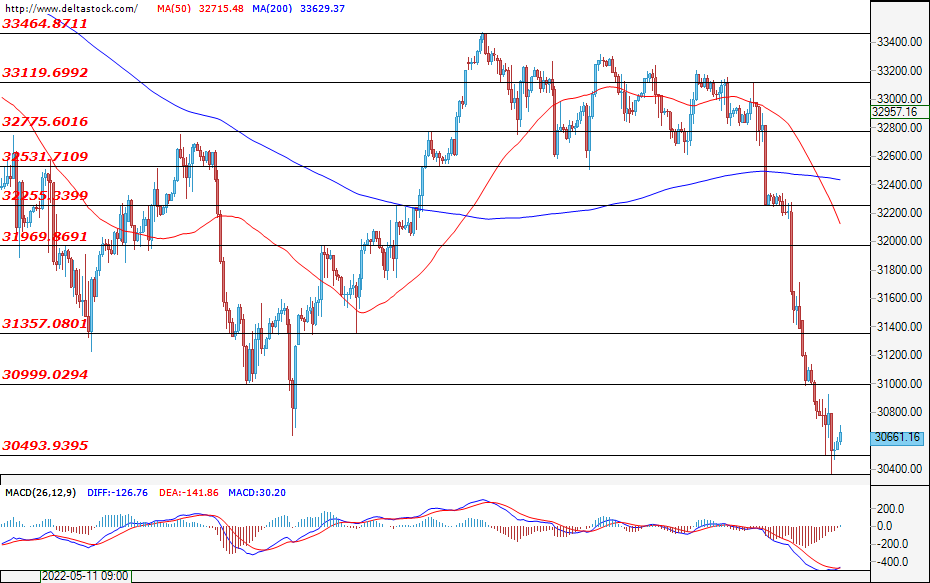
The Dow Jones plunges over a broad-based rise in risk aversion. The liquidation continued after the price action failed to hold above 32600. Sentiment remains overwhelmingly downbeat. A fall below the major support at 30700 may officially make the recent rally a dead cat bounce and send the index into bearish territory. The psychological level of 30000 would be the next support. An oversold RSI may trigger a temporary bounce but the bears could be expected to sell into strength near 31700.