Sample Category Title
US 100 Index Halts Decline But Retains Bearish Bias
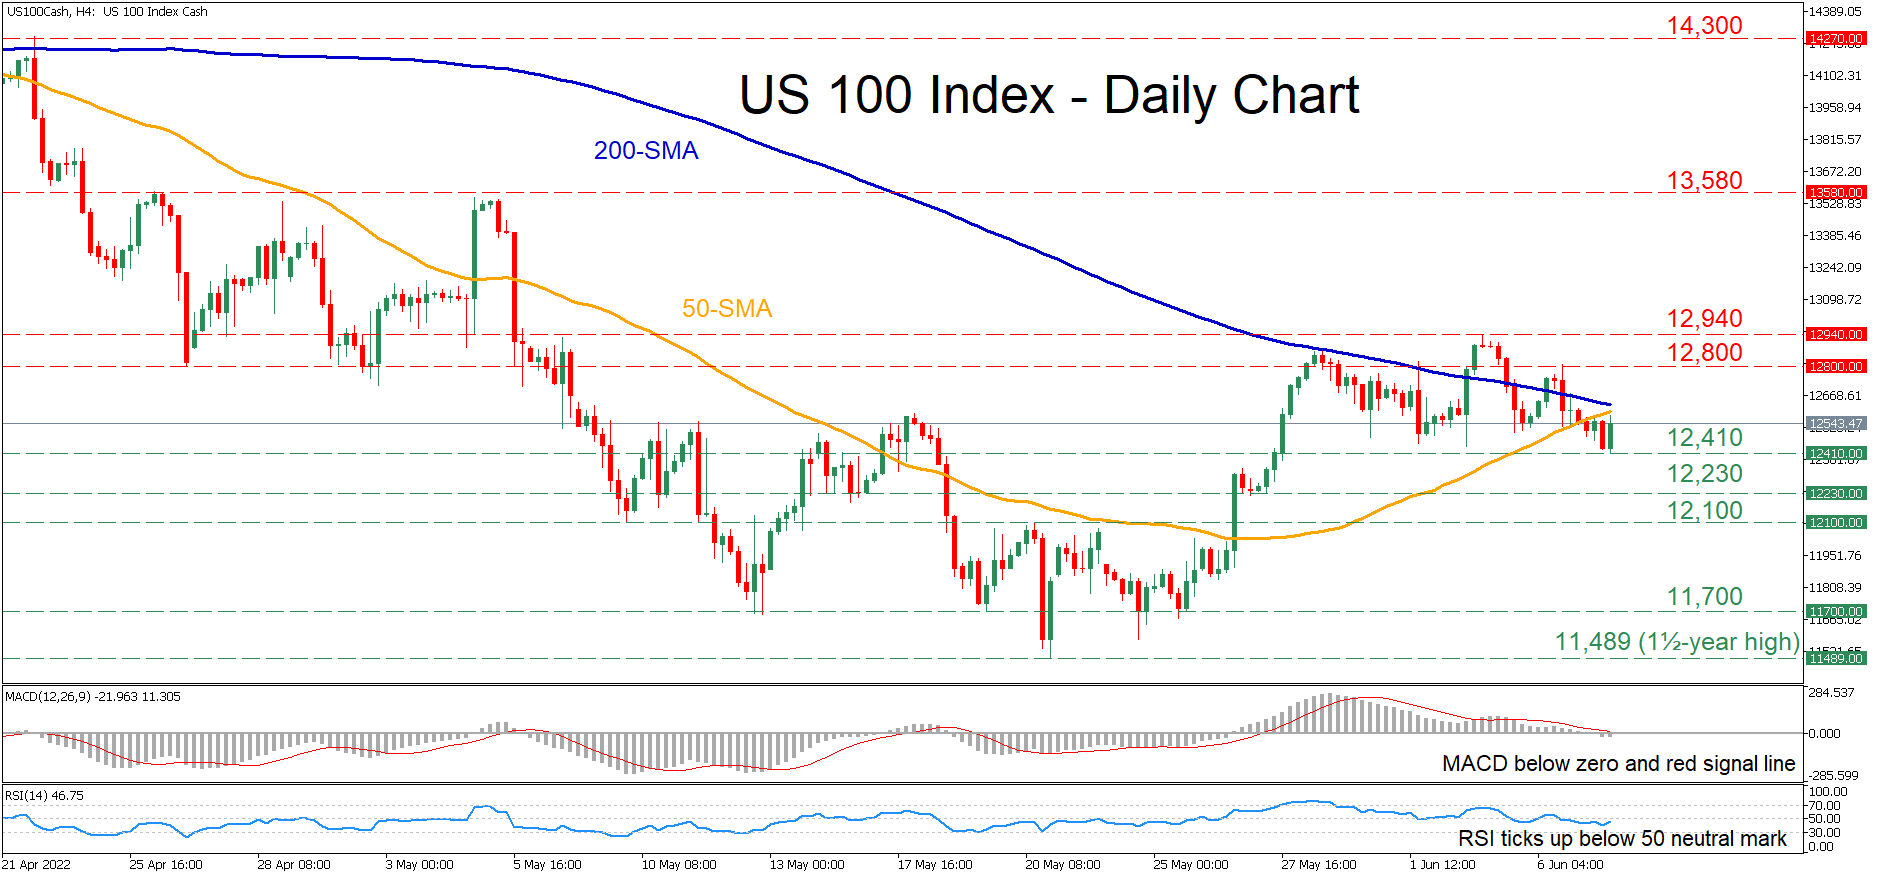
The US 100 stock index (cash) has been experiencing a minor pullback after its advance failed to cross above the 12,940 region. Nevertheless, the ascending 50-period simple moving average (SMA) is closing the gap with the 200-period SMA, where a potential upside violation could reinforce the case of a sustained recovery.
The momentum indicators suggest that bearish forces remain in control. The MACD histogram is currently beneath both zero and its red signal line, while the RSI is ticking up but remains below its 50-neutral threshold.
Should selling interest intensify further, the recent low of 12,410 could act as the first line of defence. Breaching this region, the bears might aim at 12,230 before the spotlight turns to the 12,100 level, which has acted both as support and resistance in recent months. Failing to halt there, the price could descend to challenge the 11,700 hurdle.
On the flipside, bullish actions could propel the index above both its 50- and 200-period SMAs, where the recent peak of 12,800 might act as initial resistance. Conquering this barricade, the spotlight could turn to the June high of 12,940 before 13,580 appears on the radar. Further advances may then cease at the 14,300 barrier.
In brief, the US 100 index has been experiencing a mild drop after the lower boundary of its recent sideways pattern was violated. For that bearish tone to reverse, the price needs to jump above the 12,940 ceiling.
Nasdaq100 is Likely Set to Fall to Long-Term Support
Late last week, the Nasdaq100 failed to break above the 61.8% mark of the decline from March to May amplitude. The sharp deterioration of last Friday, the failed attempt to get back up on Monday and the renewal of the local lows by the index futures at the beginning of the day on Tuesday is a possible prologue to a further downward spiral.
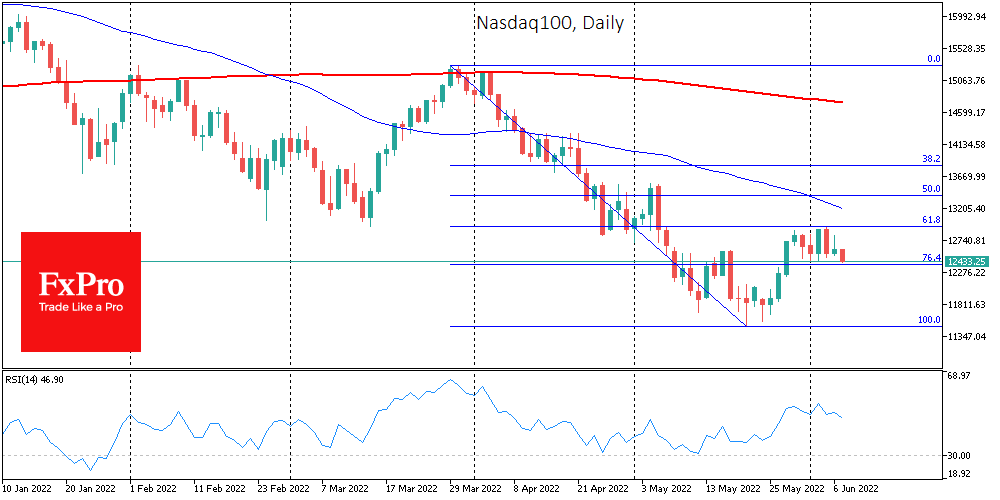
As with the first wave of declines from December to March, the fall was over 20% before we saw a corrective bounce. At the end of March, the stock’s recovery depleted on the approach to the 200-day moving average.
Last week the bears took over the initiative as the Nasdaq100 was approaching 13000, close to which was the significant support area of early 2021 and the 61.8% level of the global advance from the lows of March 2020 to levels of late 2021. Thus, the market has not reached a new level of recovery.
The market sentiment right now is more inclined to think that the rise in the last week of May was just a rebound in a falling market. If so, then the next logical target for the bears will be the 11500 area – the previous local lows.
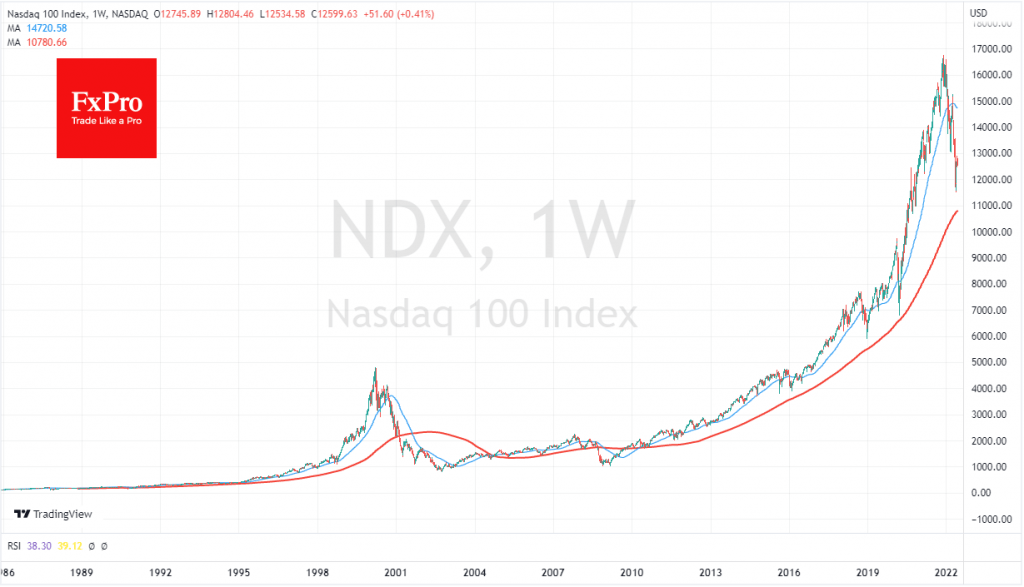
If that too falls under the pressure of worsening macroeconomic data, it is worth preparing for a pullback to 11000, a significant round level near the 200-week moving average. The latter line has been solid support in the declines of the Nasdaq100 since 2010 though now and from 1989 to 1995 when the dot-com rally ripped the index off its long-term trend.
While the Nasdaq100 at one time looked almost as detached from its long-term trend as it did at the turn of the century, it would still be too premature to adjust for a commensurate loss to 85% of the peak as it did 20 years ago.
Sunset Market Commentary
Markets
Yesterday, markets continued last week’s repositioning, preparing for central banks to take bigger steps to counter to runaway inflation. Last week’s US data in particular illustrated activity and the labour markets stay resilient. For now there is no reason to already anticipate any slowdown in the pace of Fed tightening beyond the baked in 50 bps hikes for the June and July meetings. US yields for maturities longer than 5-year all returned (temporary?) north of 3.0%. European yields set new multi-year peak levels across the curve as investors are looking forward to Thursday’s ECB meeting. This morning, the Reserve Bank of Australia confirmed the trend in vogue, raising rates by a bigger than expected 0.50 bps to an 0.85%. Still with no key eco and sentiment turning risk-off, the rally in yields finally takes a breather. US yields are easing between 1.25 bps (2-y) and 4bps (10/30-y). EMU yields mostly how a more modest setback (German yields about minus 2bps across the curve) ). Even in a risk-off context, investors apparently don’t want to be wrong-foot as the new ECB inflation projections to be published alongside Friday’s policy statement might reinforce the case for more bold action. Recently, US and European equities held up fairly well despite the new up-leg in yields. However, today, amongst others, a big US retailer warning on profit margins as it tries reduce inventories amid weakening demand weighed on sentiment. US indices after the open are ceding between 0.6% (Dow/S&P) and 0.8% (Nasdaq). The EuroStoxx 50 drops about 1.1%. At $ 119 pb, brent oil is trading slightly off last week’s peak levels well north of 120 p/b. However, for now, there is no sign of a genuine trend reversal yet.
On FX markets, the dollar continues last weeks, admittedly gradual, comeback. The trade-weighted index (102.8) tries to regain the 102.74 short-term neckline. USD/JPY this morning touched the 133 barrier. However, softer US yields during the day slow the USD/JPY ascent (currently 132.75). A brief attempt of EUR/USD to regain the 1.07 barrier failed. The pair currently again trades in the 1.0655 area, nearing next support at 1.0627. The jury is still out, but a break below this level would suggest a loss of short-term momentum, which would be a bit surprising going into Thursday’s ECB meeting. Sterling is showing a mixed picture. After UK PM Johnson surviving a confidence vote within its own Conservative part, sterling this morning temporary declined to the GBP/USD 1.2431 area and EUR/GBP 0.8585 area. However, markets apparently concluded that politics probably won’t change the expected path for BOE policy in the short term. EUR/GBP and cable currently returned to 0.853 and 1.25area respectively.
News Headlines
First Deputy Governor of the Riksbank Skingsley is leaving the Swedish central bank in August. Skingsley was widely seen as the frontrunner to replace Governor Ingves, who’s term ends at the end of this year. Her leaving opens the race to succeed Ingves at a time the central bank just made a huge U-turn on its very easy monetary policy and pressure is building to move faster with rate hikes than signaled back in April. The Swedish krone is trading a tad lower vs the euro today. EUR/SEK briefly ventured north of 10.50 before paring gains (SEK losses) to 10.48.
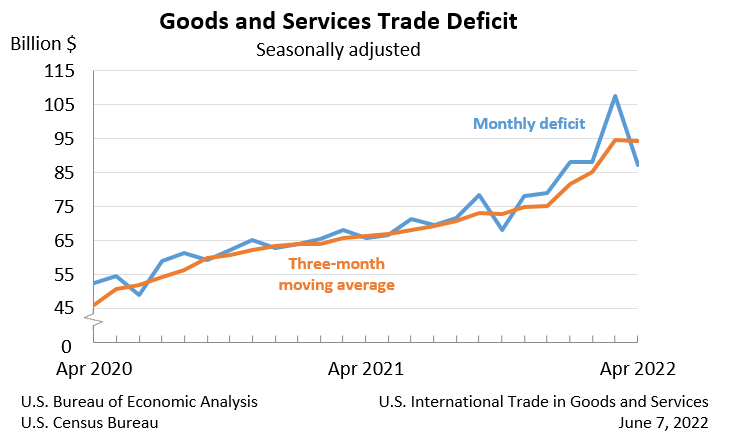
The US trade deficit narrowed sharply in April, from -$107.7bn to -$87.1bn vs. -$89.5bn expected. A less negative balance came both on the back of rising exports (+3.5% m/m) as well as falling imports (-3.4% m/m). A record deficit in the first quarter this year chopped 3.23 ppts of GDP back then. The first reading of the second quarter suggests trade this time could in fact contribute to growth for the first time in two years.
Hungary’s Government Debt Management Agency (AKK) raised the gross foreign currency bond issuance target by an equivalent of 2.5bn euro, bringing the total FX target for this year to 5.1bn euro. Of that amount, 4.5bn euro is remaining after February’s Samurai bond transaction. The AKK’s goal is to further extend average term-to-maturity and to diversify the investor base, it explained in a statement. The additional FX bond issuance won’t compromise the objective of having the FX debt ratio within the 10-25% benchmark range, AKK added, and the agency still plans to buy back some $2bn in FX debt that expires in 2023-2024. It has repurchased $50mln so far.
Bitcoin Fails to Escape Tight Range ahead of US CPI
Bitcoin ended last week on a positive note, snapping its record losing streak of nine weeks. However, the bulls failed to capitalize on that development and the price has dived again beneath the $30,000 psychological mark, extending its sideways pattern. Many investors suggest that major cryptocurrencies experienced a relief rally and might eventually resume their downtrend, while others point out that the market could be approaching its bottom. Therefore, the latest US CPI report awaited on Friday, could shed some light on this puzzle and provide crypto traders with fresh directional impetus.
Inflation remains a key driver
Since the beginning of 2022, major cryptocurrencies have been moving in tandem with equity markets, exhibiting a higher positive correlation with tech stocks. In general, risky assets have been negatively impacted by the ongoing monetary tightening as most central banks have entered an interest rate hike cycle in their effort to scale down inflationary pressures. Thus, the big question that lies ahead is how strong policymakers can slam the brakes on economies without causing a recession.
On Friday, the May US CPI print will hit the markets, with investors anticipating signs that the inflation rate has indeed peaked in the United States. Should that scenario play out, the Fed might be able to proceed with a slower rate hike pace, which could essentially reduce the likelihood of a recession and boost investors’ risk appetite. On the other hand, a stronger-than-expected reading would force the Fed to act more aggressively, inducing further downside pressures on risky assets. Therefore, crypto traders would be closely scrutinizing the upcoming inflation data to determine the direction of Bitcoin’s next breakout move from its long-lasting rangebound pattern.
Constrained supply could boost prices
Bitcoin prices significantly depend on the supply-demand balance as the process of mining is the sole way to generate new coins. Last week, the New York State Senate approved a controversial proof-of-work (PoW) mining ban bill that will prohibit any new Bitcoin mining operations in the state, significantly deteriorating Bitcoin’s supply outlook. Specifically, the proposed bill would not only forbid the opening of new mining facilities but also reject the renewal of existing mines’ licenses unless they could operate with 100% renewable energy sources.
In addition, a worrisome sign for the crypto space is that Bitcoin miners have been recently offloading their long-term holdings to cover rising costs in the anticipation of lower prices. Bitcoin mining was an attractive sport when miners could get away with high energy prices as Bitcoin was trading at $50,000 or $60,000. However, soaring energy costs alongside cryptos trading at more than 50% off their peaks may now force most miners to go out of business. Overall, the short-term downside pressures induced by the recent accelerating sell-off in the miners’ effort to withstand the elevating energy prices could be eventually offset by weakening supply.
Technical picture remains intact
Bitcoin has been trading sideways since the beginning of May, unable to adopt a clear direction. Although the king of cryptocurrencies managed to jump above the $32,000 mark during the past week, its upside move failed to strengthen further and the price quickly returned into the tight $31,000-$29,000 range.
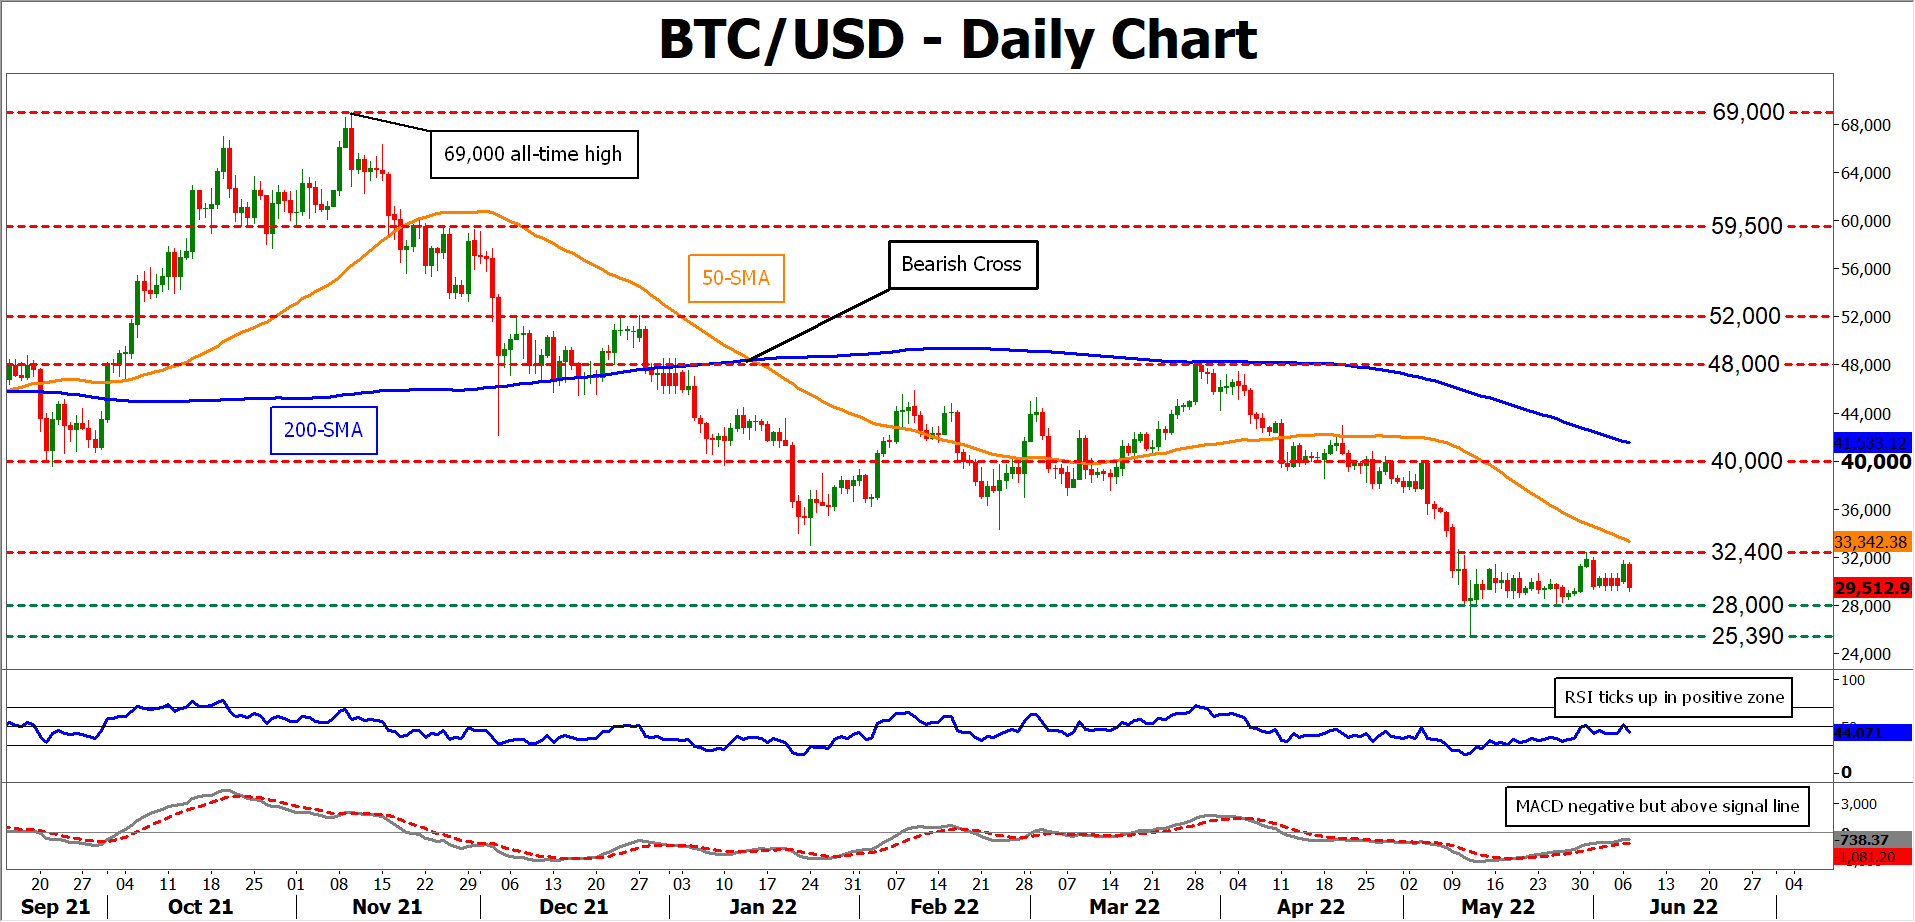
In the positive scenario, bullish actions could send the price to test the recent peak of $32,400 before the attention shifts to the $40,000 psychological mark.
On the flipside, should selling interest intensify, Bitcoin’s price may descend towards $28,000, which is the lower boundary of its recent sideways pattern. A violation of the latter could pave the way for the 2022 low of $25,390.
EUR/USD Mid-Day Outlook
Daily Pivots: (S1) 1.0669; (P) 1.0711 (R1) 1.0737; More...
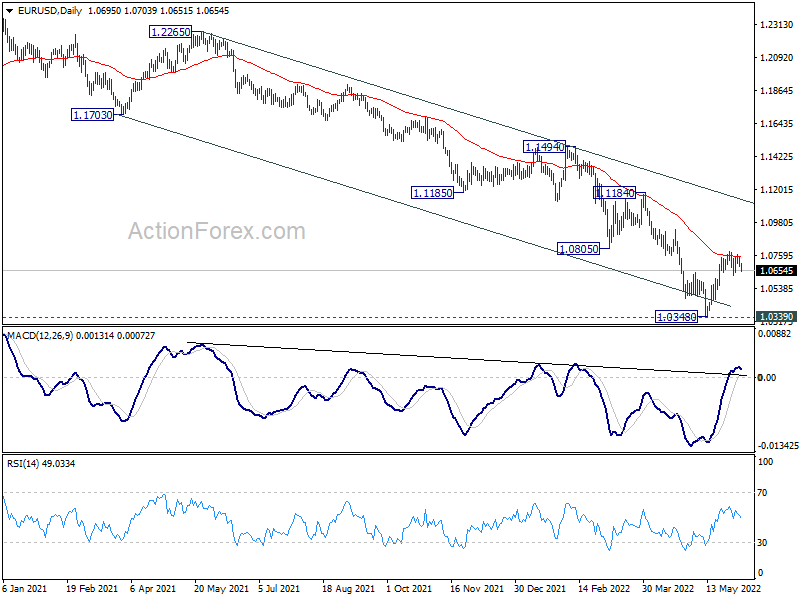
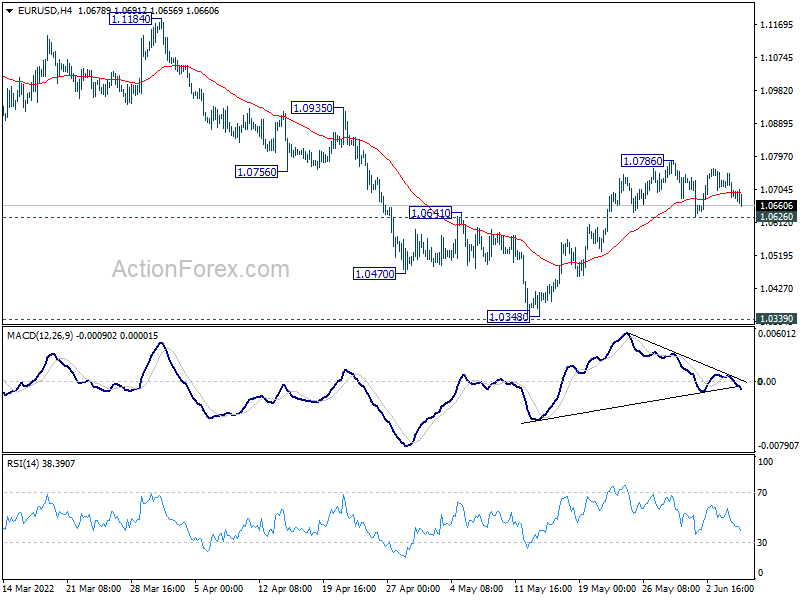
Intraday bias in EUR/USD stays neutral at this point. On the downside, break of 1.0626 minor support will indicate rejection by 55 day EMA, and turn bias back to the downside for retesting 1.0348. On the upside, break of 1.0786, and sustained trading above 55 day EMA (now at 1.0757) will target 1.0935 resistance next.
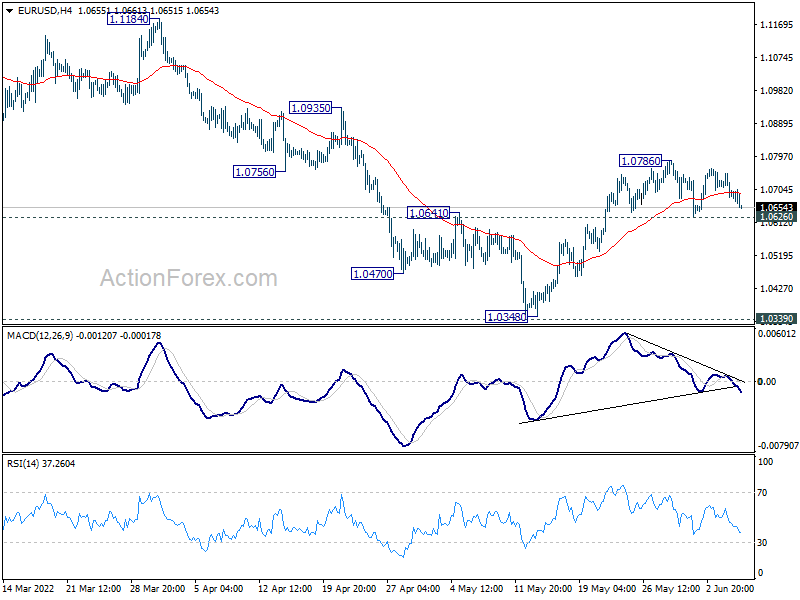
In the bigger picture, focus stays on 1.0339 long term support (2017 low). Decisive break there will resume whole down trend from 1.6039 (2008 high). Next target is 61.8% projection of 1.3993 to 1.0339 from 1.2348 at 1.0090. However, firm break of 1.0805 support turned resistance will delay this bearish case and bring medium term corrective rebound first.
GBP/USD Mid-Day Outlook
Daily Pivots: (S1) 1.2479; (P) 1.2528; (R1) 1.2580; More...
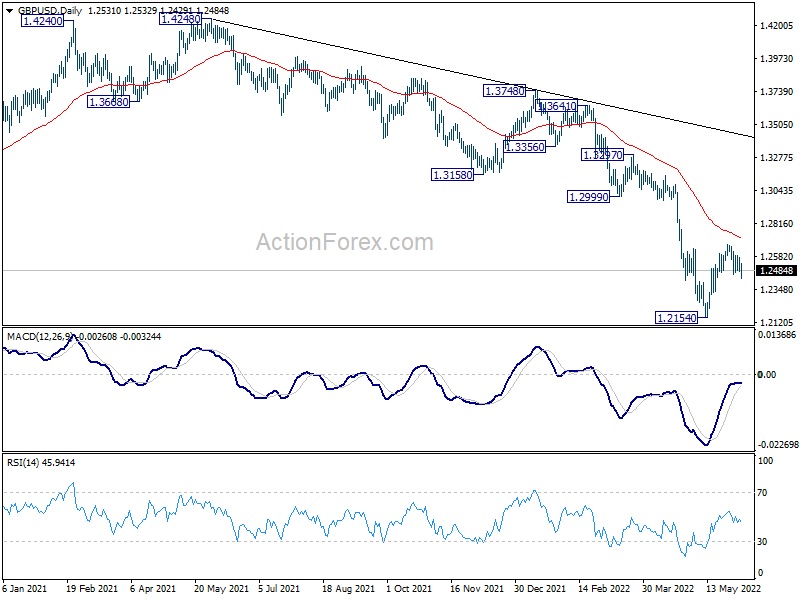
Intraday bias in GBP/USD remains neutral with focus on 1.2457 minor support. Sustained break there will suggest that rebound from 1.2154 has completed. Intraday bias will be back on the downside for resting this low. On the upside, above 1.2666 will target 55 day EMA (now at 1.2707) and above.
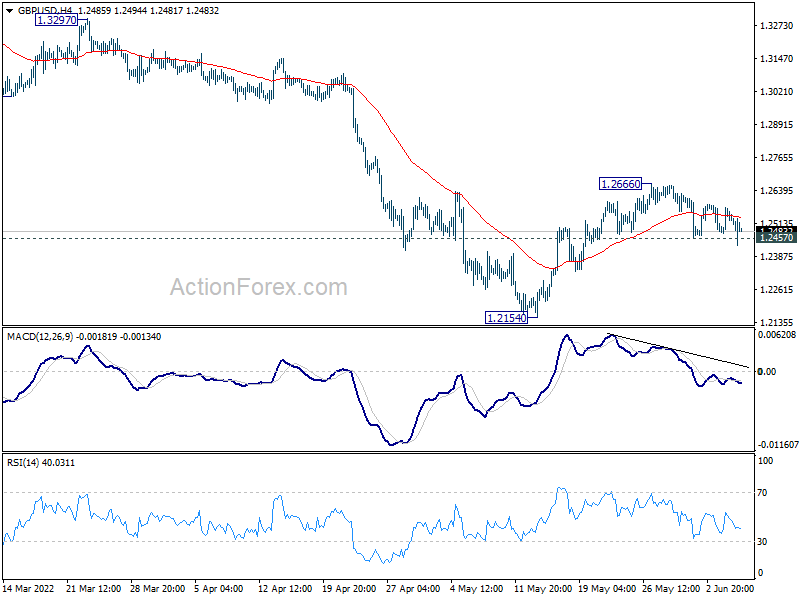
In the bigger picture, fall from 1.4248 (2018 high) could be a leg inside the pattern from 1.1409 (2020 low), or resuming the longer term down trend. Deeper decline is expected as long as 1.2999 support turned resistance holds. On resumption, next target is 1.1409 low.
USD/JPY Mid-Day Outlook
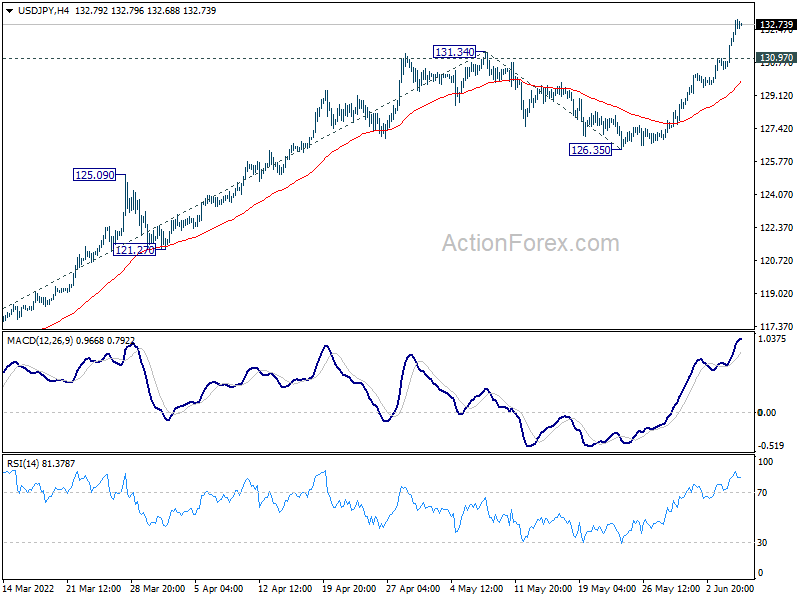
Daily Pivots: (S1) 130.88; (P) 131.44; (R1) 132.46; More...
Intraday bias in USD/JPY remains on the upside for the moment. Current up trend should target 61.8% projection of 114.40 to 131.34 from 126.35 at 136.81 next. On the downside, below 130.97 minor support will turn intraday bias neutral to bring consolidations first, before staging another rally.
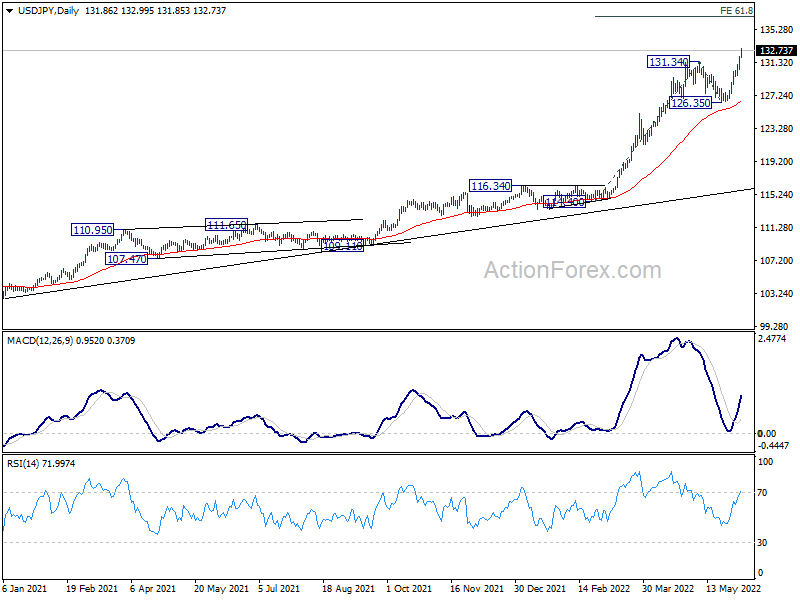
In the bigger picture, current rally is seen as part of the long term up trend form 75.56 (2011 low). Next target is 100% projection of 75.56 (2011 low) to 125.85 (2015 high) from 98.97 at 149.26, which is close to 147.68 (1998 high). This will remain the favored case as long as 126.35 support holds.
USD/CHF Mid-Day Outlook
Daily Pivots: (S1) 0.9637; (P) 0.9675; (R1) 0.9745; More...
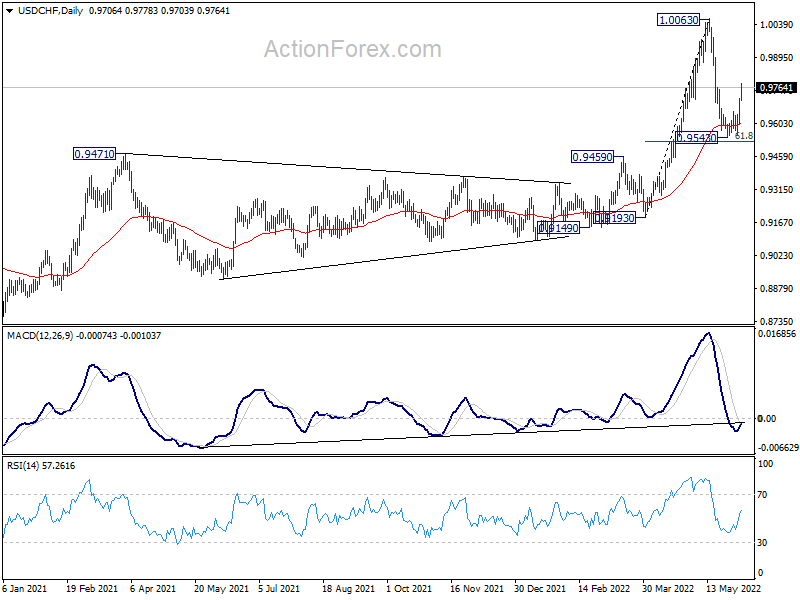
US/CHF's breach of 0.9763 minor resistance suggests that pull back from 1.0063 has completed at 0.9854 already, ahead of 61.8% retracement of 0.9193 to 1.0063 at 0.9525. Intraday bias is back on the upside for retesting 1.0063 resistance first. Firm break there will resume larger up trend. In case of another fall, strong support is still expected from 0.9525 to bring rebound.
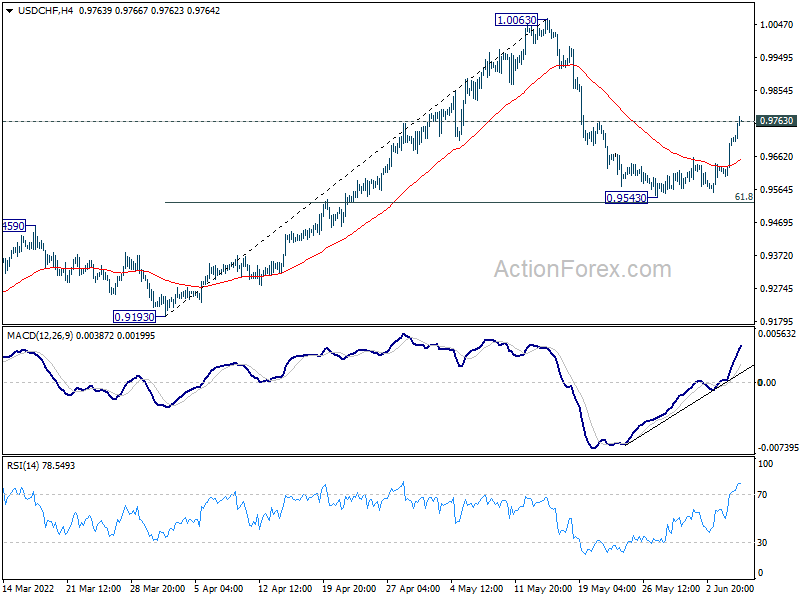
In the bigger picture, down trend from 1.0342 (2016 high) should have completed with three waves down to 0.8756 (2021 low) already. Rise from 0.8756 is likely a medium term up trend of its own. Next target is 1.0237/0342 resistance zone. This will remain the favored case as long as 0.9471 resistance turned support holds. However, sustained break of 0.9471 will extend long term range trading with another falling leg.
Yen and Franc Weakness Continues, Aussie Rally Faded Quickly
Selloff in Yen and Swiss Franc is still the main theme today even though US and Germany benchmark yields are retreating slightly. Australia was only lifted very briefly by the larger than expected rate hike by RBA. Though, Aussie is maintaining gains against Kiwi, which is the worst performing one for the day. On the other hand, Dollar, Canadian, and Sterling are the stronger ones while Euro is mixed.
Technically, USD/CHF's break of 0.9763 minor support argues that pull back from 1.0063 has completed. Stronger rebound would be seen back to retest this high. The question is whether the Franc's weakness is its own, or it's leading other European majors. Hence, eyes will be on 1.0626 minor support in EUR/USD and 1.2457 minor support in GBP/USD.
In Europe, at the time of writing, FTSE is down -0.24%. DAX is down -1.12%. CAC is down -1.07%. Germany 10-year yield is down -0.0081 at 1.315. Earlier in Asia, Nikkei rose 0.10%. Hong Kong HSI dropped -0.56%. China Shanghai SSE rose 0.17%. Singapore Strait Times rose 0.15%. Japan 10-year JGB yield rose 0.0043 to 0.250.
US exports of goods and services rose 3.5% mom in Apr, imports dropped -3.4% mom
US exports of goods and services rose 3.5% mom to USD 252.6B in April. Imports dropped -3.4% mom to USD 339.7B. Trade deficit narrowed from USD 107.7B to USD 87.1B, versus expectation of USD 89.3B.
In Q1, goods and services trade deficit with China increased USD 22.9B to USD 112.7B. The deficit with Canada increased USD 9.6B to USD 19.1B. The surplus with the United Kingdom increased USD 2.5B to USD 5.8B.
Eurozone Sentix investor confidence rose to -15.8, real economy is not suffering as quickly and as severely than expected
Eurozone Sentix Investor Confidence rose from -22.6 to -15.8 in June, above expectation of -20.0. Current Situation Index rose from -10.5 to -7.3. Expectations Index rose from -34.0 to -24.0.
Sentix said, "the real economy is not suffering as quickly and as severely from phenomena such as rising inflation and supply chain problems as one might have suspected.
"While consumers are already suffering much more from rising prices, many companies are still benefiting from inflation-related pull-forward effects. So far, many companies have also been able to pass on their sharply rising costs to their customers.
"But this is likely to be a finite phase. At a certain point, end consumers will have to cut back. Then, at the latest, the ability of companies to pass on their costs without restriction will also come to an end. In addition, there is a foresee-able change in monetary policy, which could also become more restrictive in the Eurozone from July.
"On the other hand, it should be positive that according to the sentix topic barometer the inflation peak should have been passed for the time being."
From Germany, factory orders dropped -2.7% mom in April, worse than expectation of -0.5% mom. Swiss foreign currency reserves were unchanged at CHF 925B in May.
UK PMI services finalized at 53.4, worrying combination of slower growth and higher prices
UK PMI Services was finalized at 53.4 in May, down from April's 58.9. That's the weakest level since February 2021. PMI Composite was finalized at 53.1, down from April's 58.2. S&P Global added that business activity expansions eased for the second month running. Input cost and prices charged inflation hit fresh record highs. Growth projections were lowest since October 2020.
Tim Moore, Economics Director at S&P Global Market Intelligence: "May data illustrate a worrying combination of slower growth and higher prices across the UK service sector. The latest round of input cost inflation was the steepest since this index began in July 1996, while the monthly loss of momentum for business activity expansion was a survey-record outside of lockdown periods."
RBA hikes by 50bps to 0.85%, more normalization over the months ahead
RBA raises cash rate target by 50bps to 0.85% today, larger than expectation of 40bps. Interest rate on exchange settlement balances is also lifted by 50bps to 75bps. The central bank also maintains tightening bias, as "the Board expects to take further steps in the process of normalizing monetary conditions in Australia over the months ahead."
In the accompanying statement, RBA said inflation in Australia has "increased significantly", and is "expected to increase further", before declining back towards the 2-3% target range next year. The economy is "resilient" while labour market is "strong".
One source of uncertainty is "how household spending evolves", given the "increasing pressure" from higher inflation, and interest rates. The central scenario is for strong household consumption growth this year, but RBA will pay close attention to various influences on consumption.
Australia AiG services dropped to 49.2, back in mild contraction
Australia AiG Performance and Services Index dropped sharply from 57.8 to 49.2 in May, indicating mild contraction. Sales dropped -13.0 pts to 50.7. Employment dropped -10.4 to 47.4. New orders dropped -3.3 to 49.7. Input prices dropped -9.1 o 68.7. Selling prices dropped -3.6 to 61.9. Average wages dropped -9.8 to 57.4.
Innes Willox, Chief Executive of Ai Group, said: "The Australian services sector contracted mildly in May after a period of healthy expansion in the earlier months of 2022. Performance was mixed across the sector with strong growth in logistics, retail trade and personal, recreational & other services offset by sharp declines in business & property services and health & education services."
USD/CHF Mid-Day Outlook
Daily Pivots: (S1) 0.9637; (P) 0.9675; (R1) 0.9745; More...
US/CHF's breach of 0.9763 minor resistance suggests that pull back from 1.0063 has completed at 0.9854 already, ahead of 61.8% retracement of 0.9193 to 1.0063 at 0.9525. Intraday bias is back on the upside for retesting 1.0063 resistance first. Firm break there will resume larger up trend. In case of another fall, strong support is still expected from 0.9525 to bring rebound.
In the bigger picture, down trend from 1.0342 (2016 high) should have completed with three waves down to 0.8756 (2021 low) already. Rise from 0.8756 is likely a medium term up trend of its own. Next target is 1.0237/0342 resistance zone. This will remain the favored case as long as 0.9471 resistance turned support holds. However, sustained break of 0.9471 will extend long term range trading with another falling leg.
Economic Indicators Update
| GMT | Ccy | Events | Actual | Forecast | Previous | Revised |
|---|---|---|---|---|---|---|
| 22:30 | AUD | AiG Performance of Services Index May | 49.2 | 57.8 | ||
| 23:01 | GBP | BRC Like-For-Like Retail Sales Y/Y May | -1.50% | -1.70% | ||
| 23:30 | JPY | Labor Cash Earnings Y/Y Apr | 1.70% | 1.50% | 1.20% | |
| 23:30 | JPY | Overall Household Spending Y/Y Apr | -1.70% | -1.00% | -2.30% | |
| 04:30 | AUD | RBA Interest Rate Decision | 0.85% | 0.75% | 0.35% | |
| 05:00 | JPY | Leading Economic Index Apr P | 102.9 | 102.3 | 100.8 | |
| 06:00 | EUR | Germany Factory Orders M/M Apr | -2.70% | -0.50% | -4.70% | -4.20% |
| 07:00 | CHF | Foreign Currency Reserves (CHF) May | 925B | 926B | 925B | |
| 08:30 | EUR | Eurozone Sentix Investor Confidence Jun | -15.8 | -20 | -22.6 | |
| 08:30 | GBP | Services PMI May F | 53.4 | 51.8 | 51.8 | |
| 12:30 | USD | Trade Balance (USD) Apr | -87.1B | -89.3B | -109.8B | -107.7B |
| 12:30 | CAD | Trade Balance (CAD) Apr | 1.5B | 1.9B | 2.5B | 2.3B |
| 14:00 | CAD | Ivey PMI May | 64.3 | 66.3 |
US exports of goods and services rose 3.5% mom in Apr, imports dropped -3.4% mom
US exports of goods and services rose 3.5% mom to USD 252.6B in April. Imports dropped -3.4% mom to USD 339.7B. Trade deficit narrowed from USD 107.7B to USD 87.1B, versus expectation of USD 89.3B.
In Q1, goods and services trade deficit with China increased USD 22.9B to USD 112.7B. The deficit with Canada increased USD 9.6B to USD 19.1B. The surplus with the United Kingdom increased USD 2.5B to USD 5.8B.