Sample Category Title
Australian Dollar Falls Below 70
Aussie tumbles on risk aversion
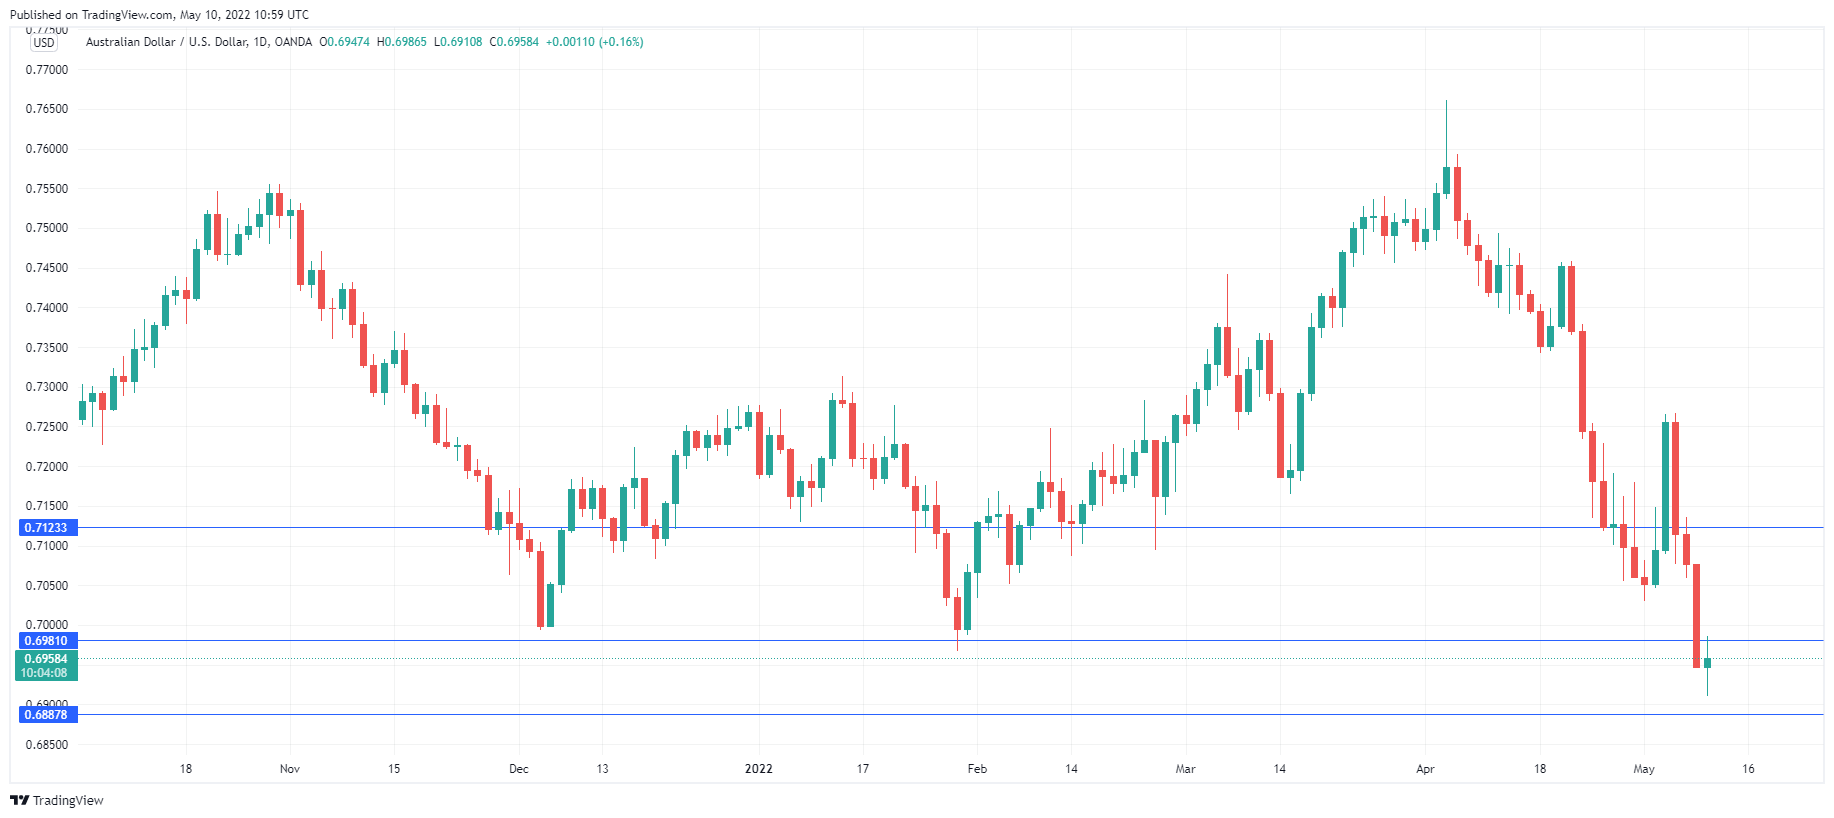
The Australian dollar is stable on Tuesday, after starting the week with a nasty drop of 1.83%. AUD/USD has dropped to its lowest levels since July 2020, as it trades around 0.6970.
Risk aversion remains high, as investors see dark clouds all around. Soaring inflation, supply chain disruptions, a hawkish Fed, the Ukraine war and a slowdown in China have boosted the US dollar and sent risk currencies like the Australian dollar sharply lower.
China, the world’s number two economy, is stubbornly sticking to its zero-Covid policy, putting hundreds of millions of residents under lockdown and disrupting factory production and global supply chains. Perhaps no country is feeling the deterioration in China more than Australia, as the Asian giant is Australia’s largest trading partner. Last month, the IMF recently cut China’s growth forecast to 4.4%, down from 4.8%. The property sector hasn’t been in the headlines lately, but the severe leverage problems which have affected huge developers haven’t gone away and remain a real threat to economic stability. The troubles in China are a serious headwind for the struggling Australian dollar.
On the economic front, NAB Business Confidence slowed to 10 in April, down from 16 in March. Retail Sales for Q1 came in 1.2% QoQ, better than the forecast of 1.0%. The markets will be keeping a close eye on US inflation, which will be released later today. CPI surged to 8.5% YoY in March, the forecast for April stands at 8.1%. If inflation does ease, we’re bound to see plenty of headlines proclaiming that “inflation has peaked” and the US dollar could lose ground. It would be premature to argue that inflation is on its way down based on just one CPI reading. Furthermore, long-term inflation expectations have increased (3.7% to 3.9%), according to a NY Fed survey on Monday. True, one-year inflation expectations decreased (6.6 to 6.3%), but that won’t change the Fed’s aggressive tune.
AUD/USD Technical
- There is support at 0.6887 and 0.6745
- 0.6981 is a weak resistance line, followed by 0.7123
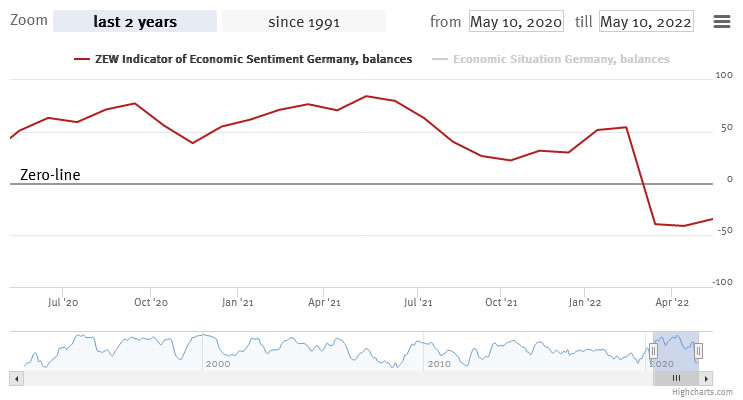
Germany ZEW rose to -34.3 in May, deterioration still assumed, just slower
Germany ZEW Economic Sentiment improved from -41 to -34.3 in May, above expectation of -42.5. Germany Current Situation index, however, dropped from -30.8 to -36.5, slightly below expectation of -35.0. Eurozone Economic Sentiment rose from -43.0 to -29.5, above expectation of -41.0. Eurozone Current Situation index dropped -6.5 pts to -35.0.
ZEW President Professor Achim Wambach: "The ZEW Indicator of Economic Sentiment increased moderately this month but still remains at a relatively low level. Compared to last month, the outlook for the economic situation in Germany is thus slightly less pessimistic. The experts still assume that it will continue to deteriorate, but at a lower pace than expected before.
"The strong restrictions in China to fight against new Covid-19 infections lead to a strong reduction in the assessment of the current economic situation in China. This is a heavy weight on the future development of the German economy.
"With regard to the ECB's monetary policy stance there is a large majority of experts expecting an increase in interest rates during the next six months. Accordingly they expect a decline of inflation rates from their very high current level.
BoJ Kuroda: Retail level CBDC is an option
BoJ Governor Haruhiko Kuroda said in an online seminar that the central bank has not decided on central bank digital currency (CBDC) yet. But he noted it could be an option for securing a seamless and safe infrastructure.
"CBDC is not the only way, so a national discussion is needed as to how to achieve this goal," Kuroda said, adding, "retail level CBDC is an option."
BoJ started the second phase of the CBDC experiments in April. The process will last for around a year.
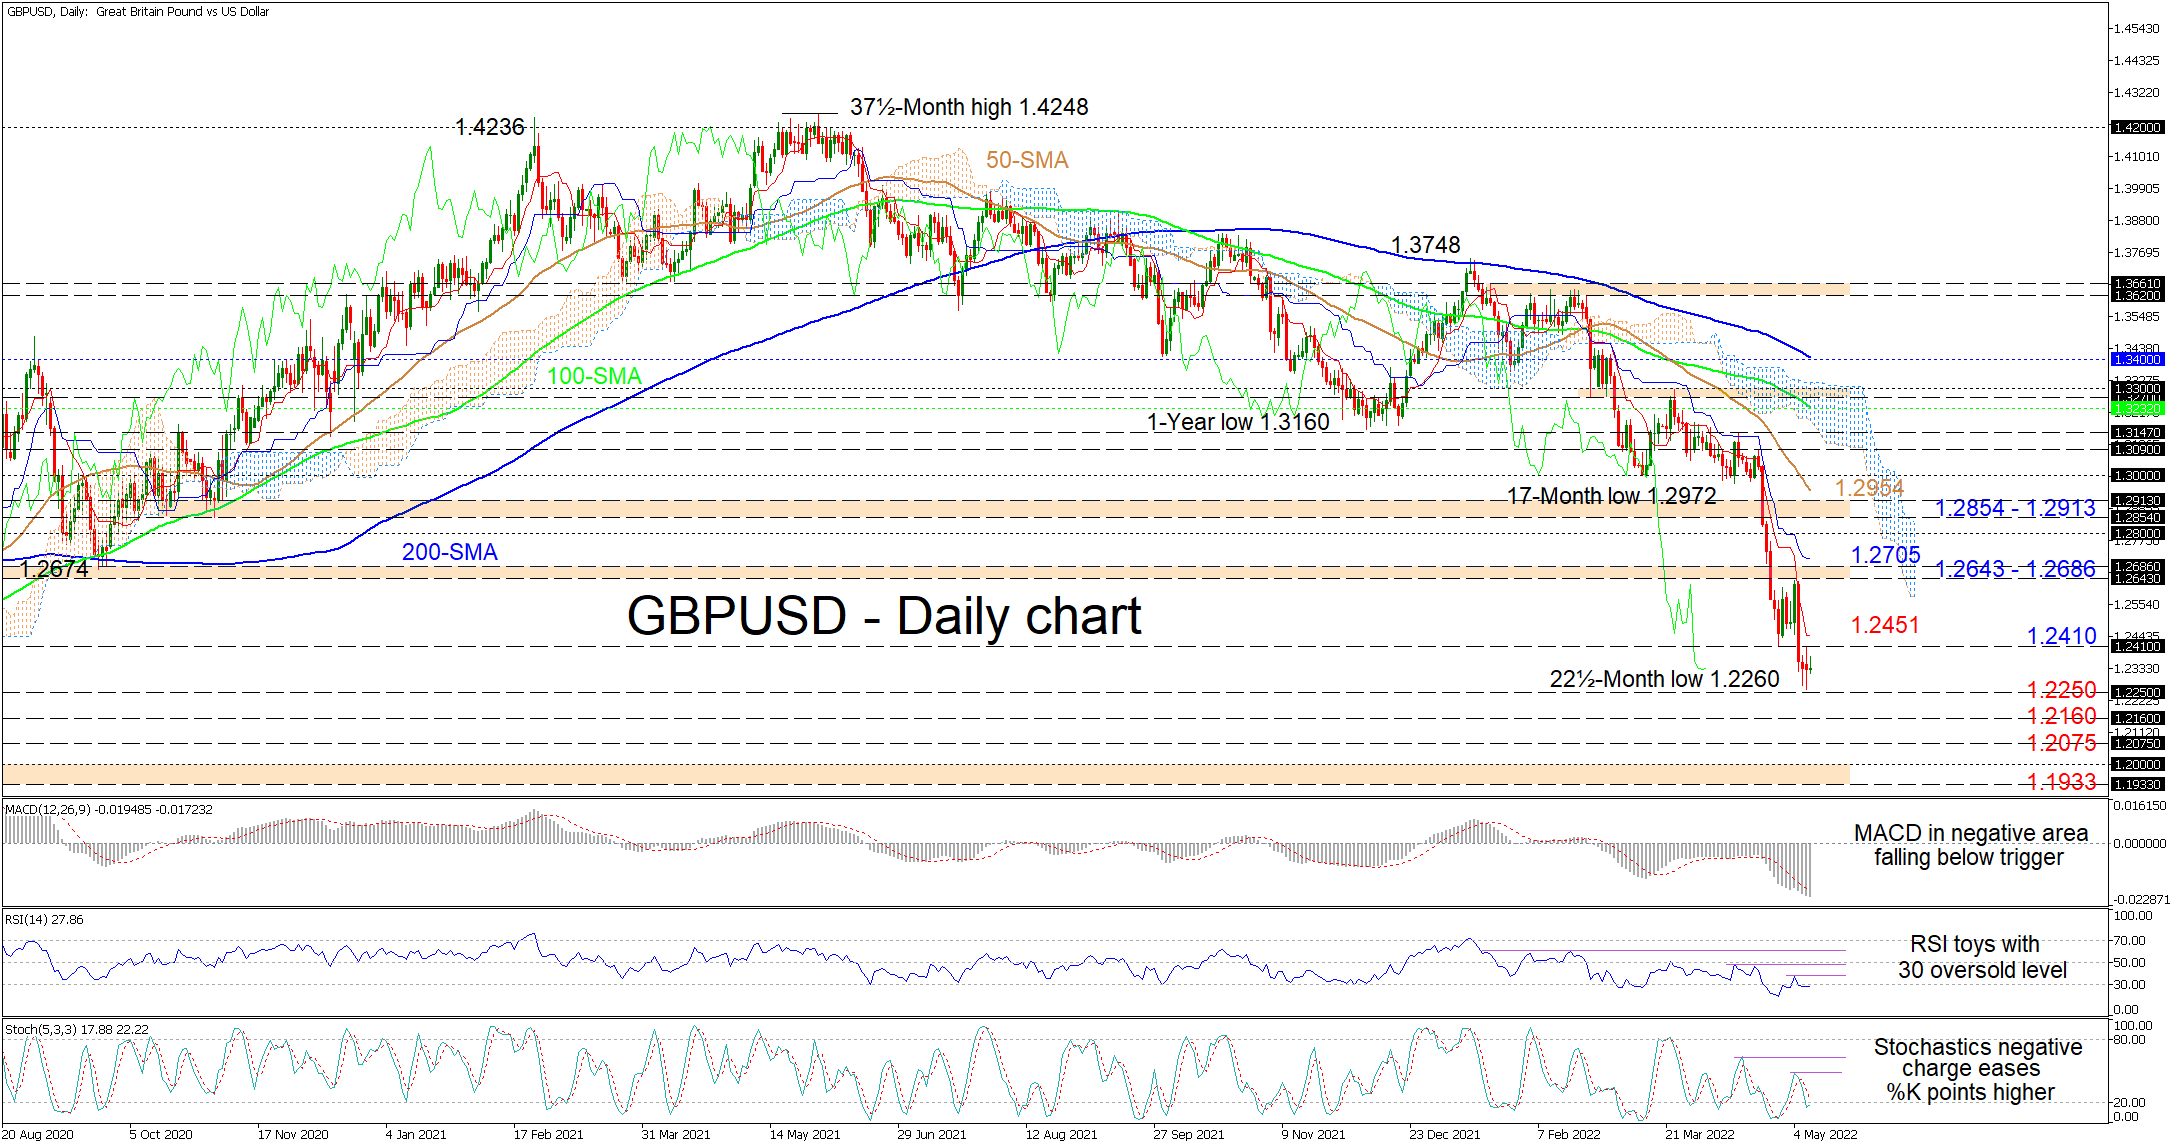
GBPUSD Logs 22½-Month Low Before Bearish Tone Pauses
GBPUSD is consolidating after its downward trajectory approached the June 2020 low of 1.2250. Nonetheless, the falling simple moving averages (SMAs) are endorsing the bearish bias that unfolded from June 2021, even though downside forces are currently lacking.
The Ichimoku lines are indicating that selling has temporarily stalled, while the negative bias in the short-term oscillators has yet to be overturned. The MACD is signalling that sellers are not surrendering control, while the negative charge in the stochastic oscillator is revealing some weakness, as the %K line is pointing higher. Meanwhile, the RSI is relatively neutral, flirting with the 30 oversold mark.
If the current downward bearing endures, initial support could transpire from yesterday’s low of 1.2260 and the June 2020 trough of 1.2250. If the pair remains heavy, the 1.2160 barrier may be tested next, prior to sellers’ focus turning toward the May 2020 trough of 1.2075. Should selling pressures persist, the bears could then challenge the 1.1933-1.2000 support band, which stretches back to mid-March of 2020.
Alternatively, if buyers re-emerge, the 1.2410 inside swing low and the nearby red Tenkan-sen line at 1.2451 could act as preliminary friction to any positive developments in the pair. Successfully pushing higher though, the bulls may then tackle the 1.2643-1.2686 resistance band that started to evolve around mid-June 2020. Conquering this obstacle and overrunning the approaching blue Kijun-sen line at 1.2705, the price could take a crack at the 1.2800 hurdle before eyeing the 1.2854-1.2913 resistance boundary, shaped by the lows over the mid-October until early November 2020 period.
Summarizing, GBPUSD is sustaining a broader bearish bias below the SMAs and the 1.3000 border. A dive past the June 2020 trough of 1.2250 may reinforce further deterioration in the pair. That said, for optimism to begin to return, the price would need to initially climb over the 1.2643-1.2686 key barrier.
WTI Oil: Oil Consolidating after Sharp Fall on Growing Economic Worries and Robust Dollar
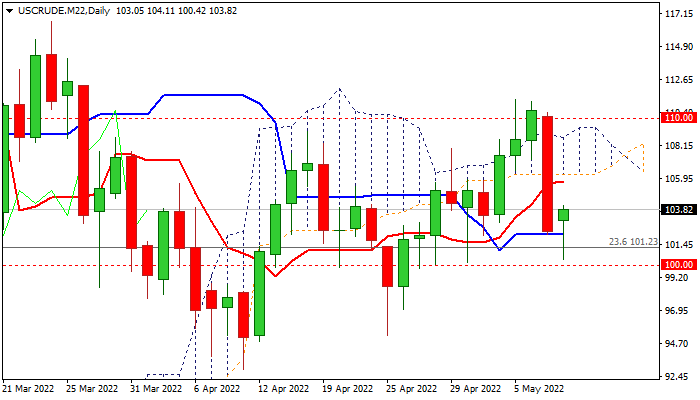
WTI oil is consolidating above strong $100 support (psychological / Fibo 61.8% of $92.92/$111.33 upleg), following a 7% drop on Monday (the biggest one-day loss since Mar 28), as strong dollar and economic worries soured sentiment, increasing pressure on oil prices.
Coronavirus lockdowns in China raise worries about lower demand from world’s top oil importer, the dollar hit 20-year high and worries that global economy is sliding into recession on soaring inflation and impact from the conflict in Ukraine that would strongly hurt demand for crude oil.
Fresh weakness reversed the most of last week’s advance on signals that the EU is working on plan for total embargo on Russian oil, but the bloc’s member states are still far from the unity on this question that continues to hurt the sentiment, in addition to existing fears that Russia retaliates by cutting off gas supplies to the Europe, whose economies are highly dependent on Russian energy.
Monday’s drop weakened the structure on daily chart, although near-term bias is expected to remain positively aligned as long as price stays above $100 level, as 14-d momentum is turning higher, still in the positive territory.
Potential rebound could be also attracted by daily cloud twist, due on Friday, however, bulls need to clear daily Tenkan-sen ($105.72 and dent daily cloud base ($106.19) to ease downside pressure and shift near-term focus higher.
On the other side, weak fundamentals and Monday’s large bearish daily candle are expected to weigh on near-term price action and keep $100 pivot at risk, with break here expose supports at $98.54 and $95.27 (trendline support / Apr 25 trough).
Res: 105.26; 105.72; 106.19; 107.95
Sup: 100.42; 100.00; 98.54; 97.04
Markets Dive On Growth Fears
Asian equities remained under pressure on Tuesday as the massive sell-off across financial markets left investors bloodied and worried. Although European futures are pointing to a positive open despite the overall market caution, the lack of appetite for risk may cap upside gains. Mounting fears around rising interest rates and slower global economic growth hammered global sentiment yesterday, with risk assets feeling the burn.
In the currency space, king dollar reached levels not seen in 20 years, thanks to risk aversion and rising Treasury yields which climbed past 3.20% for the first time since 2018. Commodity markets also tumbled as investors looked for the sell button across all asset classes. Although gold prices seem to be stabilising this morning, the precious metal is likely to face headwinds in the form of an appreciating dollar, rising Treasury yields and Fed rate hike bets. Oil prices are not looking too pretty as lockdowns in China and global growth fears weigh on the demand outlook.
The negative vibe and uncertainty across financial markets may encourage investors to maintain a safe distance from riskier assets this week, resulting in a higher dollar and some support for gold. On the data front, Germany’s ZEW economic confidence survey results will be published later this morning. Markets expect the sentiment index to slip to -42.0 in May versus the -41.0 in April. Later in the day, it’s all about speeches from numerous Fed officials which could spark some dollar volatility. However, the main course and key risk event of the week will be the US CPI report on Wednesday.
Dollar advance unstoppable?
Dollar bulls charged into the trading week with renewed vigour, reaching levels not seen in 20 years on Monday, as U.S Treasury yields climbed to new cycle highs. The greenback has appreciated against every single G10 currency this quarter, powered by Fed hike expectations and risk aversion stemming from ongoing geopolitical risks.
With the Dollar Index (DXY) punching above 104.00, this may open doors to higher levels. However, a technical pullback could be the next course of action before bulls step into a higher gear. Given how the week ahead is jampacked with economic US data and speeches from Federal Reserve officials, dollar volatility should remain a key theme.
Later today, a bunch of Fed speakers will be under the spotlight. If they strike a hawkish tone and revive expectations around a 75-basis point rate hike in June, the dollar could extend gains across the board. Tomorrow sees the release of the latest US inflation report which is expected to show prices rising 8.1% year-on-year in April compared with 8.5% in March. A figure that exceeds market expectations could propel the dollar higher, allowing the DXY to secure a strong close above the 104.00 level.
Oil prices tumble amid China lockdowns
Oil prices have stumbled into the week, closing down 6% on Monday, due a combination of factors weighing on the demand outlook.
The commodity found itself under pressure as Saudi Arabia cut prices for customers in Asia and part of Europe, while weaker export data from China compounded downside losses. Growing concerns over higher interest rates, recession worries and Covid-19 restrictions in China leading to slower export growth are also weighing on prices. However, ongoing geopolitical risks revolving around the Ukraine-Russia conflict could cushion downside losses.
Looking at the technicals, it’s all about the $100 level on both crude benchmarks. Should this point prove to be unreliable support, we could see a sharp selloff. Initial support in Brent is the 100-day simple moving average at $97.24.
Commodity spotlight - Gold
The past few weeks have not been kind for gold. An appreciating dollar, rising Treasury yields and expectations over the Fed maintaining an aggressive approach towards monetary policy have battered the precious metal. With the greenback recently hitting levels not seen in 20 years, the path ahead for gold remains rough and rocky.
On the technical front, prices are bearish on the daily charts with support found at $1855. It will be interesting to see whether bulls can defend this level or bears drag prices even lower. The widely watched 200-day simple moving average sits at $1835. Whatever the outcome, volatility is certainly on the cards.
Bitcoin at 30K, Back to the Bottom of the Long-Term Range
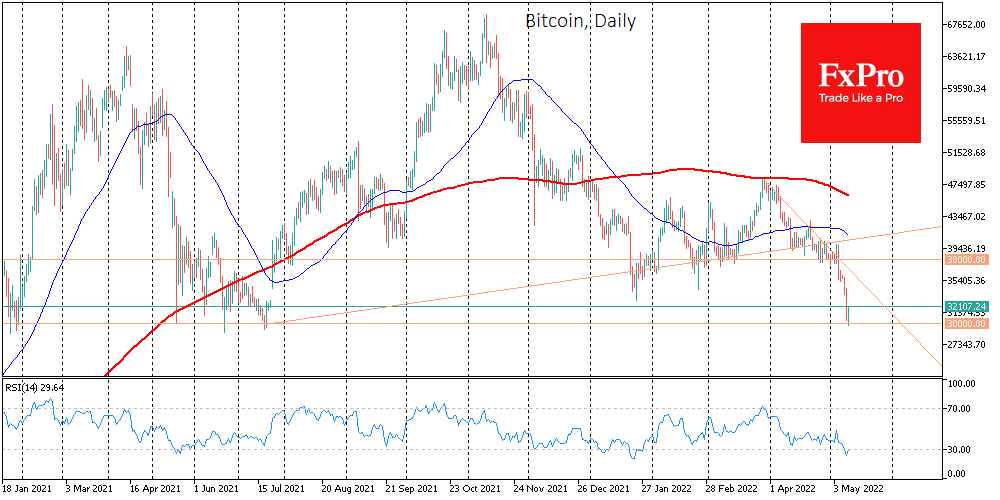
Bitcoin collapsed 9.5% on Monday and dipped temporarily below $30K in early trading on Tuesday, stabilising at $31.3K. Ethereum has lost 3.9% in the past 24 hours, while other leading altcoins in the top 10 have fallen from 8.7% (Solana, Cardano) to 12% (Avalanche).
Total crypto market capitalisation, according to CoinMarketCap, fell 7% overnight to $1.44 trillion. Bitcoin’s dominance index rose 0.3% to 41.8% on more altcoin weakness.
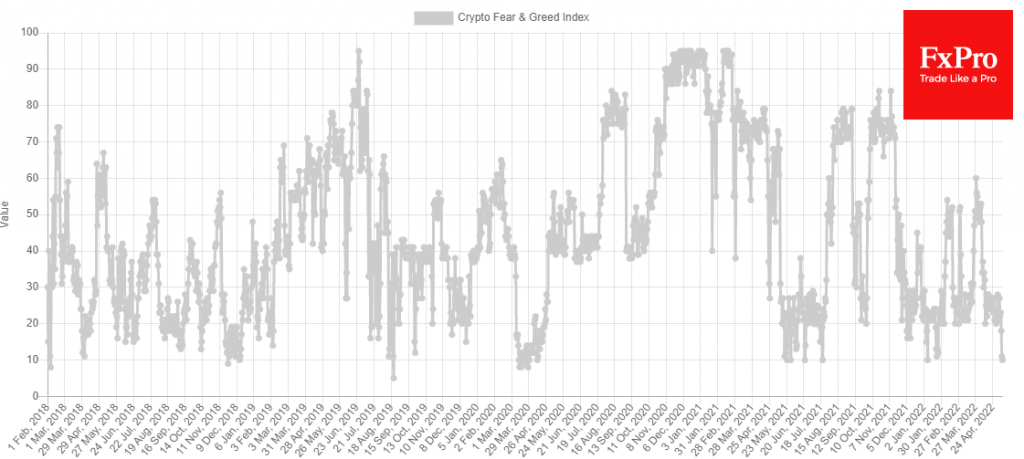
The cryptocurrency Fear and Greed Index was down 1 point to 10 by Tuesday and remains in a state of “extreme fear”, touching a low point for the seventh time in the past year. An even higher level of fear in the last four years that we have only seen in March 2020 and September 2019.
Terra and TerraUSD continue to lose ground. Against this backdrop, the Luna Foundation Guard (LFG) has committed $1.5bn to protect the “stability of UST and the Terra ecosystem as a whole”. Stablecoin UST, designed to be as close to the value of the USD as possible, lost more than 30% at one point overnight. But at the time of writing, it is trading at a 14% discount to the US currency.
The current plunge is a retouch of the lows made in January and July last year for the first cryptocurrency. This could look like a last line of defence for the bulls, who may try to push back from the lower end of the trading range since early January.
However, many markets are on a similar informal frontier separating a correction from a potential collapse, so the situation in the crypto market could largely determine sentiment in the deeper debt and equity markets.
Judging by the dynamics of Stablecoin, the crypto market is undergoing one of its most massive tests of the entire market periphery, which could determine the credibility of the crypto market for many months or years to come. As we can see, Ether and Bitcoin remain resilient and robust enough to make them somewhat of a safe harbour within the stormy crypto sea.
At the same time, the collapse in quotations has not yet affected miners’ confidence in the cryptocurrency’s future, as the BTC network’s hash rate continues to grow.
Ray Dalio, the founder of Bridgewater Associates, one of the biggest hedge funds, said that bitcoin should be in investors’ portfolios. Still, the cryptocurrency itself is not a good competitor to gold in terms of inflation protection. But that could change in the next five to 10 years.
Stocks and Cryptocurrencies Slump as Recession Bets Rise
The sell-off in Wall Street continued Monday as the Dow Jones plunged by over 600 points and the Nasdaq 100 fell by 500 points. Stocks continued declining as investors continued to worry about the rising risk of a recession and thinning margins. Recent data showed that there was a likelihood that the economy will go through a recession. For example, data published in April revealed that the American economy barely grew in the first quarter. Also, the recent inversion of the yield curve led to elevated fears that the situation in the US will worsen. Well-known companies like Tesla, Apple, AMD, Nvidia, and Microsoft declined by more than 5%.
The corporate earnings season continued Monday as more American firms published weak quarterly results. In a statement, Palantir Technologies said that it had a strong first-quarter as its revenue rose to $446 million. However, the stock crashed by more than 20% after the firm warned about its guidance. Electric vehicle companies like Tesla, Rivian, and Canoo declined sharply after Lordstown Motors reported weak results. The top companies that will publish their results today are Hyatt Hotels, Planet Fitness, Electronic Arts, and Roblox.
There will be no major economic events today. In the Asian session, New Zealand published relatively strong electronic card retail sales while Australia released the latest retail sales numbers. Other key events to watch on Tuesday will be the latest Norway consumer inflation numbers and the German ZEW economic sentiment data. Finally, the American Petroleum Institute will release the latest inventories numbers. This data will come as the EU continues to deliberate on a Russian oil ban.
EURUSD
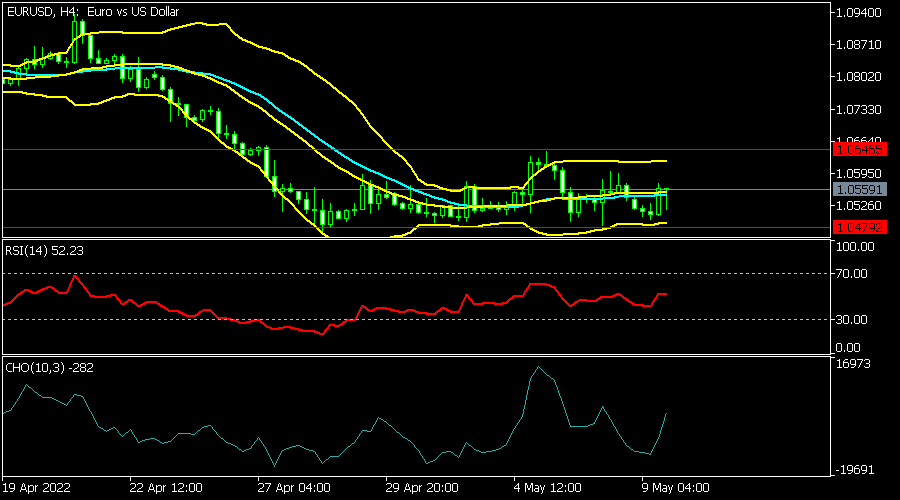
The EURUSD pair remained stuck in a narrow range during the Asian session. The pair is trading at 1.055, which is slightly above last week’s low of 1.0480. The Bollinger Bands have narrowed while the price has moved slightly above the 25-day moving average. The Chaikin Oscillator and the Relative Strength Index (RSI) have pointed upwards. The pair will likely remain in this range as investors wait for the upcoming US inflation data.
XBRUSD
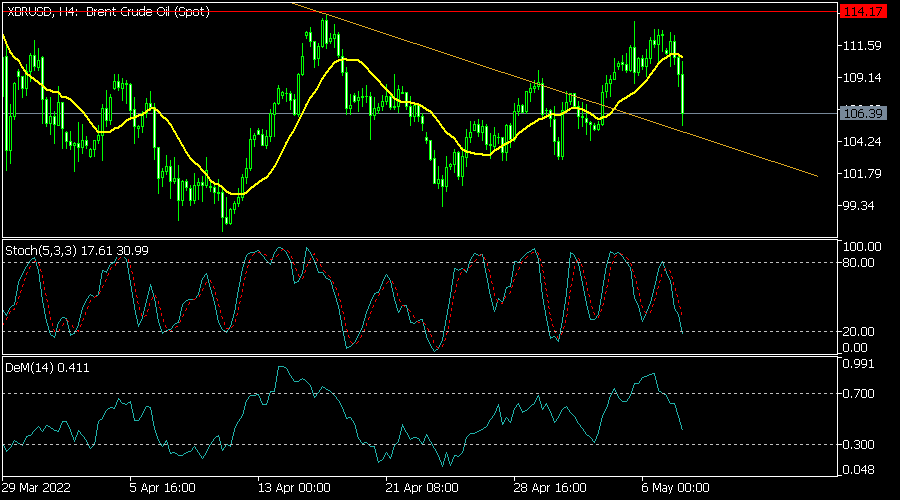
The XBRUSD pair declined ahead of the upcoming US inventories data. It also declined after the Russian Victory Day event. It is trading at 106.53, which was the lowest level since May 4th. It is about to retest the descending trendline. The pair has also dropped below the 25-day moving average while the Stochastic Oscillator and DeMarker have also pointed downwards. The pair will likely resume the bullish trend now that it has formed a break and retest pattern.
EURCHF
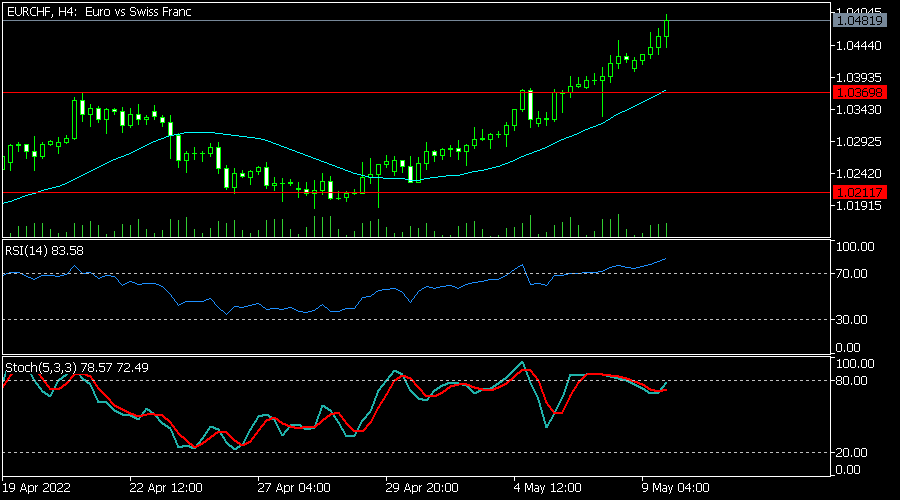
The EURCHF pair continued its bullish trend as investors priced in a divergence between the ECB and the SNB. the pair’s bullish trend accelerated when it moved above the important resistance at 1.0370. On the four-hour chart, it has moved above the 25-day and 50-day moving averages while the Relative Strength Index (RSI) has continued rising. The pair will likely keep rising in the near term.
NZDJPY Slices Below 50-Day Average, is the Rally Over?
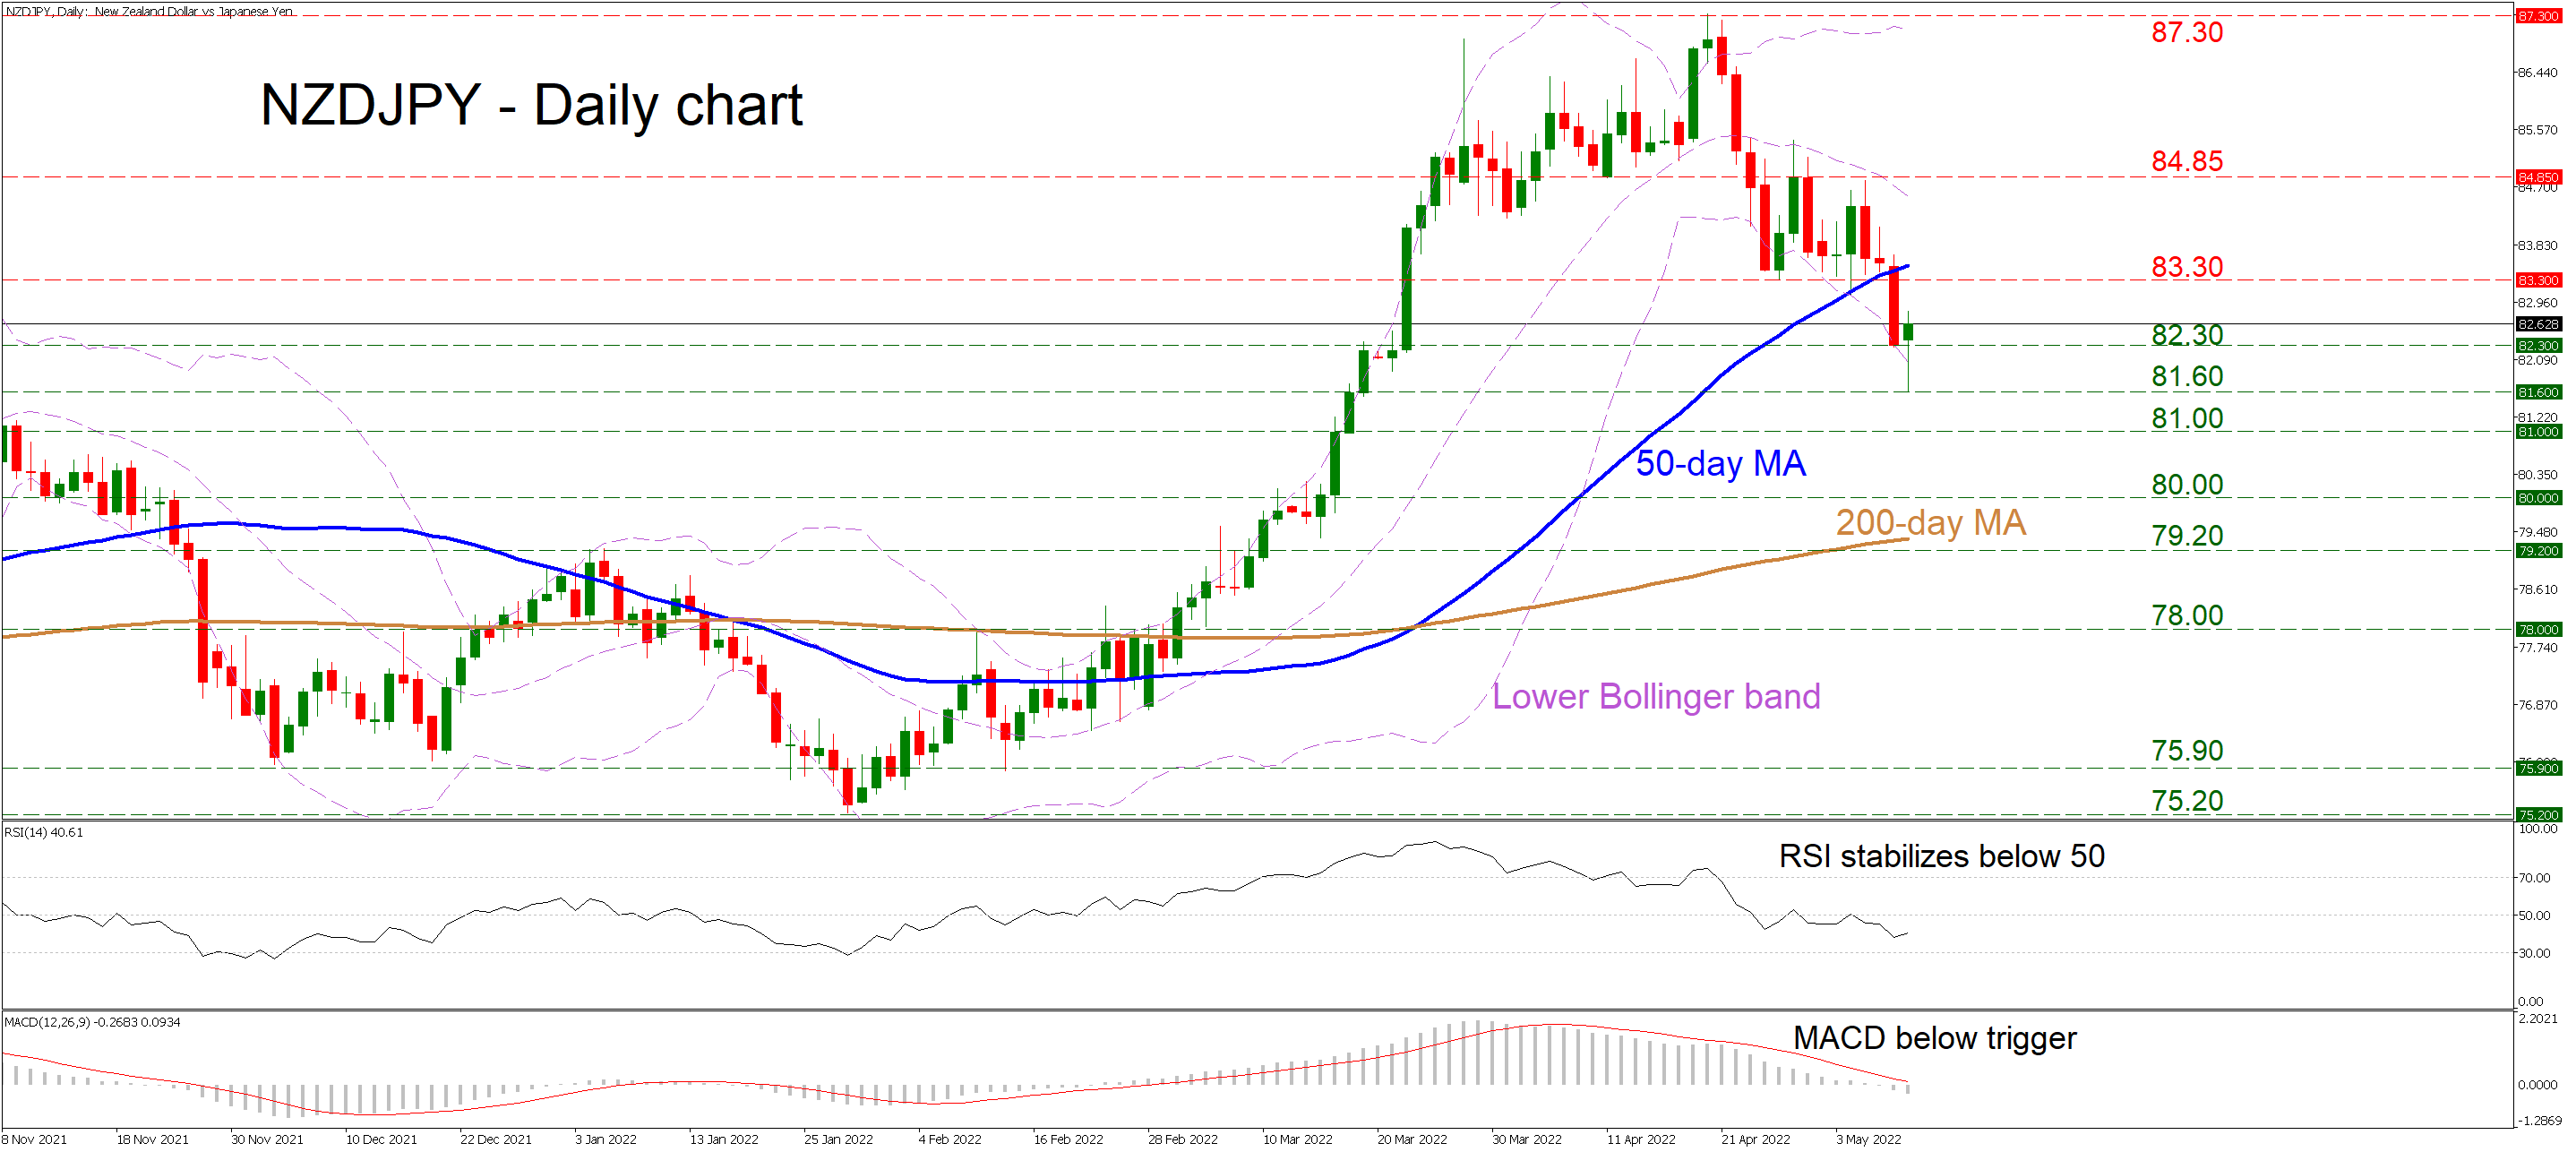
NZDJPY experienced a very sharp drop in recent sessions, sliding below its 50-day moving average to find support near its lower Bollinger band. The uptrend that started in late January seems to be unravelling as the pair has printed lower lows and lower highs, particularly on shorter timeframes.
Short-term oscillators paint a picture of a slightly bearish market. The RSI has stabilized a little, albeit below its neutral 50 line, while the MACD is stuck below its red trigger line.
In the case that sellers remain in charge and manage to pierce back below the 82.30 area, which was also a top back in October, the next region to provide support may be around 81.60. This zone also roughly coincides with the 50% Fibonacci retracement level of the January-April rally.
If buyers seize back control, their first test would be the 83.30 territory and the 50-day moving average just above at 83.50. If that resistance barrier is breached, the next hurdle to provide resistance could be the 84.85 line, marked by the recent highs and the inside swing low in early April.
Summarizing, the picture has turned neutral with the formation of successive lower lows and lower highs. For the outlook to turn firmly negative, traders might need to see a slide below the 200-day moving average.
XAG/USD Tests 5-Month Low
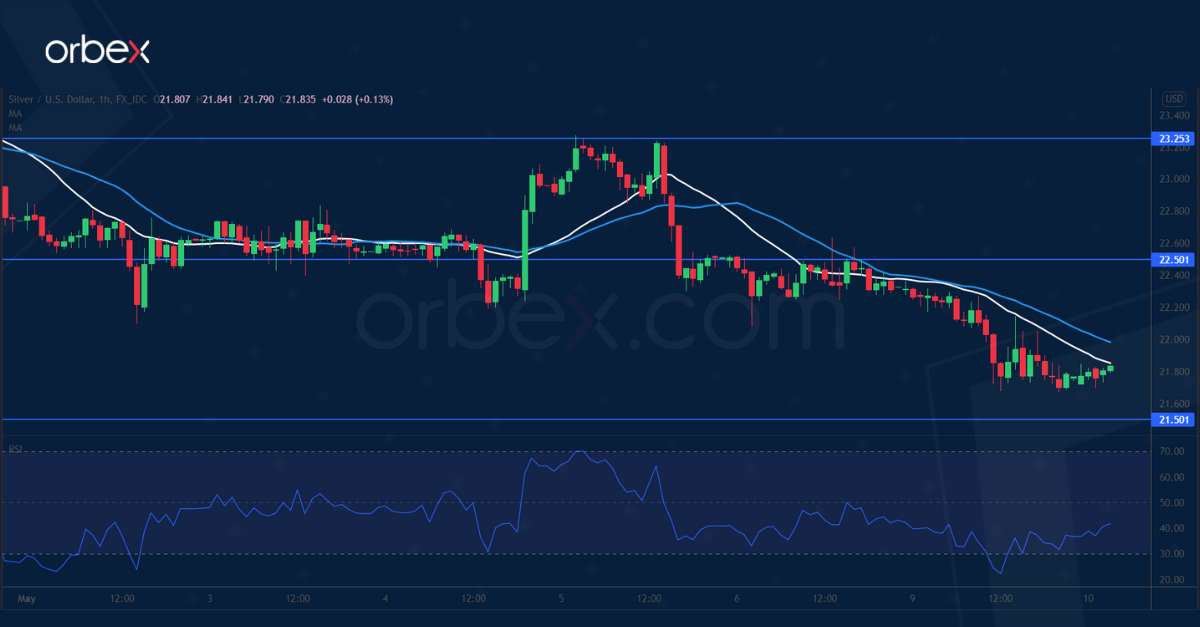
Silver edged lower as US Treasury yields stayed high. A break below the recent consolidation range at 22.20 suggested a lack of buying interest and prompted early bulls to bail out. The price is testing last December’s low at 21.50. As the RSI shows an oversold condition on both daily and hourly charts, profit-taking from the short-side and dip-buying could cause a rebound. 22.50 is a fresh resistance and 23.25 a major hurdle before buyers could push for a reversal. Otherwise, the psychological level of 20.00 might be next.