Sample Category Title
NZDUSD Wave Analysis
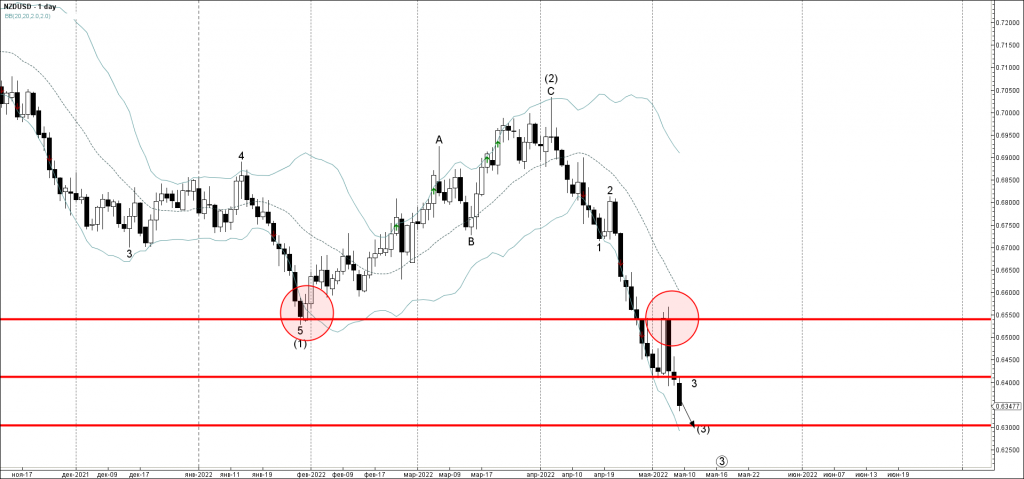
- NZDUSD broke key support level 0.6410
- Likely to fall to support level 0.6300
NZDUSD currency pair under the bearish pressure after the price broke the key support level 0.6410 (which reversed the price sharply at the start of this month).
The breakout of the support level 0.6410 accelerated the active impulse waves 3 and (3).
Given the clear daily downtrend – NZDUSD currency pair can be expected to fall further toward the next support level 0.6300 (target price for the completion of the active wave (3)).
Canadian Dollar Extends Losses
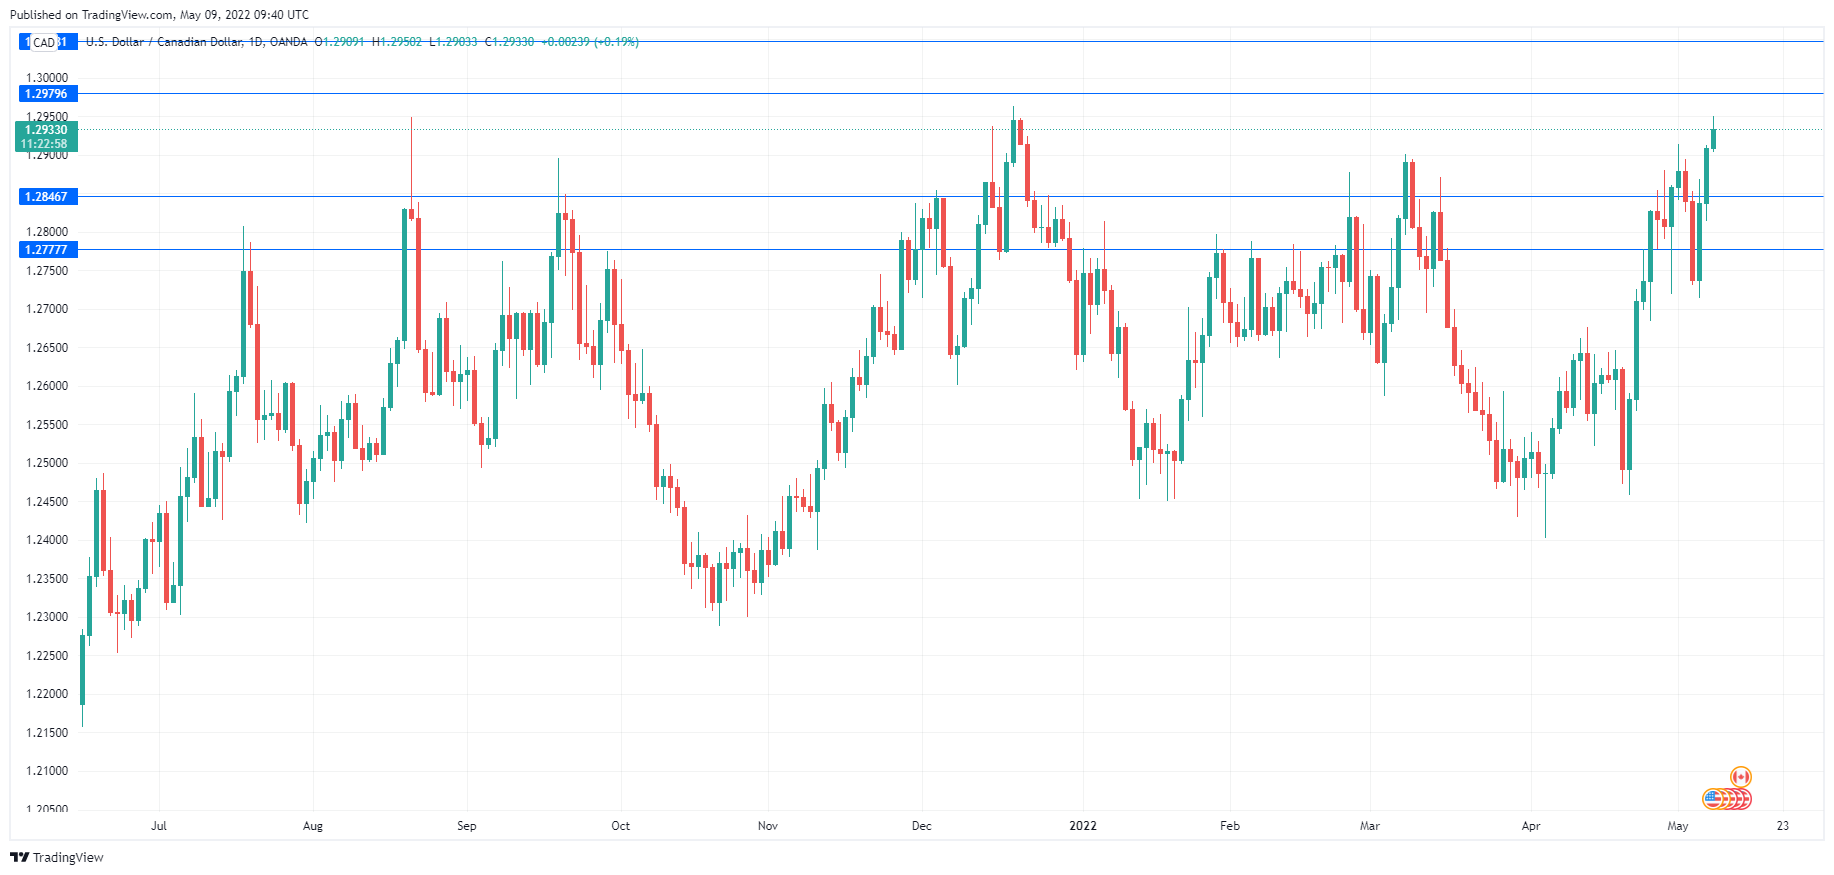
The US dollar continues to post gains and is in positive territory at the start of the week. USD/CAD is trading at 1.2934 in the European session, up 0.20% on the day.
Canada unemployment drops
Canada’s April employment report on Friday was steady but not spectacular. The economy added a modest 15.3 thousand jobs, lower than the estimate and well below the March release of 72.5 thousand. The labour market may well have reached its limit, after all the strong gains we’ve seen during the Covid recovery. The number of job vacancies remains high and the unemployment rate fell from 5.3% to 5.2%, both of which reflect a robust labour market and a shrinking labour pool.
The tightening job market is putting further pressure on the Bank of Canada to raise rates at a faster pace than expected. The benchmark rate is currently at an even 1.00%, after the 0.50% hike in April. Governor Macklem has hinted that he could deliver more 0.50% hikes and we could see rates rise to 2% by the end of Q2. Macklem has signalled the rate-hike cycle could be very aggressive, saying that he will lift rates above 3% if necessary, in order to beat back spiralling inflation.
The Canadian dollar remains under pressure, with USD/CAD setting its sights on the symbolic 1.30 line. The Fed is also showing its hawkishness, having just delivered its own oversize 0.50% hike last week. This move was priced in by the markets, but the rate hike and the expectations of more on the way have provided plenty of wind for the sails of the US dollar. USD/CAD hit 1.2950 earlier today, its highest level since December 21st 2020. For USD/CAD, risk is tilted to the upside, and I expect the pair to put further pressure on the 1.30 line.
USD/CAD Technical
- There is support at 1.2846 and 1.2777
- Resistance at 1.2979 is protecting the 1.30 level. Above, there is support at 1.3048
EURUSD Buyers Struggle to Make Advances
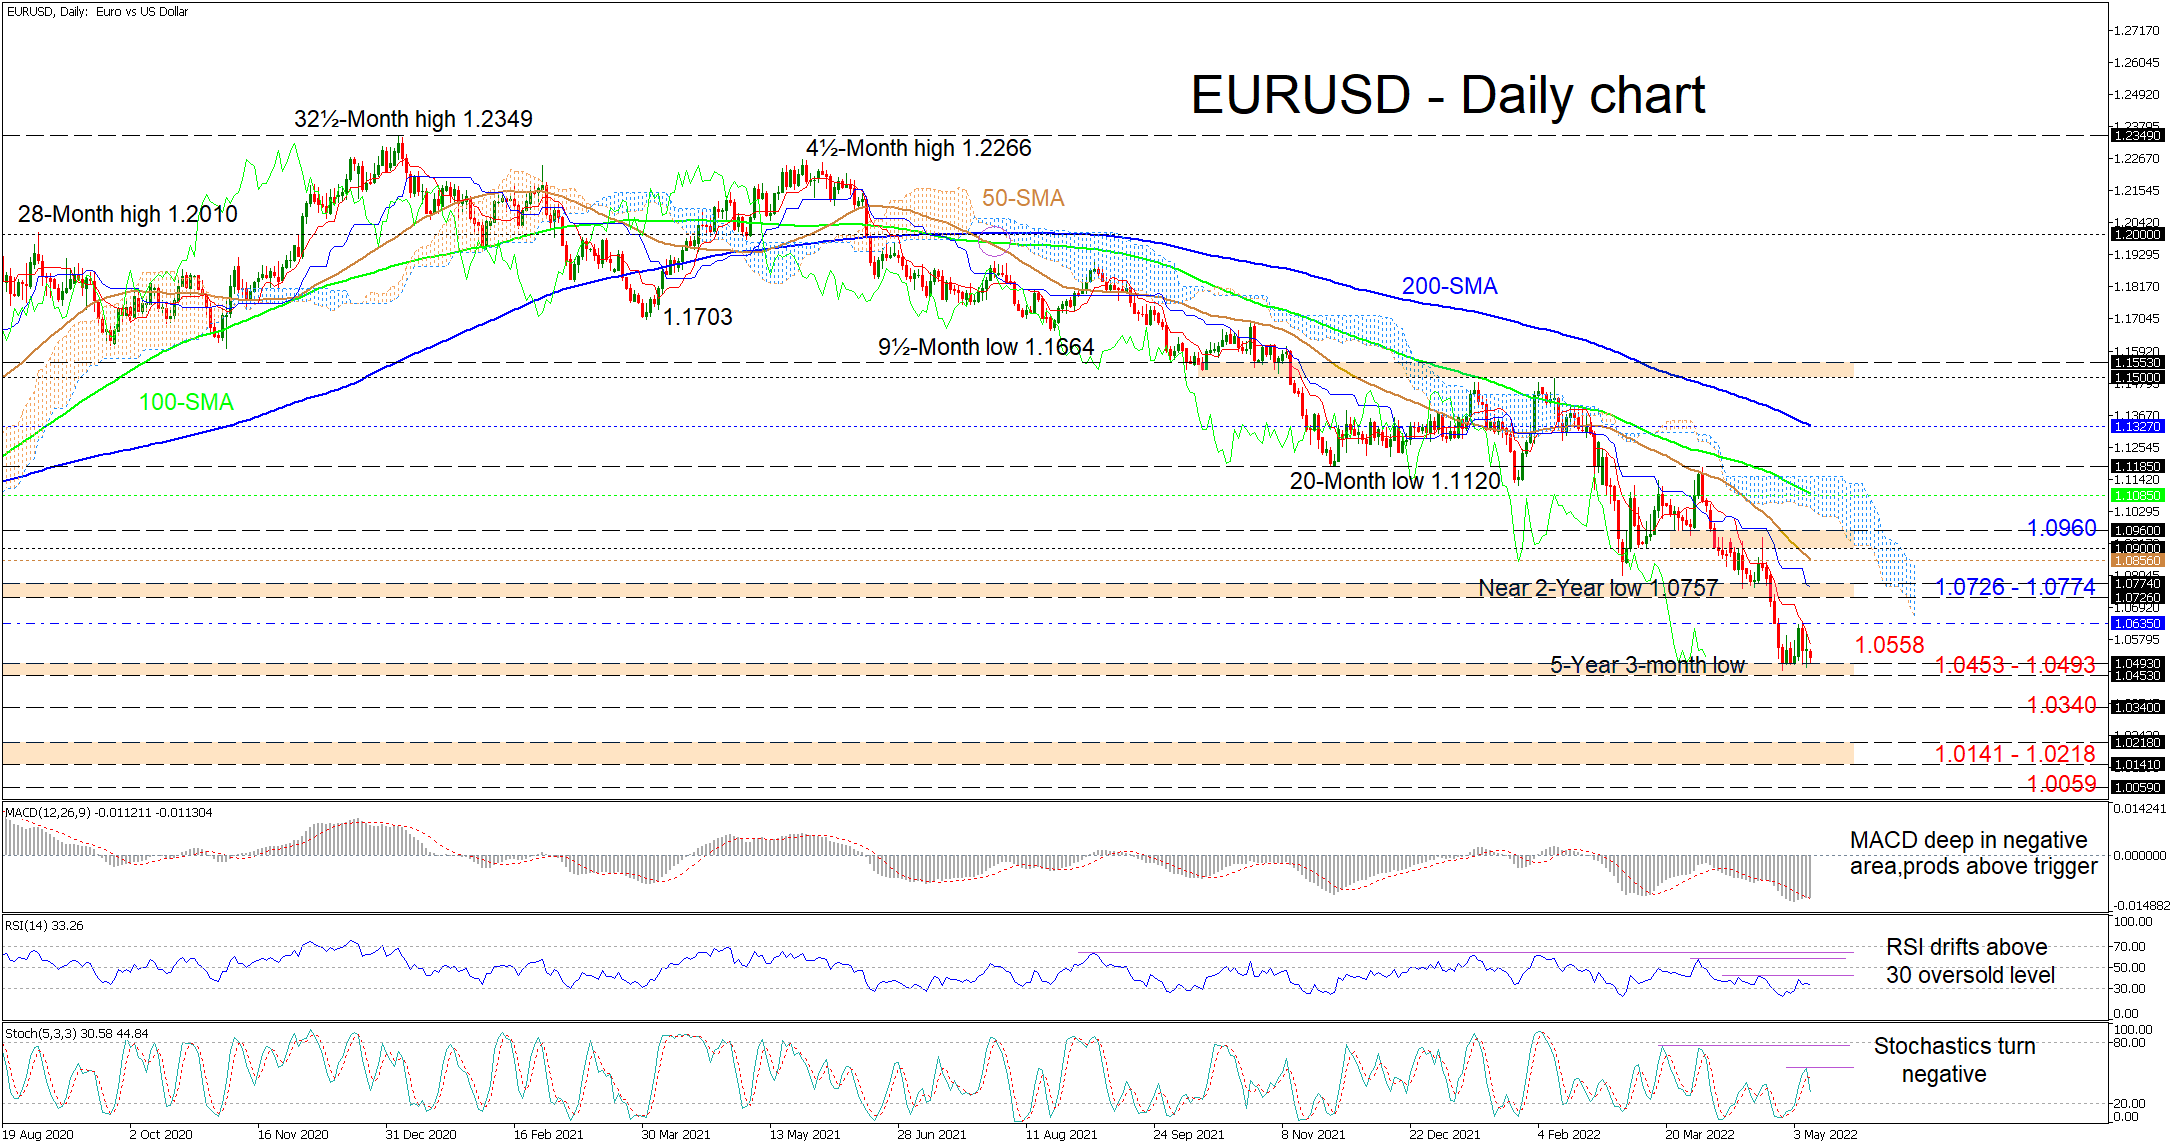
EURUSD is tiptoeing around more than five-year low levels and the pair’s efforts to improve seem to be to no avail, leaving no fingerprint of clear gains as the bearish bias overwhelms. That said, the falling simple moving averages (SMAs) are endorsing the downward trajectory in the pair.
Currently, the downward sloping Ichimoku lines are indicating that the sellers are active, while the short-term oscillators are now transmitting mixed messages in directional impetus. The MACD is reflecting easing in negative momentum as the stochastic oscillator is promoting additional descending moves in the pair. Meanwhile, the RSI is hovering in the bearish region, above the 30 oversold mark.
In the negative scenario, the 1.0453-1.0493 support band may try to delay for a while longer the revival of the broader descent in the pair. However, if selling pressures intensify, the price may meet the January 2017 trough of 1.0340 before aiming for the 1.0141-1.0218 support section that extends all the way back to mid-July 2002. Should the heavy pair sink past this barrier too, the bears could then attack the December 2002 low of 1.0059 opening the door for the parity mark.
Otherwise, if buyers create positive traction off the 1.0453-1.0493 multi-year low boundary, upside friction could commence from the falling red Tenkan-sen line at 1.0558 ahead of the March 2020 trough (previous support-now-resistance) of 1.0635. Slightly higher, the 1.0726-1.0774 resistance band could then test buying power, a barrier referring to the April until mid-May 2020 period of lows. Creeping further up, the bulls may encounter the approaching 50-day SMA at 1.0856 ahead of the 1.0900-1.0960 resistance border.
Summarizing, EURUSD is sustaining a sturdy bearish bearing beneath the SMAs and the 1.1185 high. A break below the 1.0453-1.0493 support may nudge positive developments further into the horizon. Yet, for optimism to return in the pair, the price would need to step over the 1.0900-1.0960 obstacle and the Ichimoku cloud.
Bitcoin Will Fall Until the Bulls Capitulate
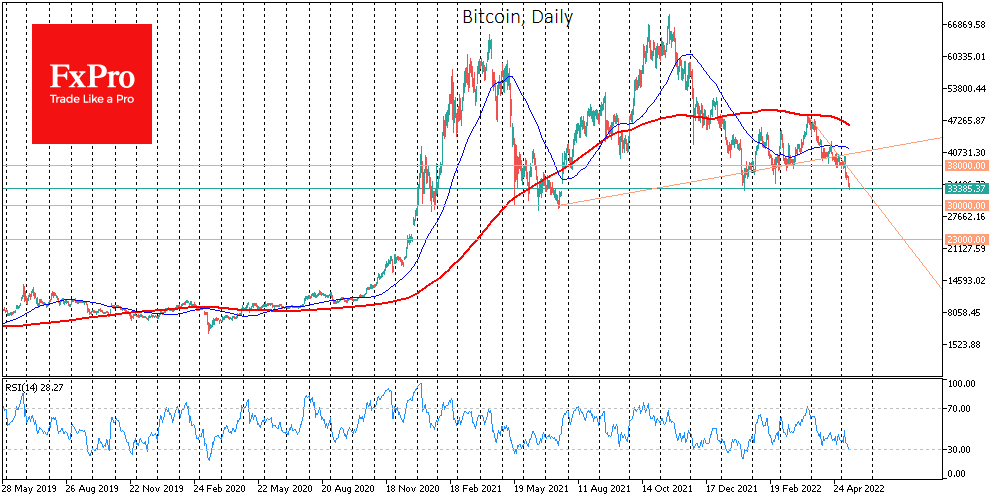
Bitcoin is trading near $33.5K on Monday morning, declining for the fifth consecutive day. Over the past 24 hours, losses are 2.3%, and are approaching 14% over the past seven days. Ether loses 3.5% in 24 hours and 14.3% for the week, settling near $2450. Altcoins from the top ten are down between 0.8% (XRP) and 4.3% (Cardano).
Total crypto market capitalisation, according to CoinMarketCap, is down 2.3% overnight to $1.54 trillion. More worryingly, volumes are rising along with falling prices. This situation points to an increasingly rapid exit from cryptocurrencies, even though the process takes place without sharp dips. We see an orderly exit – a sure sign that downward sentiment may prevail.
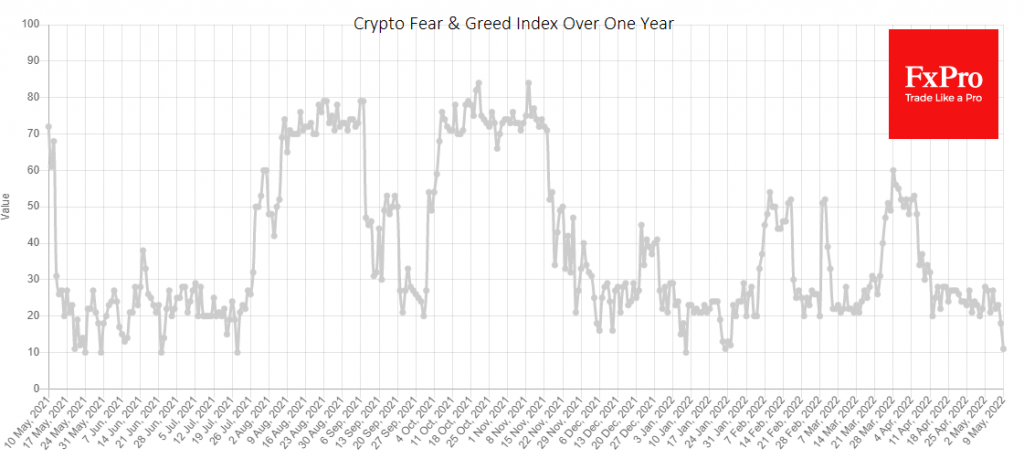
The optimists, however, have something to hang on to. The Cryptocurrency Fear and Greed Index has collapsed to 11. Over the past year, the index has been at the current or lower level six times, and on each occasion, we have seen either consolidation or the start of a rally and a rebound.
In March 2020, when the index similarly reached single digits, we saw an influx of long-term buyers.
The current extreme fear may attract buyers who have been waiting for extreme oversold conditions to buy cryptocurrencies long term.
However, we note that the amplitude of crypto market fluctuations does not resemble either a capitulation of enthusiasts or a wave of stop orders triggering. Typically, a trend reversal is preceded by a sharp increase in momentum with the eventual resignation of those who stood against the trend.
In our case with Bitcoin, this could translate into a sharp acceleration of the sell-off after falling below $30K, all the way to the $23K or even the $20K area. It is only from this level that major long-term buyers can be expected to emerge.
Nasdaq 100 and Dow Jones Struggling as Earnings Growth Slows
Global stocks are still on edge as worries about the Federal Reserve continued. Futures tied to the DAX and Nasdaq 100 continued dropping in early trading. The sell-off accelerated when the Fed decided to reduce liquidity in the market by hiking interest rates and starting a quantitative tightening policy. As a result, stocks declined as investors avoided betting against the Fed. At the same time, the earnings season has pointed to margin contraction considering that earnings have declined. According to FactSet, earnings growth was at 9.1%, which is the lowest level since Q4 of 2020.
The price of crude oil rose slightly as investors reacted to the latest meeting by OPEC+ leaders. The members, as expected, decided to continue hiking production gradually even as demand kept rising. They will now continue adding about 432k barrels of oil per day. The announcement came as the European Union continued deliberating on blocking Russian oil. The process stalled when Hungary decided to veto it saying that the move would deprive the economy of the vital resource.
The economic calendar will not have any major events today. Therefore, investors will focus on the ongoing earnings season. The companies that will publish today include Tyson Food, Palantir Technologies, Lordstown Motors, Maxar Technologies, and Vroom among others. Raphael Bostic, a Fed official will speak and share his opinion about the economy. Earlier on, the Chinese statistics agency said that its exports declined slightly because of recent lockdowns.
XBRUSD
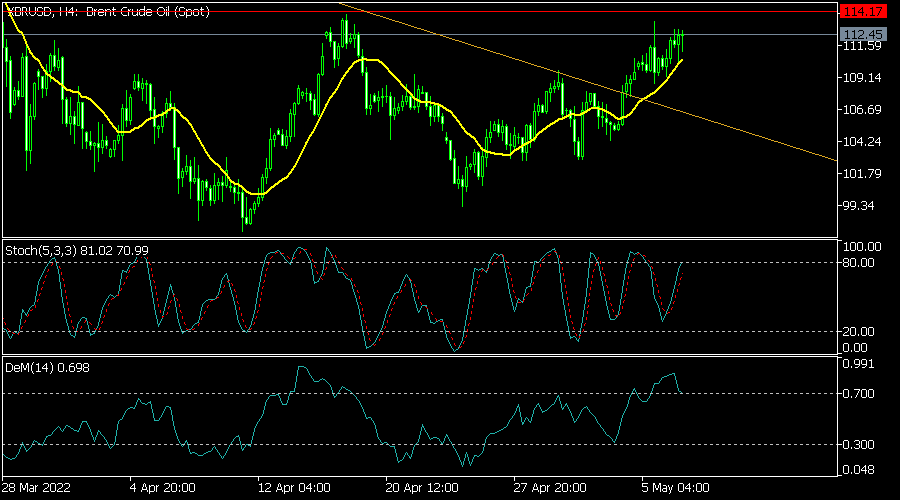
The XBRUSD pair continued surging as demand continued rising. It rose to a high of 112.45, which was the highest level since April 20th. On the four-hour chart, the pair is approaching the important resistance level at 114.17. It has also moved slightly above the descending trendline shown in orange. The uptrend is also being supported by the 25-day and 50-day moving averages while the Stochastic Oscillator and the DeMarker indicator have risen. Therefore, the pair will likely keep rising as bulls target the key resistance at 114.17.
EURUSD
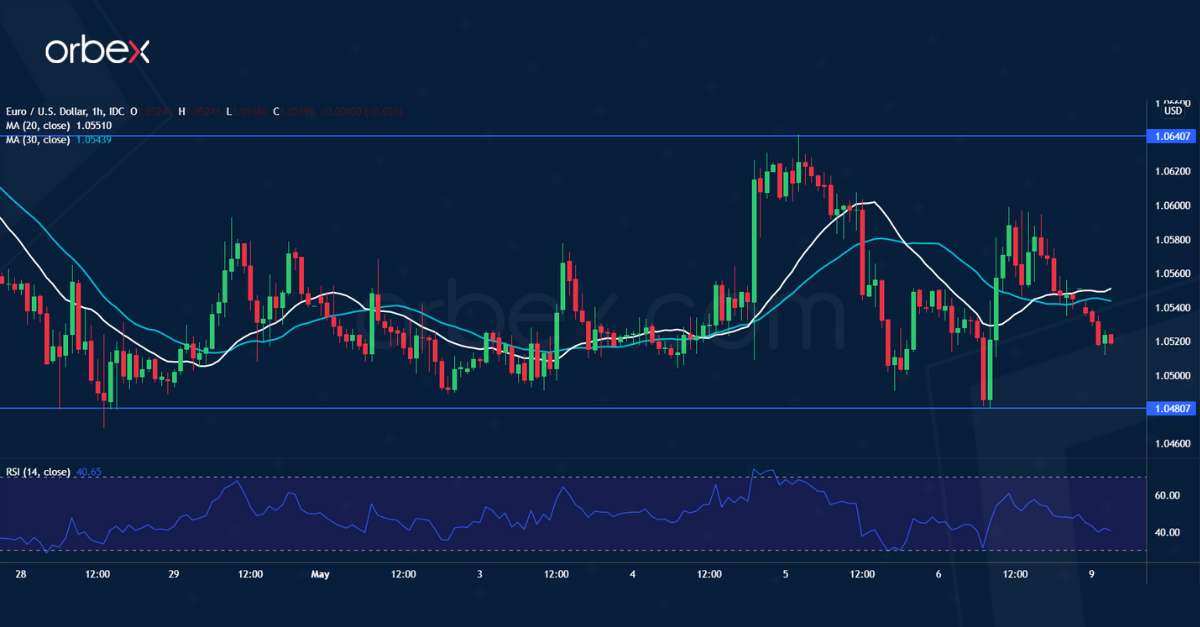
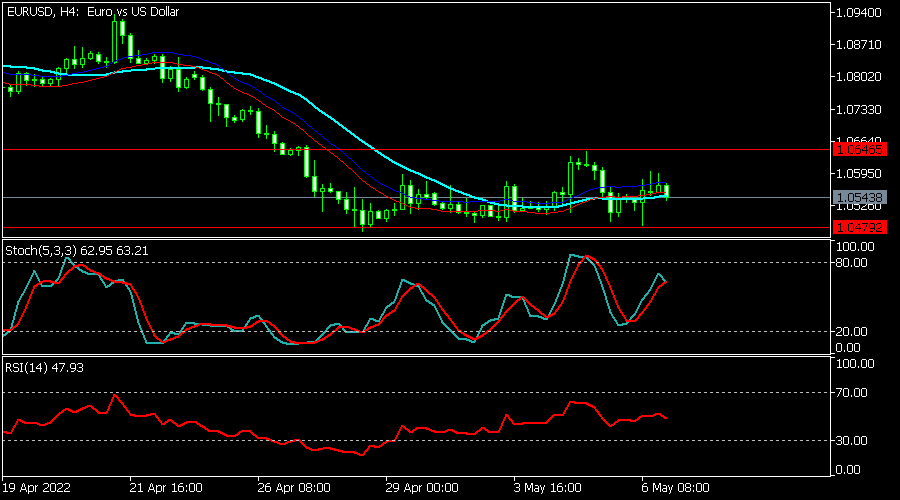
The EURUSD pair moved sideways as investors reacted to the recent American non-farm payrolls data. It is trading at 1.0545, which is slightly above last week’s low of 1.0480. It is at the same level as the envelopes indicator while the Relative Strength Index and the Stochastic Oscillator have moved to the neutral level. The pair will remain at this range since there is no major data from the US and EU.
USDCAD
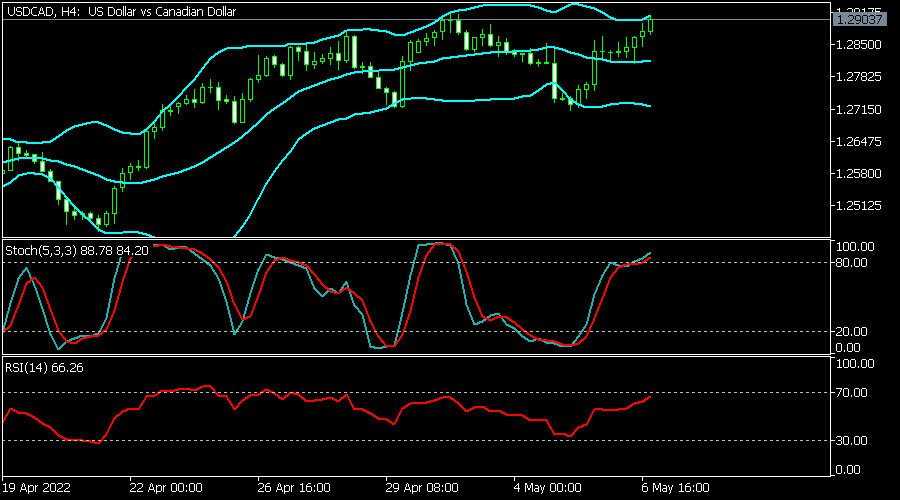
The USDCAD pair held steady after the latest jobs data from the US and Canada. It is trading at 1.2900, which was the highest level since May 4. It moved above the upper side of the Bollinger Bands. Also, the pair has moved above the 25-day and 50-day moving averages while the Relative Strength Index has moved close to the overbought level. The pair will likely keep rising as bulls target the resistance at 1.2950.
Yuan selloff accelerates as China tightens up Shanghai lockdown again
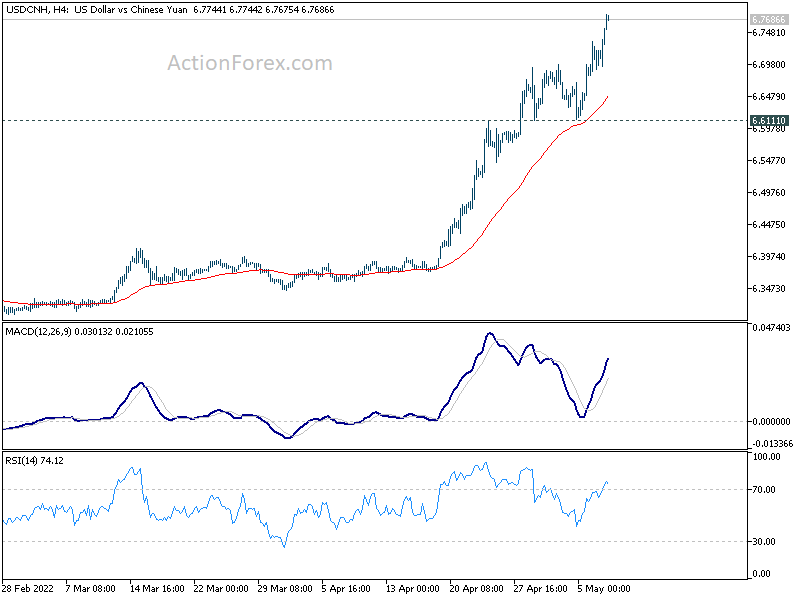
The selloff in Chinese Yuan accelerates again today as the Chinese government tightened up city-wide lockdown in Shanghai again. The decision came after President Xi Jinping's pledge last week to double down on the "battle" against the coronavirus.
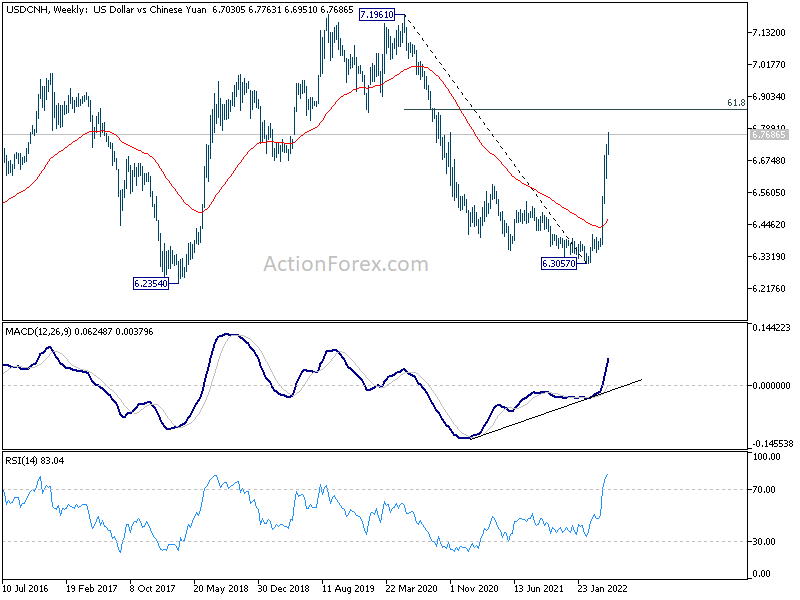
USD/CNH (offshore Yuan) hits as high as 6.7763 so far today, highest level since late 2020. Technically, Current rise is at least in the same degree as the down trend from 7.1961 (2020 high). Further rise is expected as long as 6.6111 support holds. Next target is 61.8% retracement of 7.1961 to 6.3057 at 6.8560.
Also, released from China earlier today, exports rose 3.9% yoy in April, above expectation of 3.2% yoy. Imports dropped -2.0% yoy, versus expectation of -3.0% yoy. Trade surplus widened from USD 47.4B to USD 51.1B, basically in-line with expectations.
Gold Shows No Intention of Altering Bearish Phase
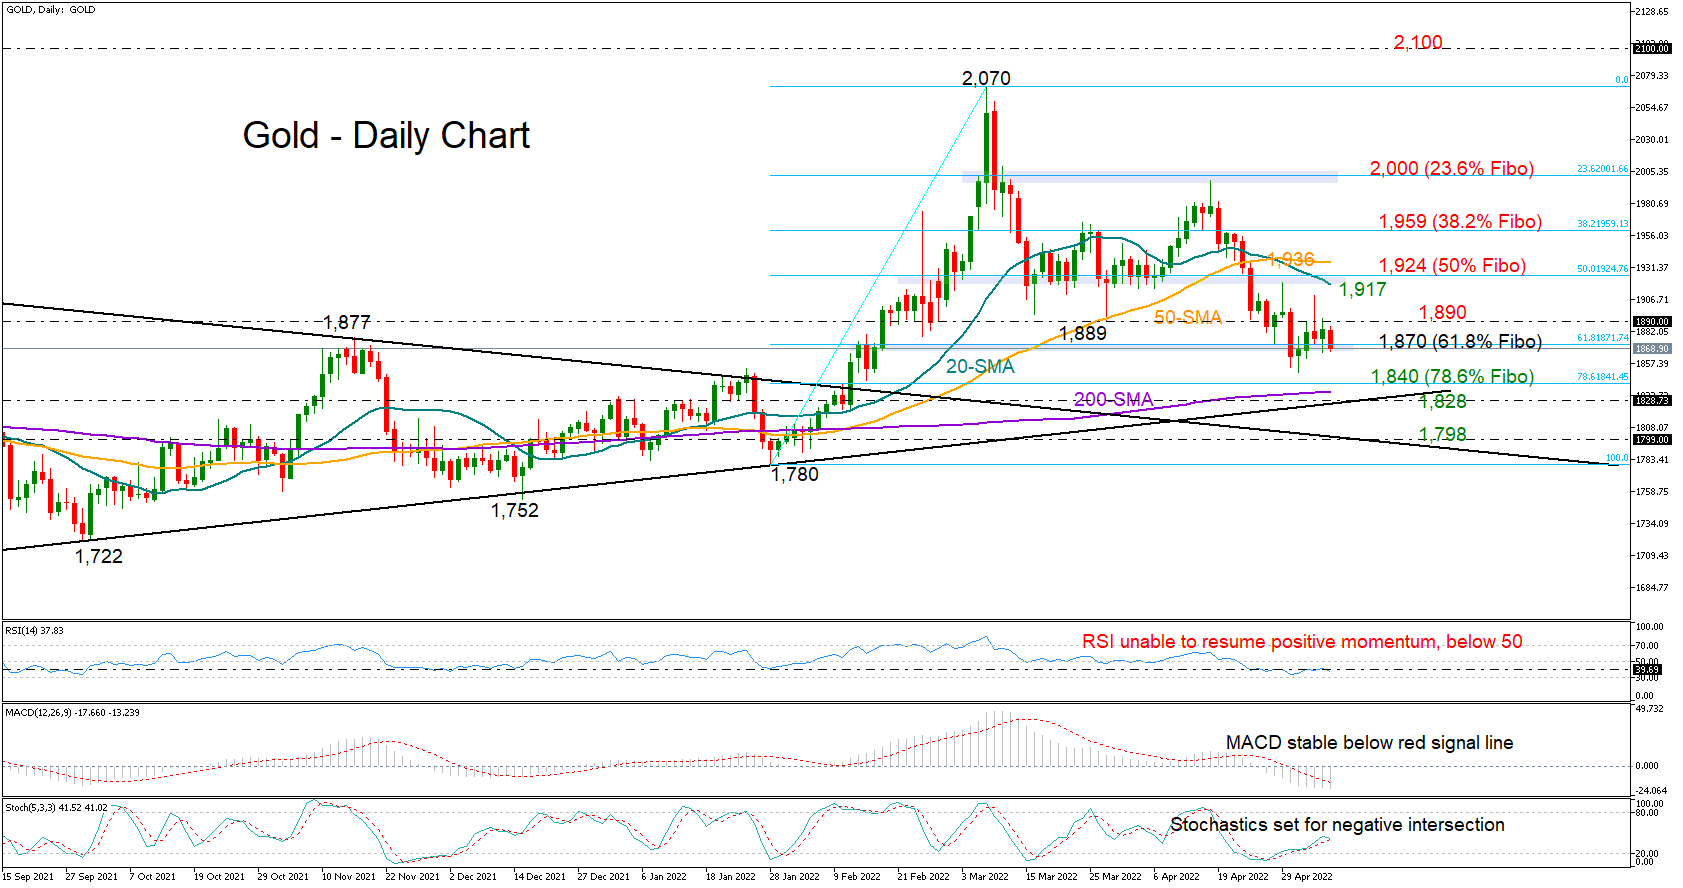
Gold started Monday’s session on the wrong foot of what it could turn into its fourth consecutive week of declines.
The 1,870 area is currently buffering selling tendencies, but the momentum indicators are still feeding scepticism. The RSI is struggling to exit the bearish area, while the MACD remains comfortably below its red signal line despite stabilizing lately. Discouragingly, the Stochastics are looking for a negative intersection following the bounce off the oversold region.
Adding to the dim signals is the bearish crossover between the 20- and 50-day simple moving averages (SMAs), which lends more credence to the downleg from 2,070.
In the event the price slides below 1,870, confirming a broad neutral outlook, it could initially seek shelter within the 1,840 – 1,825 zone, which encapsulates the 200-day SMA and the long-term supportive trendline from March 2020. This is also where the 78.6% Fibonacci retracement of the 1,780 – 2,070 upleg is placed. Failure to pivot here could see a sharp extension towards the broken resistance trendline drawn from the 2020 record high of 2,079. If that floor cracks as well, the bears will head for the 2022 low of 1,780.
The way higher is also looking rocky. The 1,890 ceiling is currently a primary concern. A successful close above that bar is expected to prompt additional bullish movements, bringing the 20-day SMA and the 50% Fibonacci of 1,924 next into scope. If buying appetite grows beyond the 50-day SMA too, the way would clear for the 38.2% Fibonacci of 1,959, though only a sustainable increase above 2,000 would breathe life back to gold’s 2022 paused uptrend.
In brief, gold’s short-term technical picture is still grim. A close below 1,870 would further endorse the bearish mode in the market, though only a significant decline below the long-term ascending trendline would violate the pandemic-led positive pattern in the market.
GER 40 Struggles for Support
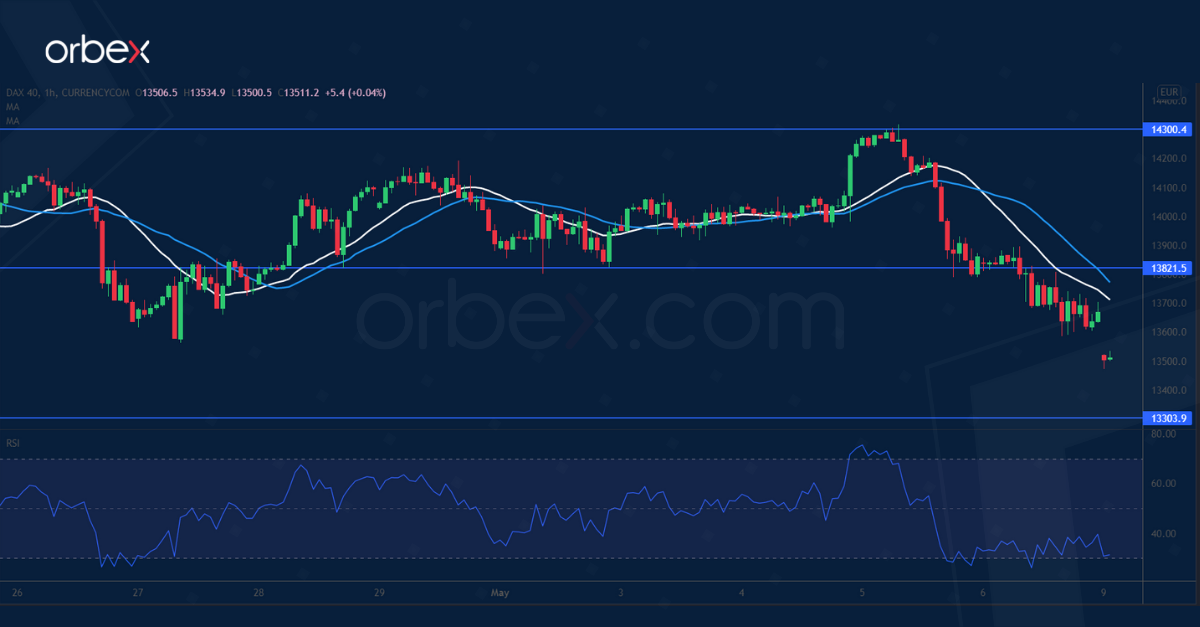
The Dax 40 tumbles as risk appetite subsides amid global policy tightening. The index has met stiff selling pressure at the origin of the late April sell-off at 14300. A drop below the psychological level of 14000 prompted buyers to bail out, invalidating the latest rebound in the process. A bearish MA cross is another sign that an imminent sell-off could be building up. A deeper correction below 13570 would send the price action to 13300. 13820 is a fresh resistance in case of a rebound.
USD/CAD Bounces Higher
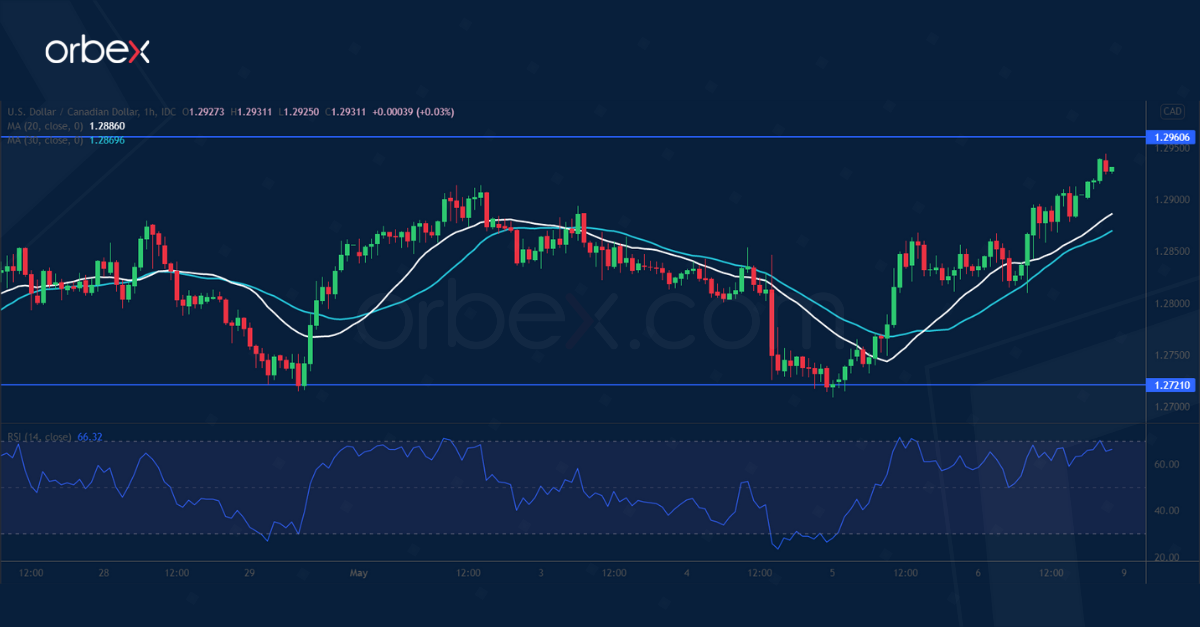
The Canadian dollar softens as April’s labour market performance fell short of expectations. A combination of a break above March’s high (1.2900) and a bullish MA cross on the daily chart confirms the market’s upbeat mood. The latest retracement found support in the major demand zone over 1.2720. A break above 1.2840 may have flushed remaining selling interests out. Last December’s high at 1.2960 is the last hurdle and its breach could open the door for an extended rally above 1.3100.
EUR/USD Consolidates
The US dollar climbed after better-than-expected NFP in April. The euro is licking its wounds after it broke March 2020’s lows near 1.0640. The price is seeking support above March 2017’s lows (1.0500). The previous rebound came to a halt at the support-turned-resistance at 1.0640. A bullish breakout could drive the bears into giving up their chips, reducing the pressure and potentially paving the way for a rally towards 1.0810. A fall below the current consolidation range (1.0480) would send the single currency to 1.0400.