Sample Category Title
Technical Analysis and Review
DXY:
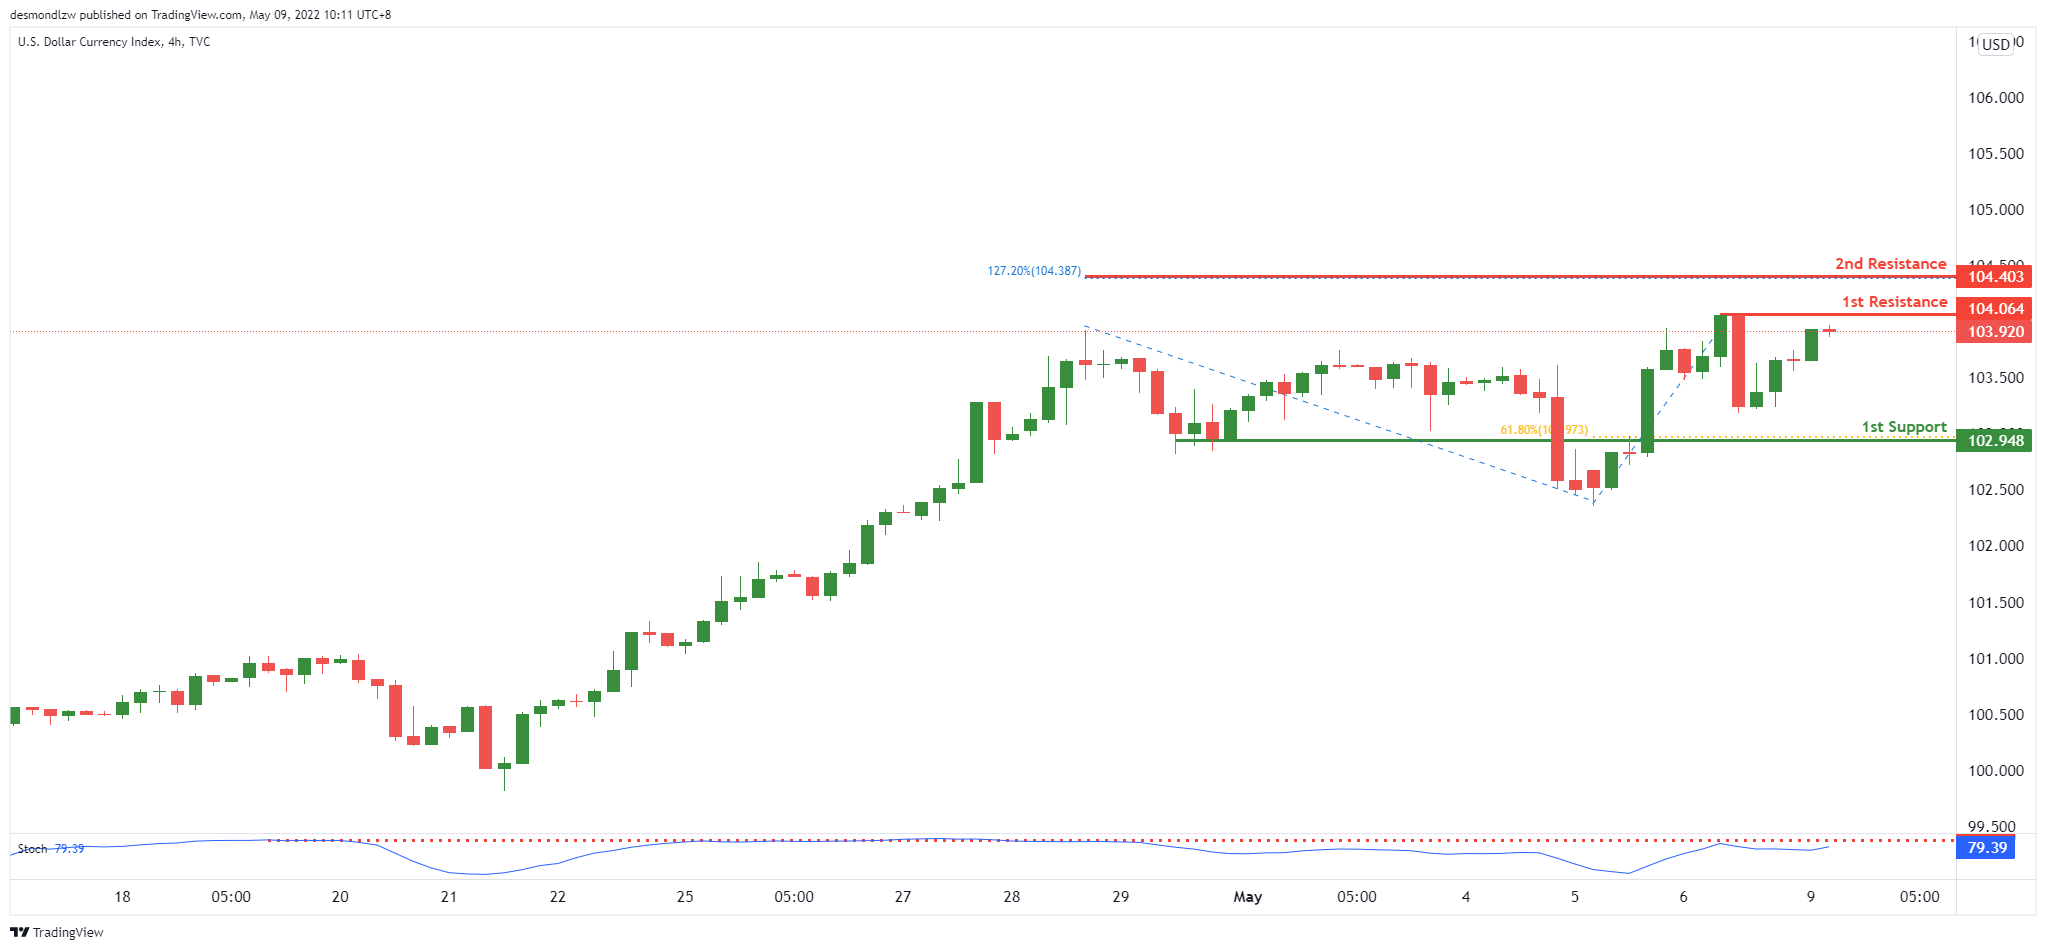
On the H4, with price expected to reverse off the stochastics indicator, we have a bearish bias that price will drop from our 1st resistance in line with the swing high resistance to our 1st support where the 61.8% Fibonacci retracement is. Alternatively, price may break 1st resistance structure and head for 2nd resistance where the 127.2% Fibonacci extension is.
Areas of consideration:
- H4 time frame, 1st resistance at 104.064
- H4 time frame, 1st support at 102.948
XAU/USD (GOLD):
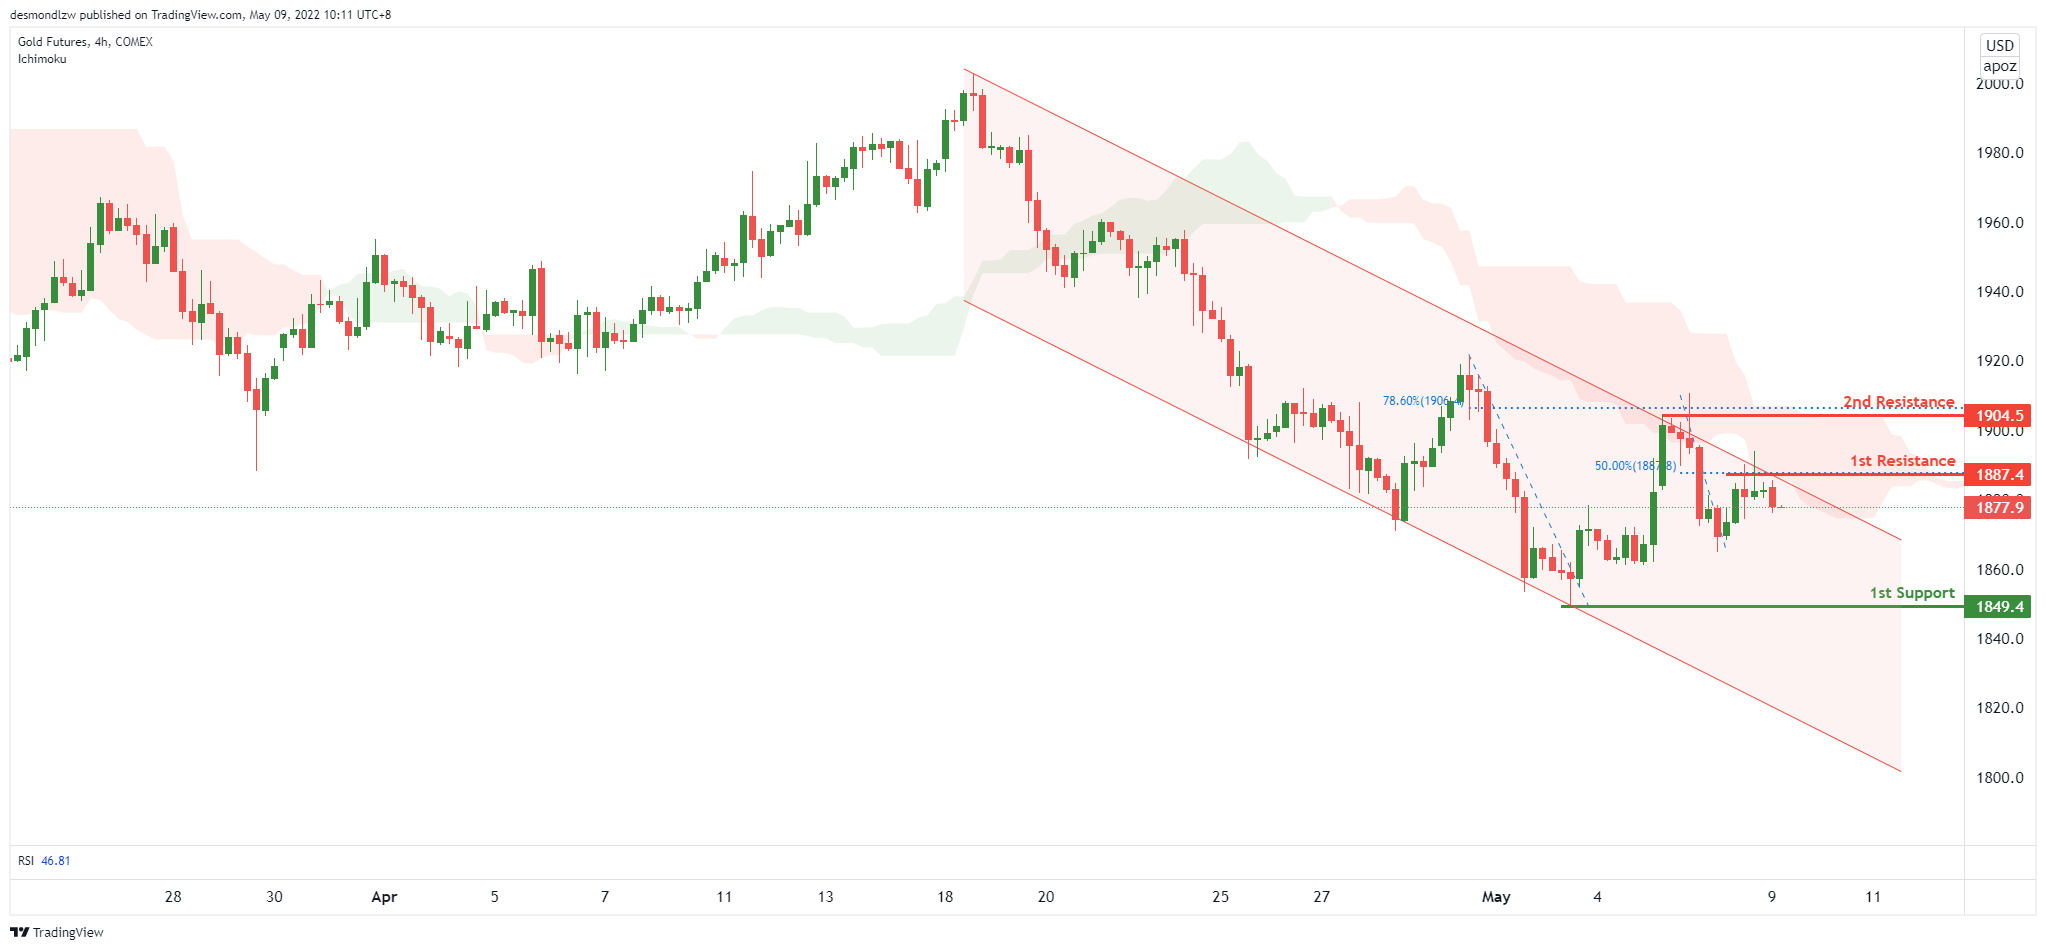
On the H4, with price moving below the ichimoku, we have a bearish bias that price will drop from our 1st resistance at 1887 where the 50% Fibonacci retracement and pullback resistance is to our 1st support at 1849 in line with the horizontal swing low support. Alternatively, price may break 1st resistance structure and head for 2nd resistance where the horizontal swing high resistance is.
Areas of consideration:
- H4 time frame, 1st Resistance at 1887
- H4 time frame, 1st Support at 1849
GBP/USD:
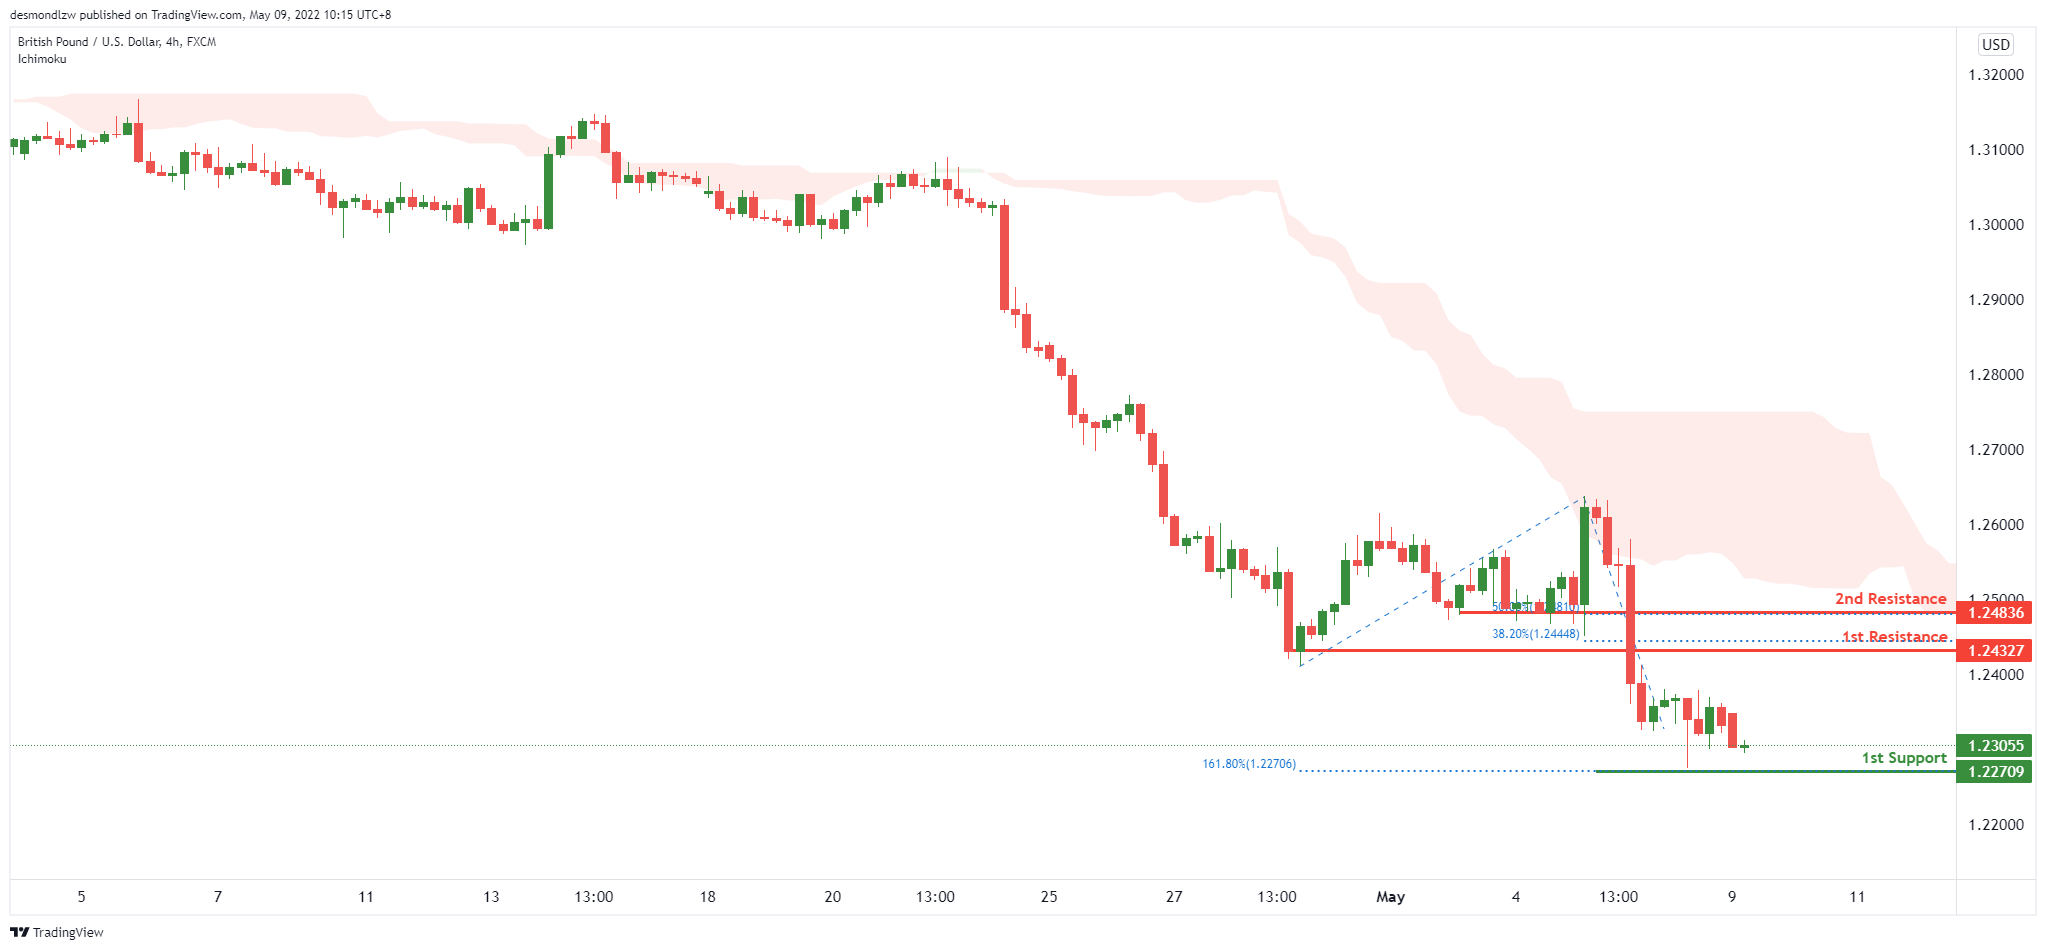
On the H4, with price moving below the ichimoku, we have a bearish bias that price will drop from our 1st resistance at 1.24327 where the 38.2% Fibonacci retracement and pullback resistance is to our 1st support at 1.22706 in line with the horizontal swing low support and 161.8% Fibonacci extension. Alternatively, price may break 1st resistance structure and head for 2nd resistance where the horizontal pullback resistance is.
Areas of consideration:
- H4 1st resistance at 1.24327
- H4 1st support at 1.22706
USD/CHF:
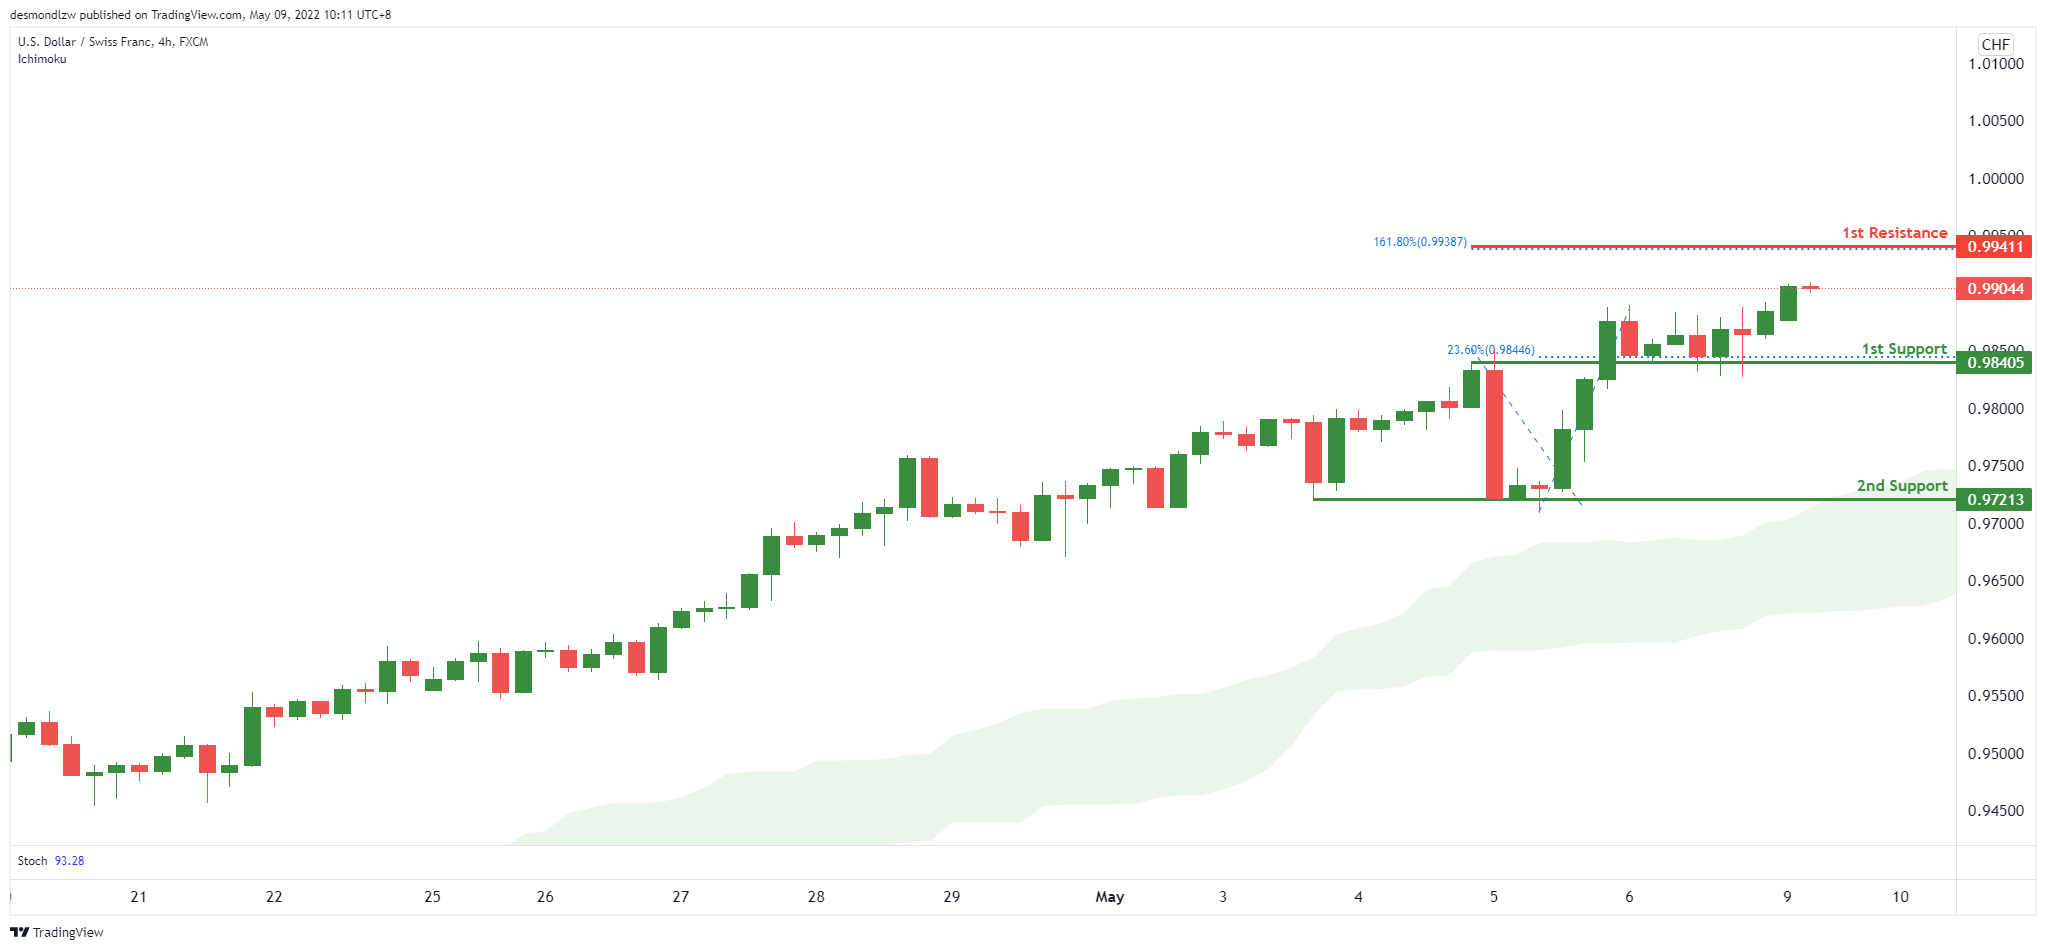
On the H4, with price moving above the ichimoku cloud, we have a bullish bias that price will rise to our 1st resistance at 0.99411 where the 161.8% Fibonacci extension is from our 1st support at 0.98405 in line with the horizontal pullback support. Alternatively, price may break 1st support structure and head for 2nd support.
Areas of consideration
- 1st support level at 0.98405
- 1st resistance level at 0.99411
EUR/USD :
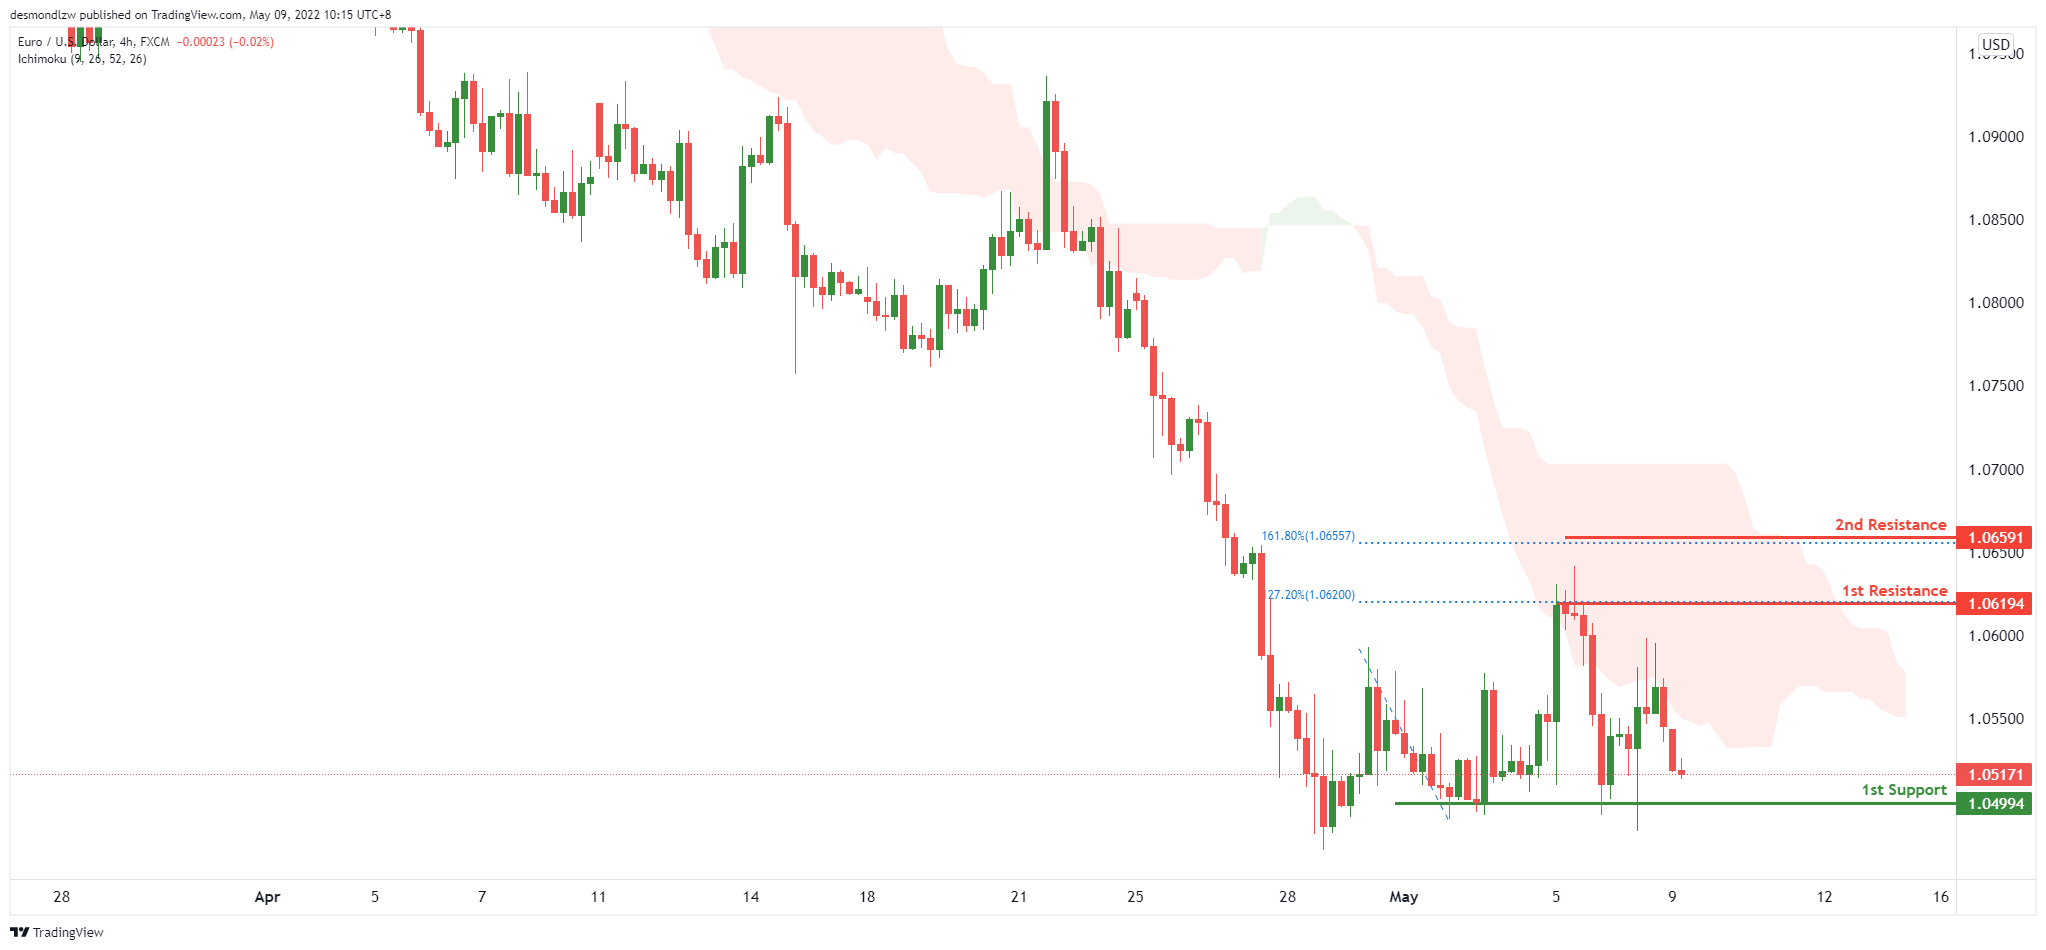
On the H4, with price moving below the ichimoku, we have a bearish bias that price will drop from our 1st resistance at 1.06194 to our 1st support at 1.04994 in line with the horizontal swing low support. Alternatively, price may break 1st resistance structure and head for 2nd resistance where the 161.8% Fibonacci extension is.
Areas of consideration :
- H4 1st resistance at 1.06194
- H4 1st support at 1.04994
USD/JPY:
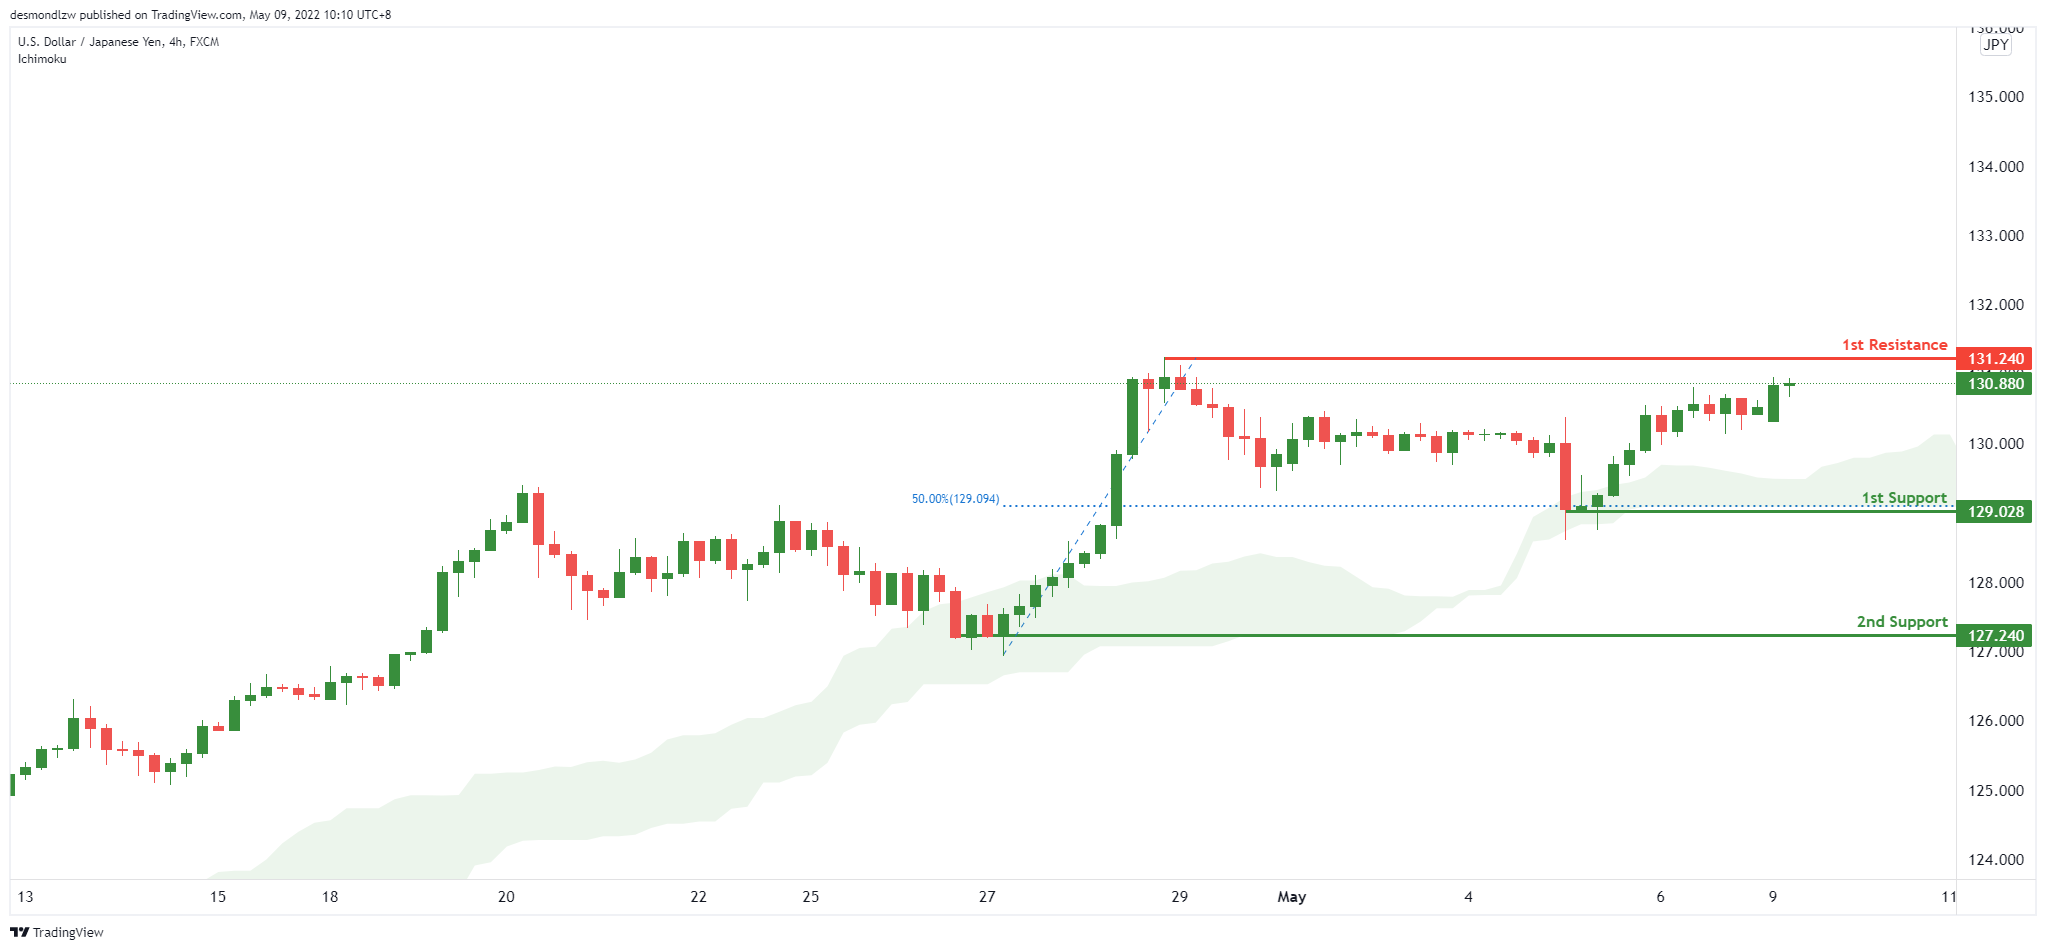
On the H4, with price moving above the ichimoku cloud, we have a bullish bias that price will rise to our 1st resistance at 131.240 where the swing high resistance is from our 1st support at 129.028 in line with the horizontal swing low support. Alternatively, price may break 1st support structure and head for 2nd support where the horizontal swing low support is.
Areas of consideration:
- H4 time frame, 1st resistance at 131.240
- H4 time frame, 1st support at 129.028
AUD/USD:
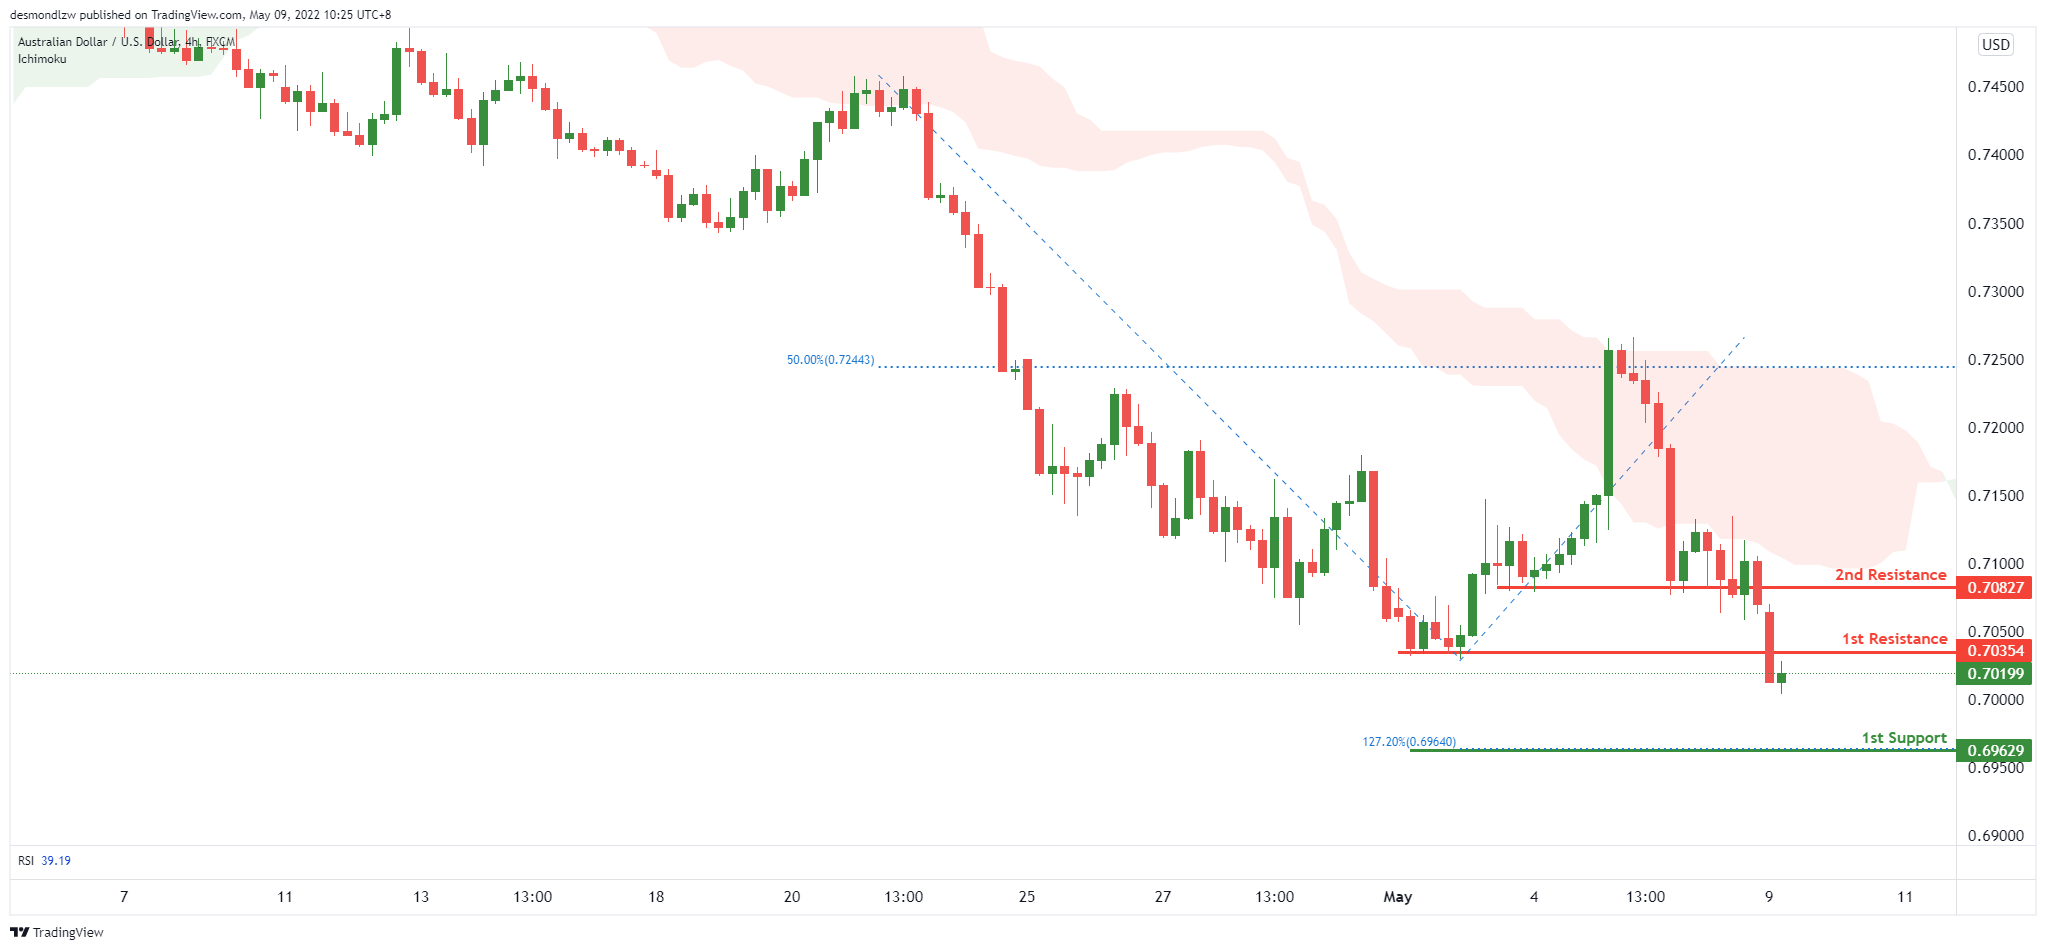
On the H4, with price moving below the ichimoku, we have a bearish bias that price will drop from our 1st resistance at 0.70354 where the pullback resistance is to our 1st support at 0.69629 in line with the horizontal swing low support. Alternatively, price may break 1st resistance structure and head for 2nd resistance where the horizontal pullback resistance is.
Areas of consideration
- H4 1st resistance at0.70354
- H4 1st support at 0.69629
NZD/USD:
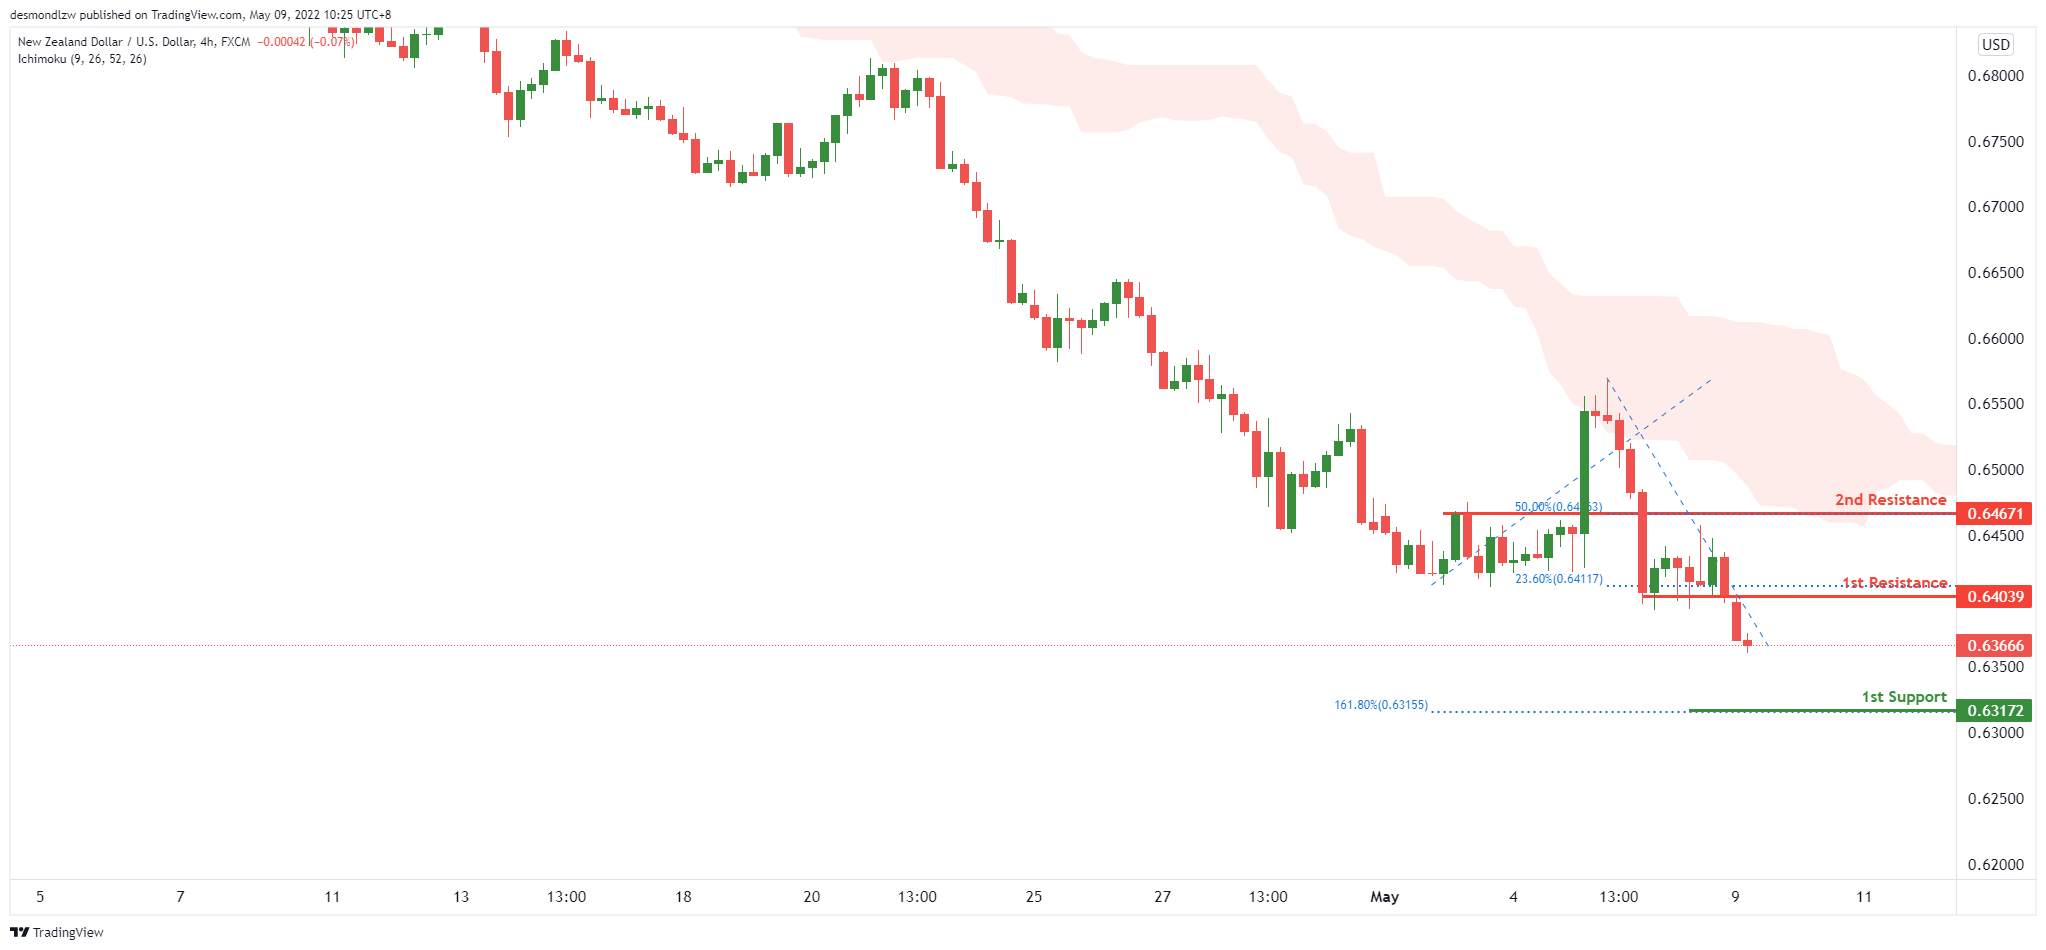
On the H4, with price moving below the ichimoku cloud, we have a bearish bias that price will drop from our 1st resistance at 0.64039 where the 23.6% Fibonacci retracement is to our 1st support at 0.63172 in line with the horizontal swing low support. Alternatively, price may break 1st resistance structure and head for 2nd resistance.
Areas of consideration:
- H4 time frame, 1st support at 0.63172
- H4 time frame, 1st resistance at 0.64039
USD/CAD:
On the H4, with price moving above the ichimoku cloud, we have a bullish bias that price will rise to our 1st resistance at 1.29076 where the swing high resistance is from our 1st support at 1.27197 in line with the horizontal swing low support. Alternatively, price may break 1st support structure and head for 2nd support where the horizontal swing low support is.
Areas of consideration:
- H4 time frame, 1st resistance at 1.29076
- H4 time frame, 1st support at 1.27197

OIL:
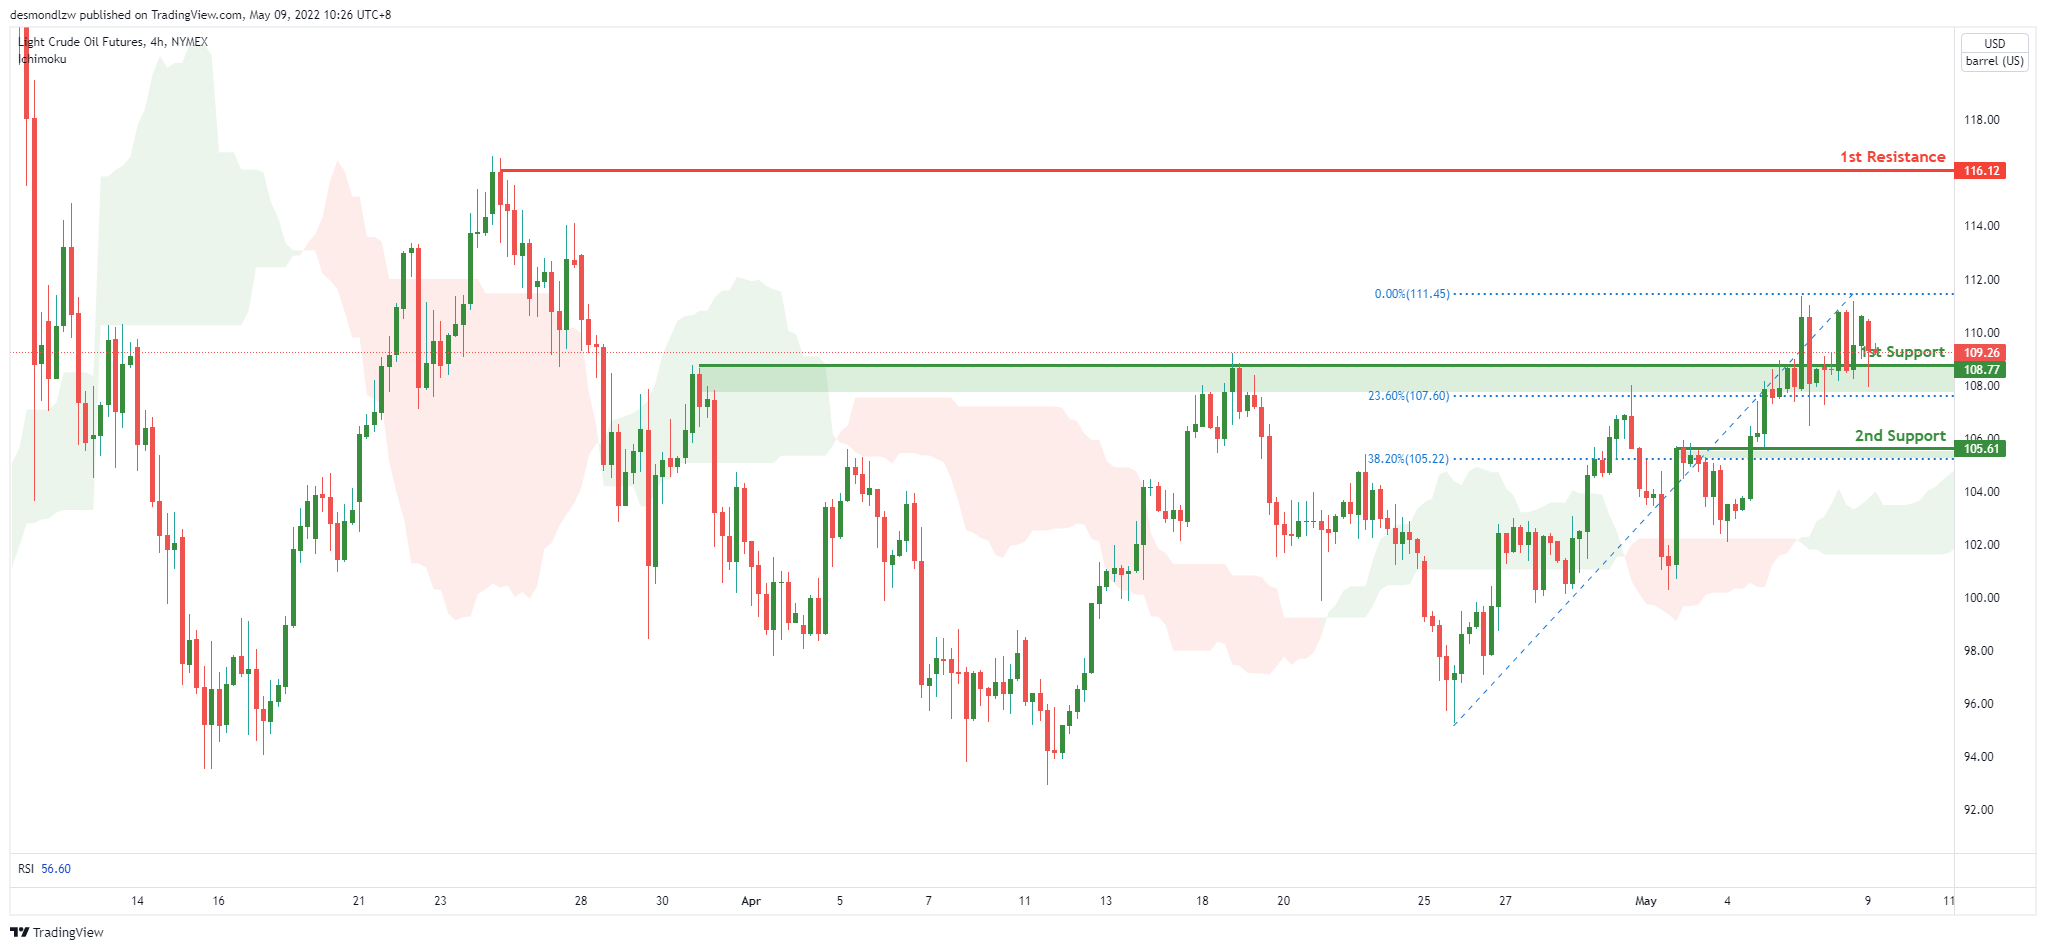
On the H4, with price moving above the ichimoku cloud, we have a bullish bias that price will rise to our 1st resistance at 116.71 where the 161.8% Fibonacci extension is from our 1st support at 108.77 in line with the horizontal pullback support. Alternatively, price may break 1st support structure and head for 2nd support where the horizontal pullback support is.
Areas of consideration:
- H4 time frame, 1st resistance of 116.71
- H4 time frame, 1st support of 108.77
Dow Jones Industrial Average:
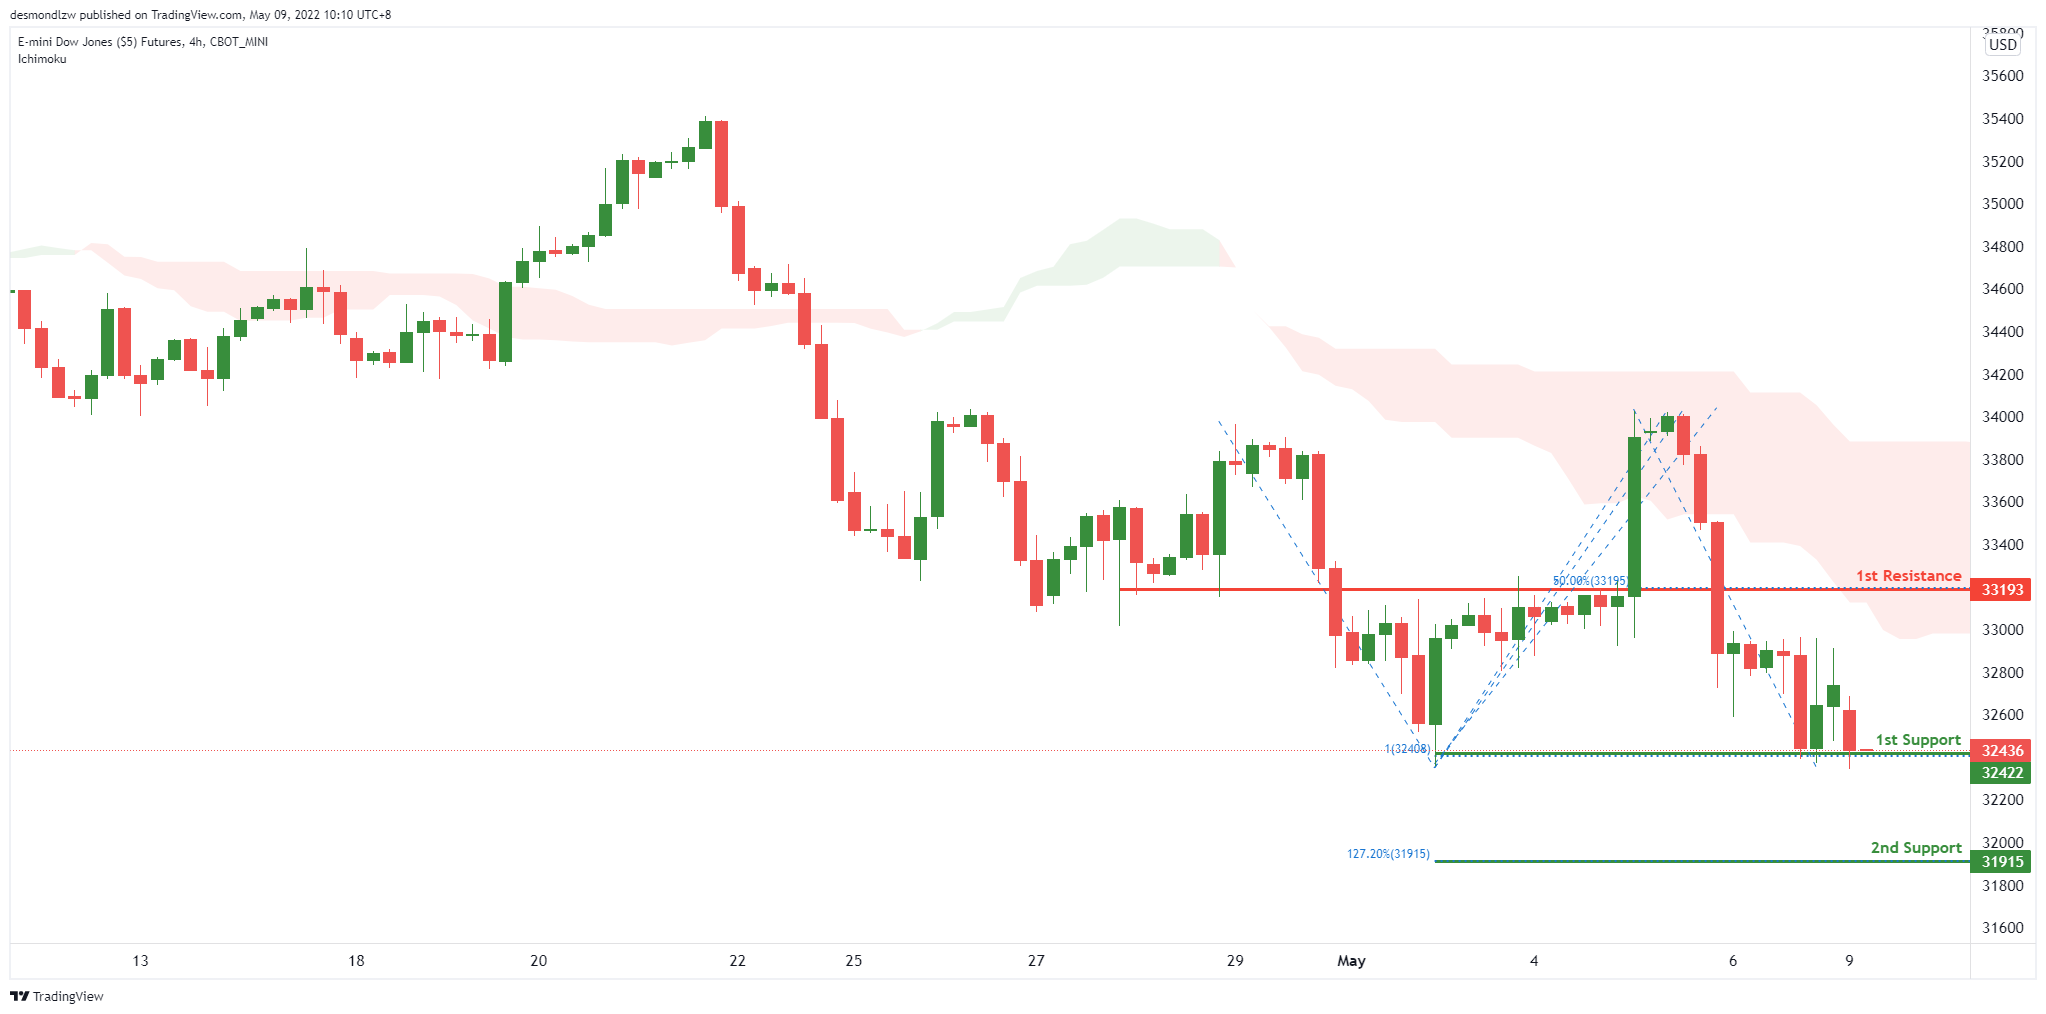
On the H4, with price expected to reverse off the ichimoku cloud, we have a bearish bias that price will drop from our 1st resistance at 33193 where the horizontal pullback resistance and 38.2% Fibonacci retracement is to our 1st support at 32422 in line with the pullback support. Alternatively, price may break 1st resistance structure and head for 2nd resistance where the horizontal pullback resistance.
Areas of consideration :
- H4 time frame, 1st resistance at 33193
- H4 time frame, 1st support at 3242
Forex and Cryptocurrencies Forecast
EUR/USD: A week of Many Multi-Year Records
Although some hotheads, such as James Bullard, the head of the Federal Reserve Bank of St. Louis, believed that the interest rate could be raised by 0.75% straight away, everything happened as the market expected. Following the May 4 meeting, the FOMC (Federal Open Market Committee) raised the federal funds rate by 0.5% to 1.0%. This increase was the largest since May 2000, as the US Central Bank has been changing the rate in steps of 0.25% for the last 22 years.
According to the US Federal Reserve, the key interest rate will continue to rise, as the labor market remains quite strong, and inflation is high, reaching its highest levels in 40 years. The regulator also decided to start a “quantitative tightening” from June 1. The pace of the Fed's balance sheet drawdown could rise from $35 billion in June to $65 billion in July, and then to a maximum of $95 billion per month starting in August.
At the same time, Fed Chairman Jerome Powell said in his comments that the Central Bank is not considering an active increase in interest rates by 0.75% at the upcoming meetings. These words eased concerns about the accelerated pace of monetary tightening, which pushed Treasury yields off their highs. The market felt that the Fed was not aggressive enough, and trading on US stock exchanges on Thursday, May 05 ended with a rise, pulling cryptocurrency quotes along with it.
However, the jubilation of risk asset advocates was short-lived. The very next day, on the morning of May 06, the DXY dollar index reached a multi-year high, rising above 104.00. The last time it climbed this high was 20 years ago.
A massive, wide-ranging sell-off began in the stock and treasury bond markets. Technology stocks were particularly hard hit. The S&P 500 fell 4% to its lowest level since May 2021, while the NASDAQ Composite lost over 5%. At the same time, 10-year Treasury yields rose to their highest level since 2018, rising above 3%.
Some experts called the event "a tug of war between the bond market, which wants more aggressive action by the Fed, and the stock market, which wants the Fed to act more moderately."
Despite the growth of the DXY Index, the EUR/USD pair behaved quite calmly. It has been moving in the side channel 1.0470-1.0640 since April 27, which periodically narrowed to 1.0500-1.0580. In addition to the expected results of the Fed meeting, which had already been included in the quotes, and Jerome Powell's comments, data from the US labor market, received on Friday, May 06, could have brought some revival. However, such an important indicator as the number of new jobs outside the US agricultural sector (NFP) remained unchanged at the level of the previous month, 428K. As a result, the pair hesitated a bit and ended the five-day period in the central zone of the named channel: at the level of 1.0540.
A former senior US Central Bank official suggested earlier that the federal funds cost rate could eventually reach 5.0% after a series of increases. If the market decides it will, the dollar's bullish rally will continue and it could reach 1:1 parity with the euro. In the meantime, analysts' voices are divided as follows: 75% are sure that the dollar will continue to strengthen, while only 25% have the opposite opinion. 90% of trend indicators and 85% of oscillators on D1 which are colored red side with the dollar, respectively, 10% and 15% are colored green. Immediate support is at 1.0500, followed by the April 28 low at 1.0470, the next bearish target for EUR/USD could be the 2016 low of 1.0325. The nearest resistance zone is 1.0570-1.0600, then there are zones 1.0750-1.0800, 1.0830-1.0860, 1.0900-1.0935 and 1.1000.
There will be few significant economic events next week. The calendar could mark Wednesday May 11 and Friday May 13 when the data for the German and US consumer markets come in. Also, changes in the number of applications for unemployment benefits in the United States will become known at the very end of the working week. And we should not forget about the active hostilities that are taking place in Ukraine, in the immediate vicinity of the EU borders, and the “surprises” that the Kremlin may present in response to sanctions imposed on by the European Union.
GBP/USD: Score 1.0-1.0 What's Next?
It was not only the Fed, but also the Bank of England that set a record last week. It raised the interest rate by 25 basis points to 1.0% at its meeting on Thursday, May 04, which is the highest level since 2009. Moreover, 3 out of 9 MPC (Monetary Policy Committee) members of the Bank voted for raising the rate to 1.25% straight away. The number of votes against the rate hike is 0. In addition, it became known that the regulator of the United Kingdom is working on a plan to sell government bonds purchased after the crisis, which currently stand at just under £850 billion.
The Bank of England also sharply raised its inflation forecast for 2022, from 5.75% to 10.25%. (Recall that in March, inflation peaked since 1992 and amounted to 7% (y/y) with a target level of 2%). The main reason is the rise in fuel and transport prices. In April alone, fuel bills in the UK skyrocketed by 54%, and this is not the limit. In addition to the consequences of Brexit and the COVID-19 pandemic, the situation is aggravated by sanctions against Russia due to its invasion of Ukraine, and new coronavirus lockdowns in China. Inflation forecast for 2023 was also changed for the worse: from 2.5% to 3.5%.
Economic forecasts did not please investors either. And although the Bank of England left its forecast for GDP growth for the current year (+3.75%) unchanged, a recession is expected starting from the Q4. British Central Bank expects GDP contraction by 0.25% In 2023 instead of the previously planned growth of 1.25%. According to the new forecast, GDP will grow not by 1.0%, but by only 0.25% in 2024.
The interest rates of the US Federal Reserve and the Bank of England have reached the same level of 1.0% at the moment. However, if the dollar rate may reach 3.0-3.5% at the beginning of next year, or even higher, the British regulator suggests an increase in the pound rate to 2.5% by mid-2023. and its decline to 2.0% by the end of the forecast 3-year period. Such a difference in the pace of monetary tightening is likely to continue to put pressure on the British pound. However, the Fed should also update its inflation forecasts in June, and things could change.
In the meantime, the GBP/USD pair continued to fall, returning to June 2020 levels and reaching a local bottom at 1.2275. As for the final chord, it sounded at the height of 1.2340;
55% vote for further weakening of the British currency, 30% expect the pair to correct to the north and 15% - to move to the east. As for the indicators on D1, there is still a total advantage of the red ones: 100% both among the trend indicators and among the oscillators look down, although 10% of the latter are in the oversold zone. The nearest targets of the bears are to overcome the support at 1.2250, then at 1.2075, a strong point of support for the pair is at the psychologically important level of 1.2000. As for the bulls, if they manage to seize the initiative, they will face resistance in the zones of 1.2400, 1.2470-1.2570, 1.2600-1.2635, 1.2700-1.2750, 1.2800-1.2835 and 1.2975-1.3000.
Among the statistics related to the economy of the United Kingdom, the most interesting are the data on the country's GDP, which will be released on Thursday May 12.
USD/JPY: Bulls' Target Is 135.00
The correlation between 10-year US Treasury bills and the USD/JPY currency pair has not been canceled. If the yield of these securities grows, the dollar rises against the Japanese yen. We have seen confirmation of this in the past week. The pair reached a high of 130.80 on May 06 and is now aiming for a new 20-year high of 1.3125. Strategists of the international financial group Nordea expect that it may reach 135.00 by the end of the year. The strengthening of the yen and the fall of the pair, in their opinion, can only be expected in the second half of 2023.
Japanese consumer prices excluding fresh food, a key indicator monitored by the Bank of Japan, rose 2.1% in April, surpassing the 2.0% target for the first time in many years. And if the yen breaks through the level of 140 per $1, inflation in Japan may reach 3.0%, according to BNP Paribas experts. However, the head of the Bank of Japan, Haruhiko Kuroda, has repeatedly stated that the Japanese regulator, despite the dissatisfaction of the population with rising prices, will remain faithful to the soft monetary policy.
If the Central Bank does decide to tighten it, this will make it difficult for the country to stabilize and reduce the ratio of public debt to GDP, according to Fitch Ratings. According to Fitch Ratings, this ratio reached 248% in fiscal year 2021, which is the highest among all investment-grade states and is the main credit weakness Japan. (For comparison, Italy, which is in second place, has a figure of about 150%).
The report on the latest meeting of the Monetary Policy Committee of the Japanese regulator will be published next week, more precisely on Monday May 09. However, it is unlikely to affect the balance of power between the dollar and the yen. The scenario in which the USD/JPY pair will continue its movement to the north is supported by 65% of experts, 35% are waiting for movement to the south. 100% of trend indicators and oscillators on D1are looking north, but 15% oscillators signal that the pair is overbought. The nearest support is located at 129.70-130.15, followed by zones and levels 128.60-129.30, 127.80-128.00, 127.00, zone 126.30-126.75 and levels 126.00 and 125.00. The bulls' target is to renew the April 28 high at 131.25. An attempt to designate the subsequent targets of the bulls will rather be like fortune telling. The only thing that can be assumed is that they will set the January 01, 2002 high of 135.19 as their goal. If the pair's growth rate is maintained, it can reach this height as early as in June.
CRYPTOCURRENCIES: It All Depends on the Fed
A recently published report by the analytical company DappRadar demonstrates the growth of crypto activity in the US, Russia and Ukraine. And if the increase in demand for digital assets is due to sanctions and a humanitarian catastrophe in the last two states, respectively, the global acceptance of virtual money in the United States is the result of an increase in the number of traders and crypto companies. At the same time, DappRadar analysts note that the popularity of cryptocurrencies has increased not only in the above countries, it has happened all over the world. For example, against the background of the threat of global inflation, the demand for virtual money in Brazil and India has increased by 40% and 45%, respectively. According to some experts, the number of cryptocurrency users will increase 5 times over the next 10-20 years and reach more than 1 billion people.
The specialists note that it is the activity of small investors who continue to believe in the future rise of bitcoin that saves it from a deep drawdown at the moment. Thus, the owners of wallets from 0.1 BTC to 10 BTC doubled their positions in April alone, bringing the total stock to 2.5 million BTC.
As for institutional investors (with investments of more than $1 million), the dynamics here are the opposite and it is primarily due to the actions of the US Federal Reserve. The Central bank has printed more than a third of the new dollars since spring 2020, and its balance sheet has doubled to $9 trillion. While the Fed flooded the market with cheap money, a huge amount of it was invested by investors in risky assets, supporting the stock and cryptocurrency markets. the time has come now to tighten monetary policy, which could not but affect these assets. As a result, the net outflow of investments from crypto funds has reached an all-time high of 14,327 BTC. Moreover, American investors are most active in getting rid of bitcoins, having reduced the volume of investments by 11% in a month. (And this despite the fact that the number of traders and crypto companies in the US is growing).
At the time of writing this review, Friday evening, May 06, the total crypto market capitalization is at $1.657 trillion ($1.752 trillion a week ago). The Crypto Fear & Greed Index has slightly worsened its readings: it dropped by 1 point, from 23 to 22 points, gaining a foothold in the Extreme Fear zone. The BTC/USD pair is trading around $36.100, the week low was fixed at $35.280.
A further rise in interest rates, along with unloading the Fed's balance sheet, the growth of the DXY dollar index and the yield of treasuries, continue to put pressure on the quotes of risky assets. If about 50% of all BTC coins in circulation were profitable for their owners in the middle of the week, this figure will become smaller as quotes continue to fall. So, only 40% of the coins will remain profitable at the level of $33,000, which can cause an avalanche increase in panic.
Trader and Factor LLC CEO Peter Brandt predicts that bitcoin will test the $28,000 level. The expert drew attention to the pattern that the price of the first cryptocurrency has formed since the beginning of the year, and the breakdown of its lower border. “The completion of a bearish channel usually results in a decline equal to its width. In this case, in a hard test of $32,000 or so, but I think $28,000,” Brandt commented.
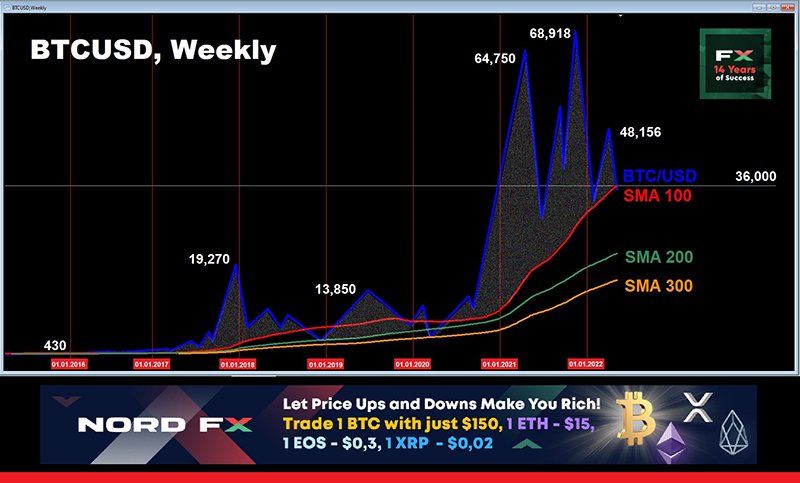
Another reputable cryptocurrency trader, Benjamin Cowen, also believes that there should be a major capitulation of bitcoin before a bullish reversal begins. According to him, it will spur another round of a bullish rally. Drawing a possible downside scenario, Cowen noted the three most important long-term moving averages that keep BTC at the level of support for a multi-year growth trajectory: 300-, 200- and 100-week SMA. A drop below the 100-week SMA has historically been a great opportunity for bulls: “The 100-week SMA is around $36,000 now, and there is an optimal time to buy BTC every time it goes below it,” Cowen said. But if the fall gains strength, the BTC rate, in his opinion, may collapse even more and test the level of the 200-week moving average, $21,600. “Many people do not believe that this can happen,” the trader says, “but it is possible. I used to buy BTC at $6,000 and then the rate fell to $3,000. Then I bought BTC at $7,000 and $10,000 and the rate fell again to $3,800. So this has happened before and can happen now.”
Bitcoin’s 300-week moving average was briefly touched only once during the COVID-19-driven market crash in March 2020, and Cowen doesn’t expect a repeat of the same.
Arthur Hayes, former CEO and co-founder of BitMEX, predicted in April that bitcoin would fall to $30,000 at the end of the first half of the year. He attributed this to a possible decline in the Nasdaq index, with which digital gold is highly correlated. Analysts at Arcane Research confirmed that this statistical relationship is at its highest since July 2020.
However, fintech experts who took part in the Finder survey expect quotes of the leading cryptocurrency to be above $65,000 at the end of the year with subsequent growth. Hayes himself does not doubt the prospects of bitcoin, predicting a rise in the price of the coin to $1 million by the end of the decade.
Unlike Arthur Hayes and Benjamin Cowen, analyst Michael van de Poppe thinks the network data hints at a possible bullish reversal in bitcoin. According to him, “BTC hash rate has reached another all-time high, although there is a tightening in the cryptocurrency space. Thus, the demand for BTC mining is growing, the network is becoming safer, and the asset price should respond to this.”
According to van de Poppe, a serious impulsive wave can be expected due to a possible correction in the US dollar index (DXY). “In my opinion, a serious move up is quite possible, especially if the US dollar shows weakness,” the analyst said. “In the event that the Fed abandons a strong tightening of monetary policy, the dollar will weaken, and this will become the impetus for the upward movement of bitcoin.”
Mike McGlone, Senior Analyst at Bloomberg Intelligence, has similar hopes. He hopes that a sharp fall in the stock market will force the US Federal Reserve to change its position on tightening monetary policy, which will provoke bullish runs in high-risk assets. “The Fed will continue its policy until the stock market drops enough to force the regulator to pause. That's when I think we'll see the rise of bitcoin, ethereum and maybe Solana."
“If you want a good downside indicator for bitcoin and altcoins, these are Fed Funds futures. This is what the market expects from the Fed in a year. They are valued at 3% right now, maybe more, and the actual rate is 1%. As soon as this forward expectation starts to decrease, I think that bitcoin will hit the bottom,” the analyst said.
EUR/USD Weekly Outlook
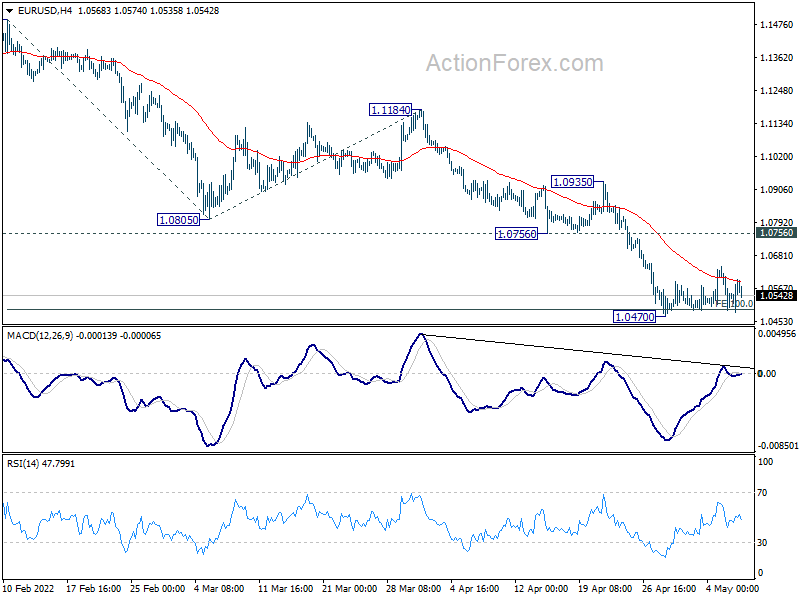
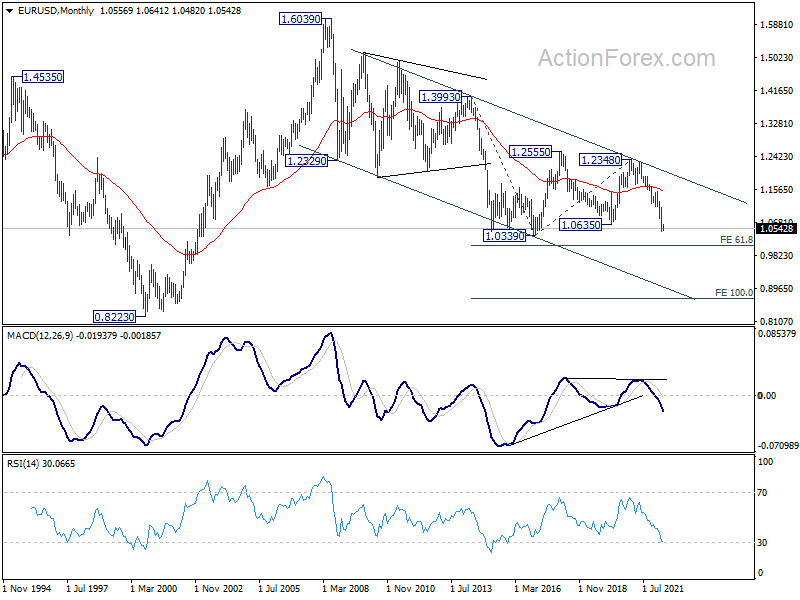
EUR/USD stayed in consolidation above 1.0470 last week and outlook is unchanged. Initial bias remains neutral this week first. In case of another recovery, upside should be limited by 1.0756 support turned resistance to bring fall resumption. On the downside, firm break of 1.0470 will resume larger down trend to 161.8% projection of 1.1494 to 1.0805 from 1.1184 at 1.0069.
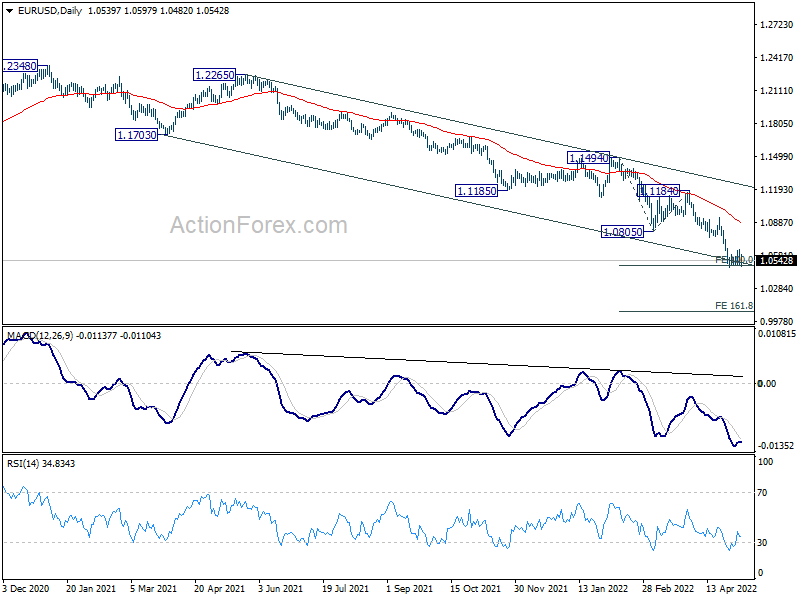
In the bigger picture, the decline from 1.2348 (2021 high) is expected to continue as long as 1.1185 support turned resistance holds. The break of 1.0635 (2020 low) now raises the chance that it's resuming long term down trend from 1.6039 (2008 high). Retest of 1.0339 (2017 low) low should be seen next. Decisive break there will confirm this bearish case.
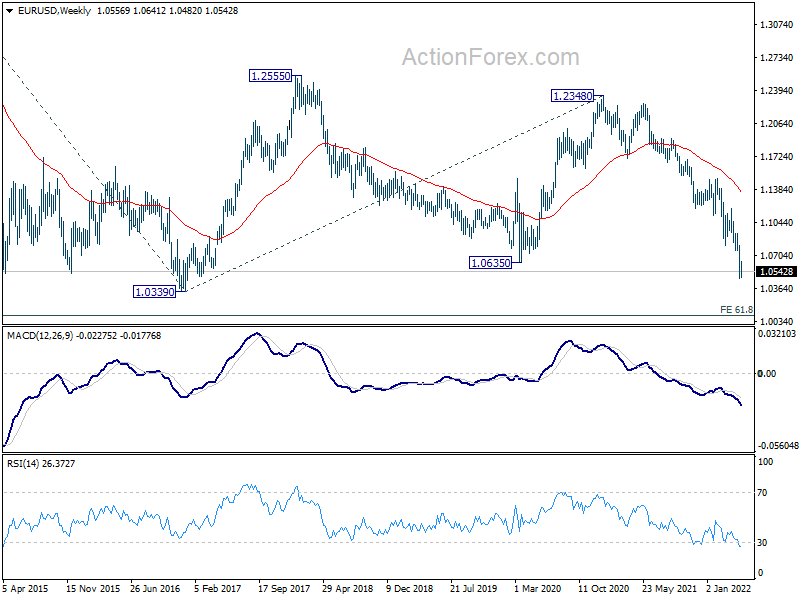
In the long term picture, current development suggests that long term down trend from 1.6039 (2008 high) is ready to resume. Break of 1.0339 will target 61.8% projection of 1.3993 to 1.0339 from 1.2348 at 1.0090. Decisive break there could bring downside acceleration towards 100% projection at 0.8694.
USD/JPY Weekly Outlook
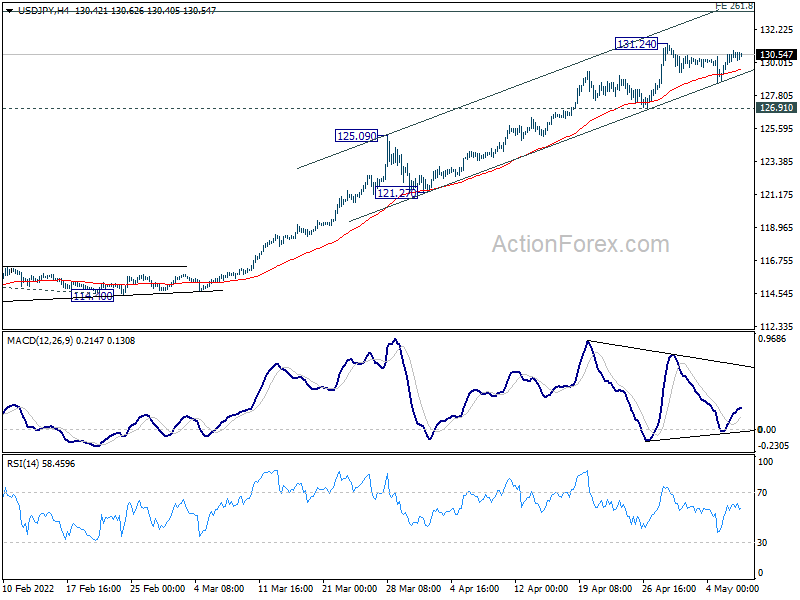
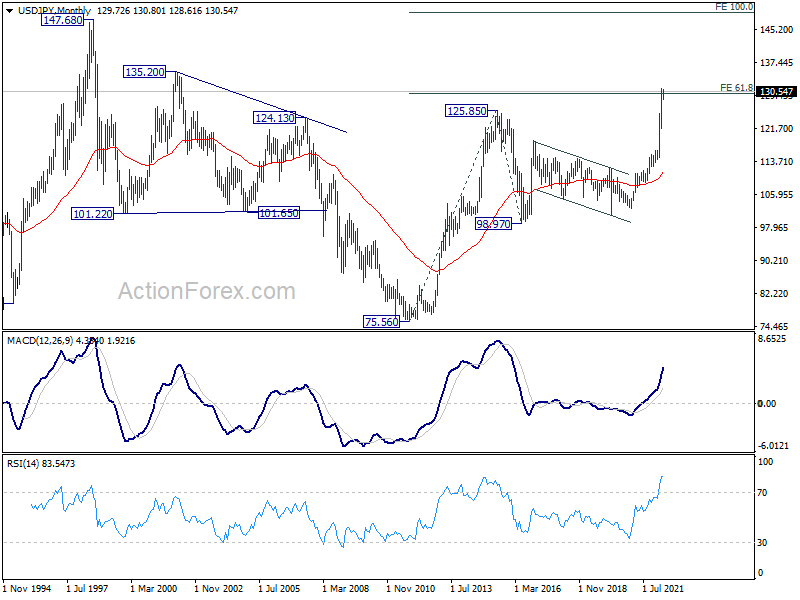
USD/JPY stayed in consolidation from 131.24 last week and outlook is unchanged. Initial bias stays neutral this week first and outlook remains bullish with 126.91 support intact. On the upside, break of 131.24 will resume recent up trend to 261.8% projection of 109.11 to 116.34 from 114.40 at 133.26.
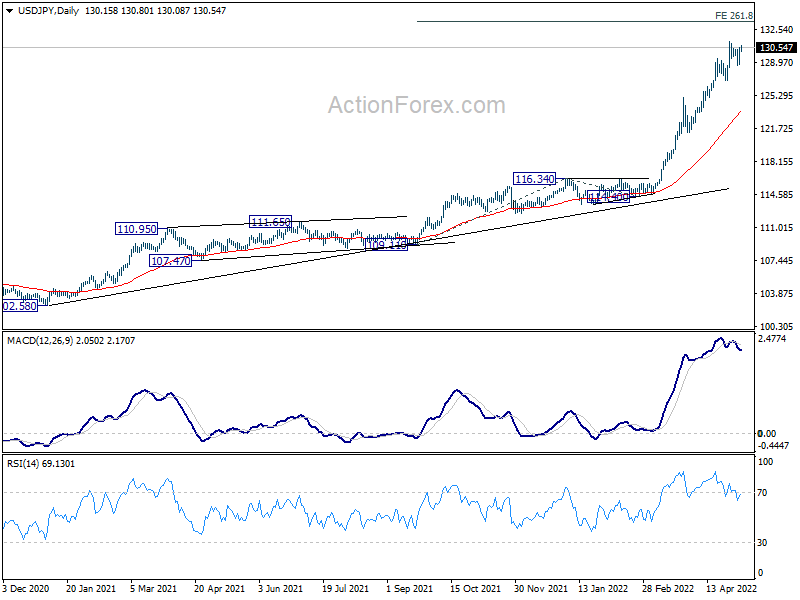
In the bigger picture, current rally is seen as part of the long term up trend form 75.56 (2011 low). Sustained trading above 61.8% projection of 75.56 (2011 low) to 125.85 (2015 high) from 98.97 at 130.04 will pave the way to 100% projection at 149.26, which is close to 147.68 (1998 high). For now, this will remain the favored case as long as 121.27 support holds.
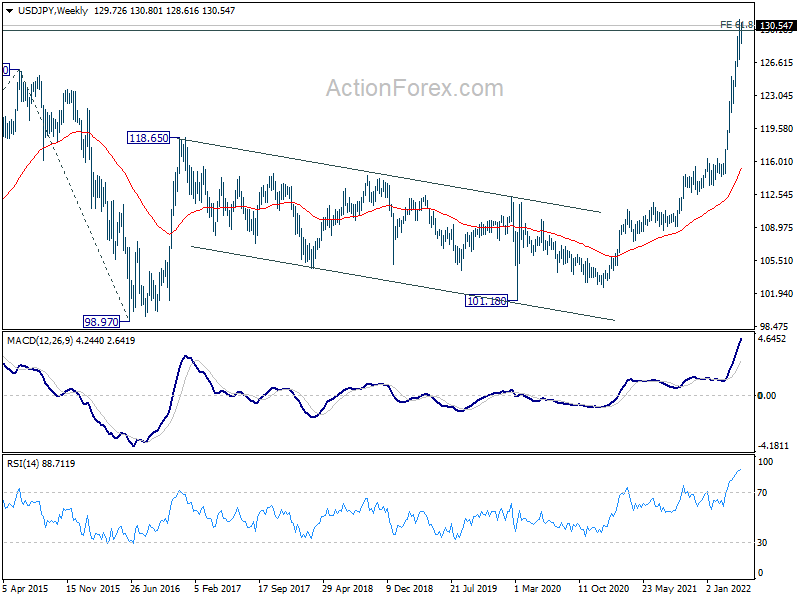
In the long term picture, the up trend from 75.56 (2011 low) long term bottom to 125.85 (2015 high) has just resumed. First target at 61.8% projection of 75.56 to 125.85 from 98.97 at 130.04 was already met. Next is 100% projection at 149.26, which is close to 147.68 (1998 high).
GBP/USD Weekly Outlook
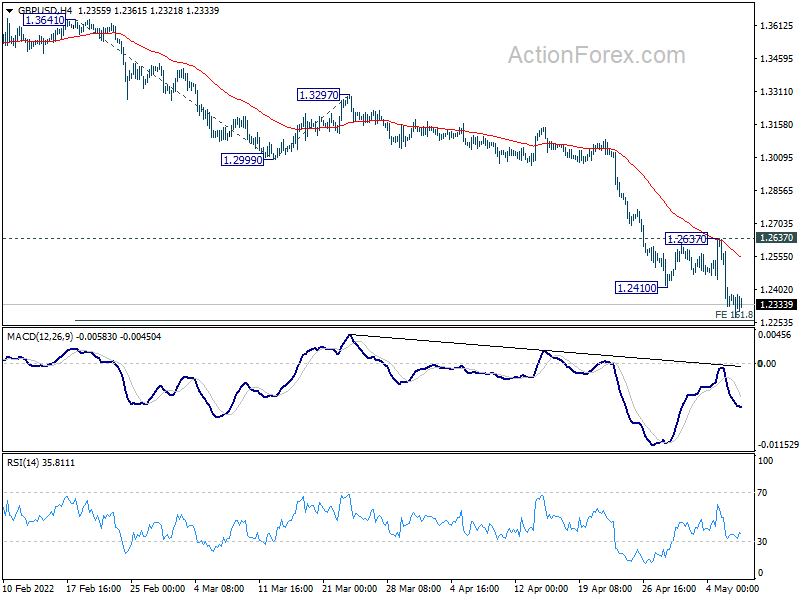
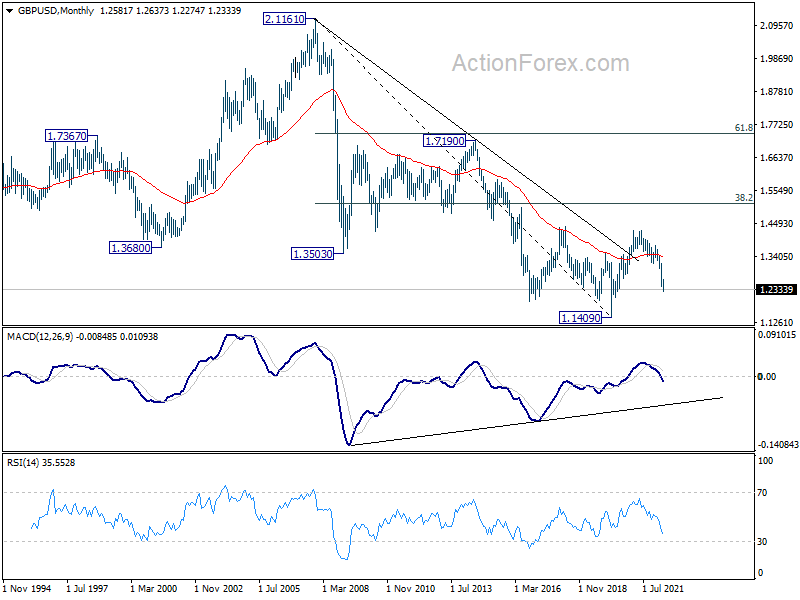
GBP/USD's down trend resumed last week and hit as low as 1.2274. Initial bias stays on the downside and firm break of 161.8% projection of 1.3641 to 1.2999 from 1.3297 at 1.2258 will target 200% projection at 1.2013 next. On the upside, break of 1.2637 resistance is needed to indicate short term bottoming. Otherwise, outlook will remain bearish in case of recovery.
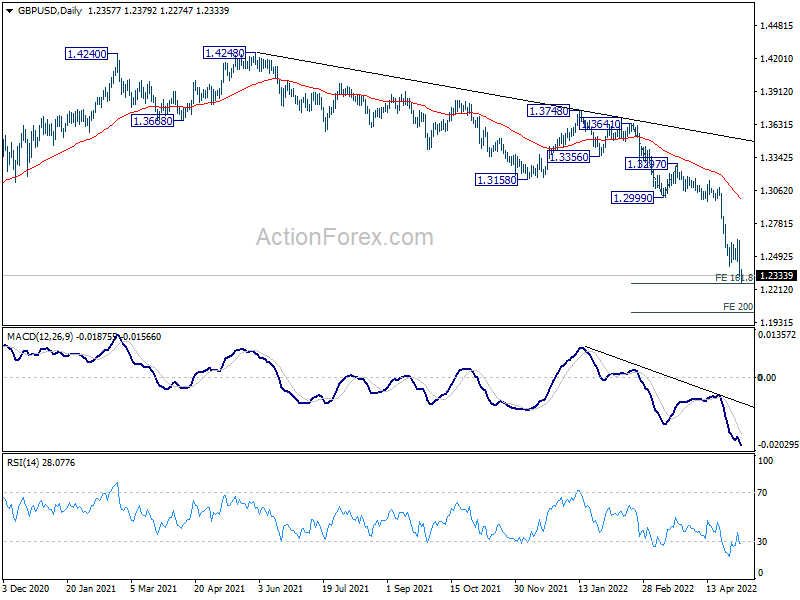
In the bigger picture, based on current momentum, fall from 1.4248 (2018 high) at least at the same degree as the rise form 1.1409 (2020 low). That is, fall from 1.4248 could be a leg inside the pattern from 1.1409, or resuming the longer term down trend. In either case, deeper decline is expected as long as 1.2999 support turned resistance holds. Next target is 1.1409 low.
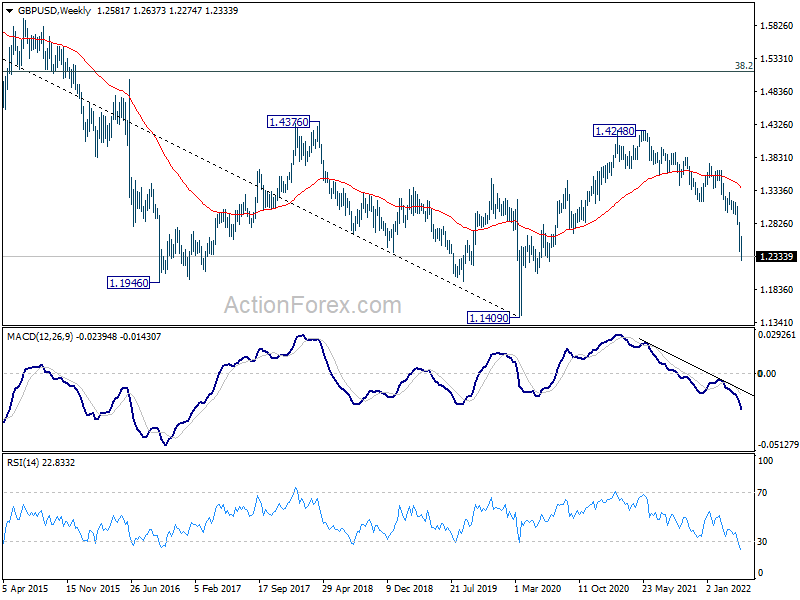
In the longer term picture, rebound from 1.1409 long term bottom should have completed at 1.4248 already, well ahead of 38.2% retracement of 2.1161 to 1.1409 at 1.5134. The development argues that price actions from 1.1409 are developing into a corrective pattern only. That is, long term bearishness is retained for resuming the downside from 2.1161 (2007 high) at a later stage.
USD/CHF Weekly Outlook
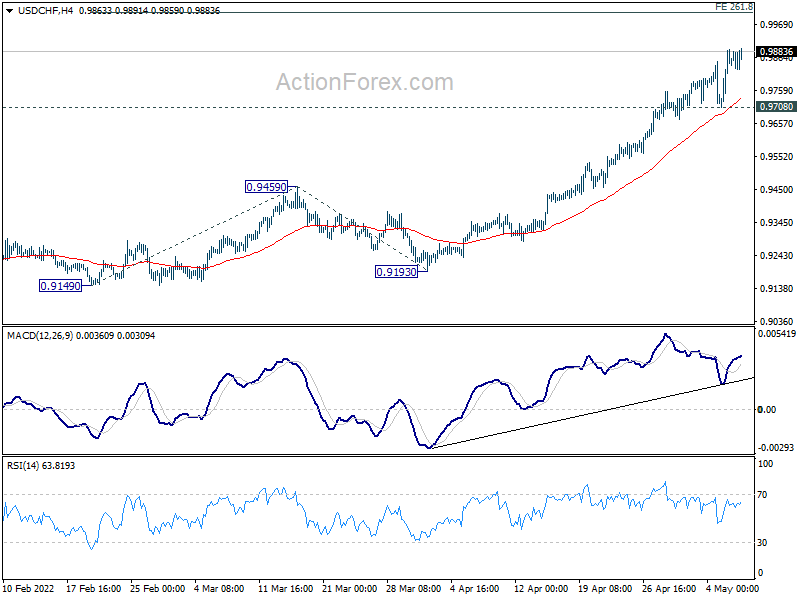
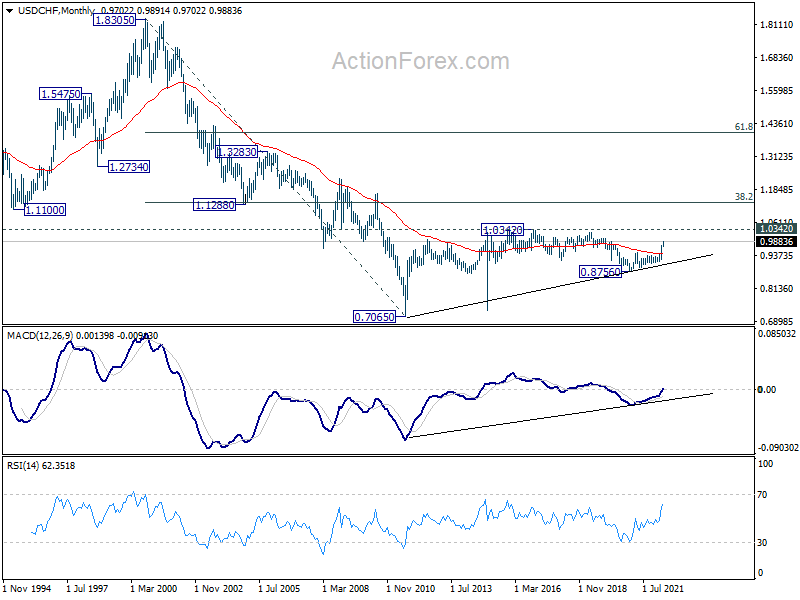
USD/CHF's up trend resumed last week and hit as high as 0.9891. Initial bias stays on the upside this week for next near term target at 261.8% projection of 0.9149 to 0.9459 from 0.9193 at 1.0005 next. On the downside, break of 0.9708 support is needed to indicate short term topping. Otherwise, outlook will stay bullish in case of retreat.
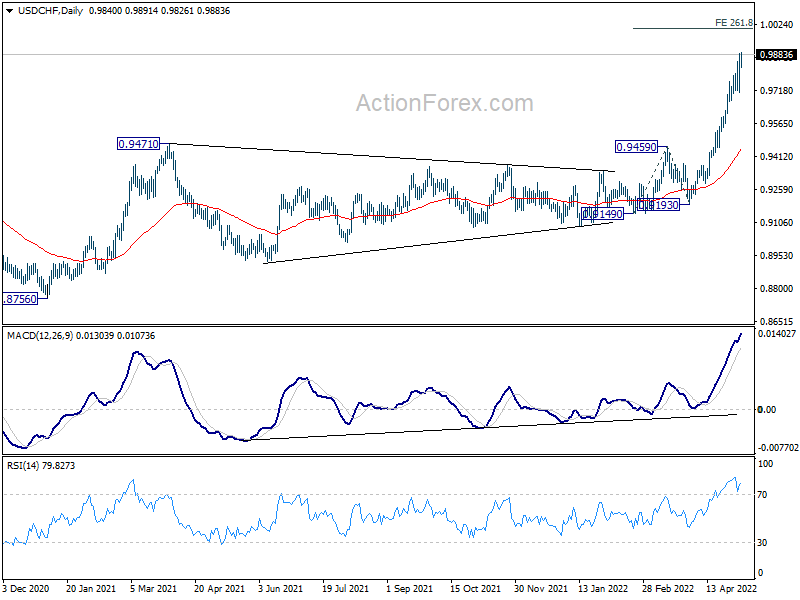
In the bigger picture, down trend from 1.0342 (2016 high) should have completed with three waves down to 0.8756 (2021 low) already. Rise from 0.8756 is likely a medium term up trend of its own. Sustained trading above 100% projection of 0.8756 to 0.9471 from 0.9149 at 0.9864 will pave the way to 161.8% projection at 1.0306, which is close to 1.0342 (2016 high). This will remain the favored case as long as 0.9459 resistance turned support holds.
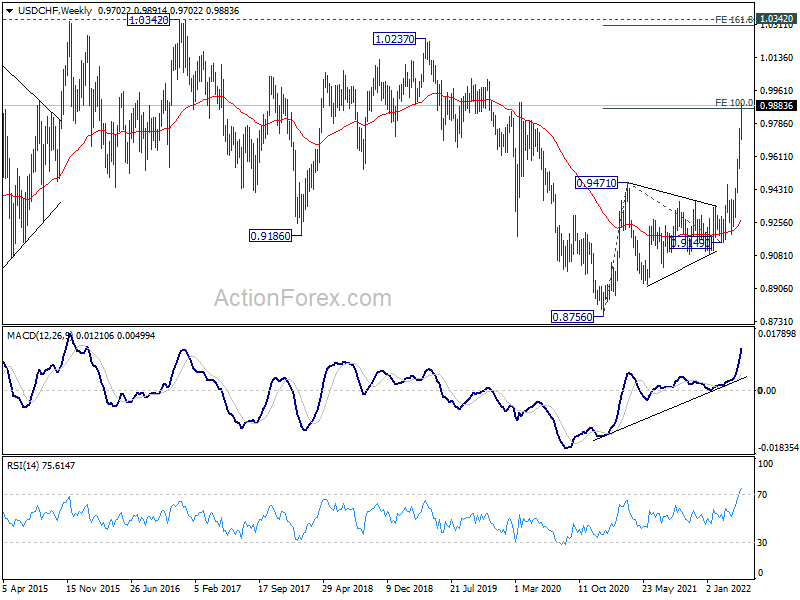
In the long term picture, current development argues that the correction from 1.0342 (2016 high) has completed at 0.8756 (2020 low) already. Rise form 0.7065 (2011 low) might be ready to resume. Firm break of 1.0342 will confirm and target 38.2% retracement of 1.8305 (2000 high) to 0.7065 at 1.1359.
AUD/USD Weekly Outlook
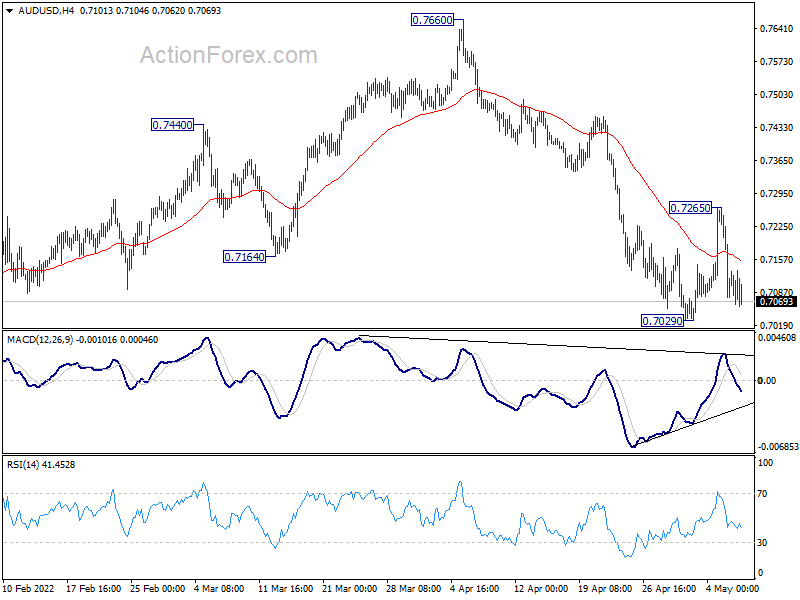
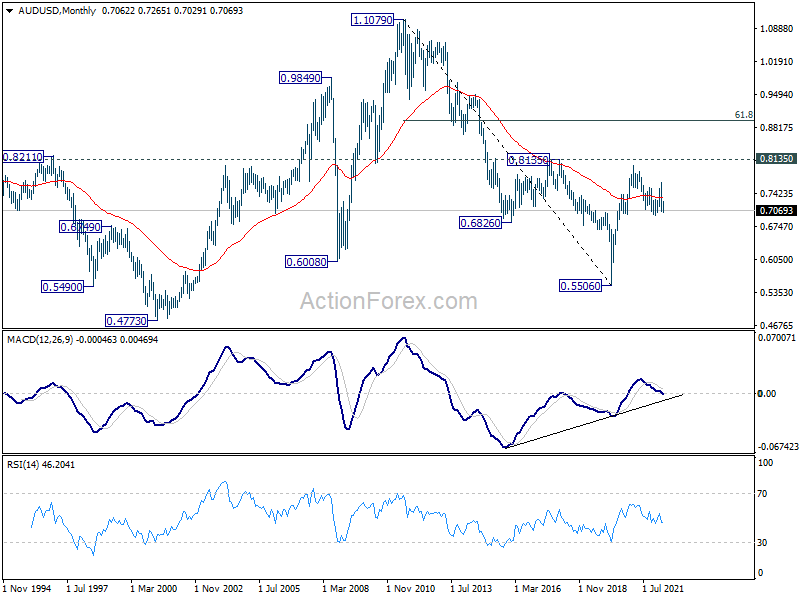
AUD/USD edged lower to 0.7029 last week, rebounded from there to 0.7265, then reversed lower. Initial bias remains neutral this week first. Outlook is unchanged that fall from 0.7660 is the third leg of the corrective pattern from 0.8006. On the downside, below 0.7029 will target 0.6966 low first. Firm break there will confirm this bearish case and target 0.6756 medium term fibonacci level next.
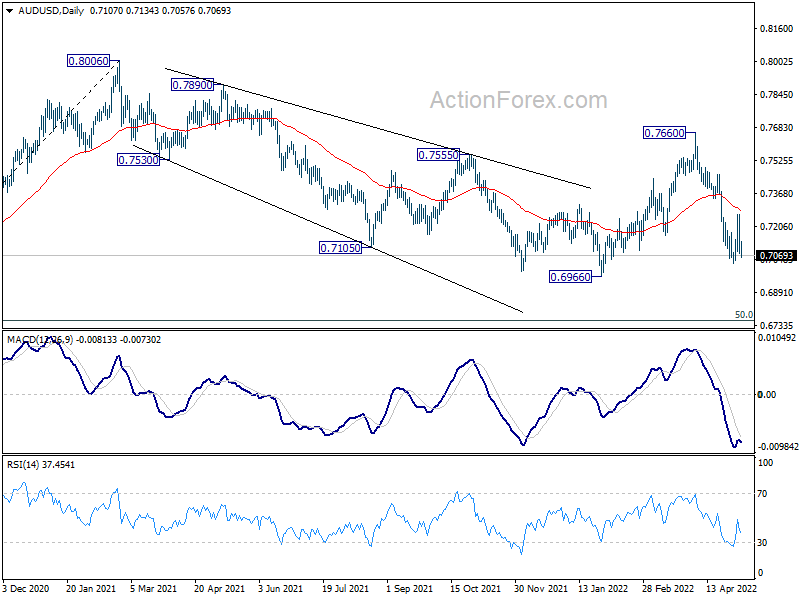
In the bigger picture, price actions from 0.8006 are seen as a corrective pattern to rise from 0.5506 (2020 low). Fall from 0.7660 should be the third leg of this pattern. Break of 0.6966 will target 50% retracement of 0.5506 to 0.8006 at 0.6756. On the upside, break of 0.7660 will revive that case that the correction has already completed at 0.6966.
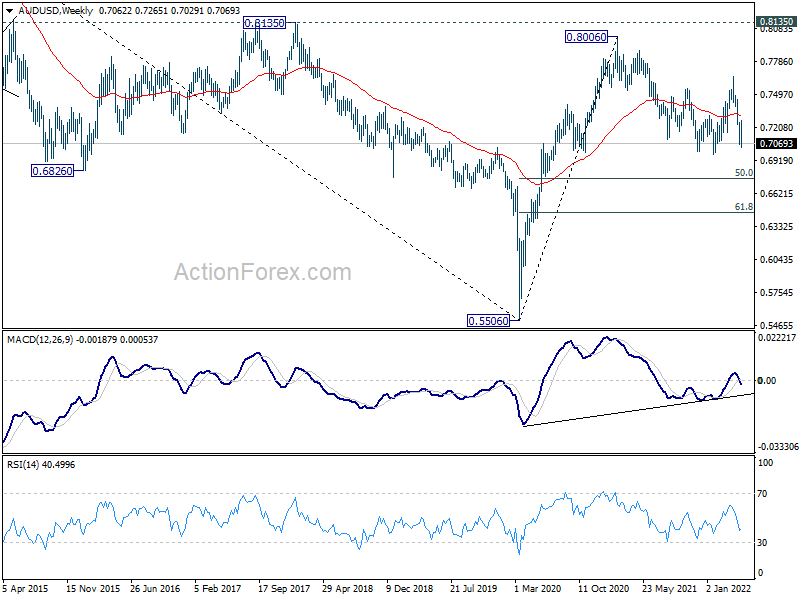
In the longer term picture, focus remains on 0.8135 structural resistance. Decisive break there will argue that rise from 0.5506 is developing into a long term up trend that reverses whole down trend from 1.1079 (2011 high). However, rejection by 0.8135 will keep long term outlook neutral at best.
USD/CAD Weekly Outlook
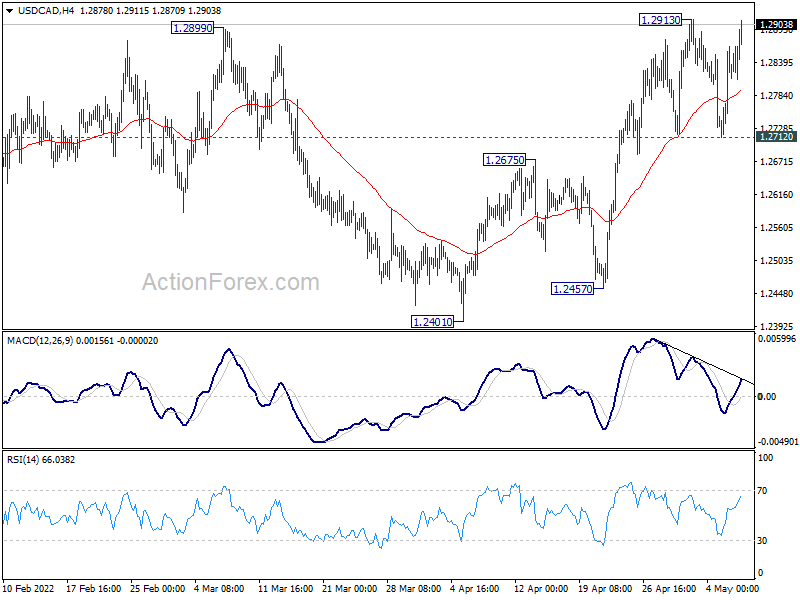
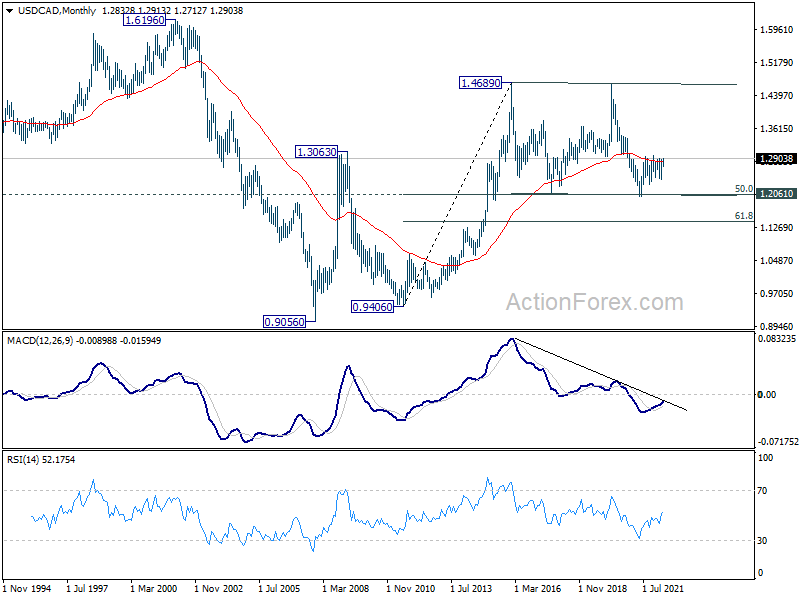
USD/CAD edged higher to 1.2913 last week but retreated sharply since then. Nevertheless, further rally is still in favor and break of 1.2913 will target 1.3022 fibonacci level next. Decisive break there will carry larger bullish implications. On the downside, break of 1.2712 will argue that rebound from 1.2401 has completed at 1.2913, ahead of 1.2963 resistance. Intraday bias will be back on the downside for 1.2401, to extend recent sideway trading.
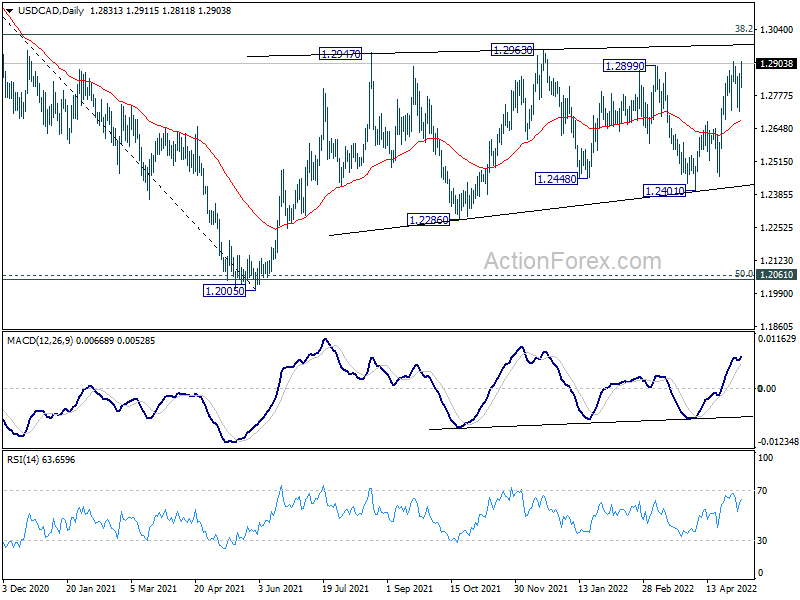
In the bigger picture, focus stays on 38.2% retracement of 1.4667 (2020 high) to 1.2005 (2021 low) at 1.3022. Sustained break there should confirm that the down trend from 1.4667 has completed after defending 1.2061 long term cluster support. Further rise would then be seen towards 61.8% retracement at 1.3650. However, rejection by 1.3022 will maintain medium term bearishness. Break of 1.2005 will resume the down trend from 1.4667 and that carries larger bearish implications too.
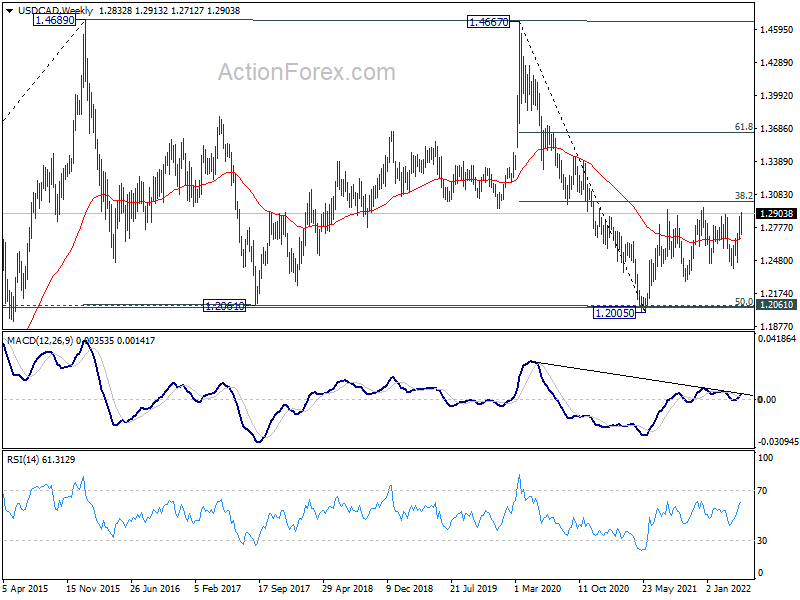
In the longer term picture, price actions from 1.4689 (2016 high) are seen as a consolidation pattern only. That is, up trend from 0.9506 (2007 low) is still expected to resume at a later stage. This will remain the favored case as long as 1.2061 support holds, which is close to 50% retracement of 0.9406 to 1.4689 at 1.2048. However, firm break of 1.2061 support will argue that USD/CAD has already started a long term down trend. Next target is 61.8% retracement of 0.9406 to 1.4689 at 1.1424.
GBP/JPY Weekly Outlook
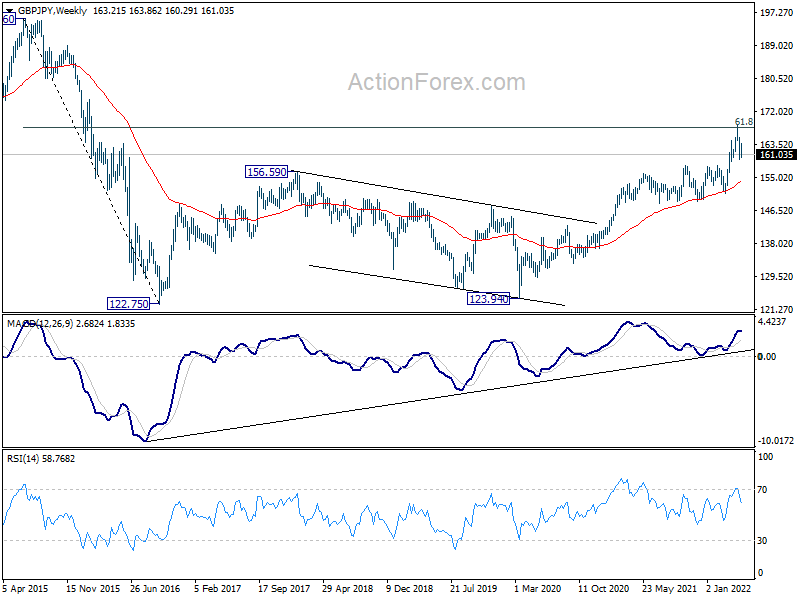
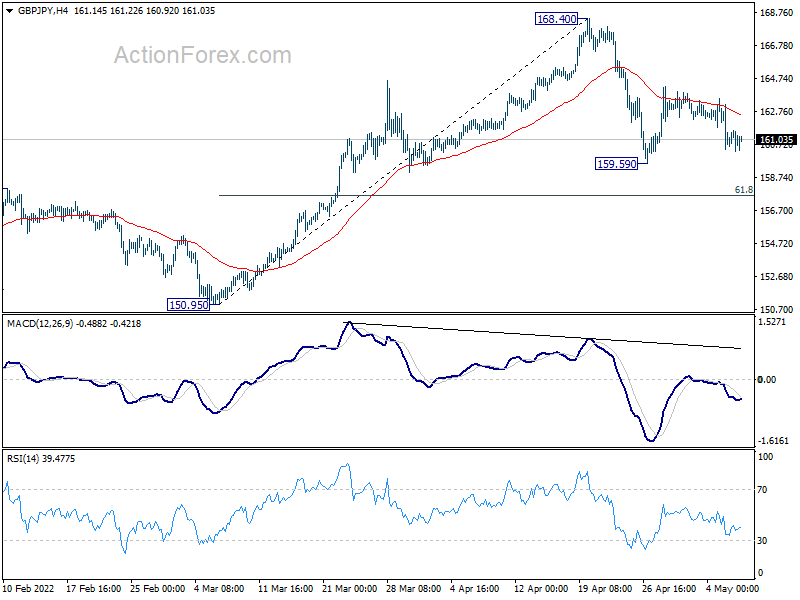
GBP/JPY extended the corrective pattern from 168.40 last week and outlook is unchanged. Initial bias remains neutral this week first. Break of 159.59 will extend the correction from 168.40 lower. But downside should be contained by 61.8% retracement of 150.95 to 168.40 at 157.61 to bring rebound. On the upside, firm break of 168.40 will resume larger up trend.
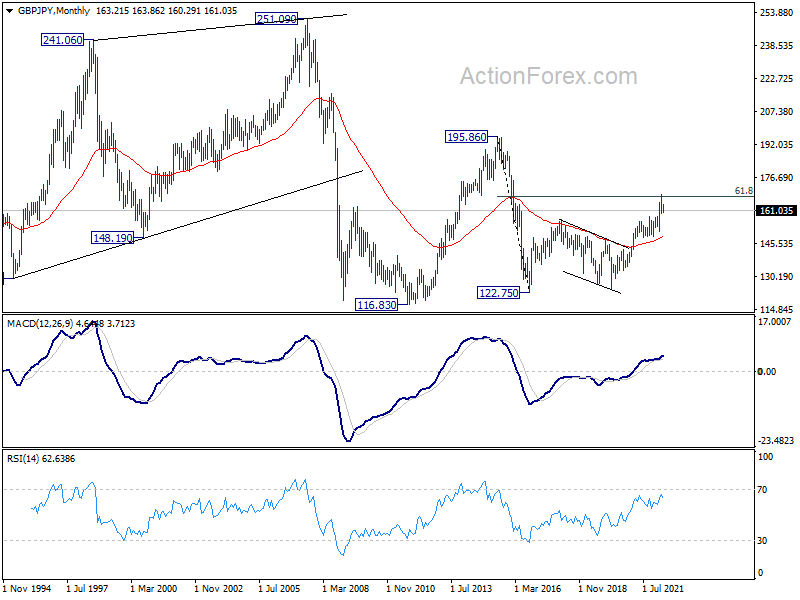
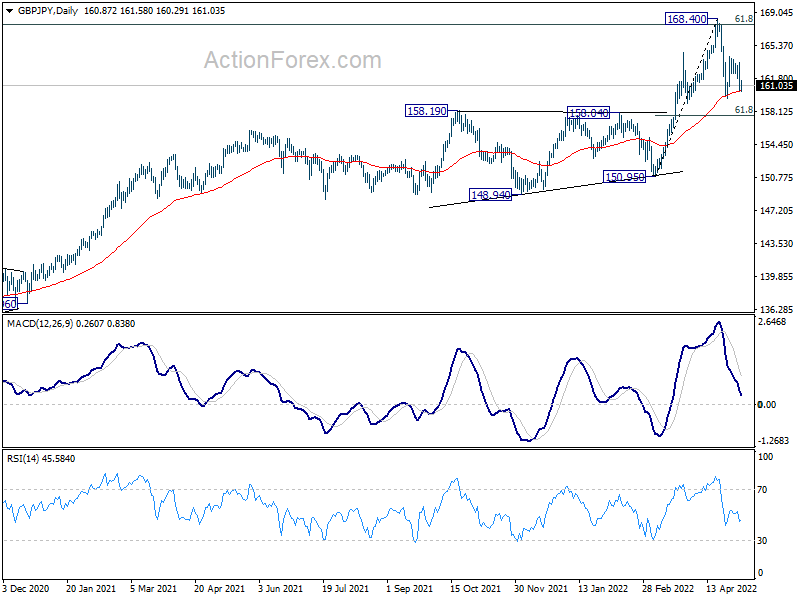
In the bigger picture, up trend from 123.94 (2020 low) is still in progress. Sustained break of 61.8% retracement of 195.86 (2015 high) to 122.75 (2016 low) at 167.93 will be a long term bullish signal, and could pave the way back to 195.86 high. This will now remain the favored case as long as 150.95 support holds, even in case of deep pull back.
In the longer term picture, rise from 122.75 could be the third leg the the pattern from 116.83 (2011 low). Further rise will remain in favor as long as 55 month EMA (now at 148.31) holds. Sustained break of 61.8% retracement of 195.86 to 122.75 at 167.93. will pave the way to 195.86 (2015 high).