

Sample Category Title
USD/CHF Daily Outlook
Daily Pivots: (S1) 0.9675; (P) 0.9717; (R1) 0.9761; More....
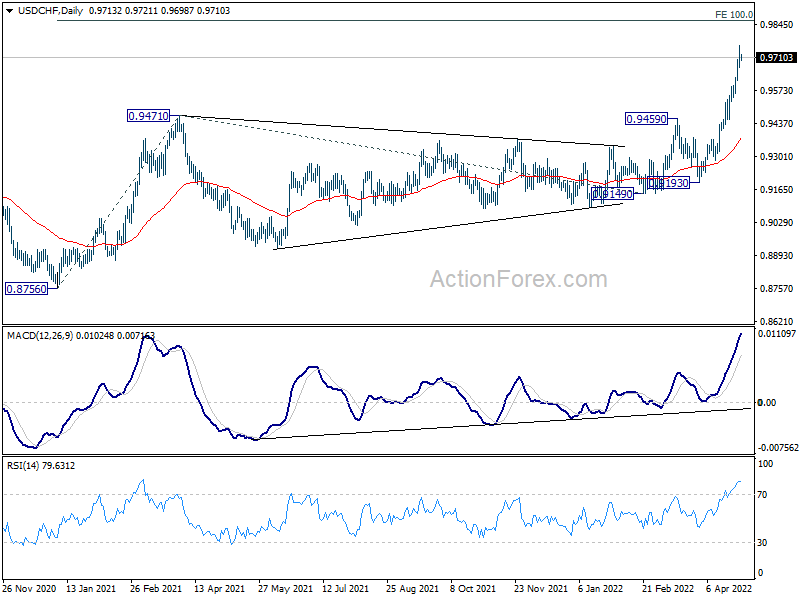
Intraday bias in USD/CHF remains on the upside for the moment. Current up trend should target next medium term projection level at 0.9864. On the downside, below 0.9669 minor support will turn intraday bias neutral and bring consolidations. But downside of retreat should be contained above 0.9459 resistance turned support to bring another rally.
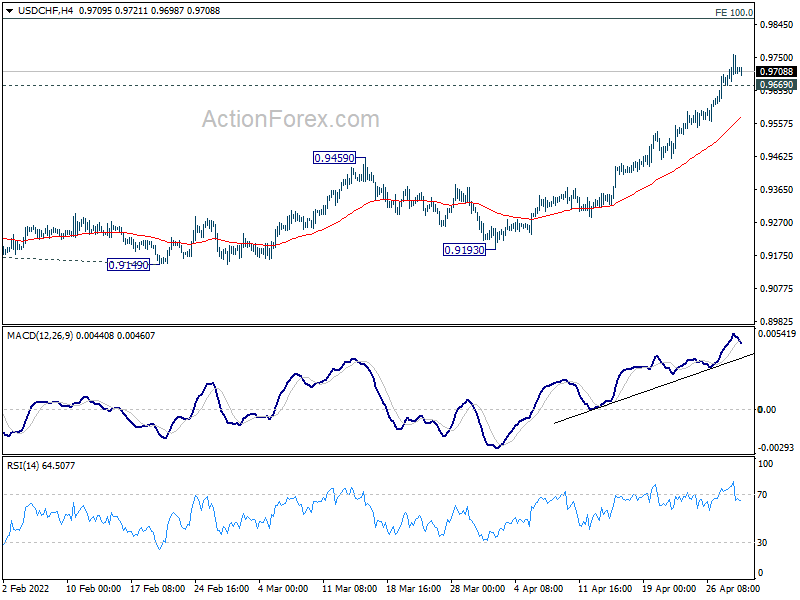
In the bigger picture, down trend from 1.0342 (2016 high) should have completed with three waves down to 0.8756 (2021 low) already. Rise from 0.8756 is likely a medium term up trend of its own. Next target is 100% projection of 0.8756 to 0.9471 from 0.9149 at 0.9864. This will now remain the favored case as long as 0.9459 resistance turned support holds.
USD/JPY Daily Outlook
Daily Pivots: (S1) 129.04; (P) 130.14; (R1) 131.95; More...
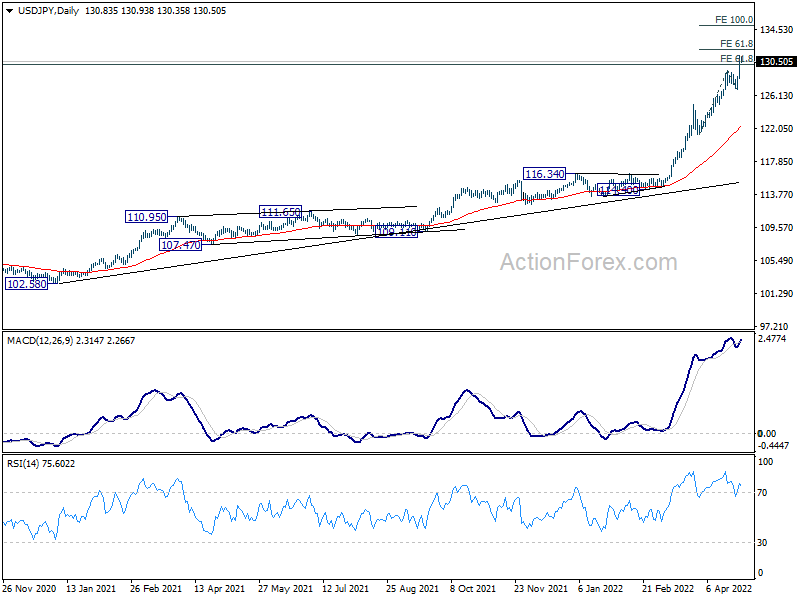
Intraday bias in USD/JPY remains on the upside for 61.8% projection of 121.27 to 129.39 from 126.91 at 131.92. Firm break there will pave the way to 100% projection at 135.03. On the downside, break of 126.91 support is needed to indicate short term topping. Otherwise, outlook will stay bullish in case of retreat.
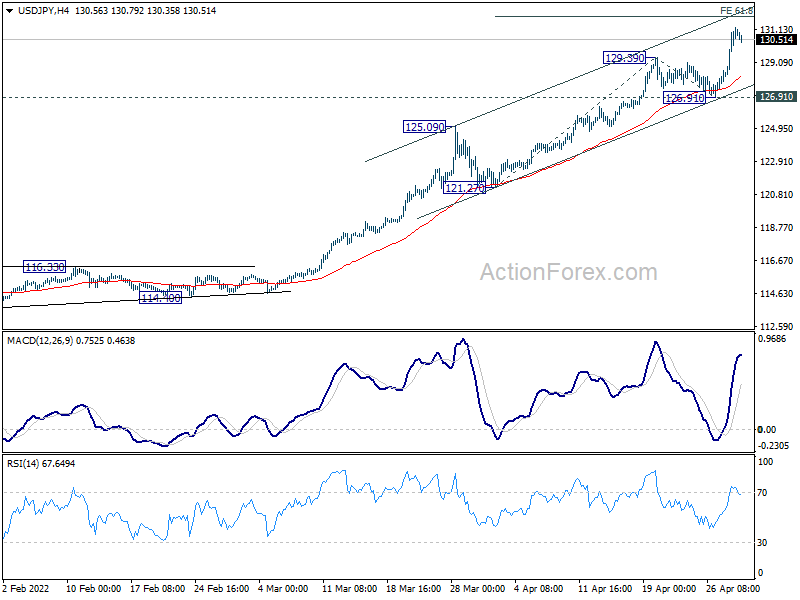
In the bigger picture, current rally is seen as part of the long term up trend form 75.56 (2011 low). Sustained trading above 61.8% projection of 75.56 (2011 low) to 125.85 (2015 high) from 98.97 at 130.04 will pave the way to 100% project at 149.26, which is close to 147.68 (1998 high). For now, this will remain the favored case as long as 121.27 support holds.
AUD/USD Daily Report
Daily Pivots: (S1) 0.7049; (P) 0.7105; (R1) 0.7156; More...
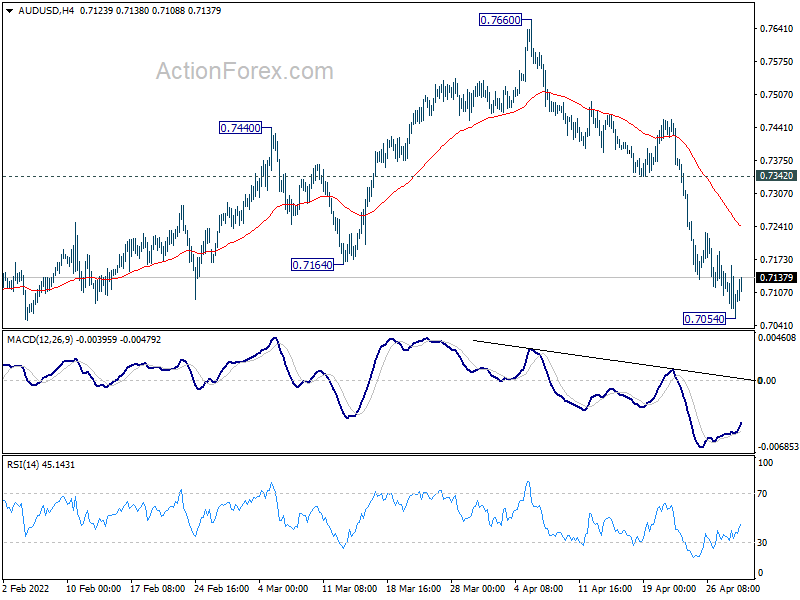
Intraday bias in AUD/USD is turned neutral again with loss of downside momentum. Still, further decline is expected as long as 0.7342 support turned resistance holds. Current development argues that larger correction from 0.8006 is in its third leg. Below 0.7054 will target a retest on 0.6966 low first.
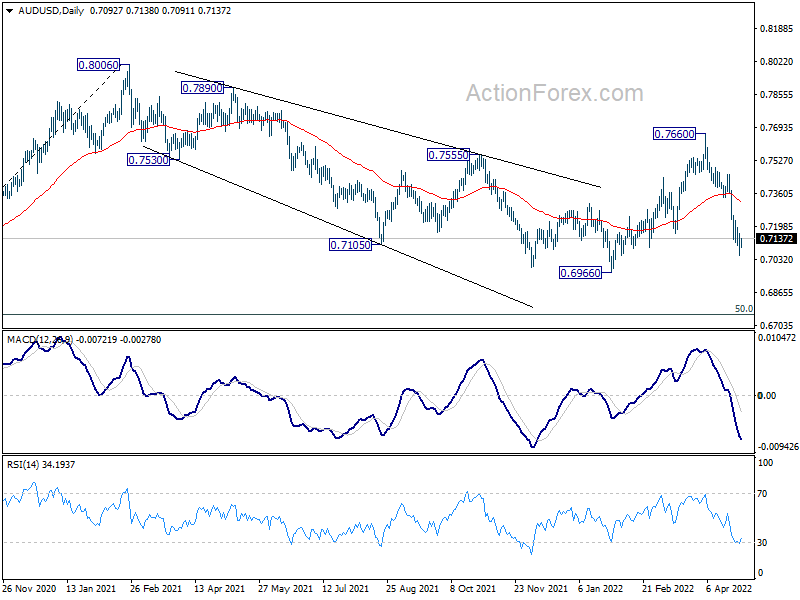
In the bigger picture, price actions from 0.8006 are seen as a corrective pattern to rise from 0.5506 (2020 low). Break of 0.7164 will suggest that such correction is still in progress, with fall from 0.7660 as the third leg. Next target will be 50% retracement of 0.5506 to 0.8006 at 0.6756. On the upside, break of 0.7660 will revive that case that the correction has already completed at 0.6966.
USD/CAD Daily Outlook
Daily Pivots: (S1) 1.2773; (P) 1.2826; (R1) 1.2862; More...
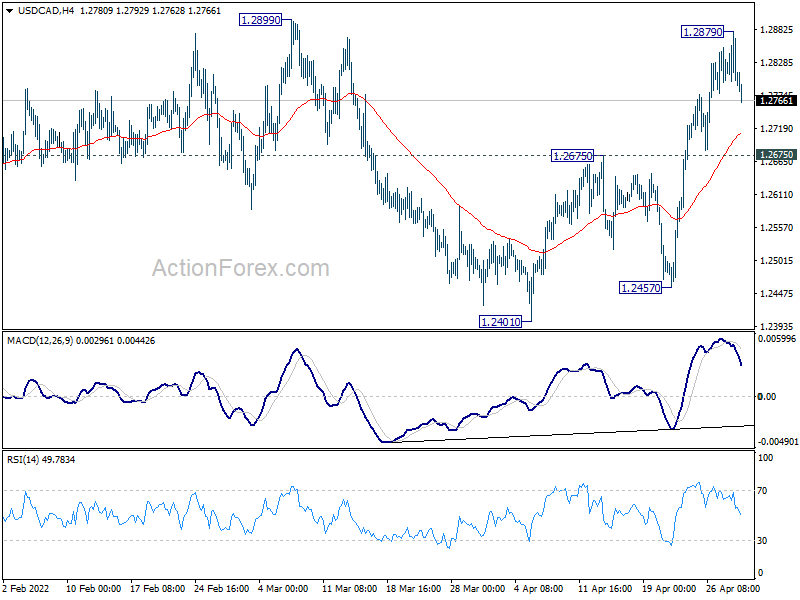
A temporary top is formed at 1.2879, ahead of 1.2899 resistance, with current retreat. Intraday bias in USD/CAD is turned neutral first. Further rise will remain mildly in favor as long as 1.2675 resistance turned support holds. Above 1.2879 should resume rise from 1.2401 towards 1.3022 fibonacci level. Decisive break there will carry larger bullish implications. However, break of 1.2675 will dampen this bullish view and bring deeper fall back to 1.2401 support instead.
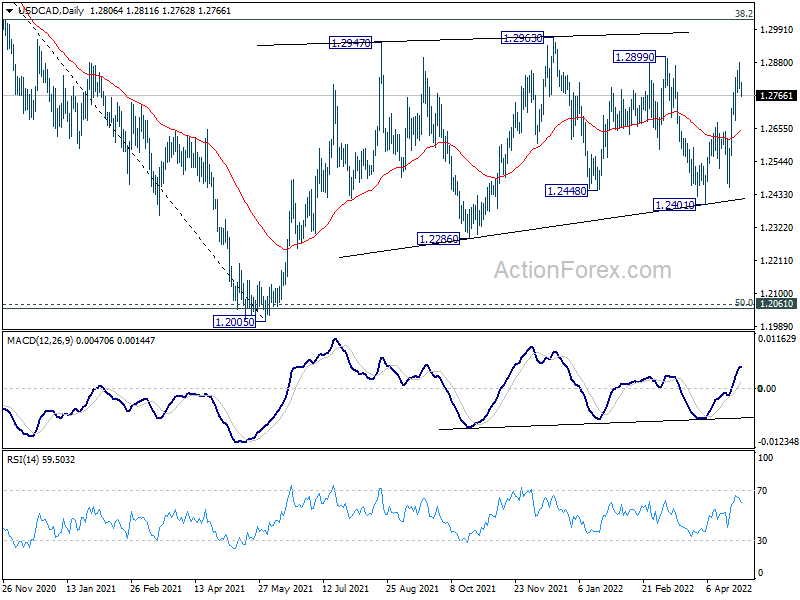
In the bigger picture, focus stays on 38.2% retracement of 1.4667 (2020 high) to 1.2005 (2021 low) at 1.3022. Sustained break there should confirm that the down trend from 1.4667 has completed after defending 1.2061 long term cluster support. Further rise would then be seen towards 61.8% retracement at 1.3650. However, rejection by 1.3022 will maintain medium term bearishness. Break of 1.2005 will resume the down trend from 1.4667 and that carries larger bearish implications too.
GBP/JPY Daily Outlook
Daily Pivots: (S1) 161.23; (P) 162.74; (R1) 164.60; More...
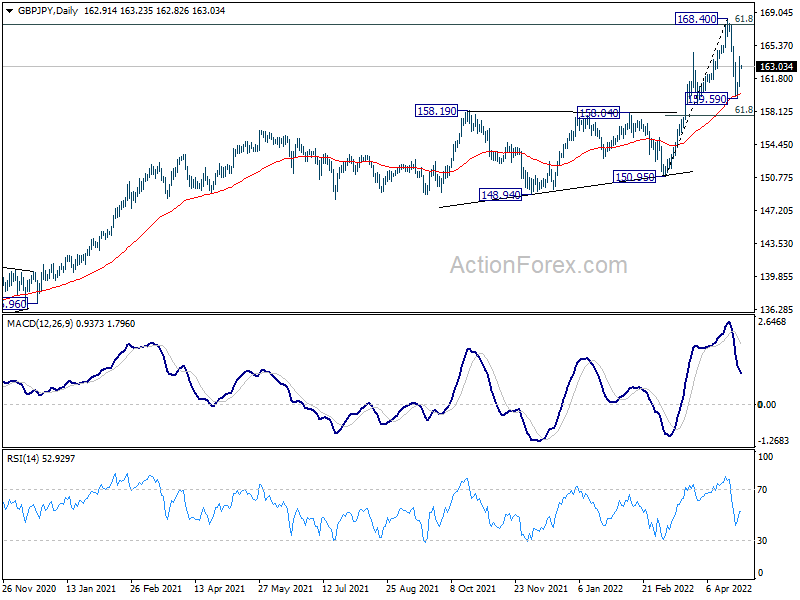
Intraday bias in GBP/JPY remains mildly on the upside for retesting 168.40 high. Firm break there will resume larger up trend. On the downside, in case of another fall, downside should be contained by 61.8% retracement of 150.95 to 168.40 at 157.61 to bring rebound.
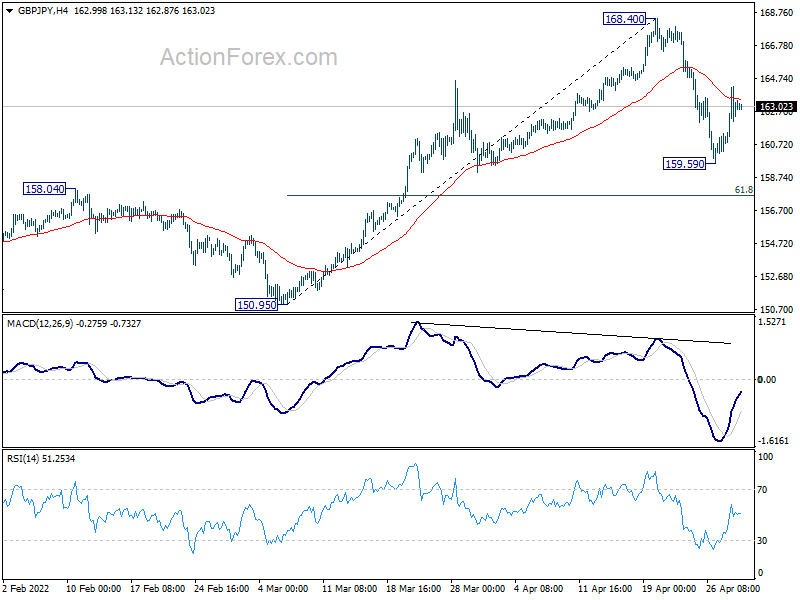
In the bigger picture, up trend from 123.94 (2020 low) is still in progress. Sustained break of 61.8% retracement of 195.86 (2015 high) to 122.75 (2016 low) at 167.93 will be a long term bullish signal, and could pave the way back to 195.86 high. This will now remain the favored case as long as 150.95 support holds, even in case of deep pull back.
EUR/JPY Daily Outlook
Daily Pivots: (S1) 135.91; (P) 136.95; (R1) 138.47; More....
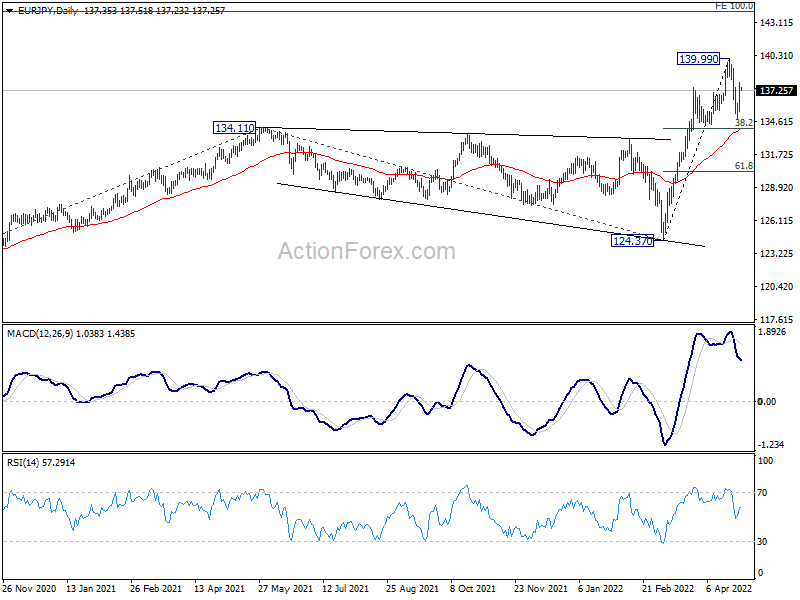
Intraday bias in EUR/JPY remains mildly on the upside for retesting 139.99 high. Firm break there will resume larger up trend for 144.06 medium term projection level. In case consolidation from 139.99 extends with another fall, downside should be contained by 38.2% retracement of 124.37 to 139.99 at 134.02 to bring rebound.
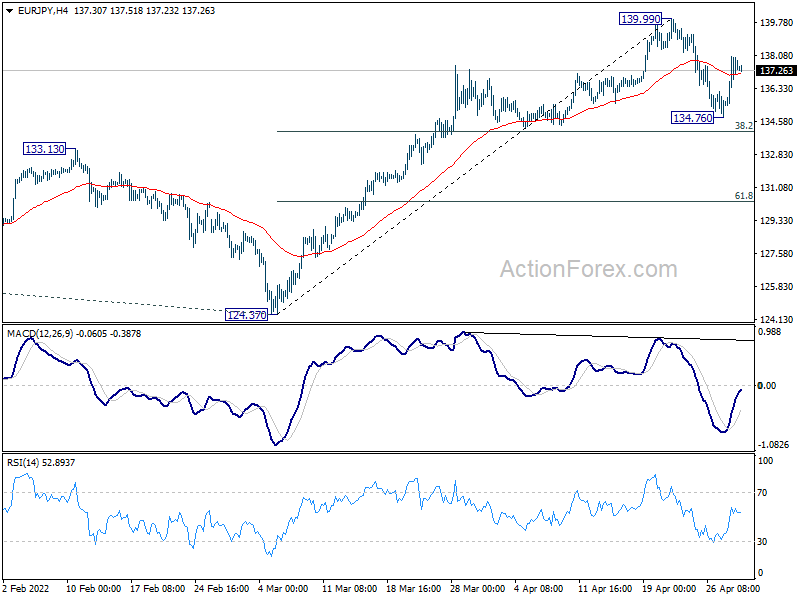
In the bigger picture, up trend from 114.42 (2020 low) is in progress. Such rise is seen as the third leg of the pattern from 109.30 (2016 low). Next target will be 100% projection of 114.42 to 134.11 from 124.37 at 144.06. In any case, outlook will now remain bullish as long as 124.37 support holds, in case of deep pull back.
EUR/GBP Daily Outlook
Daily Pivots: (S1) 0.8385; (P) 0.8423; (R1) 0.8462; More...
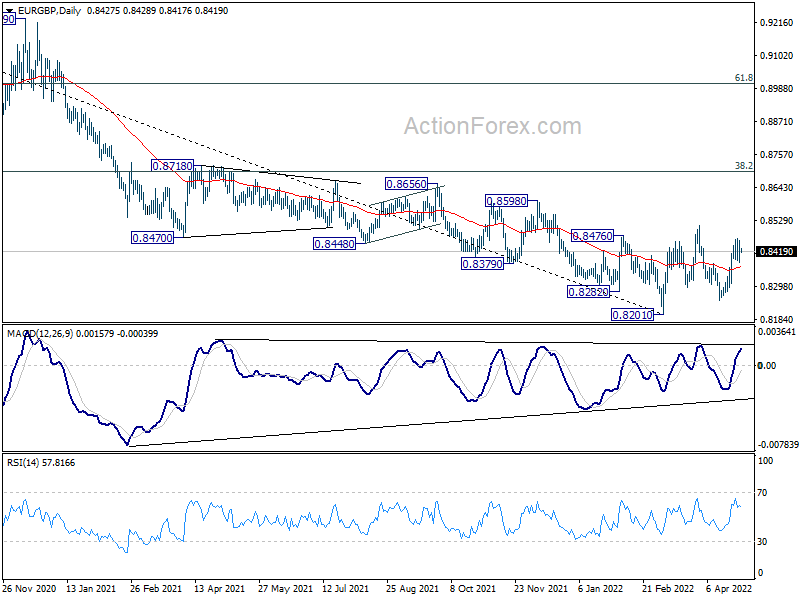
Intraday bias in EUR/GBP remains neutral at this point. On the upside, above 0.8465 will target 0.8511 resistance first. Further break of 0.8511 will reaffirm that 0.8201 is a medium term bottom, and target 0.8697 medium term fibonacci level next. However, break of 0.8380 minor support will turn bias back to the downside for 0.8248 support instead.
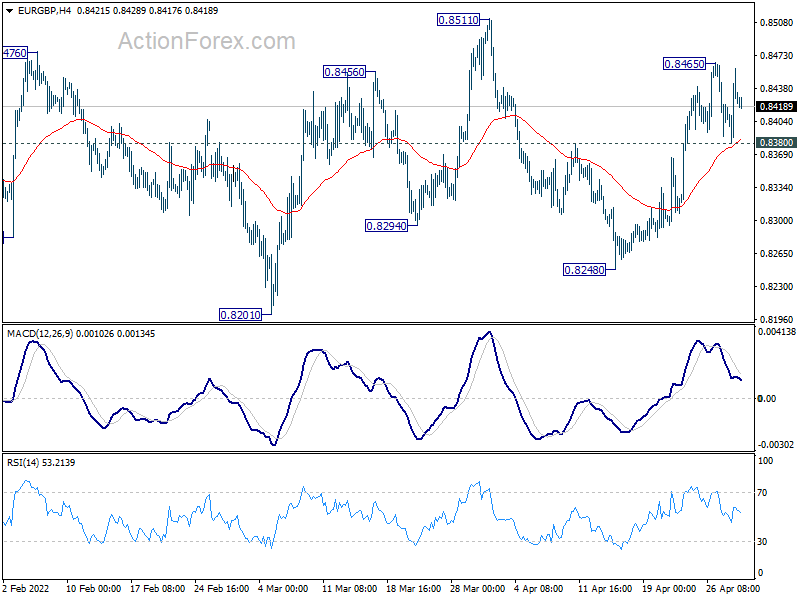
In the bigger picture, a medium term bottom could be in place at 0.8201, on bullish convergence condition in daily and weekly MACD. Rise from there could either be a correction to the down trend from 0.9499 (2020 high), or a medium term up trend itself. In either case, further rise should be seen to 38.2% retracement of 0.9499 to 0.8201 at 0.8697. Sustained break there will target 61.8% retracement at 0.9003.
EUR/AUD Daily Outlook
Daily Pivots: (S1) 1.4716; (P) 1.4801; (R1) 1.4872; More...
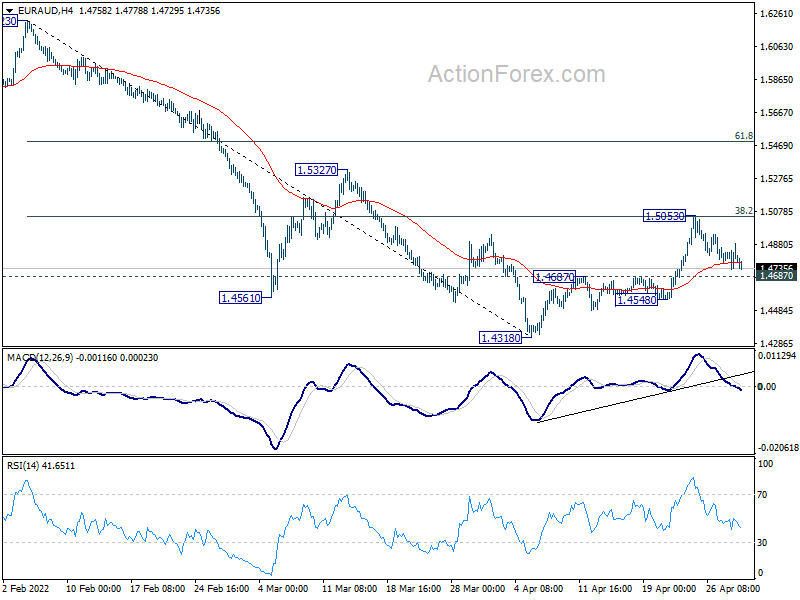
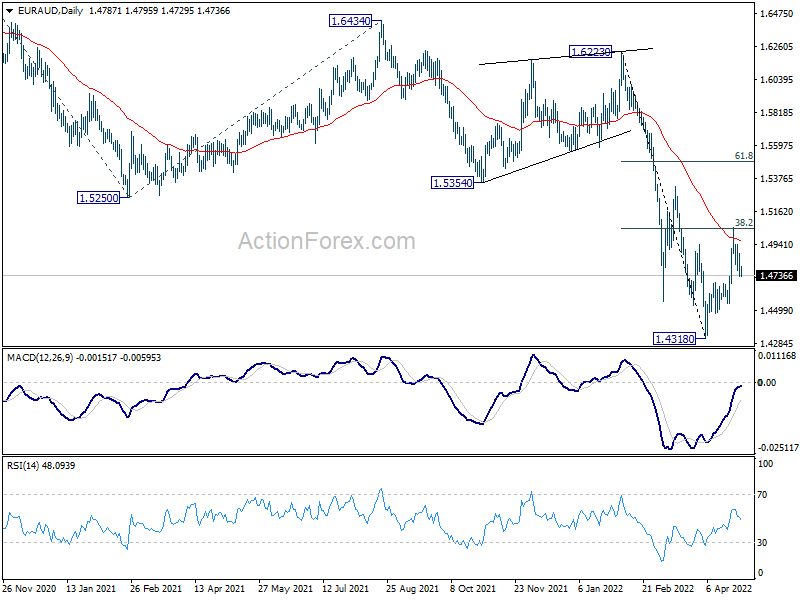
Intraday bias in EUR/AUD remains neutral for the moment. On the downside, below 1.4687 minor support will argue that rebound from 1.4318 has completed at 1.5053 already. Intraday bias will be back on the downside for retesting 1.4318 low. On the upside, break of 1.5053 will target 61.8% retracement of 1.6223 to 1.4318 at 1.5495.
In the bigger picture, fall from 1.9799 is seen as a long term impulsive move. Next target is 61.8% projection of 1.9799 to 1.5250 from 1.6434 at 1.3623, which is close to 1.3624 long term support (2017 low). Some support could be seen there to bring interim rebound. But overall, break of 1.5354 support turned resistance is needed to be the first sign of medium term bottoming. Otherwise, outlook will stay bearish in case of recovery.
EUR/CHF Daily Outlook
Daily Pivots: (S1) 1.0182; (P) 1.0212; (R1) 1.0235; More....
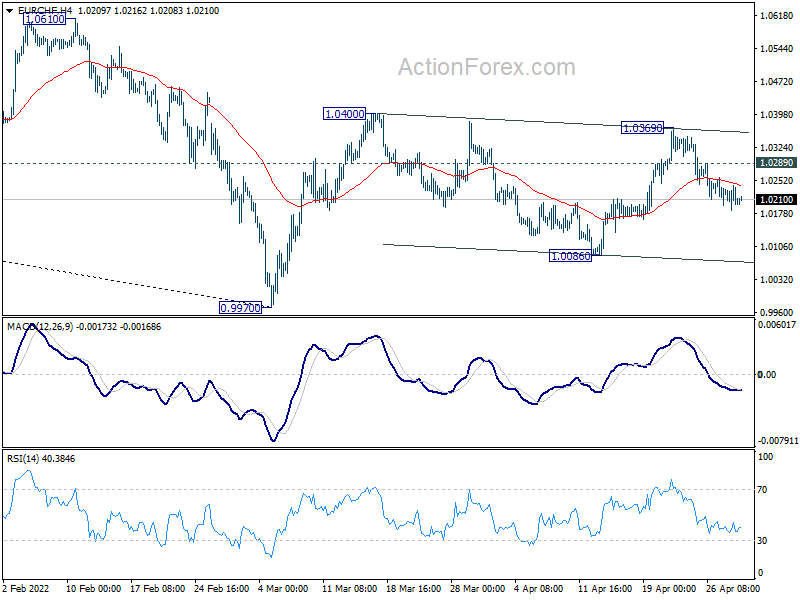
EUR/CHF is losing some downside momentum but there is no sign of bottoming yet. Intraday bias remains mildly on the downside. Fall from 1.0369 is seen as the third leg of the corrective pattern from 1.0400. Deeper decline could be seen to 1.0086 support. On the upside, above 1.0289 minor resistance will turn intraday bias neutral first. Further break of 1.0400 resistance will resume the rebound from 0.9970 to 1.0610 structural resistance instead.
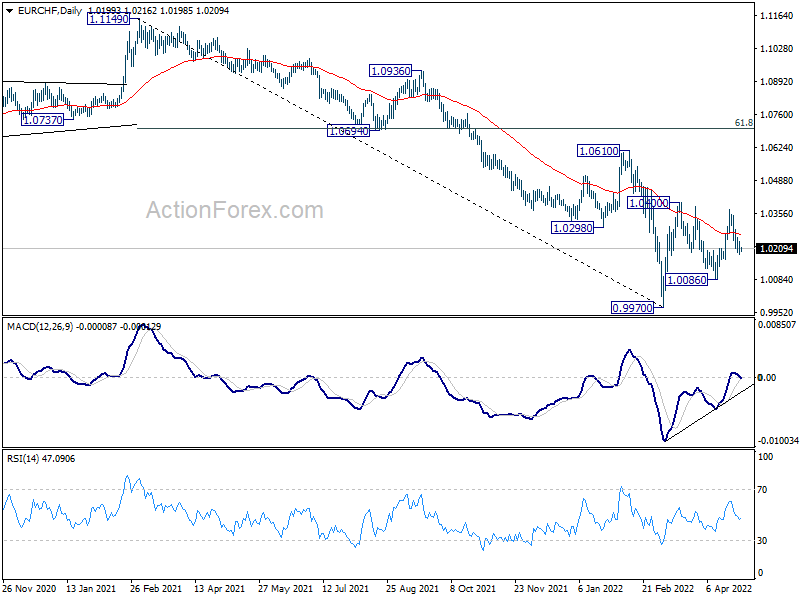
In the bigger picture, long term down trend from 1.2004 (2018 high) is still in progress. Next target is 100% projection of 1.2004 to 1.0505 to 1.1149 at 0.9650. In any case, sustained break of 1.0505 support turned resistance (2020 low) is needed to be the first sign of medium term bottoming. Otherwise, outlook will remain bearish.
Cliff Notes: A Singular Focus
Key insights from the week that was.
In Australia this week, the market had a singular focus – inflation.
The Q1 CPI report did not disappoint, with both headline and trimmed mean core inflation coming in ahead of our top-of-the-market expectation. Highlighting the historic significance of the result, headline inflation’s 2.1% gain was the largest since the introduction of the GST more than two decades ago and took the annual rate from 3.5% to 5.1%. Trimmed mean core inflation’s 1.4% gain was similarly the largest since the ABS series began in 2002 and, on RBA historical estimates, the biggest rise since December 1990. Annual trimmed mean inflation now stands at 3.7%, also materially above the top of the RBA’s 2-3%yr medium-term target range.
Our bulletin on the release provides detail on the composition of prices pressures. Of particular note was not only the scale of energy and supply-chain shocks, but also the breadth of price increases overall. Of all the items in the CPI basket, the proportion seeing prices rise at an annual rate of 2.5%yr or more increased from 32% to 66% in March.
On the back of this report, Chief Economist Bill Evans outlined an adjustment to our near-term expectations for the RBA. Instead of forecasting a 40bp first increase in June, we now anticipate a 15bp increase in May followed by a 25bp rise in June. The remainder of our forecast profile is unchanged, with a run of 25bp increases to follow in July, August, October and November, taking the cash rate to 1.50% by end-2022. The final two hikes of the cycle are then expected in February and May 2023, resulting in a peak cash rate of 2.00%. Westpac’s forecast peak is materially lower than that of the market. The primary justifications for our view are Australian households high debt levels, giving each rate increase and outsized effect versus history, and the impact of elevated inflation on real incomes.
Turning to the US. In Q1, GDP surprised materially to the downside, a 1.4% annualised contraction reported against expectations of a 1.0-1.5% annualised gain. While a shock, the detail of the report make clear this is not an outcome that will dissuade the FOMC from normalising policy at pace. This is because the decline in activity came as a result of reduced inventory restocking and strength in imports, both stemming from buoyant household consumption and a jump in equipment investment in the three months to March. In contrast to the 1.4% annualised decline in GDP, domestic final demand instead rose at a 2.7% annualised pace – just above the 10-year average for the series.
The Q1 outcome will cause complications for assessing GDP’s momentum throughout 2022, and there is a material risk of another ‘surprise’ quarter. So, in assessing the outlook for growth, it is best to continue to focus on domestic demand. From a 3.0% annualised pace in the first half of 2022, we expect momentum to slow to trend in the second half (circa 2.5%); it is only in 2023 as the full effect of the FOMC’s rate hikes and the associated tightening of financial conditions are felt that domestic demand growth is likely to fall materially below trend, to around 1.5% by the second half of the year. Along with dissipating price pressures and risks, we expect this activity outturn to justify the FOMC stopping rate hikes at the December 2022 meeting at a fed funds rate of 2.375% and, come 2024, to cut twice back to 1.875% to sustain GDP growth near potential.
The Euro Area has seen little data of significance this week, with the April CPI and Q1 GDP reports still to come. In the meantime, the focus has remained on risks to growth from Russia’s invasion of Ukraine, particularly Russia’s threat to turn off the Euro Area’s gas supply. The ECB and the majority of private forecasters (including Westpac) continue to believe that activity growth will remain positive in 2022 even if gas supplies are impacted. However, it is important to recognise the immense uncertainty at play. Not only could energy shortages affect production and employment late in the year, but the hit to real incomes from persistent rapid inflation and the flow-on consequences for sentiment are a concern from now into 2023. Prices, activity and sentiment will need to be continuously assessed in the months ahead.