

Sample Category Title
USD/JPY Surges Past 130, US GDP Contracts 1.4%
Key Highlights
- USD/JPY started a fresh surge and cleared the 130.00 resistance.
- It traded to a new multi-year high and spiked above 131.00.
- EUR/USD extended decline below 1.0550, and GBP/USD traded below 1.2500.
- The US GDP contracted 1.4% in Q1 2022 (Prelim).
USD/JPY Technical Analysis
The US Dollar remained well supported near the 127.00 zone against the Japanese Yen. USD/JPY started a fresh surge and broke the last swing high at 129.40.
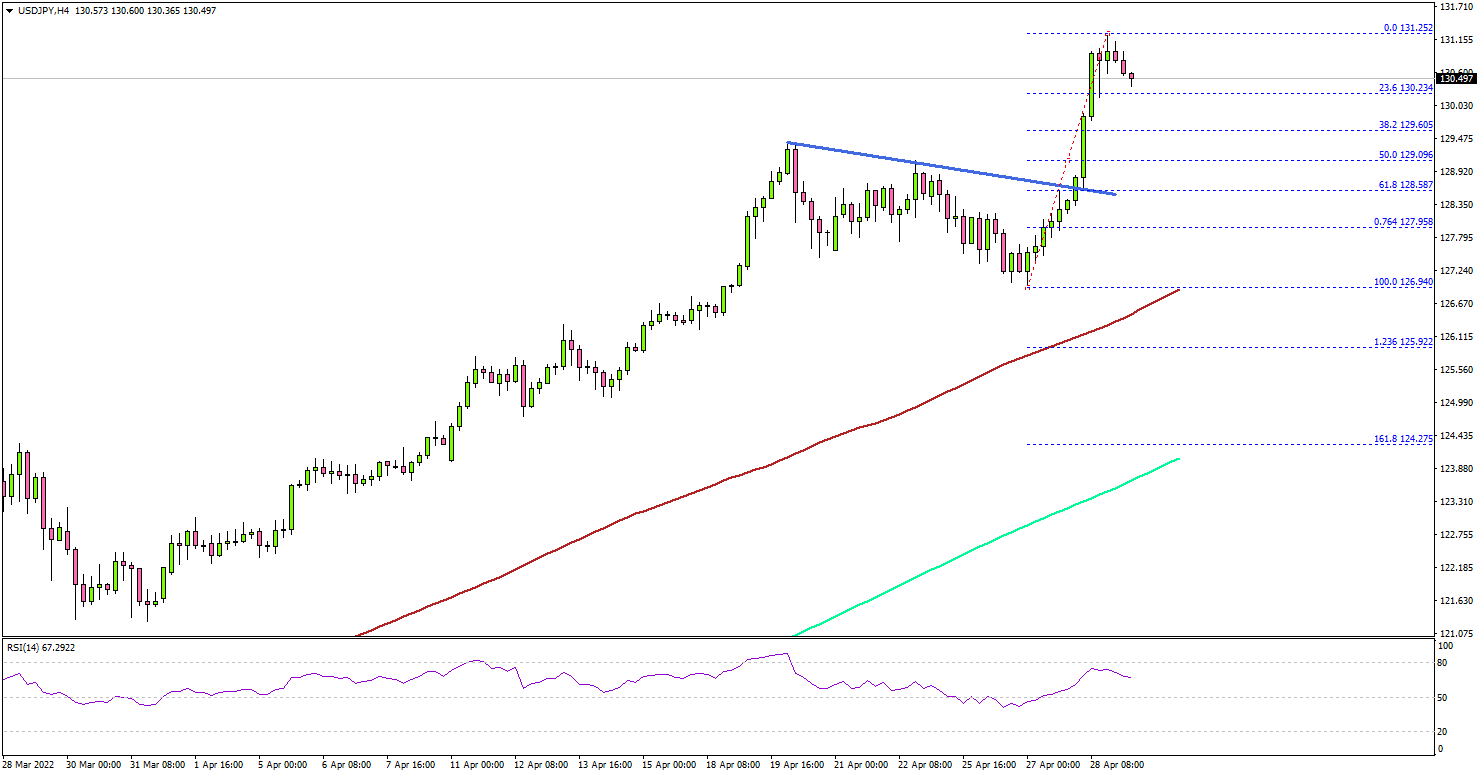
Looking at the 4-hours chart, the pair gained pace above the 129.50 level. There was even a close above the 130.00 level, the 200 simple moving average (green, 4-hours), and the 100 simple moving average (red, 4-hours).
The pair spiked above 131.00 and traded to a new multi-year high. The current price action suggests high chances of more upsides above 131.00.
The next major resistance is seen near the 131.50 level, above which the pair could rise towards 132.80. If there is a downside correction, the pair might find support near 130.00. The next major support is near the 129.40 level. Any more losses may perhaps open the doors for a move towards the 127.00 support zone.
Fundamentally, the US Gross Domestic Product for Q1 2022 (Prelim) was released yesterday by the US Bureau of Economic Analysis. The market was looking for an increase of 1.1% in the GDP.
The actual result was disappointing, as the US GDP contracted 1.4% in Q1 2022 (Prelim) (according to the "advance" estimate released by the Bureau of Economic Analysis).
Looking at EUR/USD, the pair failed to recover losses and extended its decline below the key 1.0550 support zone.
Economic Releases
- German Gross Domestic Product for Q1 2022 (YoY) (Prelim) – Forecast 3.6%, versus 1.8% previous.
- German Gross Domestic Product for Q1 2022 (QoQ) (Prelim) – Forecast 0.1%, versus -0.3% previous.
- Euro Zone Gross Domestic Product for Q1 2022 (QoQ) (Prelim) - Forecast 0.3%, versus 0.3% previous.
- Euro Zone Gross Domestic Product for Q1 2022 (YoY) (Prelim) - Forecast 5.0%, versus 4.6% previous.
- US Personal Income for March 2022 (MoM) - Forecast +0.4%, versus +0.5% previous.
Could Flash GDP Growth & CPI Inflation Come to Euro’s Rescue?
The Eurozone will update its CPI inflation and GDP growth readings on Friday at 09:00 GMT. While investors expect a firmer economic expansion and another upturn in inflation, the data could produce only temporary volatility as the war in Ukraine will remain the major, if not, the only driver for the battered euro in the short term.
Euro may shrug off new record inflation
The euro has been hammered badly this week, depreciating by more than 2.0% against the US dollar in the face of hawkish Fed rate hike talk and Russia’s gas supply cuts to NATO members Poland and Bulgaria. That is the largest damage since March 2020, but the week is not over yet and the common currency may have one more opportunity to rebound before the focus solely turns to the 2017 trough of 1.0339 as Friday’s preliminary CPI inflation and GDP growth data appear on the radar.
Looking first at CPI readings, there is growing speculation that global inflation is nearing a peak, as year-on-year comparisons with 2021 high levels could produce softer CPI figures. The ECB’s vice president Luis de Guindos reaffirmed his hopes for a peak in inflation today, though the forecasts for the Eurozone flash estimates for April suggest this phenomenon may arise at a later stage, as they point to a new record high of 7.5% y/y from 7.4% previously. Excluding volatile food and energy prices, the core measure is also projected to run beyond the central bank’s symmetrical 2.0% target, unlocking a fresh high at 3.4% y/y, up from 3.2% in March.
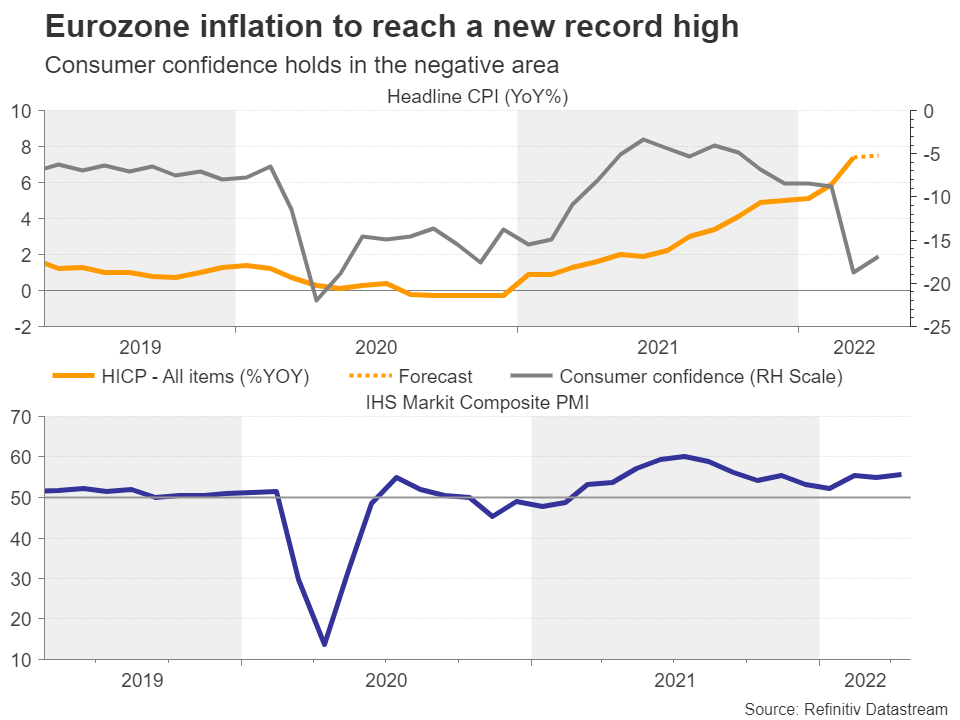
The above outcome or even a stronger-than-expected print could amplify calls for a July 25bps rate hike, which is currently almost fully priced in futures markets. However, whether the inflation data will provide the much-needed upturn in the euro remains to be seen.
Under normal circumstances, a continuous inflation spiral would raise the stakes for tighter monetary policy, stirring fresh bullish volatility in the currency as in the greenback's case. That said, another record CPI mark in the Eurozone may not be very surprising to investors after all. Stronger-than-expected German CPI figures have already foreshadowed this scenario. Also, the war in Ukraine and lately Russia's gas supply cuts could add more fuel to the already rocketing energy and food crisis in the coming months.
GDP growth may not help the euro either
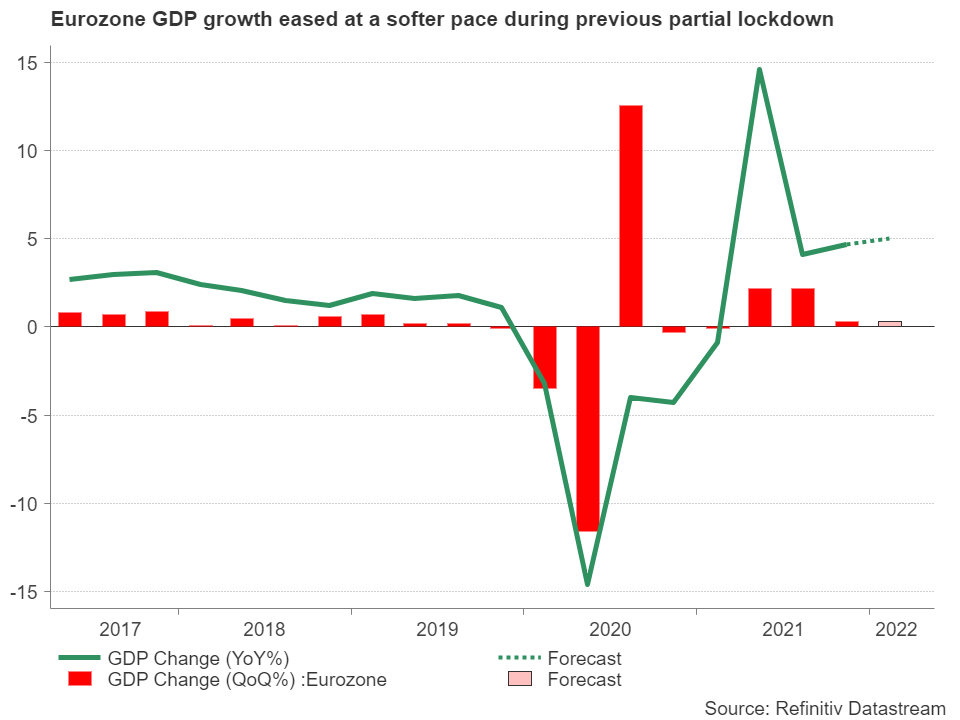
Perhaps, the euro could recoup some lost ground if a potential upbeat inflation report is accompanied by firmer GDP stats. Analysts believe that the Eurozone economy has expanded at a faster annual pace of 5.0% y/y in Q1 versus 4.6% reported in the preceding quarter, and at a steady quarterly rate of 0.3%. Nevertheless, investors could again barely react to the data since Ukraine’s negative economic spillovers may become more evident in the next GDP releases.
Perhaps a sudden pullback in the US core PCE inflation index could give a second chance to euro bulls later on Friday, increasing the likelihood of a narrowing monetary divergence between the Fed and the ECB. But again, given the non-existing support from the recent negative US GDP print, as well as the short-lived impact from the ECB’s recent hawkish rate hike comments, it’s hard to see what can come to the euro’s rescue if not a ceasefire in Russia-Ukraine geopolitical tensions.
EUR/USD
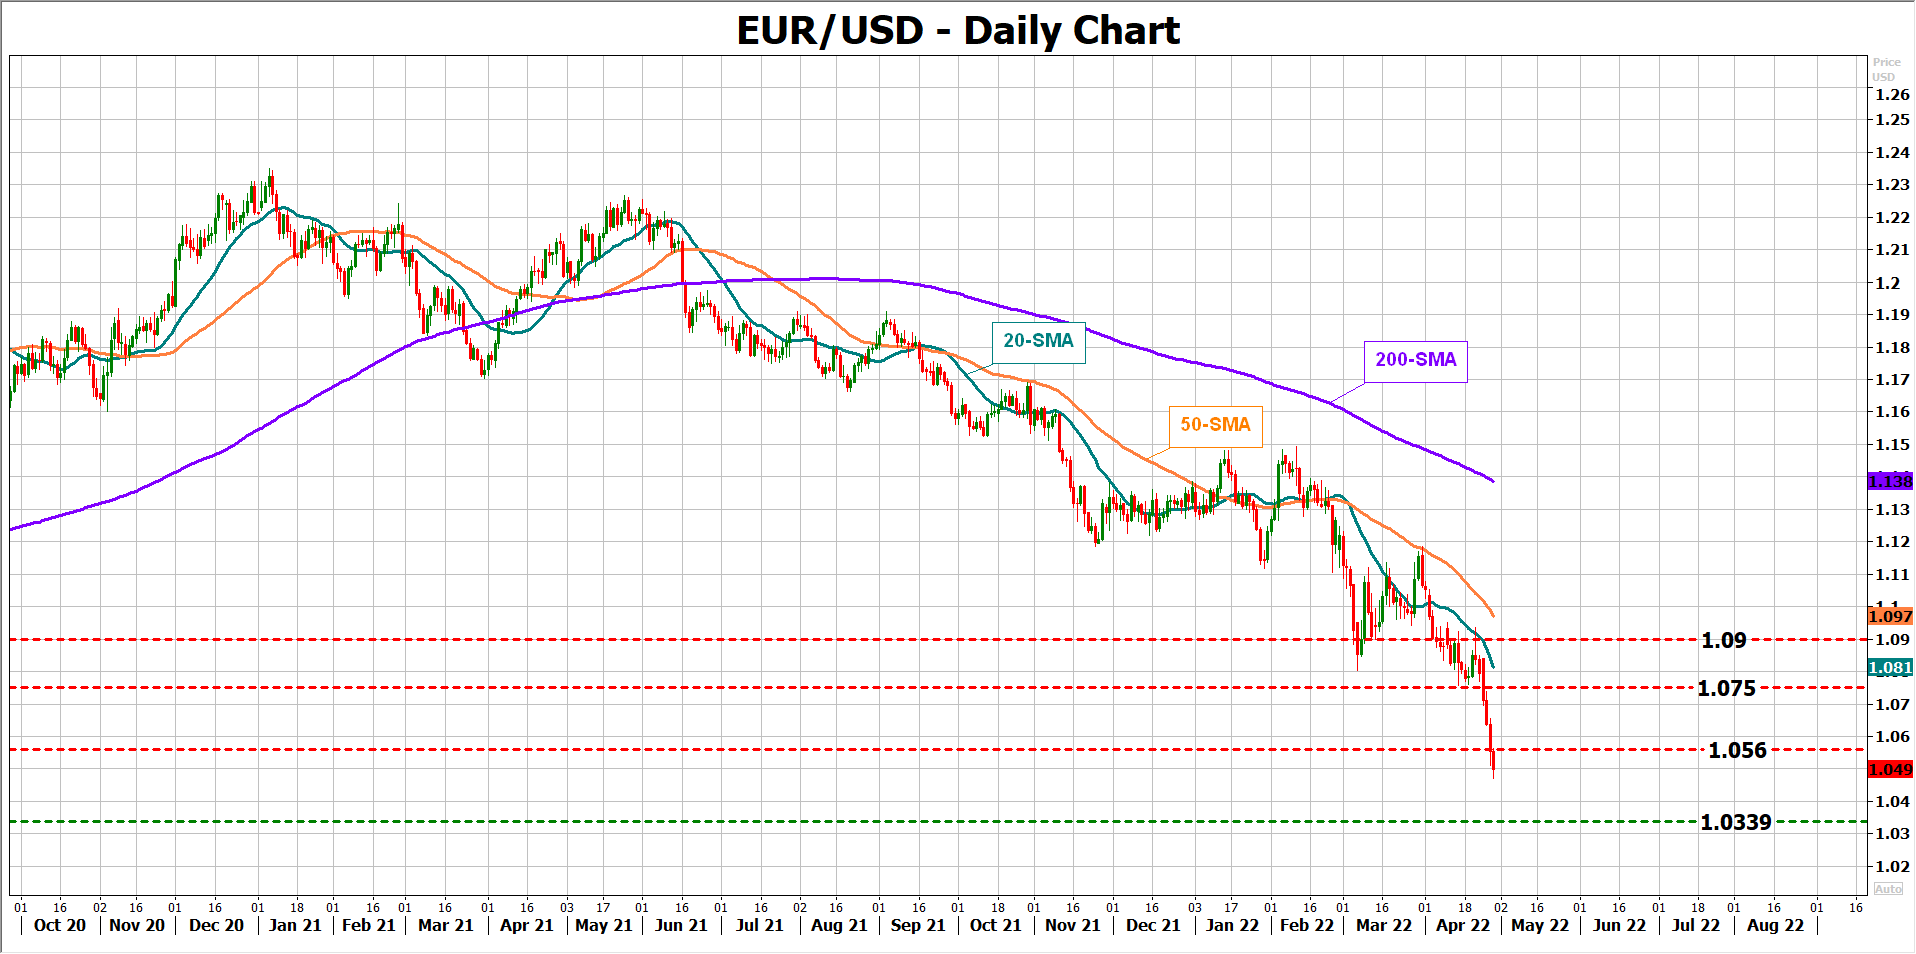
From a technical perspective, the devastating loss in euro/dollar has opened the door for the 2017 trough of 1.0335 but traders may wait for a close below 1.0500 before they engage in additional selling activities. Beneath the crucial 1.0339 threshold, the pair will re-activate the 2008 downtrend, bringing the scenario of parity back into scope after two decades.
In the event of an upside reversal, there is a nearby resistance at 1.056, which the pair needs to claim to continue towards the 1.0750 – 1.0800 region. The 1.0900 round level could be the next obstacle and perhaps the green light for an acceleration towards 1.1045.
NZDUSD Wave Analysis
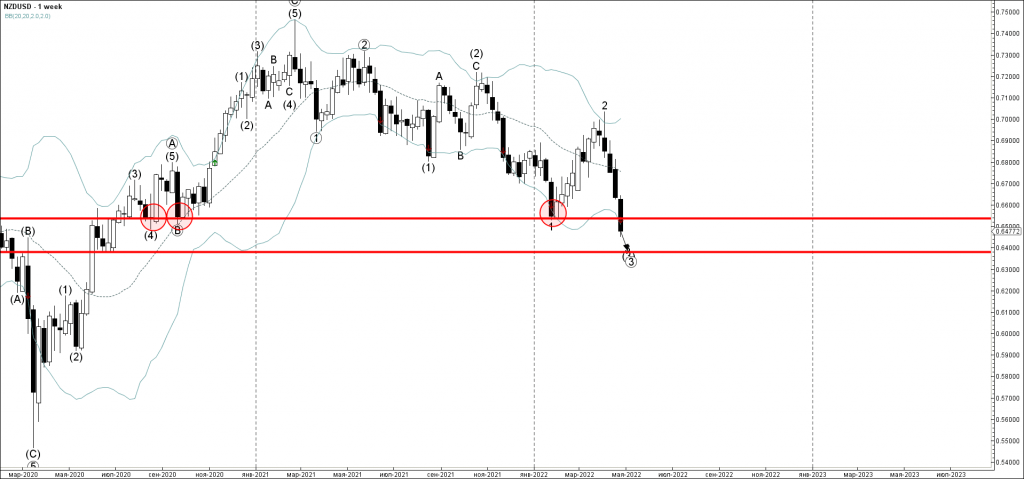
- NZDUSD broke long-term support level 0.6535
- Likely to fall to support level 0.6400
NZDUSD currency pair recently broke the long-term support level 0.6535, which has been repeatedly reversing the price from the end of 2020.
The breakout of the support level 0.6535 continues the active intermediate impulse wave (3) from last year.
NZDUSD can be expected to fall further toward the next support level 0.6400 (target price for the completion of the active impulse wave (3)).
Silver Wave Analysis
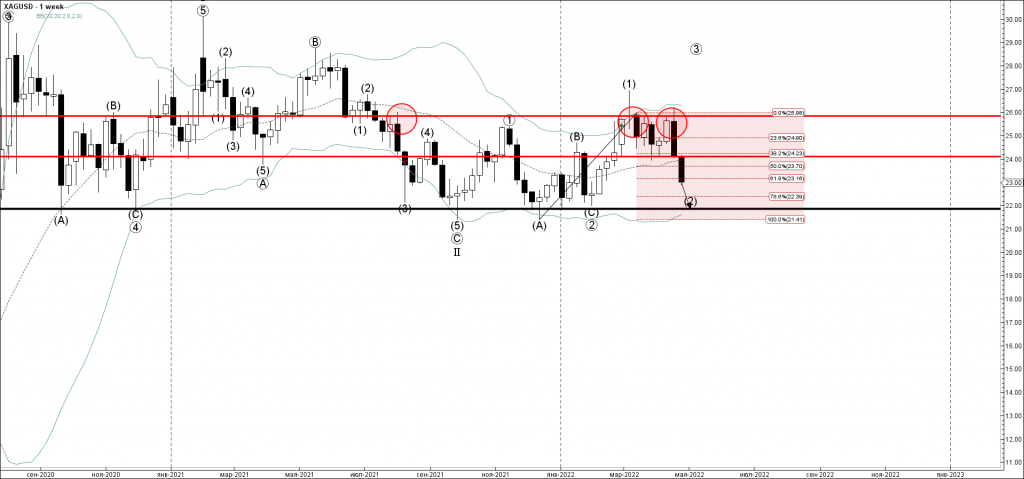
- Silver broke support level 24.00
- Likely to fall to support level 22.00
Silver recently broke the support level 24.00, intersecting with the 38.2% Fibonacci correction of the upward impulse from the end of last year.
The breakout of the support level 24.00 accelerated the active intermediate ABC correction (2).
Silver can be expected to fall further toward the next support level 22.00 (target for the completion of the active ABC correction (2)) .
FTSE 100 Wave Analysis
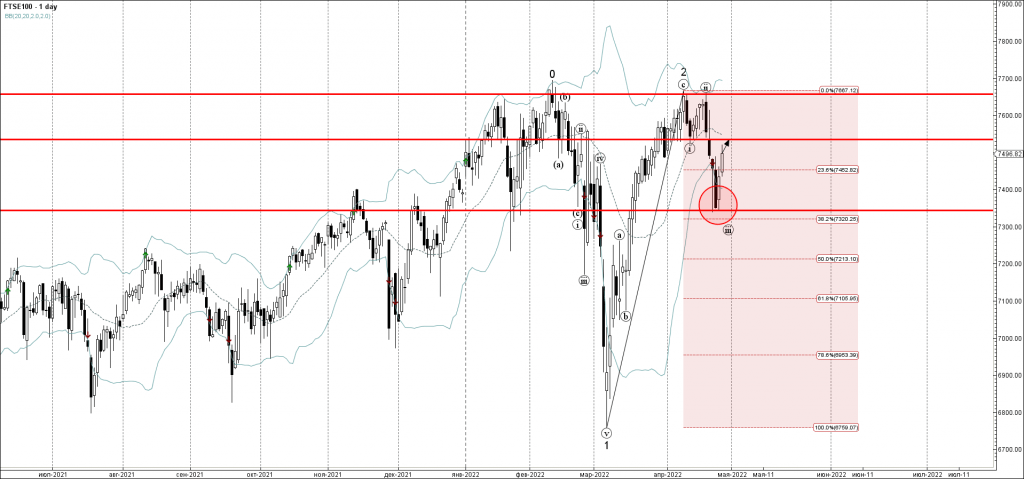
- FTSE 100 reversed from support level 7345.00
- Likely to rise to resistance level 7535.00
FTSE 100 index recently reversed up from the support level 7345.00, intersecting with the 38.2% Fibonacci correction of the upward ABC correction 2 from the start of March.
The upward reversal from the support level 7345.00 created the daily candlesticks reversal pattern Piercing Line.
FTSE 100 can be expected to rise further toward the next resistance level 7535.00 (former support from the start of April).
Elliott Wave View: FTSE Looking To Turn Lower
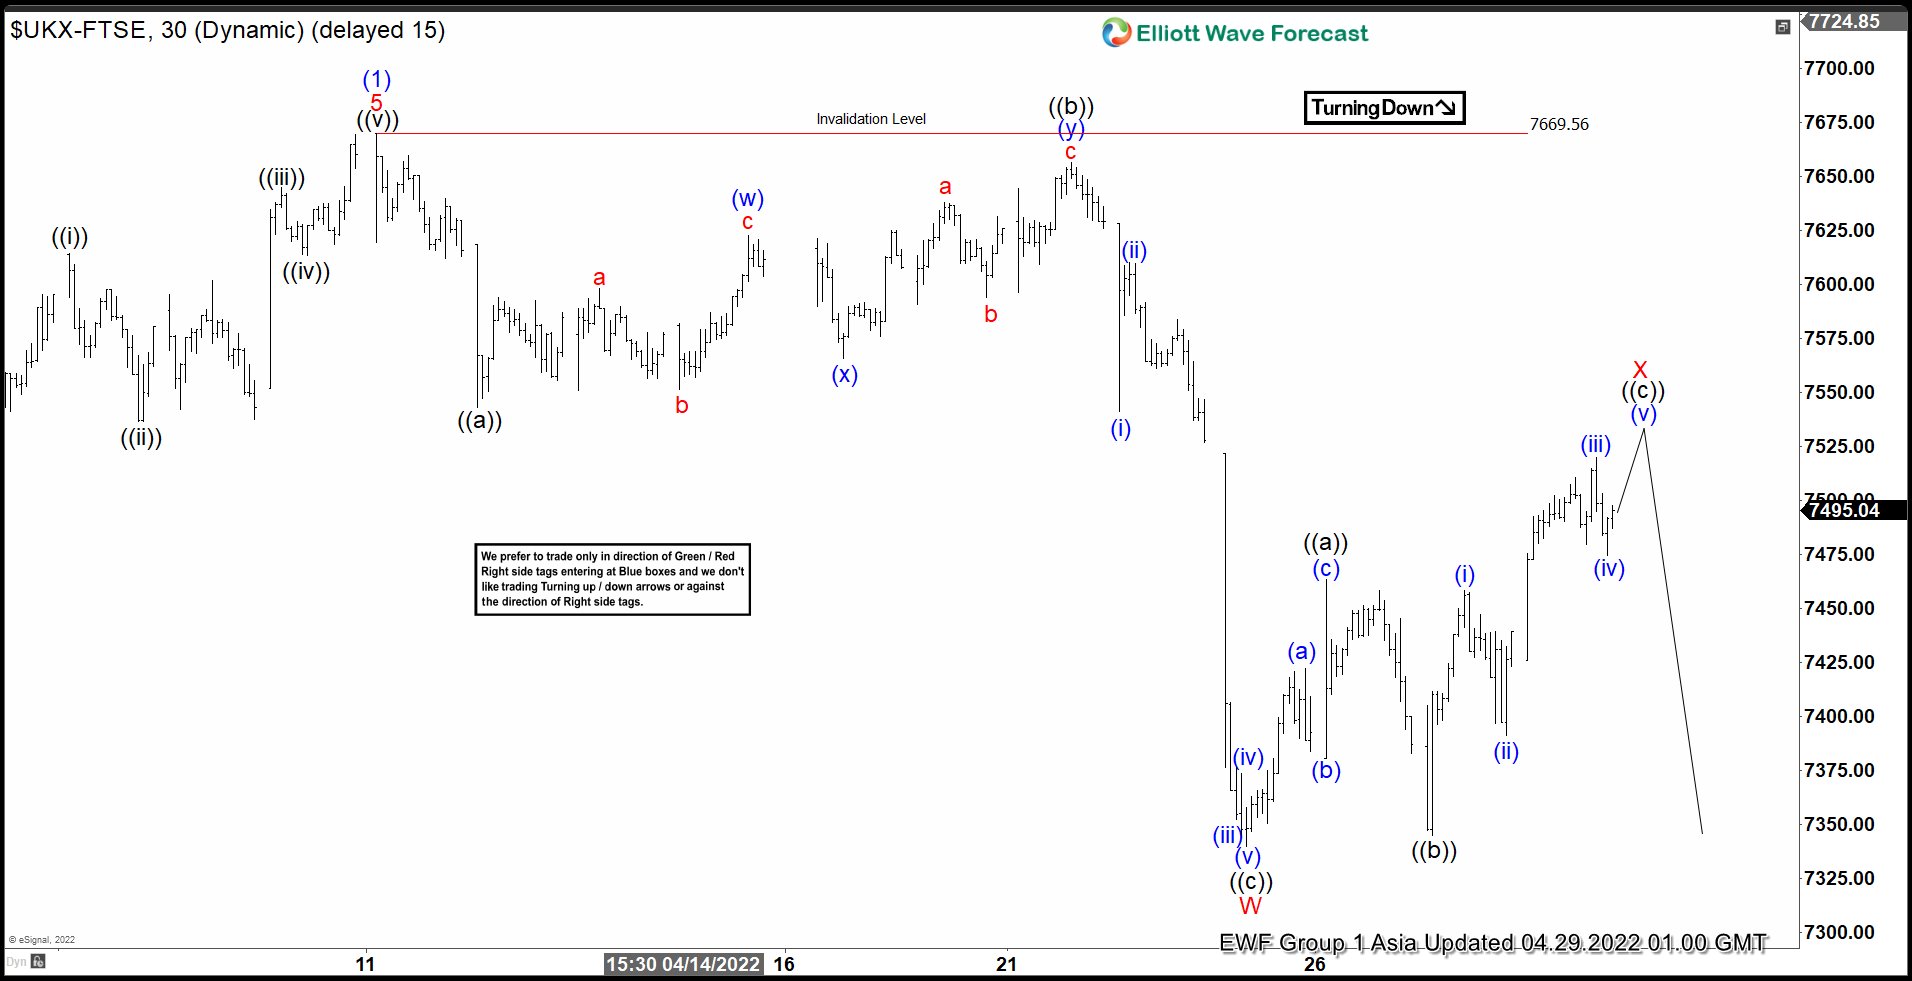
Short Term Elliott Wave View in FTSE suggests cycle from March 7, 2022 low ended at 7672.16 in wave (1). Internal subdivision of wave (1) unfolded as a 5 waves impulse Elliott Wave structure. Up from March 7 low, wave 1 ended at 7260.40 and pullback in wave 2 ended at 7075.82. Index then extended higher in wave 3 towards 7595.42, and dips in wave 4 ended at 7508.92. Final leg higher wave 5 ended at 7669.56 which completed wave (1).
Wave (2) pullback is in progress as a double three Elliott Wave structure. Down from wave (1), wave ((a)) ended at 7543.03 and rally in wave ((b)) ended at 7656.47. Wave ((c)) lower ended at 7339.53 which also completed wave W. Wave X corrective rally is now ongoing with internal subdivision as a flat. Up from wave W, wave ((a)) ended at 7463.15 and wave ((b)) ended at 7344.89. Expect wave ((c)) of X to end soon as 5 waves and the Index should then turn lower. Near term, as far as pivot at 7669.56 high remains intact, expect wave X rally to fail in 3, 7, 11 swing for further downside.
FTSE 30 Minutes Elliott Wave Chart
Slumping Euro Drops Below 1.05
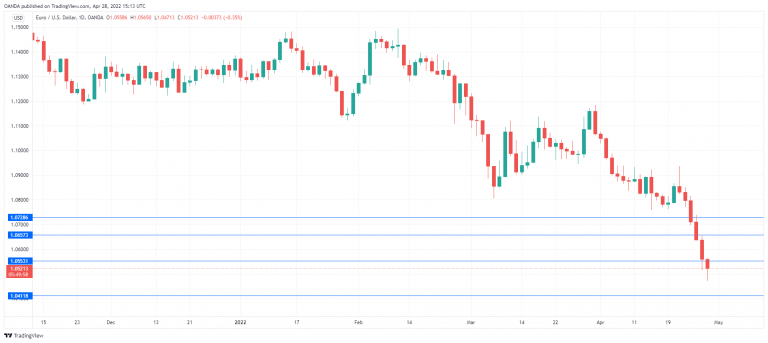
The euro has extended its slide on Thursday and fell as low as 1.0471 in the European session, before clawing back above the 1.05 line.
Wobbly euro extends slide
It has been a nasty ride for the euro, which can’t seem to get a break. EUR/USD is down for a sixth successive day. The euro is struggling at levels not seen since March 2017, and is down over 5 per cent in the month of April. News out of Russia is compounding the currency’s fall. Russia has banned gas exports to Poland and Bulgaria after they refused to pay in Russian roubles, as Moscow continues to weaponize its energy supplies in order to combat sanctions. The plot thickens, with reports that some European energy companies have agreed to pay Russia in roubles. This could be a violation of sanctions and would put those companies on a collision course with their governments and that could spell trouble for the euro.
Aside from the grim news out of Russia, the hawkish Federal Reserve is also weighing on the euro, as the US/Europe rate differential continues to widen. US Treasury yields rose on Thursday, and even a shock contraction in US GDP didn’t stop yields from rising, with the 10-year yield edging higher to 2.85%. The CME’s Fed Watch has pegged the odds of a half-point rate hike at 96%, and the Fed has telegraphed to the markets that more half-point increases are on the table.
With the war in Ukraine showing no signs of ending and the Fed in full throttle, the outlook for the euro looks bleak, with the currency on track to break below 1.03 and perhaps fall to parity.
EUR/USD Technical
- EUR/USD has broken through support at 1.0553. Below, there is support at 1.0411
- There is resistance at 1.0657 and 1.0728
ETHUSD Pauses Retreat But Negative Bias Holds
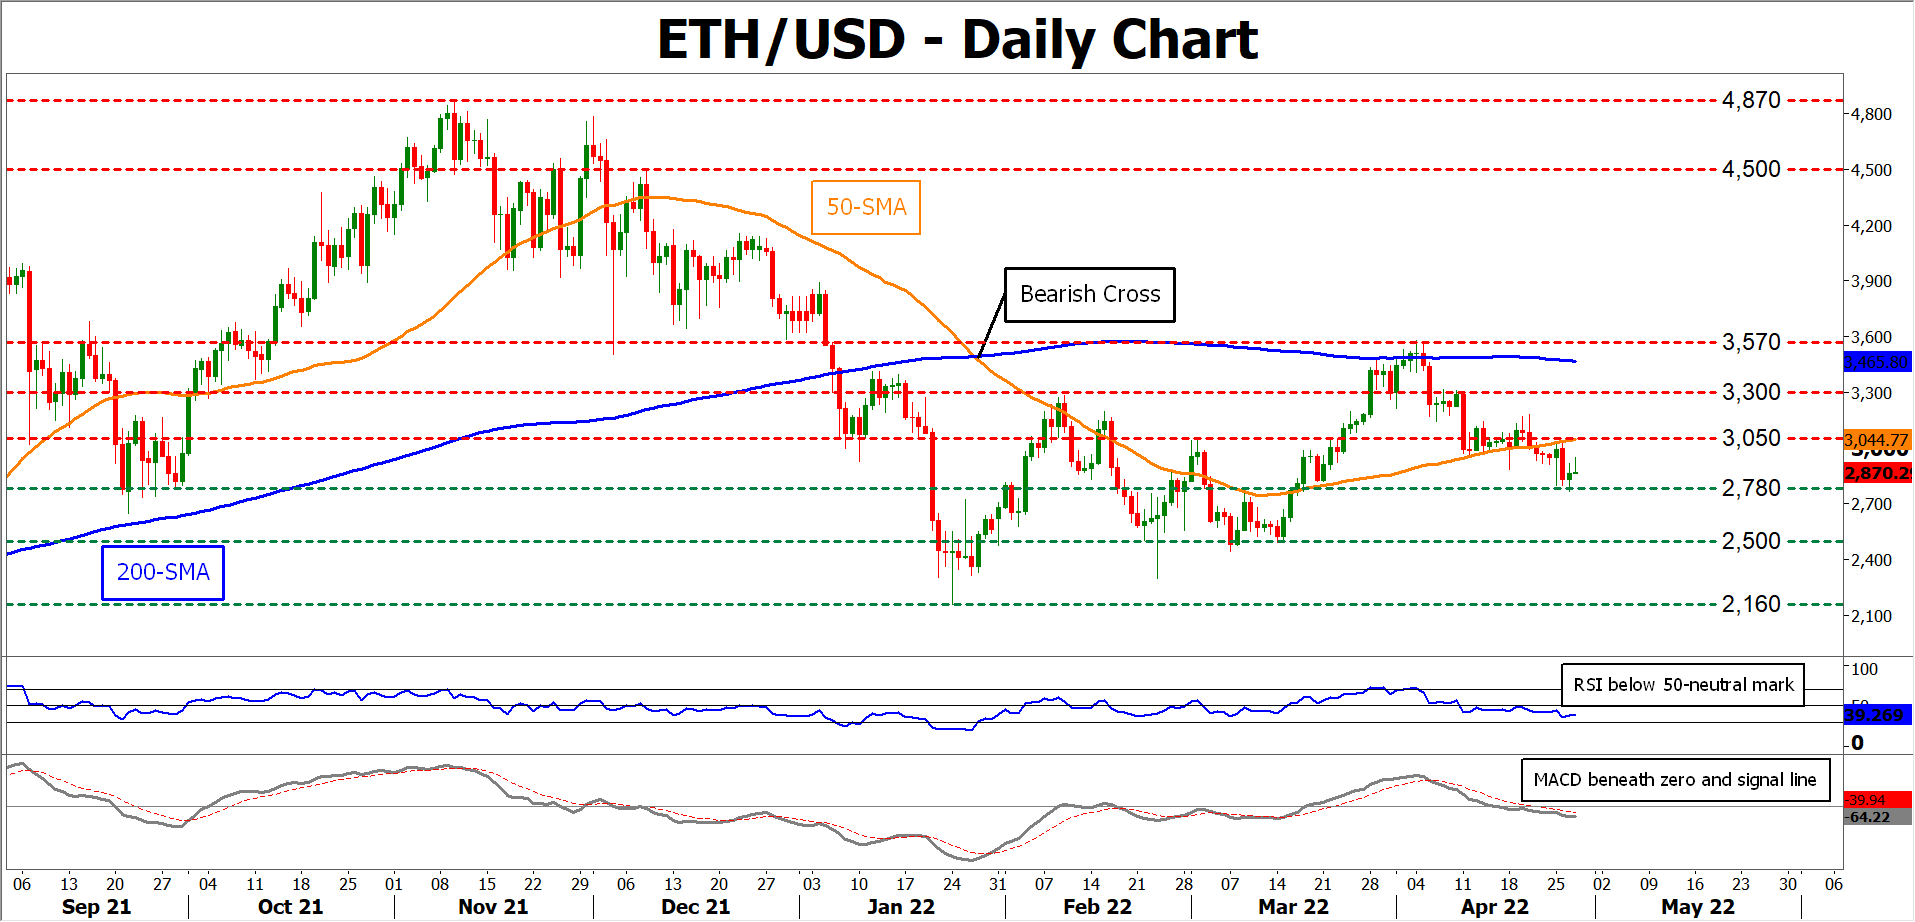
ETHUSD (Ethereum) has been trending downwards since early April when the 3,570 region rejected its upside impetus. Although the cryptocurrency found its feet in the last couple of sessions, it currently appears to be lacking the necessary momentum to storm higher.
The short-term oscillators reflect that the bearish forces are retaining control. The MACD histogram is currently below both zero and its red signal line, while the RSI is hovering beneath its 50-neutral threshold.
Should negative momentum intensify further, the price could challenge the recent low of 2,780. Piercing through this level, the bears might aim for the March strong support region of 2,500. If that floor collapses, further downside moves could reverse at the 2,160 hurdle, which is the lowest price level observed in 2022.
On the flipside, if bullish forces emerge and regain the upper hand, immediate resistance could be met at the 3,050 region, which overlaps with the 200-day simple moving average (SMA). Conquering this barricade, the spotlight may turn to 3,300 before the price tests its recent reversion point of 3,570. A jump above the latter obstacle could pave the way for the 4,500 barrier.
Overall, even if ETHUSD managed to halt its decline, the overall outlook remains bearish. For that negative tone to alter, the price needs to initially jump beyond the 3,050 mark.
Fed Research – Preview: 50bp Rate Hike
Key takeaways
- We expect the Federal Reserve to hike the target range by 50bp, a view shared by consensus and market pricing. We expect the Fed to signal that more 50bp rate hikes are likely in coming months in order to get quicker back to neutral.
- We expect the Fed to announce the balance sheet runoff to start in mid-May. We expect the cap to be set at USD95bn as outlined in the minutes.
- Our current Fed call is that the Fed will hike by 50bp in May, June and July and 25bp in September, November and December (a total of 225bp). We still see risks skewed towards faster rate hikes, as monetary policy remains too accommodative.
- FX: At present, we forecast EUR/USD in 1.05 in 12M and we see downside risks to this estimate.
- FI: We forecast that 10Y UST yields will move above 3% over the next three months. We have a 3.10% six months target.