

Sample Category Title
Technical Outlook and Review
DXY:
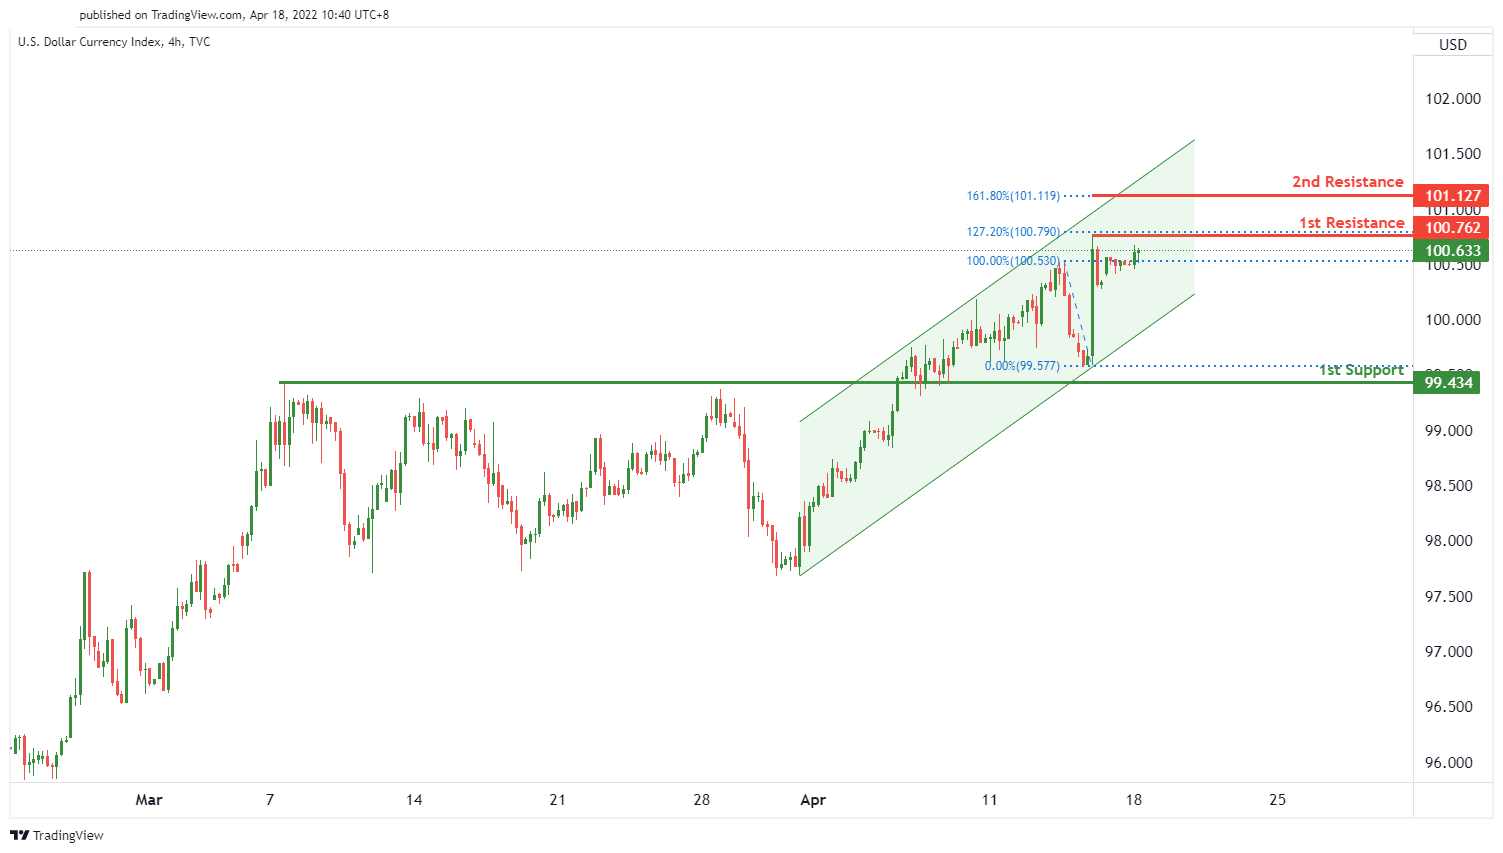
Price is near key pivot level. We see a potential for bearish reversal from 1st resistance level of 100.762 in line with 127.2% Fibonacci extension towards the 1st support level of 99.434 along with a graphical pullback support. Alternatively, price might continue to rise to 2nd resistance level of 101.127 in line with 161.8% Fibonacci extension.
Areas of consideration:
- H4 time frame, 1st resistance at 100.762
- H4 time frame, 2nd resistance at 101.127
- H4 time frame, 1st support at 99.434
XAU/USD (GOLD):
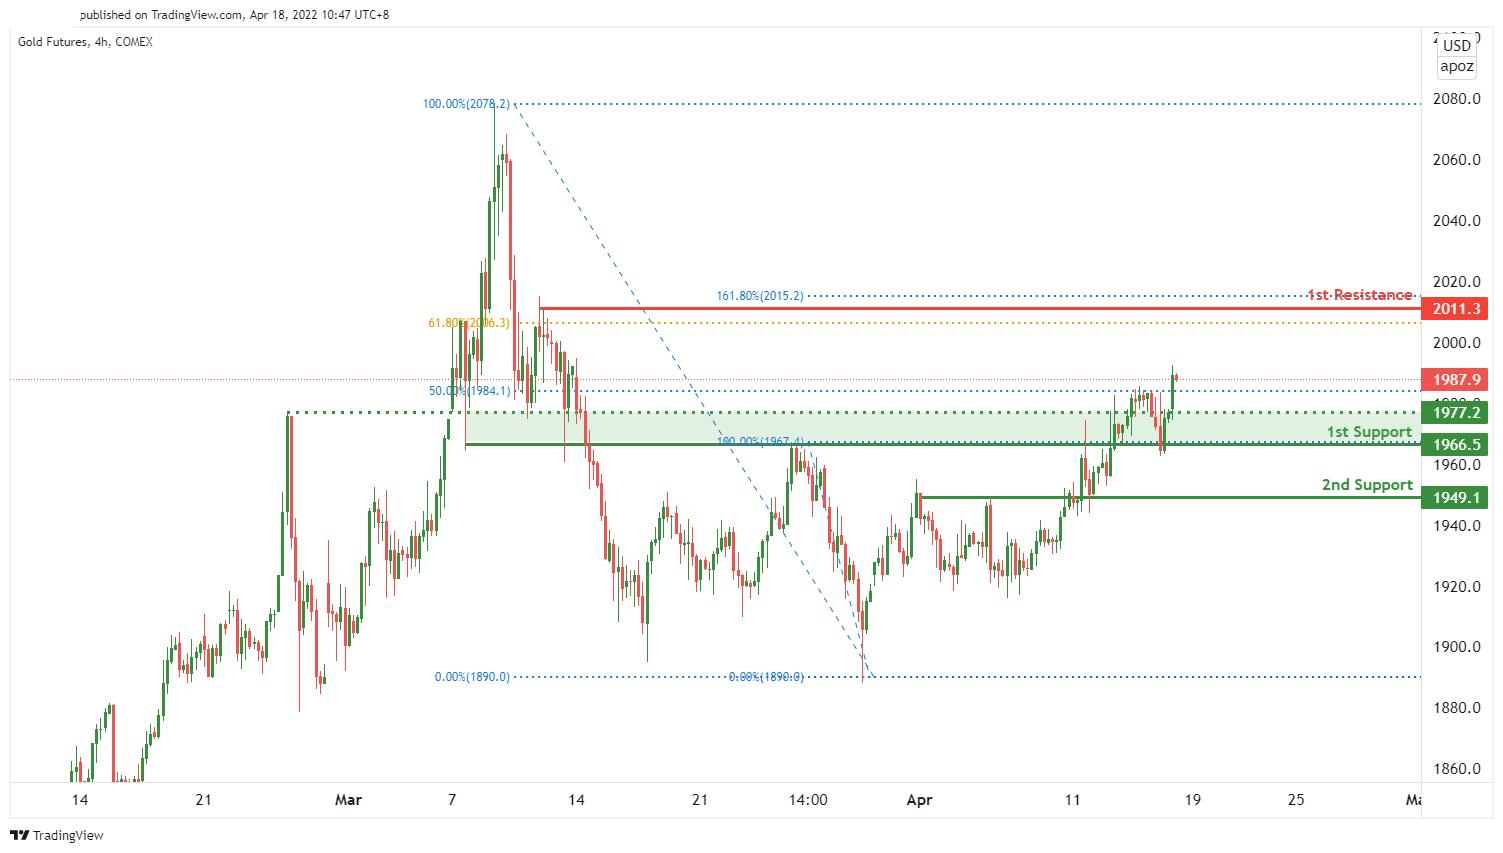
We expect price to be on a bullish continuation from 1st support level of 1966.5 in line with graphical pullback support towards the 1st resistance level of 2011.3 in line with 161.8% Fibonacci extension and 61.8% Fibonacci retracement. Alternatively, price might break through the key support level and drop to the 2nd support level of 1949.1 in line with graphical pullback support
Areas of consideration:
- H4 time frame, 1st Resistance at 2011.3
- H4 time frame, 1st Support at 1966.5
- H4 time frame, 2nd Support at 1949.1
GBP/USD:
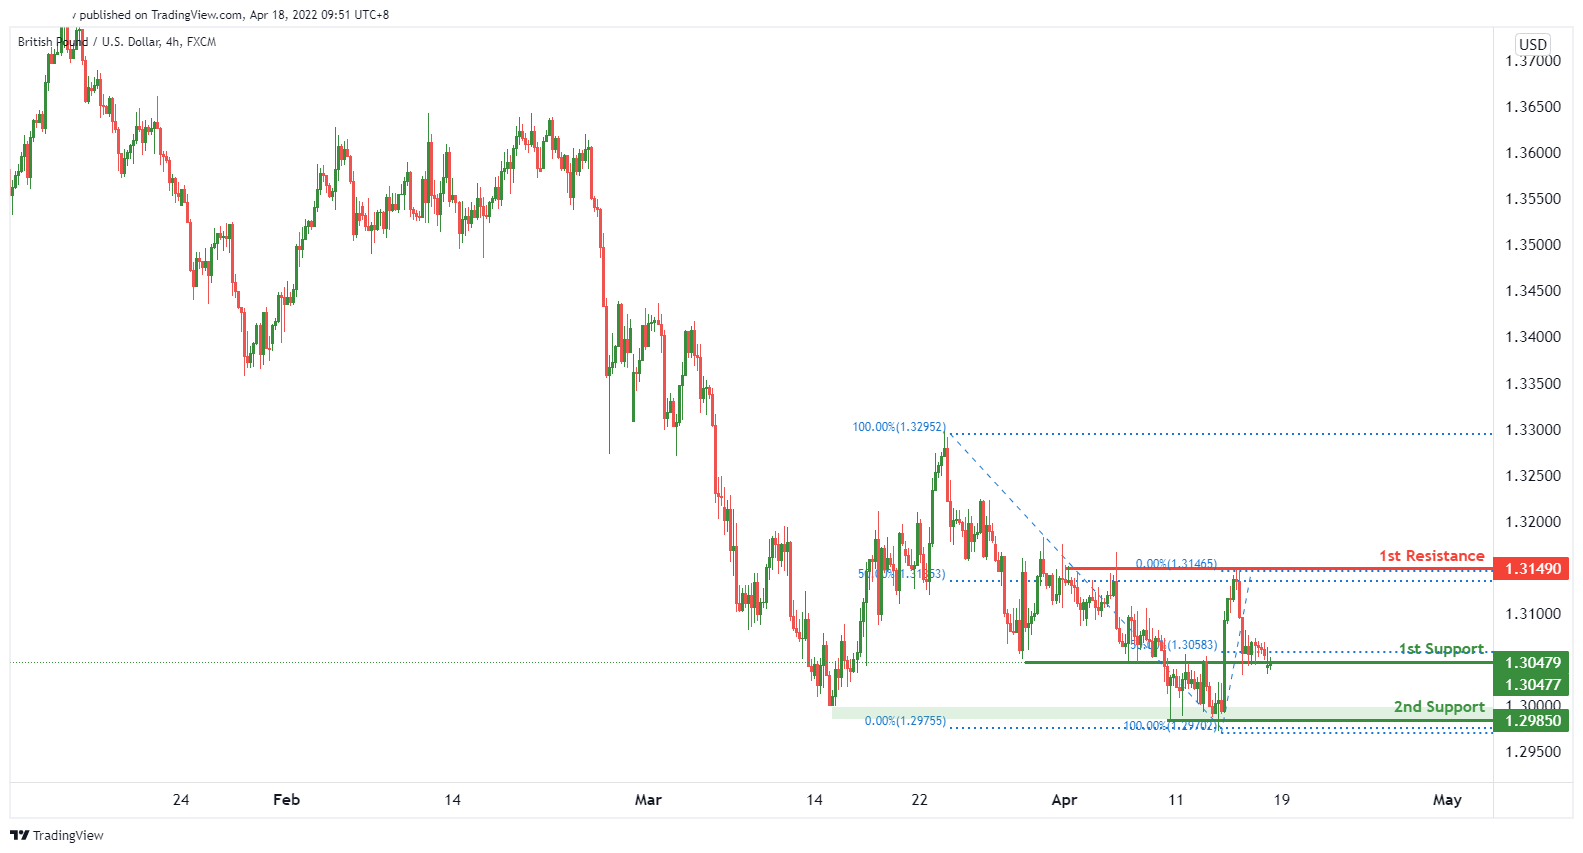
On the H4 timeframe, we expect to see a potential for bullish bounce from 1st support level of 1.30477 in line with and 50% retracement towards the 1st resistance level of 1.31490 in line with 50% Fibonacci retracement.
Areas of consideration:
- H4 1st resistance at 1.31490
- H4 1st support at 1.30477
USD/CHF:
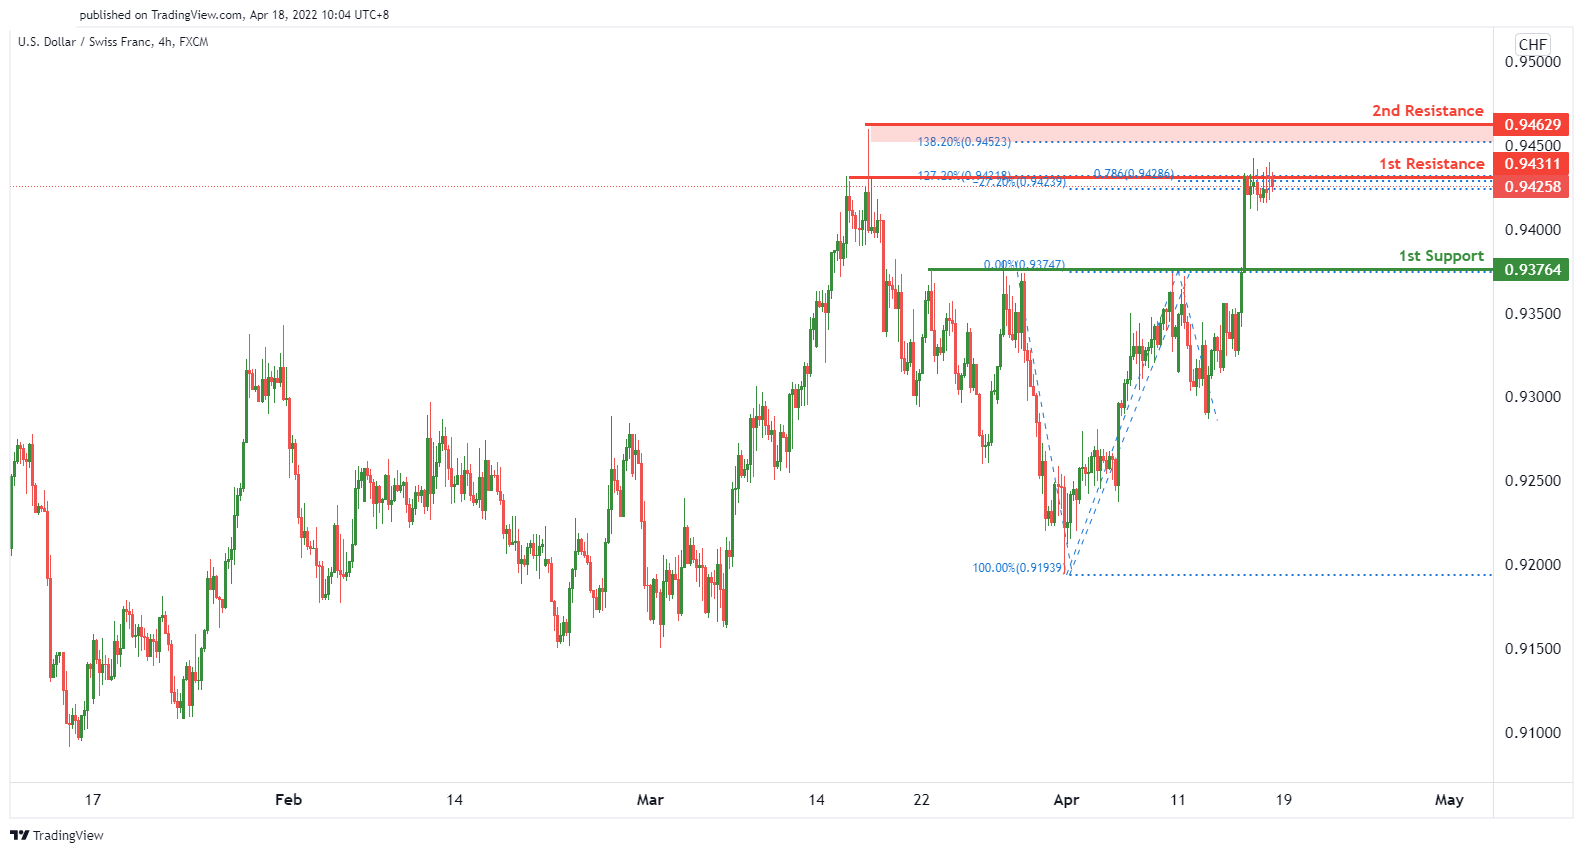
On the H4, we see the potential for bearish reversal from our 1st resistance at 0.94311 in line with 78.6% FIbonacci projection, 127.2% Fibonacci extension and -27.2% Fibonacci expansion towards our 1st support at 0.93764 which is in line with a graphical pullback support. Alternatively, price might break through the key resistance level and head towards the 2nd resistance level of 0.94629 which lines up with 138.2% Fibonacci extension.
Areas of consideration
- 1st support level at 0.93764
- 1st resistance level at 0.94311
- 2nd resistance level at 0.94629
EUR/USD :
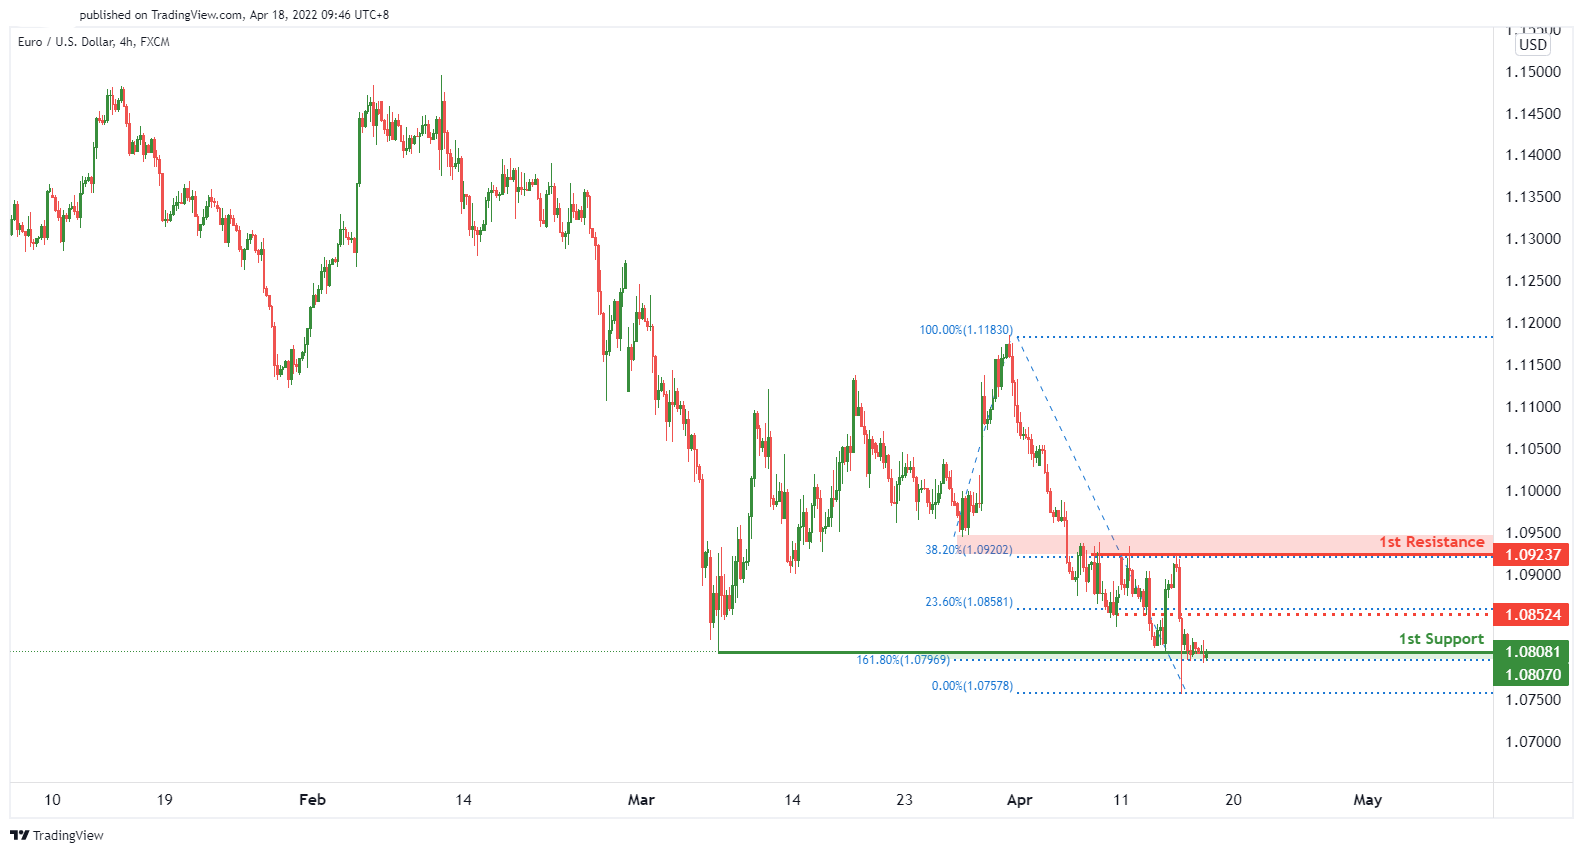
On the H4 timeframe, price is near a key pivot. We see the potential for a bullish bounce from our 1st support level of 1.08070 in line with 161.8% Fibonacci extension towards our 1st resistance level of 1.09237 in line with 38.2% Fibonacci retracement.
Areas of consideration :
- H4 1st resistance at 1.09237
- H4 1st support at 1.08070
USD/JPY:
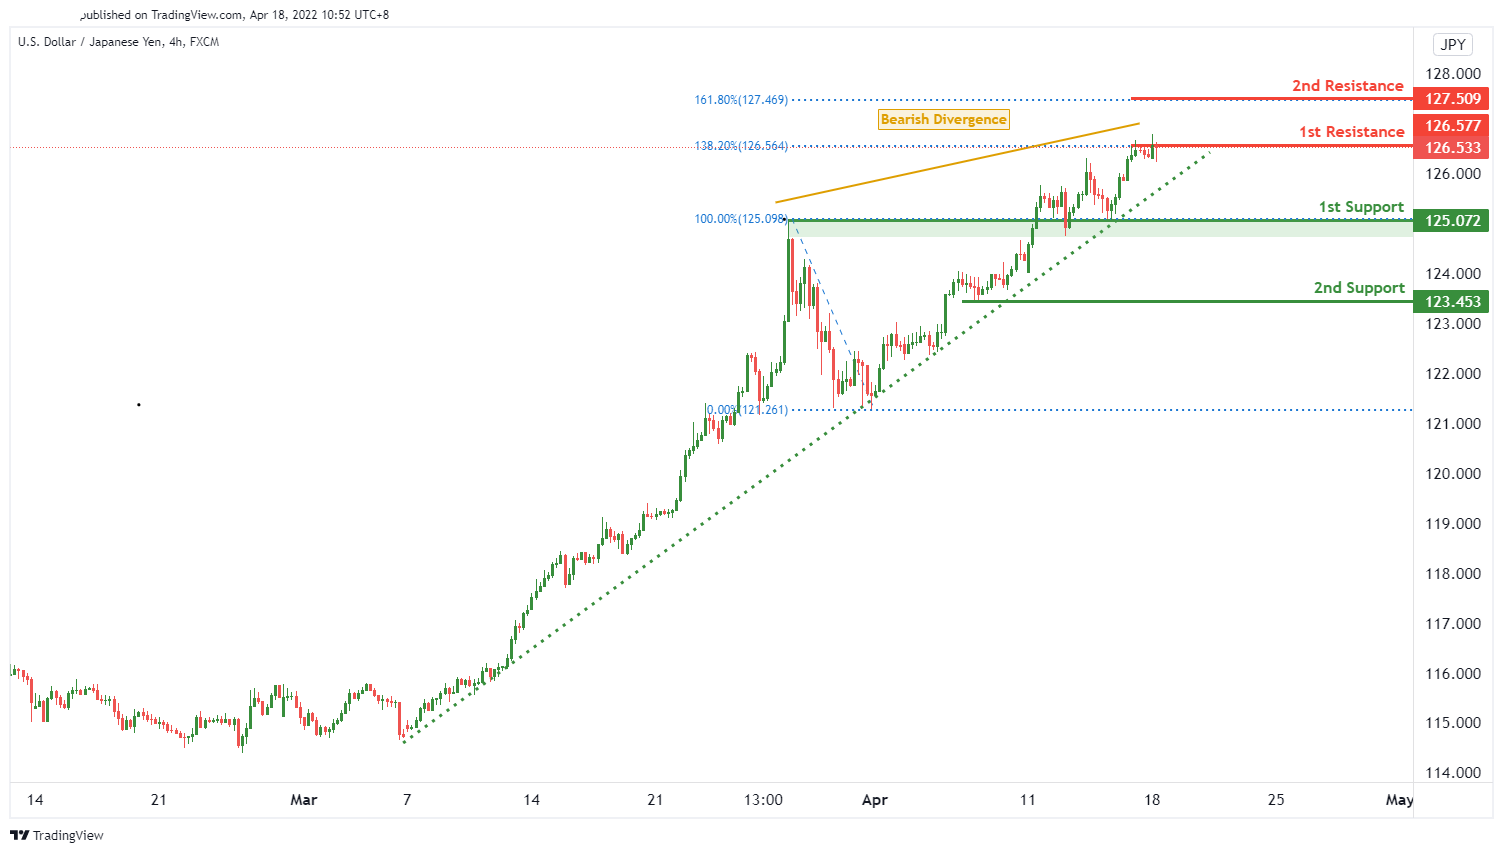
We expect price to have a bearish reversal from 1st resistance level of 126.577 in line with 138.2% fibonacci extension towards the 1st support level of 125.072 in line with graphical pullback support. Alternatively, price could continue to rise to 2nd resistance of 127.509 in line with 161.8% Fibonacci extension.
Areas of consideration:
- H4 time frame, 1st resistance at 126.577
- H4 time frame, 2nd resistance at 127.509
- H4 time frame, 1st support at 125.072
- H4 time frame, 2nd support at 123.453
AUD/USD:
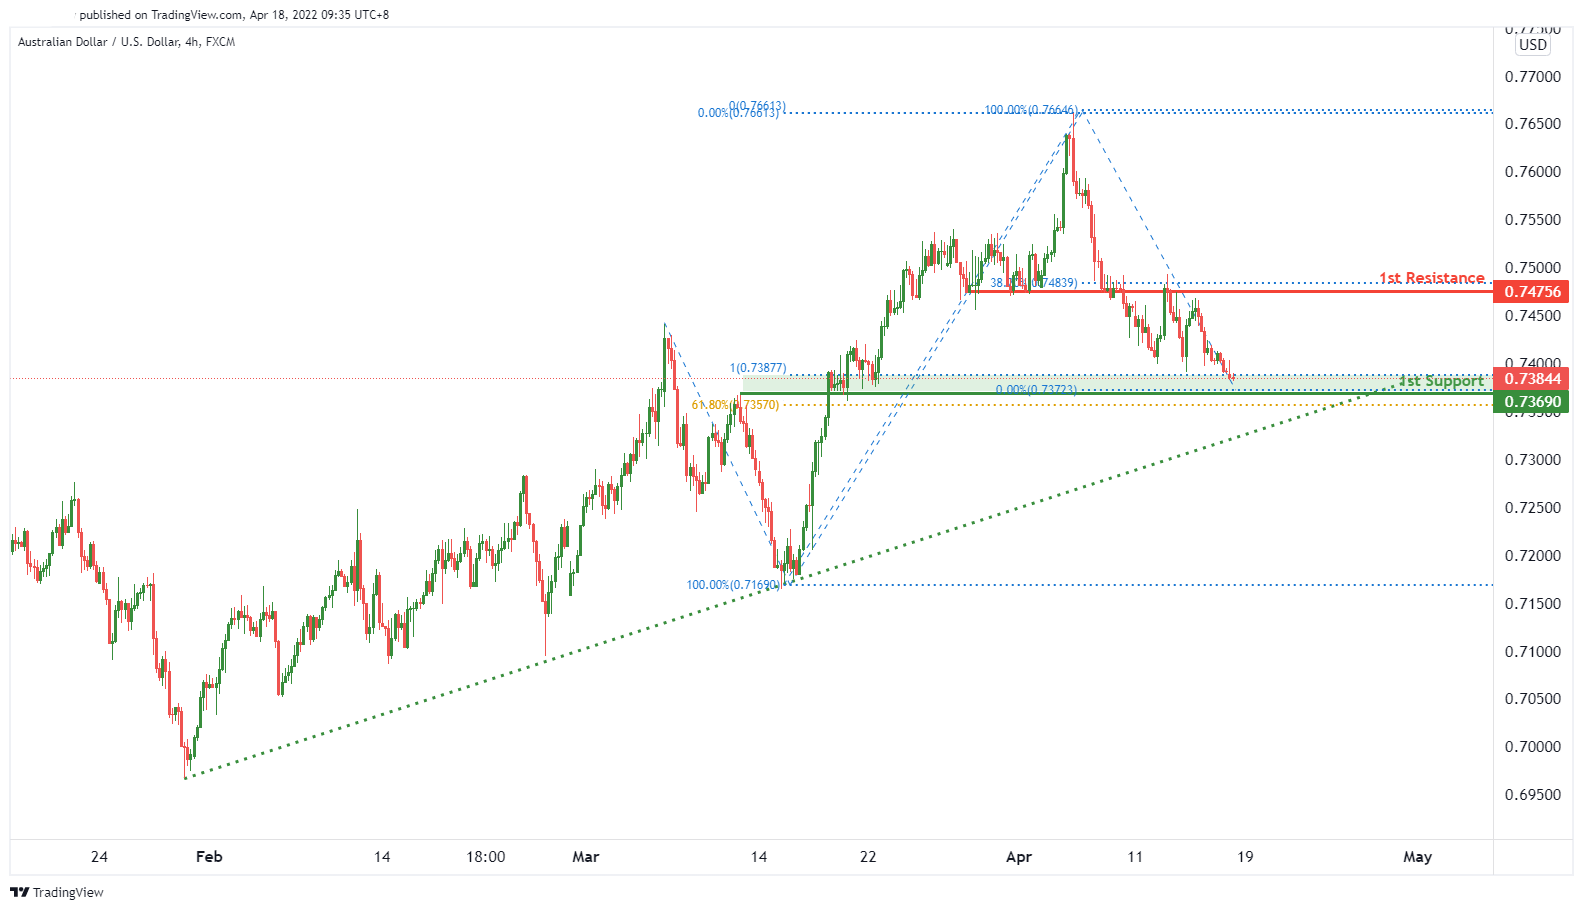
On the H4 timeframe, we see the potential for a bullish bounce from our 1st support level at 0.73690 in line with 61.8% Fibonacci retracement and 100% Fibonacci projection towards our 1st resistance level at 0.74756 in line with 38.2% Fibonacci retracement.
Areas of consideration
- H4 1st resistance at 0.74756
- H4 1st support at 0.73690
NZD/USD:
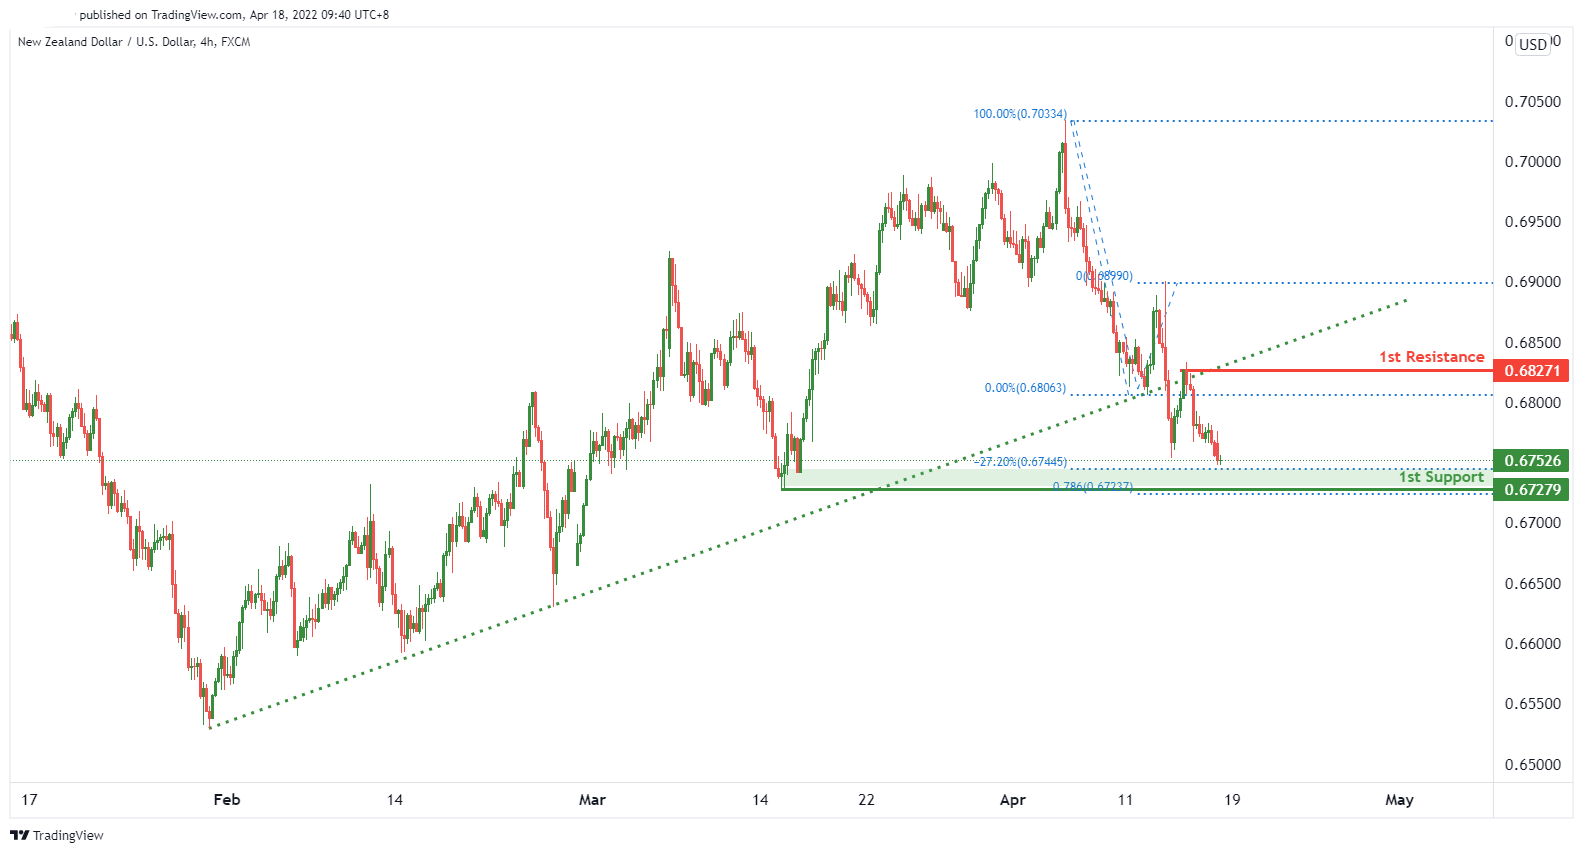
On the H4, we expect to see a potential for a bullish continuation from our 1st support of 0.67279 in line with 78.6% Fibonacci projection and -27.2% Fibonacci expansion towards our 1st resistance level at 0.68271 in line with graphical swing high resistance.
Areas of consideration:
- H4 time frame, 1st support at 0.67279
- H4 time frame, 1st resistance at 0.68271
USD/CAD:
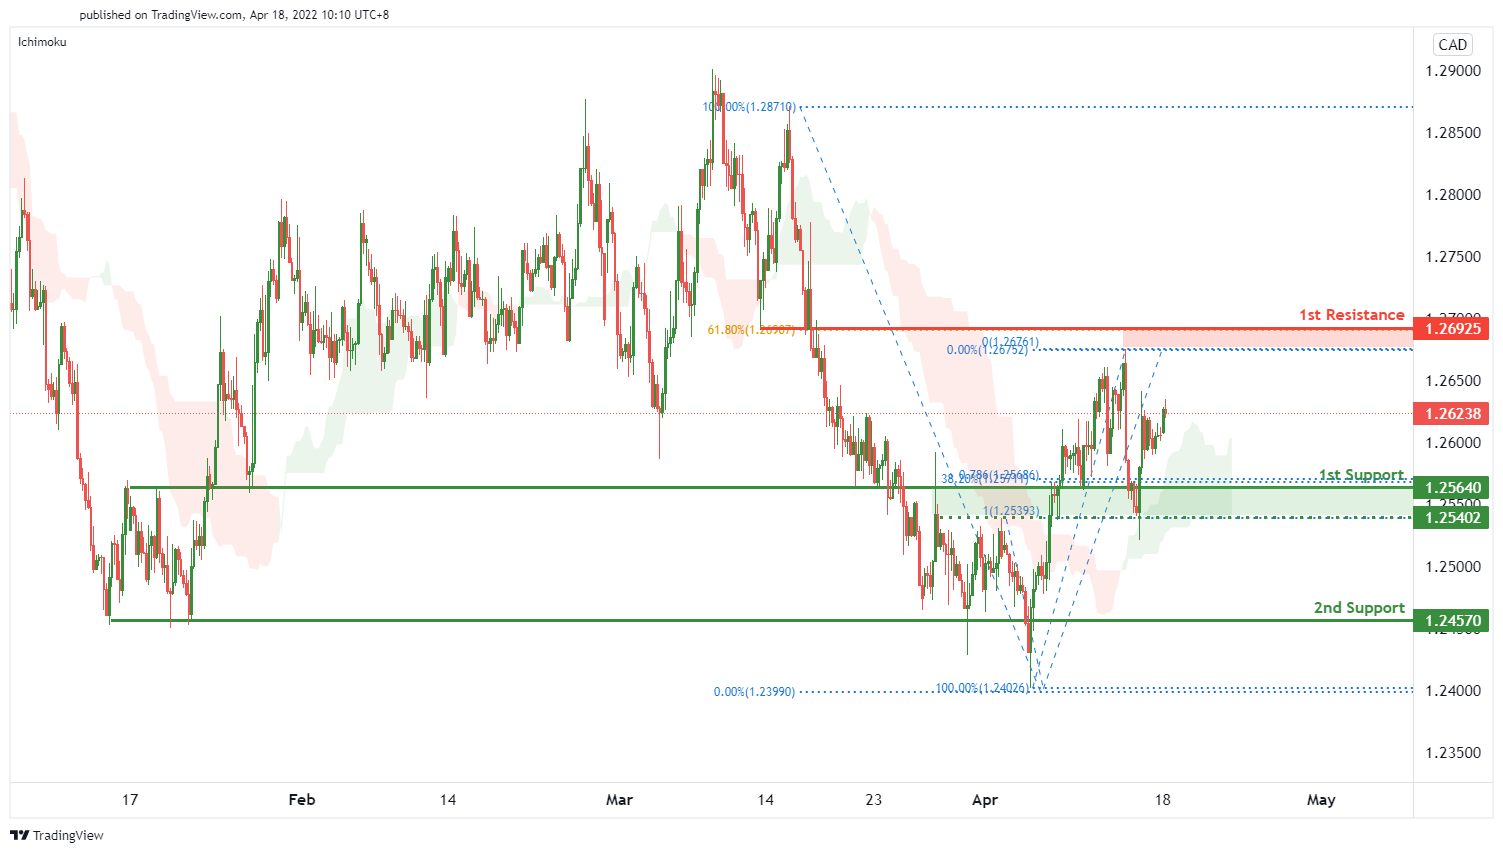
We expect price to be on a bullish continuation from 1st support level of 1.25640 in line with 38.2% Fibonacci retracement and 78.6% Fibonacci projection towards the 1st resistance of 1.26925 in line with 61.8% Fibonacci projection. Our bullish bias is further supported by price trading above ichimoku cloud.
Areas of consideration:
- H4 time frame, 1st resistance at 1.26925
- H4 time frame, 1st support at 1.25640
- H4 time frame, 2nd support at 1.24570
OIL:
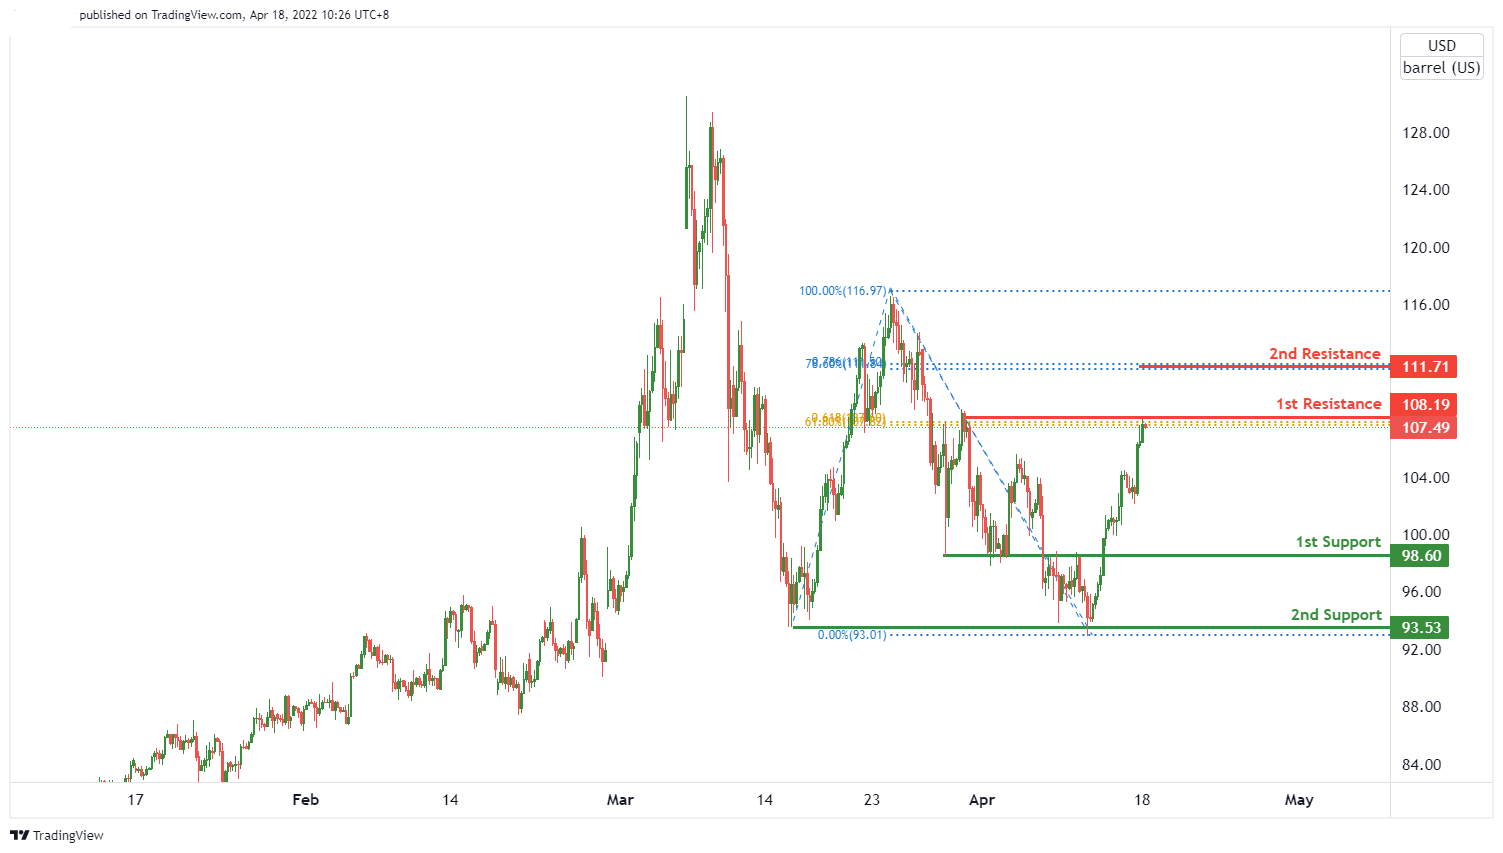
Price is near to the key pivot level. We are expecting oil price to go for a bearish reversal from 1st resistance level of 108.19 in line with 61.8% Fibonacci retracement and 61.8% Fibonacci projection towards the 1st support level of 98.6% lines up with graphical bullback support.
Areas of consideration:
- H4 time frame, 1st resistance of 108.19
- H4 time frame, 2nd resistance of 111.71
- H4 time frame, 1st support of 98.60
- H4 time frame, 2nd support at 93.53
Dow Jones Industrial Average:
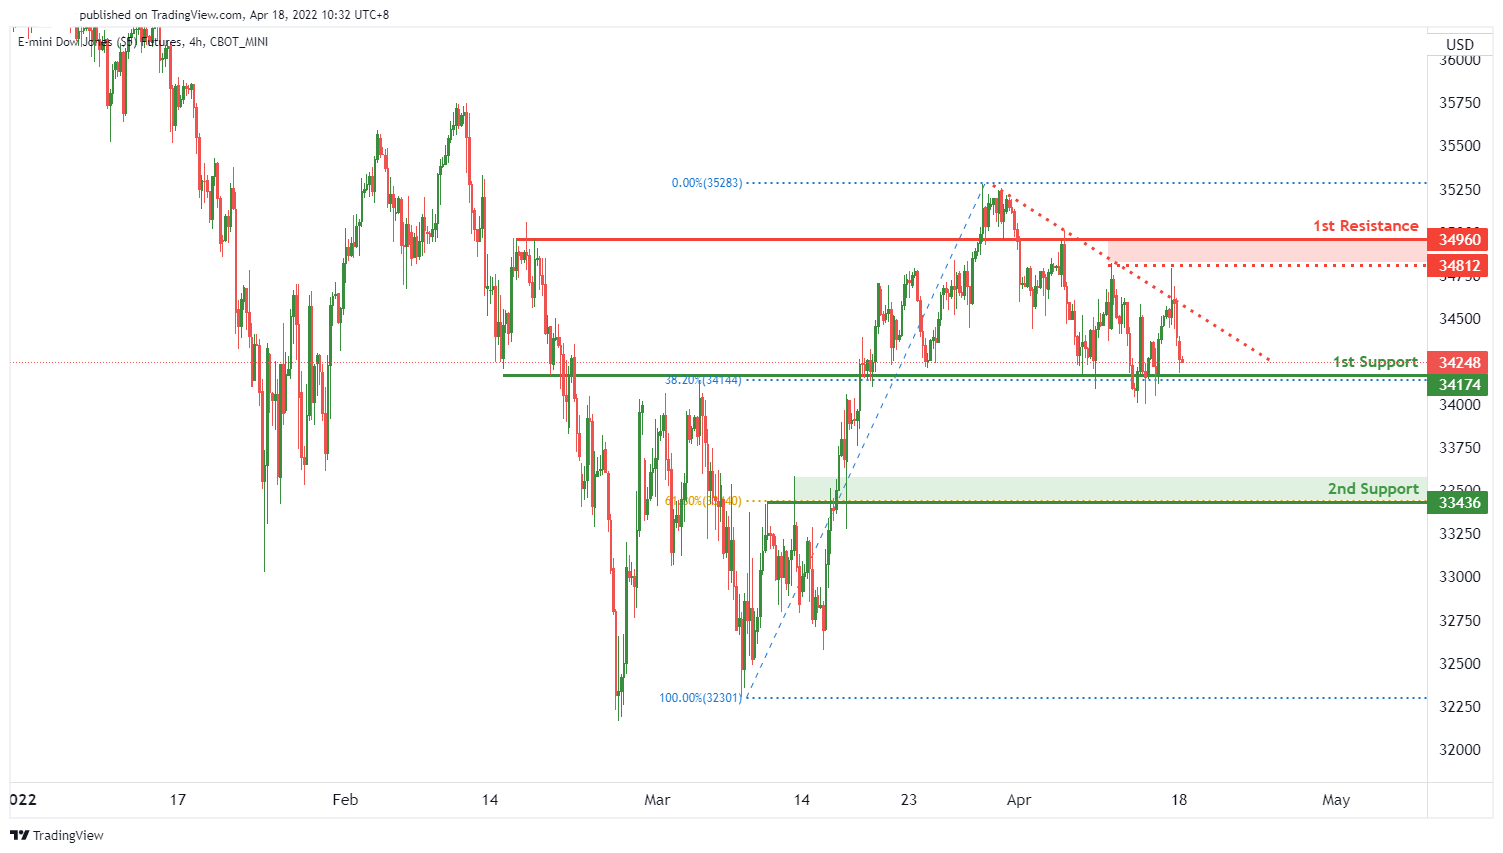
Price is near to the pivot level. We can see a potential for a bullish bounce from 1st support level of 34174 lines up with 38.2% fibonacci retracement, along with a pullback support towards the 1st resistance level of 34960 lines up with previous graphical swing high resistance.
Areas of consideration :
- H4 time frame, 1st resistance at 34960
- H4 time frame, 1st support at 34174
- H4 time frame, 2nd support at 33436
EUR/USD At Risk of More Downsides Below 1.0750
Key Highlights
- EUR/USD extended decline below the 1.0820 support.
- A key bearish trend line is forming with resistance near 1.0915 on the 4-hours chart.
- GBP/USD could accelerate lower if it settles below 1.3000.
- USD/JPY traded to a new multi-year high above 126.00.
EUR/USD Technical Analysis
The Euro started a major decline from well above the 1.0850 level against the US Dollar. EUR/USD declined below the 1.0800 support level to move into a bearish zone.
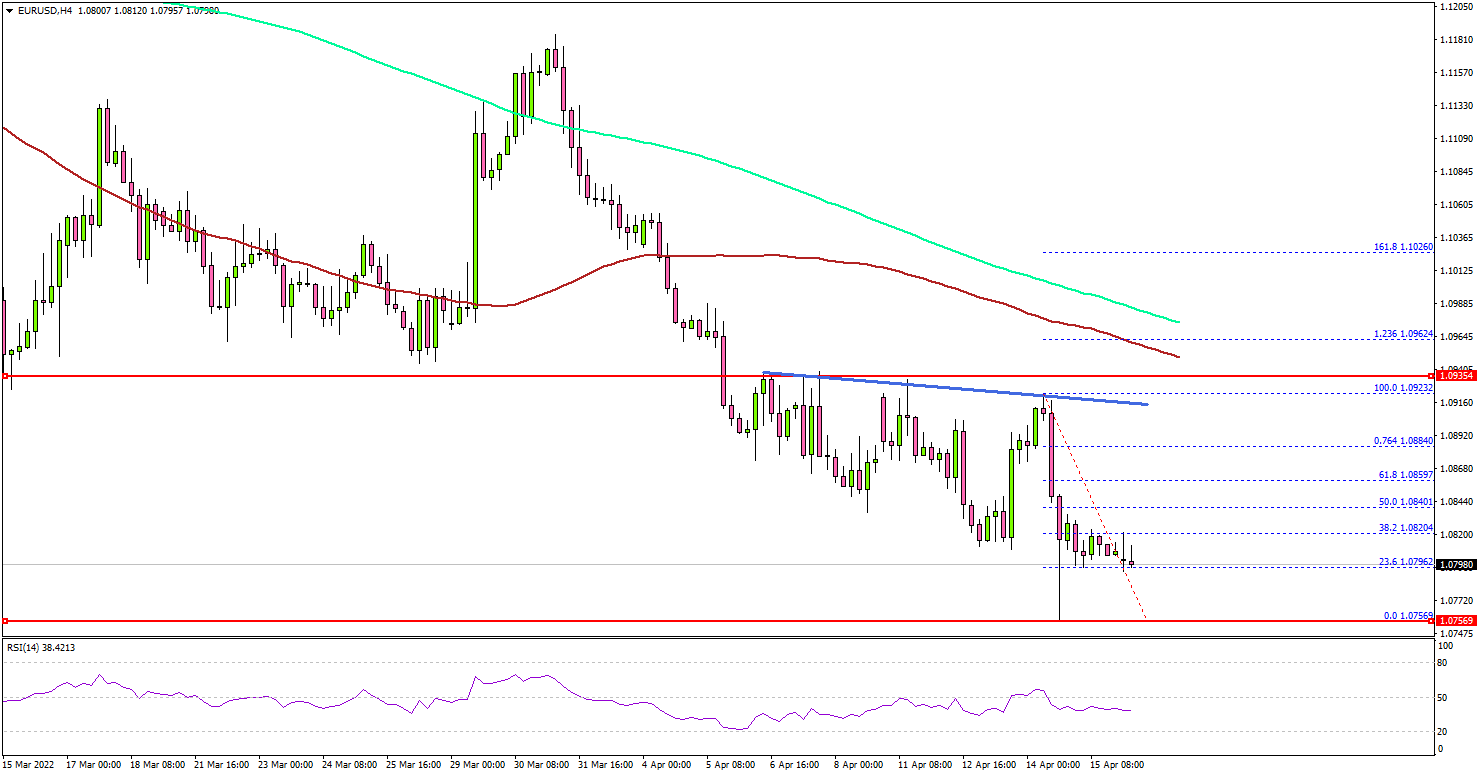
Looking at the 4-hours chart, the pair attempted a recovery wave from the 1.0756 low. However, it stayed below the 1.0850 pivot level, the 200 simple moving average (green, 4-hours), and the 100 simple moving average (red, 4-hours).
It is now consolidating near the 1.0800 level. An initial support on the downside is near the 1.0780 level. The next major support is near the 1.0750 level. A downside break below the 1.0750 support level might accelerate losses.
The next major support is near the 1.0680 level. If there is an upside correction, the pair might face resistance near the 1.0840 level.
The next major resistance is near the 1.0860 level, above which it could rise towards the 1.0900. There is also a key bearish trend line forming with resistance near 1.0915 on the same chart. A clear move above the trend line could push EUR/USD towards the 1.0950 resistance.
Looking at GBP/USD, the pair failed to recover above the 1.3150 resistance zone and started a fresh decline towards the 1.3000 level.
Economic Releases
- NAHB Housing Price Index for April 2022 - Forecast 77, versus 79 previous.
Forex and Cryptocurrencies Forecast
EUR/USD: Fed's Apples and ECB's Oranges
The dollar continues to strengthen, while the EUR/USD pair moves down. A week's low was recorded at 1.0757 after the ECB meeting on Thursday, April 14. After correction, the final chord, sounded at around 1.0808.
We named three reasons for the growth of the US currency in the previous forecast. The first is the difference between the monetary policies of the Fed and the ECB. Now, the probability of further tightening the position of the US Central bank has increased even more against the background of the latest data on inflation in the United States: the consumer price index has exceeded the forty-year high and reached 8.5%. Such an acceleration of inflation may force the regulator to act more vigorously and to revise its plans to raise the key rate and reduce the balance sheet in May.
New York Fed President John Williams, who is also vice chairman of the FOMC (Federal Open Market Committee), said in an interview with Bloomberg that it makes sense for the Fed to bring interest rates to a neutral level as soon as possible, which, not stimulating, it does not hinder economic growth, and is in the range from 2% to 2.5%. Therefore, a 0.5% increase in federal borrowing costs at the May FOMC meeting looks quite realistic.
In contrast to the Fed's hawks, their European counterparts remain extremely dovish. The ECB left the interest rate unchanged at 0% at its meeting on April 14, which, in fact, was expected. Moreover, the Bank's representatives have already said earlier that the growth in the cost of lending in the context of continuing economic uncertainty could do more harm than good.
The head of the regulator, Christine Lagarde, confirmed at a press conference that followed the meeting that the ECB is moving more slowly than the Fed, and that the Eurozone will be hit harder by the military actions in Ukraine. The American and European economies, according to Ms. Lagarde, are as incomparable as apples and oranges. Such a fruity allegory made a strong impression on the market, as a result of which the EUR/USD pair collapsed to the zone of two-year lows.
Indeed, the current economic situation in the euro area does not inspire optimism and, according to many experts, will continue to worsen in the future. The German economic sentiment index published last week fell to a new multi-month low: minus 41.0 (minus 39.3 a month earlier). The index of current economic conditions of this locomotive of the European economy also fell to minus 30.8 in April (minus 21.4 in March). Against this background, the German GDP growth forecast for 2022 was lowered from 4.5% to 2.7%.
The situation may become even more complicated, as the President of the European Commission Ursula von der Leyen and the head of EU diplomacy Josep Borrell announced their intention to include restrictions on the export of hydrocarbons from Russia in the next package of anti-Russian sanctions. Thus, the risk of stagflation in Europe remains at a fairly high level.
We mentioned another reason for the pressure on the euro - the presidential elections in France in the previous review. Their first round took place on Sunday April 10. So far, the incumbent President Emmanuel Macron is leading with 27.84% of the vote. Marine Le Pen, head of the far-right National Rally Party, gained 23.15%. The gap is not very large and there is still a possibility that the opposition may win in the second round on April 24. Its leader Marine Le Pen is a Eurosceptic. Please note that she called for almost the exit of the country from the Eurozone back in 2017. And if this lady comes to power, the EUR/USD pair, according to a number of analysts, may fall to the level of 1.0500, or even lower.
There is another factor pushing the pair south, which is the deterioration of global risk appetite. The S&P500 stock index has been falling for the third week in a row, while demand for safe-haven assets such as the dollar and US Treasuries, on the contrary, is growing.
At the moment, 50% of analysts vote for further strengthening of the dollar. The opposite opinion is shared by 40% and the remaining 10% of experts have taken a neutral position. All trend indicators and oscillators on D1 are colored red, although 15% of the latter give signals that the pair is oversold.
The nearest support is located at the level of 1.0800. The nearest target for EUR/USD bears will be April 14 low at 1.0757. And if they manage to break through this support, they will then aim for the 2020 low of 1.0635 and the 2016 low of 1.0325. The bulls will try to lift the pair above the 1.1000 level and, if possible, reach the 1.1050 zone. But to do this, they first need to overcome the 1.0840 and 1.0900-1.0930 resistances.
The upcoming week's calendar includes speeches by Fed and ECB heads Jerome Powell and Christine Lagarde on Thursday April 21. Data on unemployment and manufacturing activity in the US will also be published on this day. As for the indicators of business activity in Germany and the Eurozone as a whole, they will become known on Friday, April 22.
GBP/USD: Battle for 1.3000
In the previous forecast, most experts (65%) supported the correction of the GBP/USD pair to the north and were absolutely right. It seemed at the beginning of the week that the victory was on the side of the bears: they managed to overcome the support in the 1.3000 zone and lower the pair to 1.2972.
Recall that 1.3000 is a key support/resistance level as it is not only the March 15 low, but also the 2021-2022 low. The bulls managed to seize the initiative on Wednesday, April 13, break through this resistance, reach the height of 1.3147 and complete the week also above it, at around 1.3060.
The pound was supported by a possible tactical victory of the Bank of England over the FRS in the fight for raising interest rates. Inflation in the UK increased from 6.2% to 7.0%. The Bank of England predicted that it would peak in April, accelerating to 7.2%. However, a number of banks did not agree with the regulator's opinion, believing that inflation will not stop at this point, reaching 9.0% in April, and then its growth will continue. Therefore, the Bank of England will have to do something about it. And this "something" is, of course, another increase in interest rates. It was this prospect that pushed the British currency to growth.
We can expect the battle for 1.3000 to continue next week. If the victory is on the side of the bears, they will try to update the April 13 low of 1.2972 and open the way to the November 2020 lows around 1.2850, and then to the September 2020 lows in the zone 1.2700. The nearest support is 1.3050. 30% of analysts vote for the victory of the bears, while the majority (70%) side with the bulls. The resistance levels are 1.3100, 1.3150 and the zone 1.3190-1.3215, then 1.3270-1.3325 and 1.3400. Among the indicators on D1, the advantage of the reds is evident. Among the oscillators, 75% are colored in this color, another 15% are green and 10% are neutral gray. Trend indicators have 100% on the red side.
Among the events concerning the economy of the United Kingdom, we can highlight the speeches of the Governor of the Bank of England Andrew Bailey on April 21 and 22. Data on business activity in the manufacturing and services sectors of the UK will also be published on Friday, April 22.
USD/JPY: Do We Expect New Anti-records from the Yen?
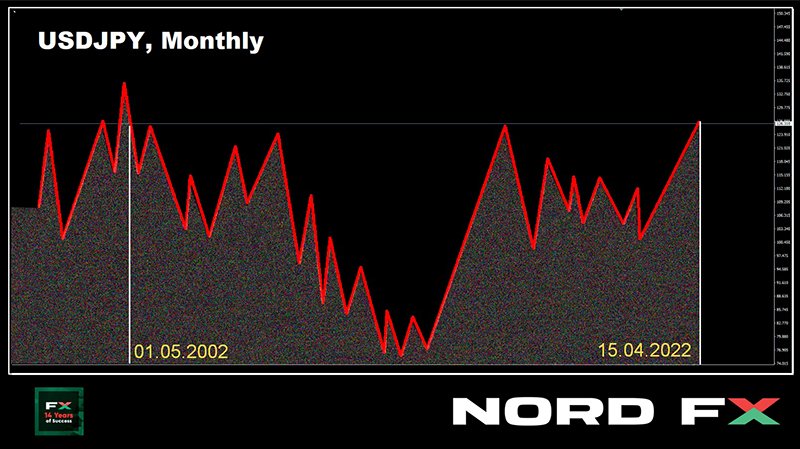
It seems that nothing can stop the fall of the yen and the growth of the USD/JPY pair. The Japanese currency sets an anti-record after an anti-record, and the pair recorded another high at 126.67. The last time it climbed so high was on May 01, 2002, that is, 20 years ago.
We noted in the last review that the majority of Japanese people are against the weak yen. However, despite this, the Bank of Japan still refuses to raise the key rate and reduce monetary easing. The regulator believes that maintaining economic activity is much more important than fighting inflation. And this divergence with the US Federal Reserve's monetary policy is pushing the USD/JPY further north.
The pair closed the week's trading session at 126.37. 45% of analysts vote for maintaining the uptrend next week. A little more, 55%, remembering a powerful correction to the south after a similar rally in the last week of March, expect something similar now. It should be noted here that when switching to the forecast for may-June, the number of supporters of the dollar strengthening increases to 80%. We have already cited Rabobank strategists who believe that a quick USD/JPY jump above 125.00 will seriously increase the likelihood that the Japanese regulator will revise its quantitative easing (QE) program. And this jump took place last week.
There is complete unanimity among the indicators on D1: 100% of trend indicators and 100% of oscillators look up, although 35% of the latter are in the overbought zone. Without a doubt, the main support in the coming days will be the levels of 126.00 and 125.00. Then, taking into account the high volatility of the pair, we can single out the zones 123.65-124.05, 122.35-123.00 and 120.60-121.30. As for the plans of the bulls, they will try to update the high of April 15, and rise above 127.00. An attempt to designate their subsequent goals, focusing on the levels of 20 years ago, will rather look like fortune telling.
There are no expected releases of any important statistics on the state of the Japanese economy this week.
CRYPTOCURRENCIES: April 12: Space Flight Day. But not for bitcoin.
It is impossible to call the first half of April successful for the crypto market. And if bitcoin was still trying to jump over the 200-day SMA two weeks ago, on April 04, then the bulls completely capitulated and a local low was recorded at $39.210 on April 12. It is noteworthy that Cosmonautics Day is celebrated on this day: Yuri Gagarin went into space and circled the planet Earth on April 12, 1961, for the first time in the world. The BTC/USD pair did not make a breakthrough to the stars. Rather, we observed a fall from orbit.
As of this writing, on the evening of Friday, April 15, the pair is trading around $40,440. The total market capitalization has slightly decreased and is still below the important psychological level of $2 trillion, at the level of $1.880 trillion. The Crypto Fear & Greed Index did not stay in the previous orbit either: it fell from 37 to 22 points and returned to the Extreme Fear zone.
We wrote earlier that bitcoin has become a part of the global economy and now demonstrates a strong correlation with stock indices. Therefore, its quotes chart is largely congruent, first of all, with the S&P500 chart. So, as of March 2022, according to Arcana Research, the correlation coefficient between BTC and S&P500 was 0.497. The main cryptocurrency falls and rises after the stock market. And that, in turn, falls or rises depending on the actions of the US Federal Reserve. There is no longer any question of bitcoin's independence.
As we have already mentioned, there has recently been a clear trend towards the accumulation of digital gold. The volumes of accumulation began to exceed emission many times over. According to Glassnode, the rate of outflow of coins from centralized platforms has increased to 96,200 BTC per month, which is extremely rare in historical retrospect. In addition to the "whales", the so-called "shrimps" (addresses with a balance of less than 1 BTC) also contributed to the accumulation. So why doesn't hodle sentiment lead to higher prices?
The answer is simple: no new investors. The old ones either go into the state of long-term holders of coins, or get rid of them. Approximately $439 million worth of crypto positions were liquidated on April 12 alone, according to Coinglass. At the same time, more than 88% of closed orders accounted for long positions. Bitcoin futures contracts for $160 million were also closed. But there is no strong inflow of new investments into the crypto sector.
Investors have lost their appetite for risk since the end of March, the DXY dollar index and US 10-year bond yields reach new highs on a regular basis. Due to rising inflation, which reached 8.5% in the US in March, the markets are waiting for the US Central Bank to raise interest rates again at the May meeting, and not by 0.25%, but immediately by 0.5%. This is the reason why interest from high-risk assets flows to more conservative instruments.
According to Bloomberg analysts, the value of the flagship cryptocurrency may soon fall to $26,000. The experts emphasized that if the technical analysis pattern called "bear flag" works, then such a scenario will be inevitable. In their opinion, the BTC rate is now on its way to testing a key support level around $37,500. If it does not hold above this mark, the market is in for a disaster.
Analyst Jeffrey Halley's forecast sounds slightly more optimistic. He believes that the flagship cryptocurrency continues to trade within the established range, the lower limit of which is at $36,500. If BTC falls even more, it can lead to serious losses for traders and investors. However, if the price of bitcoin soars in the near future above the upper limit of the range of $47,500, this will be a prerequisite for reaching a new record high.
There are also influencers who are not worried or upset by the current market situation at all. These include Michael Saylor, CEO of Microstrategy, a company known for its investments in bitcoin, and Cathie Wood, head of investment company Arch Invest, who still believe in bitcoin and look forward to its growth.
Saylor and Wood spoke at the Bitcoin 2022 conference in Miami and concluded that the Fed's monetary policy will continue to be inflationary, pushing prices up. In such a situation, according to Cathie Wood, bitcoin, as a means of hedging, has great potential for growth and its price could reach a record $1 million per coin. "It takes quite a bit of effort to do this," the head of Arch Invest said. "We don't need much. All we need is for 2.5% of all assets to be converted to bitcoin."
Well-known writer and investor Robert Kiyosaki has a similar opinion, he believes that the US dollar and other markets are on the verge of collapse due to rising food, oil and energy prices, as well as widespread inflation. The author of the bestselling book Rich Dad Poor Dad assured that what is happening in the world of finance is a sign of a coming crisis, and this process will simply destroy half the US population. He noted that cryptocurrencies in this situation are a good tool to reduce risks, but not all people resort to using this asset class. Kiyosaki emphasized that now 40% of Americans do not even have $1,000 in their savings. The inflation rate is rising, and this figure will soon exceed 50%. Then, according to the investor, a revolution will begin.
Morningstar analysts posted a report claiming that cryptocurrencies are no match for the stock and bond markets in terms of returns. At the same time, they note that bitcoin "is still too risky to be compared to gold." The authors of the report argue that, despite the prospect of significant profits that the cryptocurrency market can offer its participants, one must be very careful with it. "Every breathtaking rally has led to an equally brutal crash at the end," Morningstar notes.
It is difficult to argue that speculation or investment in digital assets is quite risky. But there are certain things in this business, as in any other, that allow you to get additional benefits. It is about them that we regularly talk about in our crypto life hacks section. This time it's about heat energy and a man named Jonathan Yuan who has kids who love to swim in the pool. However, they almost did not do this because the water was too cold.
Yuan himself is actively involved in mining and drew attention to the fact that his equipment generates too much heat. He purchased a heat exchanger and used it to install a system for heating water. According to him, thanks to this invention, the temperature in the pool can be maintained at about 32° C, and the crypto farm receives a water cooling system. Jonathan Yuan notes that almost everything can be heated according to this principle: living premises, garages and so on. It is assumed that the heating temperature can reach a maximum threshold of 60°C.
There are nuances here, however. When the inventor pushed his ASIC miners to the limit, the temperature in the pool rose above 43°C. His children did not like it either and they stopped swimming again. So, the ancient Greek "father" of medicine, Hippocrates, was right, saying "good things in small doses"
Summary 4/18 – 4/22
Monday, Apr 18, 2022
[php_everywhere instance="1"]
Tuesday, Apr 19, 2022
[php_everywhere instance="2"]
Wednesday, Apr 20, 2022
[php_everywhere instance="3"]
Thursday, Apr 21, 2022
[php_everywhere instance="4"]
Friday, Apr 22, 2022
[php_everywhere instance="5"]
Weekly Economic & Financial Commentary: Foreign Central Banks Shifting into Tightening Mode
Summary
United States: Inflation Hits Hard in March
- This week's U.S. economic data were led by the largest monthly increase in the Consumer Price Index (CPI) since September 2005. The squeeze on households' from skyrocketing prices for necessities is very real and was evident in this week's retail sales data. However, underneath the surface there are signs that pandemic-related inflation is beginning to ease.
- Next week: Housing Starts (Tue), Existing Home Sales (Wed), Leading Economic Index (Thu)
International: U.K. Inflation Soars While Growth Slows
- Recent economic data from the United Kingdom reflected the global trend of higher inflation and slowing growth. The U.K.'s March CPI data release showed inflation pressures surged even higher last month. Headline CPI Inflation is now at a 30-year high, quickening more than expected to 7% year-over-year.
- Next week: China GDP (Mon), South Africa CPI (Wed), Eurozone PMIs (Fri)
Interest Rate Watch: Foreign Central Banks Shifting into Tightening Mode
- Not only did the Bank of Canada hike rates by 50 bps this week, but some other foreign central banks have also taken their policy rates higher in recent weeks. We expect that the Federal Reserve will tighten policy more than most other major central banks, with the possible exception of the Bank of Canada, which should continue to support the value of the U.S. dollar against most major foreign currencies.
Topic of the Week: Factors to Consider for a Net Zero Carbon Economy
- If corporations are to achieve net zero greenhouse gas emissions by 2050, there will be many economic impacts. Our recent report contextualizes the current state of greenhouse gas emissions and considers the larger economic implications of a transition to a net zero carbon future.
EUR/USD Pair Moved into a Bearish Zone Below $1.0880
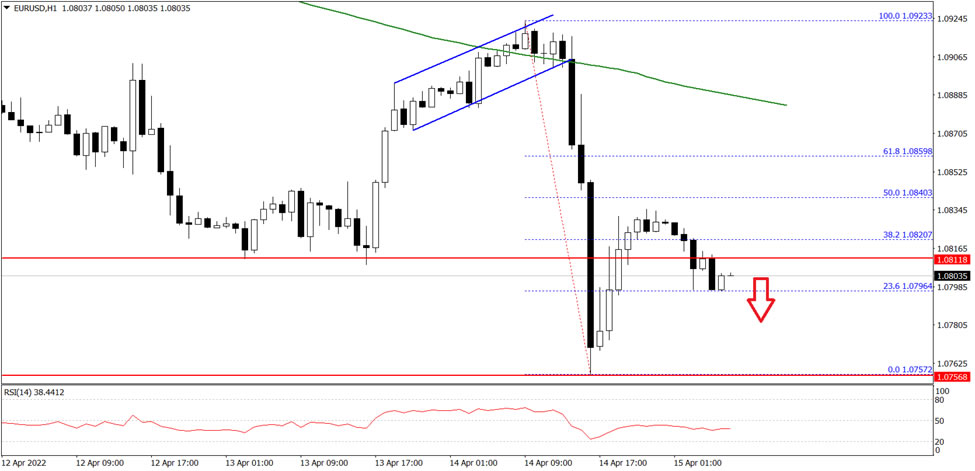
The Euro started a fresh decline from the 1.0925 resistance zone against the US Dollar. The EUR/USD pair declined below the 1.0880 level to move into a bearish zone.
The price even traded below the 1.0800 level and the 50 hourly simple moving average. It traded as low as 1.0757 and is currently consolidating losses. An immediate support is near the 1.0780 level.
The next key support is near 1.0765 on FXOpen, below the pair could decline towards the 1.0720 level in the near term. Any more losses might send the pair towards the 1.0680 level.
On the upside, the pair might struggle near 1.0840. The next major resistance is near the 1.0850 level. A break above the 1.0840 and 1.0850 resistance levels could start a decent increase towards the 1.0900 level in the near term.
Canadian March Inflation to Breach 6%
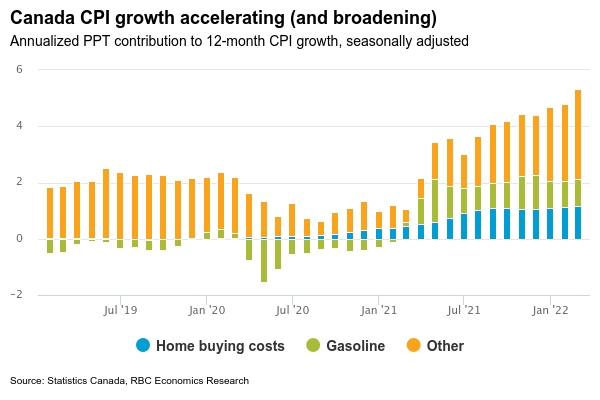
Next week’s Canadian CPI report is expected to show a further acceleration to 6% in March. That would top the 5.7% February reading that was already the highest since 1991. Soaring gasoline prices are expected to account for almost a quarter of the increase—and half of the price rise from February as energy surged higher on the Russian invasion of Ukraine. Home buying costs (realtor and broker fees, etc) have accounted for another 20% of the increase. With housing markets still running hot, these are also expected to have moved higher again in March.
Price pressures are continuing to broaden out. The war in Ukraine has added to global supply chain disruptions and input price growth. And consumer demand has risen sharply alongside the strongest labour market in decades—with those consumers continuing to hold exceptionally large savings accumulated during the pandemic. Compared to pre-pandemic levels, about two-thirds of the CPI basket is now growing at a rate above the Bank of Canada’s 2% inflation target.
The BoC’s newly-minted forecast shows inflation averaging 5.3% in 2022—more than 1 percentage point higher than its previous forecast in January. With labour markets also looking exceptionally strong, there’s no reason for interest rates to still be at emergency low levels. The BoC already hiked the overnight rate by 75 basis points over the last month and a half—including the 50 bp hike on March 13th. We look for another 100 bps worth of increases to bring the rate to 2.0% by October.
Week ahead data watch:
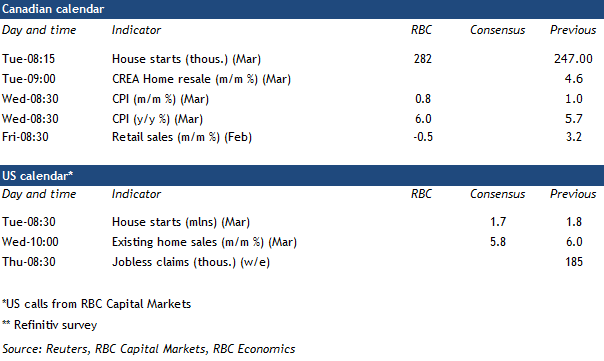
- The preliminary estimate of February Canadian retail sales was down 0.5% after a solid 3.2% gain in January. With consumers showing strong demand for goods during the pandemic, and prices higher, retail sales will still be more than 12% above pre-COVID levels.
- We expect Canadian housing starts to rise to 282k on very strong recent permit issuance in February.
- Canadian home resale markets likely remained exceptionally tight in March. Local real estate board data showed heated activity in the month, and though prices continued to grow and inventories very low there are early signs of moderation in some larger markets.
The Weekly Bottom Line: Inflation Surge Continues
U.S. Highlights
- Overall inflation as measured by the CPI accelerated to 8.5% year-over-year (y/y) in March, marking yet another multi-decade high. Core inflation, which excludes food and energy, ticked up a tenth of a percentage point to 6.5% y/y.
- Small business confidence continued to trend lower in March as the share of businesses expecting an improvement in the economy fell to an all-time low. Meanwhile, inflation has vaulted into being perceived as the top business problem.
- Retail sales rose 0.5% month-to-month (m/m) in March - broadly in line with market expectations. Excluding volatile categories, sales in the ‘control group’ (used in calculating personal consumption expenditures) fell 0.1% on the month.
Canadian Highlights
- The Bank of Canada raised rates an aggressive 50 basis points this week. The Bank also announced that it will begin “quantitative tightening” (QT) effective April 25th.
- The Canadian CPI is expected to surge past the 6% mark when the numbers are released next week. With price pressures mounting and the labour market being tight, we anticipate the Bank raise rates by another 50 basis point in June.
- Higher interest rates will tame Canadians’ appetite for credit, but they will also lead to higher debt payments for existing borrowers. Debt servicing costs are expected to rise briskly over the next two years (report).
U.S. - Inflation Surge Continues
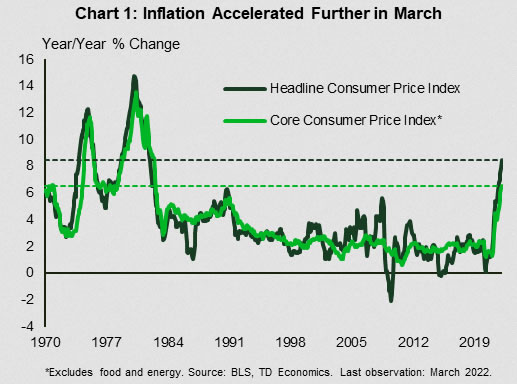
Inflation remained top of mind this week with the Consumer Price Index (CPI) report reminding us once again that price pressures accelerated in March. Overall inflation rose both in month-to-month (+1.2% m/m) and year-over-year (y/y) terms, with the latter reaching 8.5% in March – a new multi-decade high. Energy, especially, and food, to a lesser degree, both contributed to the acceleration. Still, even when excluding these more volatile categories, core inflation (up only a tenth of a percentage point to 6.5% y/y) was at the highest level since the early 1980s (Chart 1). Adding to the evidence that price pressures continued to build through March, supplier prices also rose sharply last month, accelerating to 11.2% y/y – an all-time high for the data stretching back to 2010.
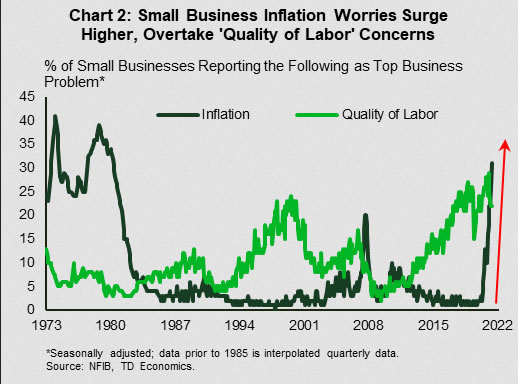
Inflation worries were echoed in the National Federation of Independent Business (NFIB) small business report. Business confidence continued to trend lower, falling to 93.2 in March – the lowest level since 2016 excluding the temporary drop at the start of the pandemic. Businesses were the most pessimistic they have ever been regarding an improvement in the economy ahead from current levels (albeit the bar to improve on the post-pandemic rebound pace is very high). Yet perhaps the most striking aspect of the report is the fact that inflation concerns, barely a factor as the start of last year, have risen sharply, overtaking ‘quality of labor’ concerns recently (Chart 2). This shift suggests that managing inflation’s impact is now the top priority, while securing talent amidst a tightening labor market playing an important second fiddle.
Small business job openings remain plentiful, despite trending lower since peaking in September. Meanwhile, businesses continue to raise wages and plan more increases ahead, with both of these sub-indicators in the NFIB survey ticking higher last month. A growing share of businesses are also passing on the added costs to consumers by raising prices. A net 72% are doing so – a record high in the survey’s almost 50-year history. All these factors, together with the potential for more supply-chain disruptions due to the war in Ukraine, and shutdowns in China, suggest that inflation will continue to run hot in the near-term.
Tilting to retail sales, a 0.5% gain in March and a bulky upgrade to the month prior were positive developments. Gains in March also appeared to be skewed toward “going out” categories – a pattern consistent with the reopening of the economy. A sharp drop in non-store sales (a proxy for online sales) further bolsters this point. Digging deeper, however, the picture is less rosy. Sales in the control group, which exclude volatile categories and are used in calculating personal consumption expenditures, were down 0.1% m/m. Meanwhile, when adjusting headline figures by CPI, the data points a decline in the ‘real’ sales estimate both in monthly and year-on-year terms.
All told, with inflation running hot and still no major cracks in the economic armor, the Fed will need to follow through with the speedy removal of monetary stimulus to try and rein in inflation. Interest-sensitive sectors, such as housing, which is already showing some signs of cooling (see here), are first on the list to feel the pinch from the higher rate environment.
Canada - The Punch Bowl Has Left the Building
It is said that central banks should take away the punch bowl just as the party is heating up. After waiting until Canada's economic party was in full swing before starting to tighten policy, the Bank of Canada's (BoC) raised rates an aggressive 50 basis points in its announcement this week – the monetary punch bowl has left the building.
The Bank also announced that it will begin "quantitative tightening" (QT) effective April 25th. This means it will allow its holdings of Government of Canada bonds to mature, which will shrink the size of its balance sheet over time. This is another channel via which monetary policy will be turning more restrictive, as QT will add some upward pressure to bond yields. Five-year Government of Canada bond yields recently surpassed 2018 highs, and are now at the highest level since 2011.
By raising the policy rate by 50 basis points for the first time in 22 years, the BoC reaffirmed its commitment to tame runaway inflation, but also sets up the pace for more aggressive moves. Indeed, the statement accompanying the decision was hawkish. The bank sounded upbeat on the Canadian economic outlook, noting that "the economy is moving into excess demand" and that tight labour market is leading to an acceleration in wage growth.
Even with risks to global growth stemming from the war in Ukraine and lockdowns in China, the Bank was expecting Canadian economic growth to remain robust, with real GDP expanding by 4.2% this year – just a touch slower than 4.6% pace seen last year – and by 3.2% in 2023.
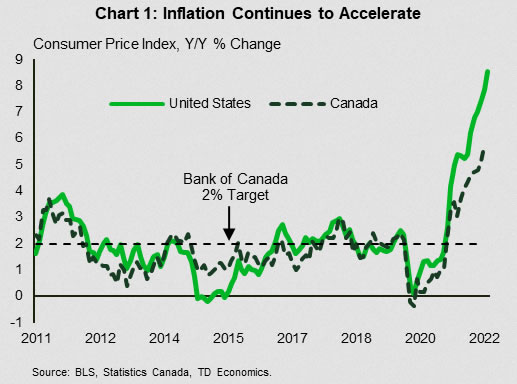
At the same time, the Bank revised up its outlook on inflation, stating that "CPI inflation is now expected to average almost 6% in the first half of 2022 and remain well above the control range throughout this year." U.S. inflation hit 8.5% year-over-year in March, and the Canadian CPI is expected to surge past 6% mark when the numbers are released next week (Chart 1). With price pressures continuing to mount, the labour market at full employment, and the need to cool domestic demand as well as the housing market, the Bank will be staying firm on rate hikes. We anticipate another 50 basis point increase on June 1st, with the policy rate hitting 2% by year end.
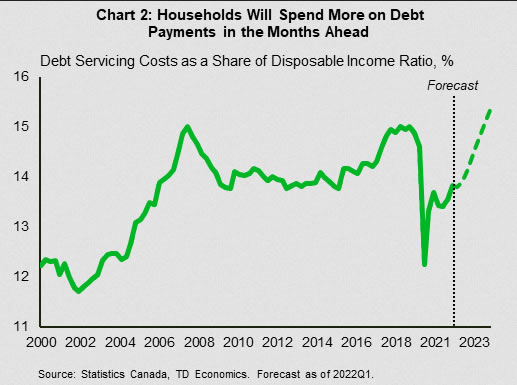
Higher interest rates will tame Canadians' appetite for credit, cooling household debt growth. However, they will also lead to higher debt payments for existing borrowers (report). Debt servicing costs are expected to rise briskly over the next two years, hitting their pre-pandemic peak by the end of 2023 (Chart 2). The Bank of Canada does not appear to be worried, with discussion of household debt missing from the monetary policy report. Perhaps it is right not to be concerned for now. As long as the Bank can stage a soft landing and job growth persists, most borrowers should be able to accommodate higher interest rates and remain current on their debt obligations.
Week Ahead -The Bond Market Selloff Continues
The bond market selloff did not ease up heading into the long holiday weekend and traders will have to soon decide if they decide to sell in May and go away. The upcoming week is filled with another round of earnings, major economic data out of China, a French debate, and a wrath of commentary from finance ministers and central bankers at the IMF/World Bank spring meetings.
US
After a long weekend, Wall Street is ready to dive back into earnings season. The second week of earnings will provide a better picture of which companies are quickly passing on their higher costs. This week we will learn more about how confident the airlines are with travel demand, how supply chain issues are impacting IBM, Tesla, and Procter & Gamble.
Economic data releases for the week will focus on manufacturing activity, housing data, and the flash PMI readings for April. The US economy is still on solid-footing, so expectations across a wide range of economic data is expected to moderate.
Fed speak for the week contains appearances from Bullard, Evans, Daly, and Chair Powell. With the Fed firmly committed to an aggressive start with the tightening of monetary policy, traders will look for clues to see which members are growing concerned about economic growth and if that could lead to less aggressive Fed tightening bets for later in the year.
EU
A shortened week next week as a result of the long bank holiday weekend. The data mostly consists of tier two and three releases, with the only exceptions being the flash PMIs on Friday. Final CPI data will be of interest on Thursday but any shock and awe will likely have come from the flash readings. And with the ECB taking its time to wrap up bond-buying and start raising rates, it would take something quite substantial to rock the boat. We’ll hear from Christine Lagarde next Friday but if the press conference is anything to go by, it’s not one to look forward to.
The war in Ukraine remains front and centre though, with progress appearing to have stalled in negotiations. Commodity prices remain high as the West continues to explore further sanctions. Pressure will continue to ramp up to ban oil and gas as Russia commits further atrocities but it will continue to face resistance from Germany in particular due to the economic consequences at home of such a move.
UK
Another shortened week for the UK with retail sales and PMIs the highlights next Friday. BoE Governor Bailey will speak on Thursday which will be interesting given the latest inflation data. The cooling of the hawkish rhetoric may well be dropped shortly after it was adopted.
Fines to Johnson and Sunak may have created some political instability a couple of months ago but that’s not looking likely now.
Russia
The invasion of Ukraine remains the focus as far as Russia is concerned, with sanctions continuing to come from the West in response to the atrocities it’s committing.
Central bank head Elvira Nabiulina speaks at the Duma on Thursday. They have started unwinding their rate hikes recently as the currency has stabilised.
South Africa
CPI inflation data on Wednesday is the only notable release next week. It remains at the upper end of its 3-6% range as the SARB continues to raise rates to pull it lower.
Turkey
The CBRT left interest rates at 14% on Thursday while blaming everything except its policy decisions for the surge in inflation to 61%. The monetary policy review continues. No major events or data next week.
China
China releases a flurry of data in the coming week but markets will be watching the evolution of China’s Covid-19 situation as the Shanghai lockdowns drag on. That has held back equities this week and an escalation will be a strong headwind next week if it worsens.
With a slowing economy in mind, markets are also expecting stimulus measures to appear finally. A RRR cut could come as soon as Friday, or anytime next week. The next MLF matures tomorrow and we could see the 1-year rate trimmed. Failing that, China announces its 1 and 5-year Loan Prime Rate decisions on Wednesday and a 1-year cut could be a possibility. Any of these will provide a short-term boost to local equity markets.
On Monday, China releases GDP, industrial production, retail sales and industrial Capacity. All of this data has downside risks and soft data will weigh on local equities and potentially weaken the Yuan. USD/CNY and USD/CNH are approaching medium-term resistance levels, a move higher through 6.4000 will signal more Yuan losses ahead.
India
The Reserve Bank of India laid the groundwork for tightening monetary policy this week, but buoyant global stock markets and a weaker US dollar at the end of the week have sheltered equities and the INR from negative fallout. India is on holiday today and Friday of this week.
India releases WPI for food, fuel and manufacturing on Monday. All have upside risks that could see markets pricing in the RBI tightening policy sooner. Expect headwinds for local equities while the INR remains at the mercy of the US Dollar direction on international markets.
Instability in Pakistan following a change of government could have negative spillovers into India’s asset markets.
Australia
Australia is on holiday on Monday and equities have been content to follow Wall Street’s direction, while the AUD has held stead will commodity prices and a slightly hawkish change in the language of the RBA.
Australia releases Retail Sales on Thursday and PMIs on Friday. Both have downside risks that could weigh on local markets. Conversely, higher numbers would increase the tightening pressure on the RBA.
The federal election was announced for May this week, but as yet, the probable change of government is being discounted by local markets.
New Zealand
New Zealand is closed on Monday. The NZD is ending the week under pressure as the RBNZ hiked rates by 0.50%, but left its terminal guidance unchanged. Services PMI on Tuesday and inflation on Thursday have upside risks and could spark more selling of NZD as the RBNZ gets perceived as being ever further behind the inflation curve.
A sagging property market and rampant cost of living increases are increasing political pressure on the government in New Zealand, limiting gains by equities and the NZD.
Japan
USD/JPY remains very near recent highs as the US/Japan rate differential remains elevated. Further moves higher by US yields next week could push USD/JPY to near 128.00. Equities are tracking US markets for now.
The only data this week is inflation on Tuesday which should contain no upside shocks, much like the past 25 years.
Singapore
The MAS has tightened monetary policy by recentering the NEER band and increasing the appreciation slope. That has led SGD into the end of the week. Singapore releases non-oil exports on Monday and weak numbers will raise fears that the MAS is hiking into a slowing economy, a negative for local equity markets.
Markets
Energy
Oil prices are a little higher on Thursday after rallying strongly the previous two days. The flirtation below $100 didn’t last long as the slight lifting of restrictions in China partly removed one key downside risk for prices. With the IEA reserve release priced in, that leaves the risks heavily tilted to the upside as OPEC remains committed to its key ally and unable to hit the quotas its been set anyway.
That could leave Brent prices ranging between $100 and $120 for now, with WTI more like $95-115. There’s no shortage of risks to that though and this remains an incredibly headline-driven market. The prospect of Finland and Sweden joining the NATO alliance is unlikely to ease tensions between Russia and the West which could further spill over into the oil market.
Gold
It would appear gold isn’t going to extend its winning run to seven days ahead of the long weekend. It’s trading a little lower on Thursday after running into some resistance around $1,980. The yellow metal continues to show momentum which may suggest a run at $2,000 is on the cards. At a time of such aggressive tightening, it’s unclear whether it’s a fear of inflation, the economy or risk that’s driving the move, perhaps all of the above. But there’s no shortage of demand at the moment.
Bitcoin
An encouraging rebound in bitcoin on Wednesday was short-lived, with the cryptocurrency once again in the red on Thursday. It appears to have struggled around the midpoint of Monday’s sell-off which could be viewed as a bearish signal. I’m not sure I’ll read too much into that but it’s certainly lost all breakout momentum in recent weeks. It continues to trade more broadly in its 2022 recovery channel and recent price action suggests it could be heading for another move towards the lows. That’s around 10% from the current price and a break below here could be a very bearish development.
Monday, April 18
Economic Data/Events:
- China quarterly GDP and March Industrial production, retail sales and other key indicators
- Easter Monday: UK and most of European financial markets are closed
- IMF/World Bank spring meeting begins
- Fed’s Bullard speaks
- Spain Trade
- Canada existing home sales, housing starts
- India wholesale prices
Tuesday, April 19
Economic Data/Events:
- US housing starts
- G-20 finance ministers, central bankers meet at IMF/World Bank spring meetings
- Fed’s Evans speaks
- IMF releases World Economic outlook
- Japan industrial production
- Mexico international reserves
Wednesday, April 20
Economic Data/Events:
- US existing home sales
- Fed’s Beige Book is released
- Fed’s Daly and Evans speak at separate events
- French presidential debate
- Canada CPI
- South Africa CPI
- Japan Trade
- Italy Trade
- China loan prime rates
- Eurozone new car registrations, industrial production
- EIA crude oil inventory report
Thursday, April 21
Economic Data/Events:
- US initial jobless claims, Leading index
- Eurozone CPI
- New Zealand CPI
- Fed Chair Powell and ECB’s Lagarde speak at event hosted by IMF
- Eurozone consumer confidence
Friday, April 22
Economic Data/Events:
- US Flash PMI readings
- European Flash PMIs: Eurozone, France, Germany, U.K.
- UK PM Johnson to visit India
- BOE’s Bailey to speak on IMF panel
- Japan CPI
- Canada retail sales
Sovereign Rating Updates:
- United Kingdom (S&P)
- United Kingdom (Moody’s)