

Sample Category Title
USD/JPY Hits New Multi-Year High, 130 Next?
Key Highlights
- USD/JPY started a fresh surge and traded above 125.00.
- A major bullish trend line is forming with support near 125.75 on the 4-hours chart.
- It traded to a new multi-year high at 126.59 and might continue to rise.
- EUR/USD extended decline and spiked below 1.1800.
USD/JPY Technical Analysis
The US Dollar formed a strong base above the 121.20 level against the Japanese Yen. USD/JPY started a strong surge above the 123.50 and 125.00 resistance levels to move into a positive zone.
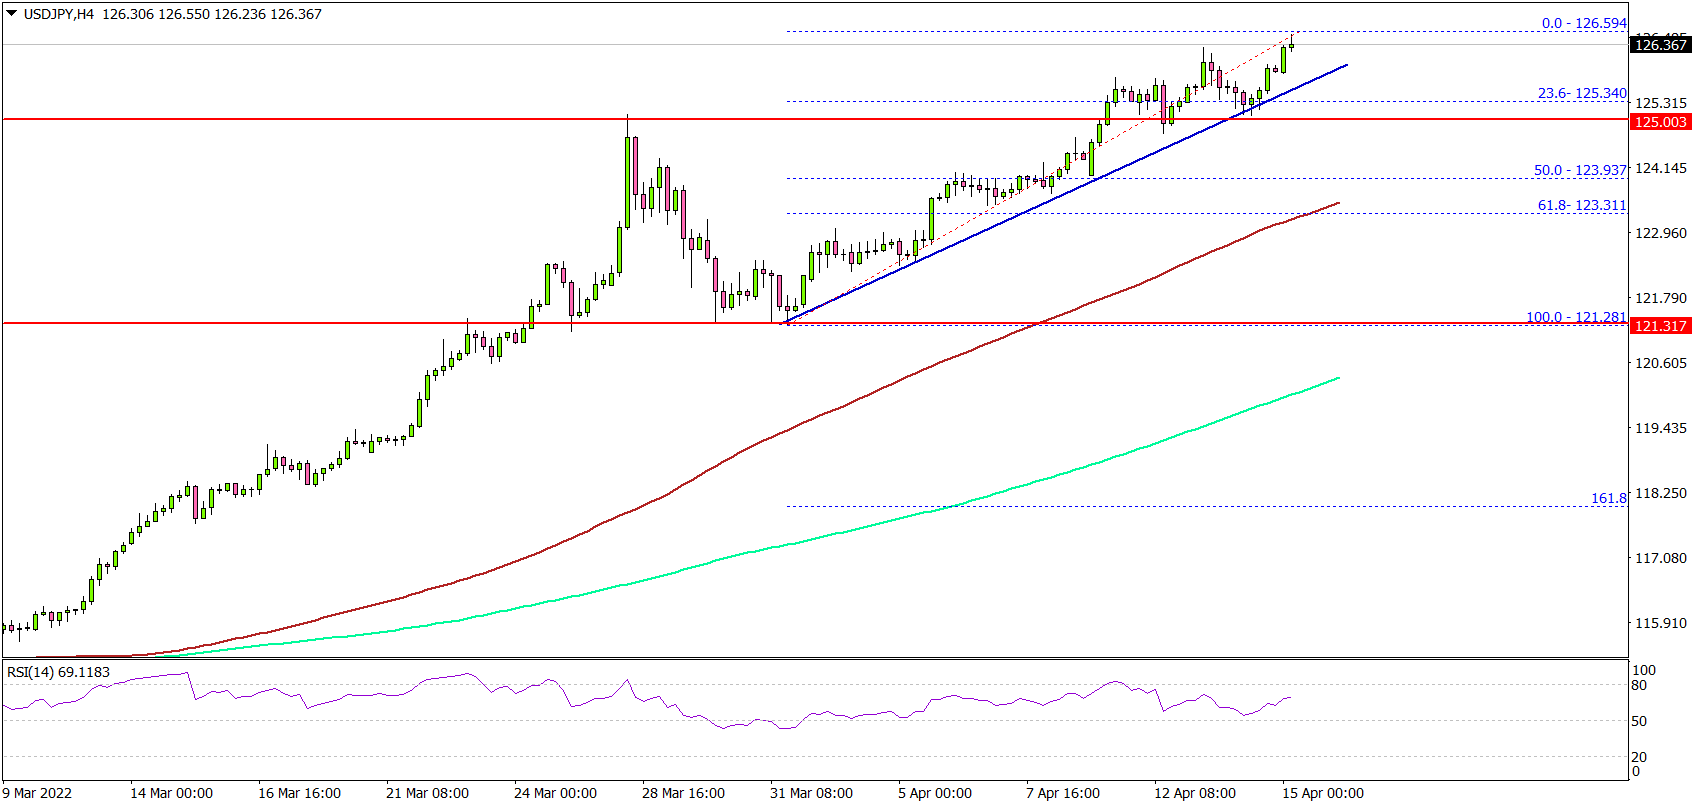
Looking at the 4-hours chart, the pair even settled above the 125.00 level, the 200 simple moving average (green, 4-hours), and the 100 simple moving average (red, 4-hours).
The bulls pumped the pair above the 126.00 level and traded to a new multi-year high at 126.59. It is now showing positive signs and might continue to rise above 126.80. The next major resistance is near the 128.00 level, above which it could rally towards the 130.00 level.
If there is a downside correction, the pair might find support near the 126.00 zone. There is also a major bullish trend line forming with support near 125.75 on the same chart.
The next major support is near the 125.00 level. A downside break below the 125.00 support level might send the pair towards the 123.50 support level or the 100 simple moving average (red, 4-hours).
Looking at EUR/USD, the pair extended decline below the key 1.0800 support zone. If the bears remain in action, the pair could decline towards the 1.0750 level.
Economic Releases
- US Industrial Production for March 2022 (MoM) – Forecast 0.4%, versus 0.5% previous.
Oil Outlook: Is $100 per Barrel Becoming the New Average for WTI?
WTI prices moved mostly sideways in the past week and ended the session somewhat negative. However, a very different story unfolds so far in the current week, where Oil prices remain positive after two consecutive upwards sessions on Tuesday and Wednesday. The move creates further interest in the Oil market and traders may find it challenging to list the headlines starting with the most important. This report will bring to light the key fundamentals currently driving Oil prices along with a brief technical analysis for WTI.
In the past days the weekly Oil market data somewhat failed to impress traders. Starting with the previous Friday, the Baker Hughes Oil rig count saw active Oil rigs in the US jumping from 533 to 546 with no major price reaction. On Tuesday the 12th of April the American Petroleum Institute indicated a big surplus of 7.76M barrels. This was API’s largest surplus so far in 2022 and despite the news being rather bearish for Oil prices, did not create the volatility expected leaving prices somewhat at par. A different story was observed upon release of the weekly Energy Information Administration’s (EIA) Crude Oil Inventories figure, which showed a huge surplus of 9.4M barrels. WTI dropped approximately $1.20 displaying a rather minor reaction despite the surplus being the largest under the EIA so far in 2022. The market’s limited reaction to the releases tends to imply traders are currently concerned with other more important subjects.
On a different note, the International Energy Agency (IEA) through its April report provided some interesting and important information. According to the report the impact of the Russian war in Ukraine remains a great source of uncertainty for the energy sector. Russian Oil supply which has already been decreased, is forecasted to drop even further looking forward due to the widening customer-driven embargo. European countries have already reduced their Russian Oil supply and may reduce it further in May, while Russian exports to China have been steady as mobility restriction and lockdowns seem to limit Oil demand. The only country that has been positive in terms of continuing and even uplifting trade relations with Russia is India. India has actively pursued Russian oil possibly taking advantage of Russia’s need for a significant Oil customer but also possibly to improved price bargains. Russian Oil exports to India are forecasted to have increased in 2022 and could continue to increase in the near future.
Furthermore, the OPEC April 2022 report was also released in the past days providing further insights and forecasts on the current fundamentals of the Oil market. According to the OPEC report, World Oil demand has increased so far in 2022 and is expected to increase further in the US and the biggest countries in Europe including the UK. Referring to China, it was noted that even though recent lockdowns seem to interfere, the largest Oil consuming country in the world is forecasted to maintain and possibly increase its Oil demand in the year ahead.
As a conclusion, Oil demand is expected to increase for the largest economies of the world backed by solid economic growth seen so far in the most developed economies. Yet as supply concerns connected to the war in Eastern Europe continue to loom, fears over an increase of the barrel price persist. Finally, Russia’s Oil trade with China could come under pressure in the following months as leader countries tighten their stance towards Russia.
Technical Analysis
WTI H4
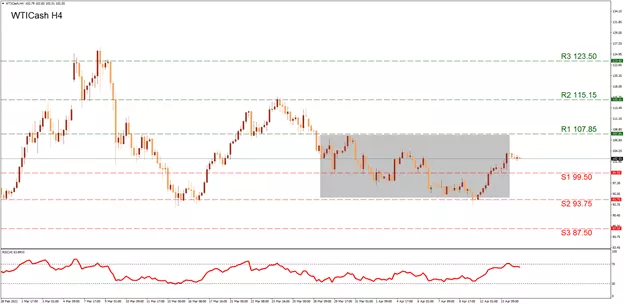
WTI is currently trading nearby $102.80 which is close to our (S1) 99.50 support level. Thus, in a downtrend scenario we consider the (S1) 99.50 support the most probable first test for the price action. If the downtrend is stronger, a move to the (S2) 93.75 barrier is also imminent. Please note the (S2) is the lowest level WTI has dropped to since mid-March and was tested for the last time on the 11th of April. A possible breach below the (S2) could confirm WTI is moving in a downtrend and may be heading to the (S3) 87.50 hurdle. In the opposite direction, a possible upward move could send the price action to the (R1) 107.85 resistance level which was last tested at the end of March and displayed solidity. Yet in an extreme bullish scenario we may see traders shifting their attention to the (R2) 115.15 line which is currently a monthly high price for WTI. If traders are looking for a more prolonged buying strategy we could also point to the (R3) 123.50 resistance which is the 2022 high price and was tested in March. The RSI Indicator below our chart has reached the 70 level in the most recent sessions yet has moved just below it, possibly signaling some stabilization for now. In our opinion, WTI continues to move in a sideways motion within the range highlighted with grey on our chart, between (R1) 107.85 resistance and the (S2) 93.75 barrier. This range has been used since the end of March and a breach outside this can signal a change in the current trend.
Euro Ready to Go Off the Cliff
Today’s meeting did not satisfy the expectation that the ECB could lend a helping hand to the euro by keeping it from plunging off a cliff. Europe has refused to accelerate monetary policy normalisation as most G7 countries have.
Currency market dynamics are always a comparison of relative strength. With a bigger blow to the economy from the events in Ukraine and no less of a problem with inflation, the single currency risks remain under pressure due to a rapidly widening gap in interest rates in the euro area and beyond.
The European Central Bank kept key interest rates unchanged and noted that the asset purchase programme would be scaled back and completed in the third quarter. Market participants expected these announcements.
The focus of market participants was on comments about further plans. And they are relatively mild, considering the external environment. The Fed is preparing the ground for a 50-point rate hike and the start of QE. The Bank of Canada and RBNZ already did so yesterday. The Bank of England and the Bank of Korea have returned rates to pre-pandemic levels.
In the meantime, the ECB is putting out a very sluggish plan: complete purchases in the third quarter, only then start to raise rates, and it will reinvest payments “long after the start” of tightening.
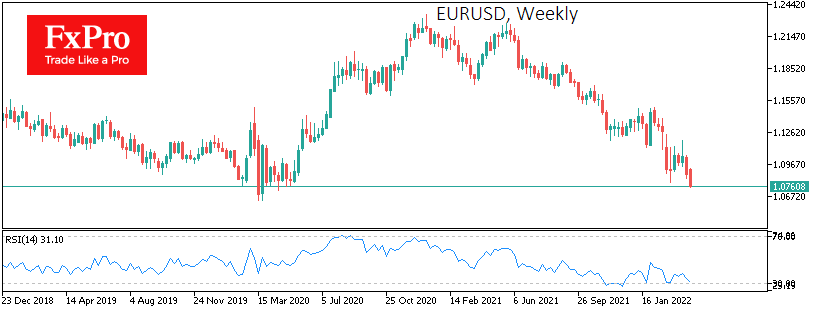
The EURUSD is hovering below 1.0800 on the two-year low. But the euro has an increased chance of being sent into free fall. Much like the Japanese currency, which reached 20-year lows against the Dollar earlier today, the Bank of Japan is still not convinced that deflation has been defeated.
The same can be said for the EURGBP pair, which has returned to levels below 0.8300 this week and is trading at arm’s length from 6-year lows.
GBPJPY Wave Analysis
- GBPJPY reversed from key round resistance level 164.65
- Likely to fall to support level 163.00
GBPJPY today recently reversed down from the key resistance level 164.65 (previous monthly high from March) – coinciding with the upper daily Bollinger Band.
The downward reversal from the resistance level 164.65 stopped the previous impulse wave (i).
Given the strength of the resistance level 164.65 and the overbought daily Stochastic – GBPJPY can be expected to fall toward the next support level 163.00.
CHFJPY Wave Analysis
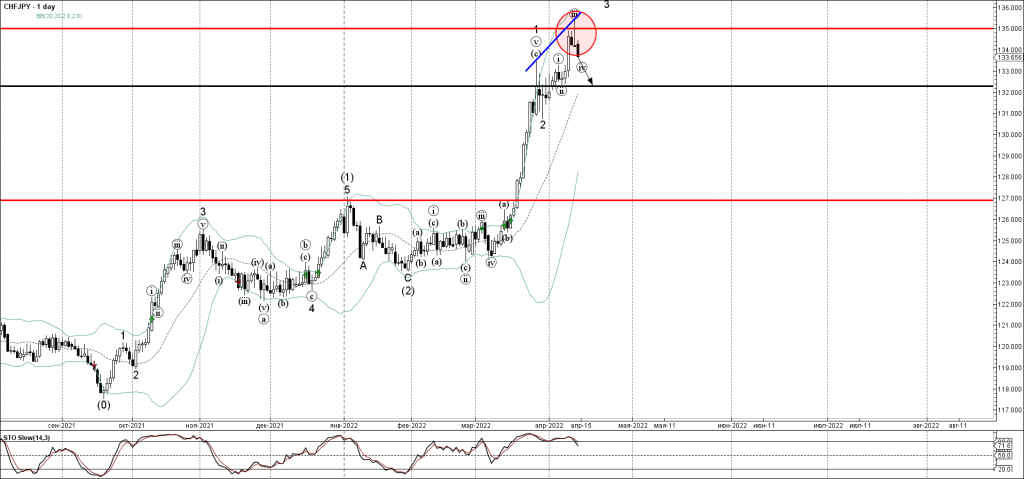
- Reversed from resistance level 134.60
- Likely to fall to support level 132.00
CHFJPY currency pair recently reversed down from the key round resistance level 134.60 (previous multi-month high from 2015) – standing near the upper daily and weekly Bollinger Bands.
The downward reversal from the resistance level 134.60 created the daily candlesticks reversal pattern Shooting Star.
Given the strength of the resistance level 134.60 and the clear bearish divergence on the daily Stochastic – CHFJPY can be expected to fall toward the next support level 132.00 (low of wave (ii)).
ECBs Unhelpful Ambiguity
European stocks are edging higher ahead of the long bank holiday weekend, ending the week not far from where they started as investors mull the latest policy decisions, inflation data and earnings.
There’s been a number of interest rate hikes this week, some more expected than others, while the ECB has instead opted for the usual cocktail of unhelpful ambiguity. Anyone hoping for a hawkish hint ahead of its next meeting and forecasts will no doubt be very disappointed, albeit not surprised.
It was, of course, very kind of President Lagarde to clear up a few things. For example, net asset purchases will end in the third quarter – yes, while other central banks are engaging in fear-induced rate hikes and quantitative tightening, the ECB is gradually winding down QE – and the conclusion of the process could come early or late in the quarter.
Following the conclusion of its asset purchases, the ECB will start raising rates some time after. What constitutes some time? That could be anything from a week to several months. I hope that’s cleared everything up. Don’t we all feel much wiser for having followed that press conference?
I understand the ECB is extremely hesitant to guide the market in the absence of up-to-date economic projections but days like today just make me wish they’d stick to quarterly meetings. There is nothing of substance to take away from today’s meeting and I can’t help but think the market remains far too ambitious in its interest rate expectations this year for a central bank that still thinks bond purchases are warranted.
Of course, its situation is far more uncertain than others, given its proximity and higher exposure to the war in Ukraine, while wage inflation remains far more muted than elsewhere. But it’s clearly not learned the lessons from other central banks and may be forced somewhere down the line to drastically change its stance. Whether that will be this year, I’m not convinced.
Bitcoin heading for further pain?
An encouraging rebound in bitcoin on Wednesday was short-lived, with the cryptocurrency once again in the red on Thursday. It appears to have struggled around the midpoint of Monday’s sell-off which could be viewed as a bearish signal. I’m not sure I’ll read too much into that but it’s certainly lost all breakout momentum in recent weeks. It continues to trade more broadly in its 2022 recovery channel and recent price action suggests it could be heading for another move towards the lows. That’s around 10% from the current price and a break below here could be a very bearish development.
Sunset Market Commentary
Markets
Today’s ECB policy statement very much resembled the one from March, especially when it comes to future monetary policy. From a market point of view, it resembled it even too much, with both the euro and short-term European yields losing out in a first reaction as they (and we) anticipated more urgency when it comes to policy normalization in light of worsening inflation dynamics. ECB Lagarde stressed the only subtle difference, namely that the governing council reinforced its judgement that net asset purchases should end in Q3. The ECB holds dearly to its sequencing principle of first ending net asset purchases and next implementing rate hikes. The official wording is “some time after”. At first, Lagarde repeated last month’s response that this implies optionality, gradualism and flexibility. Later, in a potential slip of the tongue she said that in practice it could mean anything ranging from a week (!) to several months. This still leaves all meetings starting from July open for a potential rate lift-off. Turning to the economic and inflationary assessment, Lagarde emphasized the abnormal brief period (5 weeks) in between meetings. The war on Ukraine is nevertheless having a clear impact. Growth remained weak in Q1 with little improvement expected on the horizon. There was a special reference to the rising cost of living costs with future risks to the growth outlook tilted to the downside. Higher energy prices are the main culprit for the unexpected surge in March inflation, though the ECB noted a sharp rise in food prices and a more widespread inflation level overall (pandemic-related bottlenecks, demand-driven and energy prices filtering through production processes). Wage growth remains muted overall. In an interesting twist, the ECB refers to longer-term inflation expectations derived from financial markets as “largely standing around 2%”. Judge for yourself: 5y5y fwd EMU inflation swap at 2.34% (highest since 2013) and 10y EMU inflation swap at 3% (record high). It does warrant close monitoring according to Lagarde. Inflation risks remain tilted to the upside. We interpret the market response as a vote of no-confidence in ECB policy. European yield curves steepen. The very front end cedes around 3 bps, lacking firmer guidance on a first hike, while the very long end rises by up to 10 bps as inflation expectations spiral further out of control. The combination is a deadly combo for a currency with EUR/USD sliding below the previous YTD low of 1.0806. The next technical reference in case of a confirmed break is the 2020 low at 1.0636. The weaker currency… you guessed it… worsens the ECB’s inflation headache. US yields gain 6 to 7 bps across the curve today following a 2-day correction, giving the dollar some new momentum as well. The trade-weighted greenback is back above 100.
News Headlines
The Turkish central bankkept policy rates steady at 14%. The status quo was expected and comes even as inflation soared beyond 61% y/y. Producer prices hitting well in the triple digits suggest more pipeline-price pressures. The view of the CBRT is unaltered in that current inflation is largely driven by external effects (energy, geopolitics and strong negative supply (chain) shocks). These effects should fade eventually. Instead of jacking up policy rates – the lowest in the world when adjusted for inflation – it rather wishes to further support liraization with measures that include FX sales by state banks. The Turkish lira was unaffected by today’s decision, trading around the EUR/TRY 16 pivot in the aftermath.
Swedish inflation quickened more than expected in March. Headline inflation rose 1.8% m/m to a 33-year high of 6% y/y. The central bank’s preferred CPI gauge with a fixed interest rate (CPIF) sped up to an even higher 6.1% y/y (1.7% m/m). Excluding energy, prices rose 4.1% y/y, up from 3.4% in February. The numbers raise pressure on the Riksbank, which only recently started preparing markets for a monetary shift. Governor Ingves said in March that rates would probably have to be raised sooner than in the year 2024 forecasted in February. It marked the start of a sharp rise in Swedish money markets and short-term swap yields. That move continues today. The 2y swap yield (+6 bps) hits a new cycle high. The krone strengthened vs the euro to EUR/SEK 10.29.
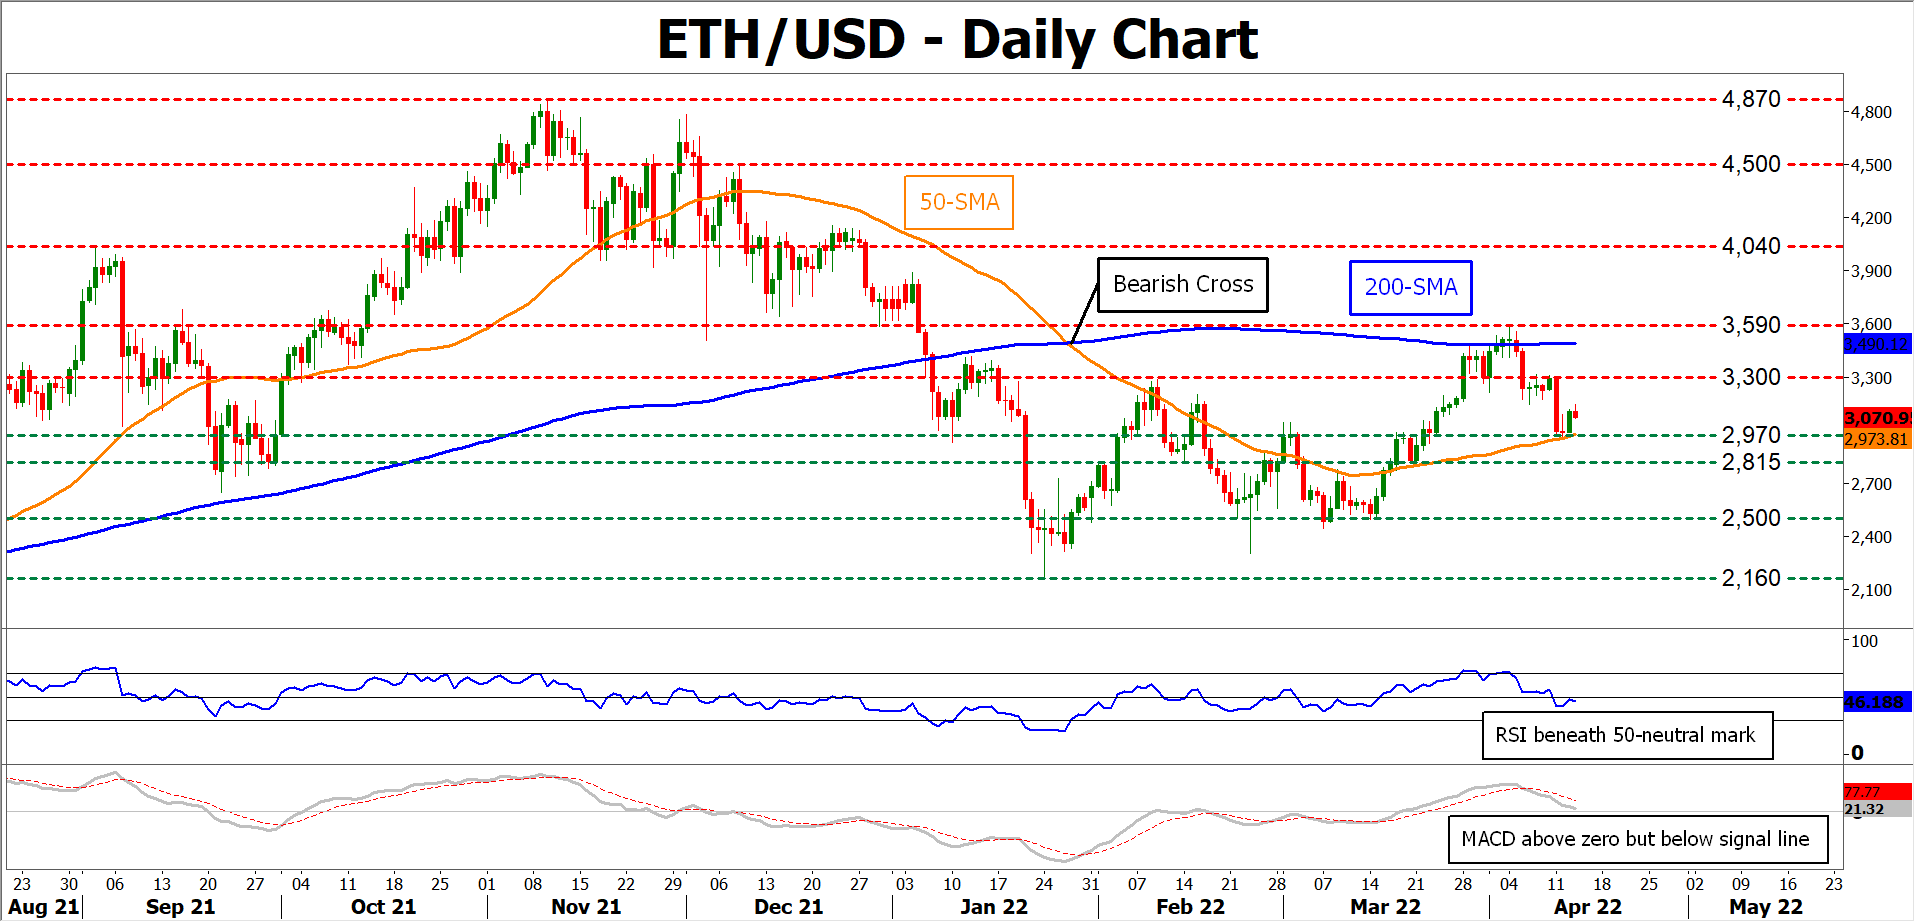
ETHUSD rebounds after 50-SMA rejects decline; bias bearish
ETHUSD (Ethereum) has been experiencing a downside correction after its short-term uptrend stalled at the 3,590 region last week. Although the 50-day simple moving average (SMA) paused the price's recent pullback, it seems like the cryptocurrency lacks the necessary momentum to push higher.
The short-term oscillators reflect that bearish forces retain control. The MACD histogram is currently below its red signal line but above zero, while the RSI is hovering beneath its 50-neutral threshold.
Should negative momentum intensify further, the price could challenge the 2,970 region, which overlaps with the 50-day SMA. Piercing through this level, the bears might aim for 2,815 before the spotlight turns to the March strong support region of 2,500. Failing to halt there, further downside moves could reverse at the 2,160 hurdle, which is the lowest price level observed in 2022.
On the flipside, if bullish forces emerge and regain the upper hand, immediate resistance could be met at the 3,300 barricade. Crossing above this region, the price may test its recent reversion point of 3,590 before it ascends towards the September peak of 4,040. A jump above the latter obstacle could turn the spotlight to 4,500.
Overall, even though ETHUSD’s 50-SMA capped its downside move, the cryptocurrency's technical picture remains negative. Therefore, a dive beneath the 2,970 region could promote a sustained downtrend, while a clear break above the 3,590 ceiling might signal the resumption of the short-term upside trajectory.
US: Retail Sales Advance in March, Finish the First Quarter on a Strong Note
Retail sales continued to make progress with an increase of 0.5% month-on-month (m/m), just a notch below the consensus estimate for an increase of 0.6%. February's reading was revised up to 0.8% m/m from 0.3% m/m reported earlier. This makes March's showing stronger than the headline appears.
Sales at autos & parts dealers declined by 1.9% m/m but February's estimate was revised up to 1.5% vs. 0.8% reported earlier. The decline affected both auto dealers and automotive parts & tire stores, where sales dropped by 2.1% m/m and 0.3% m/m, respectively. Excluding autos, retail sales were up 1.1% m/m.
With higher prices at the pump, it's no wonder that sales at gasoline stations were also up by 8.9% m/m. Building materials retailers also saw a gain of 0.5% m/m in March.
Sales in the "control group,", which exclude the above categories and are used in calculating personal consumption expenditures (and GDP), were down by 0.1% m/m. February's sales were revised to a stronger -0.9% m/m from the advance reading of -1.2% m/m.
- Within the group, the biggest drag was reported by non-store retailers where sales declined by 6.4%. The only other category in the red was health & personal care stores with a marginal decline in sales of 0.3% m/m.
- The rest of the categories reported gains with department stores (+5.4% m/m) leading the pack, followed by sporting goods, hobby, book & music stores (+3.3% m/m), clothing & accessory stores (+2.6% m/m), and food services & drinking places (+1.0% m/m). . February's reading for food services & drinking places was revised up from 2.5% to 3.0% m/m.
Key Implications
Three months of advancement bring quarterly growth to a solid +4.2% rate– slightly higher than we penciled in our forecast. Gains were concentrated in "going out" categories – a pattern consistent with a strong reopening, pointing to a potential boost to services spending (not covered in the retail sales report).
If a cure for high prices is high prices, then consumers got their fair share of medicine in March. Our estimate of real retail sales (using the CPI) points to a decrease in real spending of 0.7% month-on-month. Where we could match inflation and sales by category, the greatest price impact was at gas stations where sales declined by 8.0% in real terms, pointing to consumers becoming weary of rising gas prices. The monthly decline of 2.1% in real sales at auto dealers likely reflects the continuous shortage of supply, rather than softness in demand.
Still, demand remains solid enough for the Fed to stop hedging its bets and tighten monetary policy more aggressively in May. From the FOMC meeting minutes released last week, it was clear that some participants preferred a larger hike in March but were deterred by the tightening in financial market conditions. With financial markets more settled and inflation hot, this could be an opportune moment for the Fed to raise the federal funds rate by 50 basis points.