Sample Category Title
EURUSD Attempts to Recover ahead of ECB Decision
American equities jumped as investors cheered the start of the earnings season. Companies that published their results in the season’s first day delivered mixed earnings. Blackrock was among the biggest winners as its net income jumped to $1.46 billion, up by 18% from a year earlier. This happened as the company’s inflows jumped by $114 billion. JP Morgan Chase’ revenue rose to $31.59 billion while its adjusted earnings rose to $2.76. Bed Bath & Beyond, on the other hand, said that its revenue dropped by 22% to $2.05 billion. The top companies that will publish their results today are UnitedHealth, Rent the Runway, State Street, Wells Fargo, PNC, Morgan Stanley, and Goldman Sachs.
The price of crude oil rose modestly after the latest report by the International Energy Agency (IEA). The Paris-based agency said that its forecast for fuel consumption will be 99.4 million barrels per day. This was a slight decline from the previous estimate of 99.7 million barrels per day. The agency said that plans by countries like the United States, UK, and Germany to release 240 million barrels of oil from their reserves will help to contain the deficit. The statement came two days after Vitol announced that it will stop trading Russia-origin crude by end of the year.
The Canadian dollar rose sharply against the US dollar after the latest decision by the Bank of Canada (BOC). As was widely expected, the bank decided to hike its benchmark interest rate by 0.50% in a bid to rein in high inflation. The bank also announced that it will start a process known as quantitative tightening (QT) that will involve selling bonds it accumulated during the pandemic. It will not replace the maturing government bonds. The statement came on the same day that the RBNZ also boosted rates. Later today, the Turkish and European central banks will publish their decisions.
USDCAD
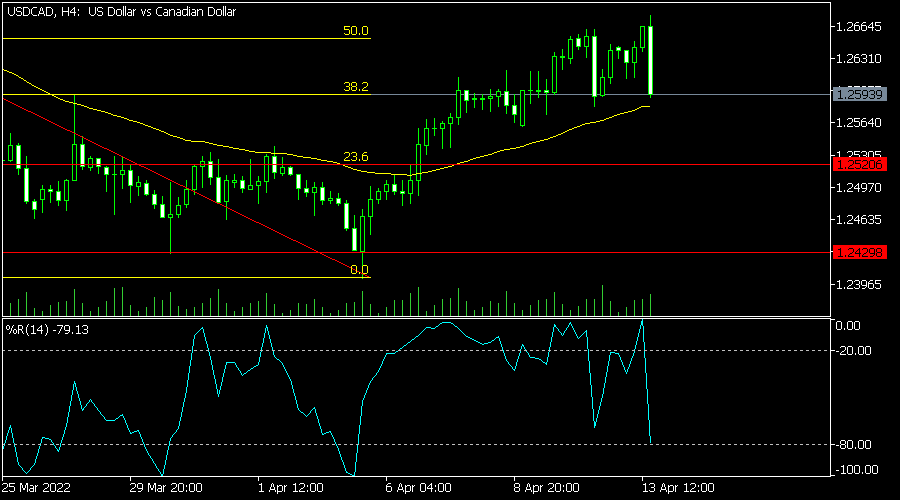
The USDCAD pair declined sharply after the BOC published its interest rate decision. It moved to a low of 1.2590, which was the lowest level since Monday. The price was also lower than the intraday high of 1.2677. On the four-hour chart, the pair moved to the 38.2% Fibonacci retracement level while the Williams %R moved to the oversold level. Therefore, the pair will likely drop and retest the support at 1.2520.
EURUSD
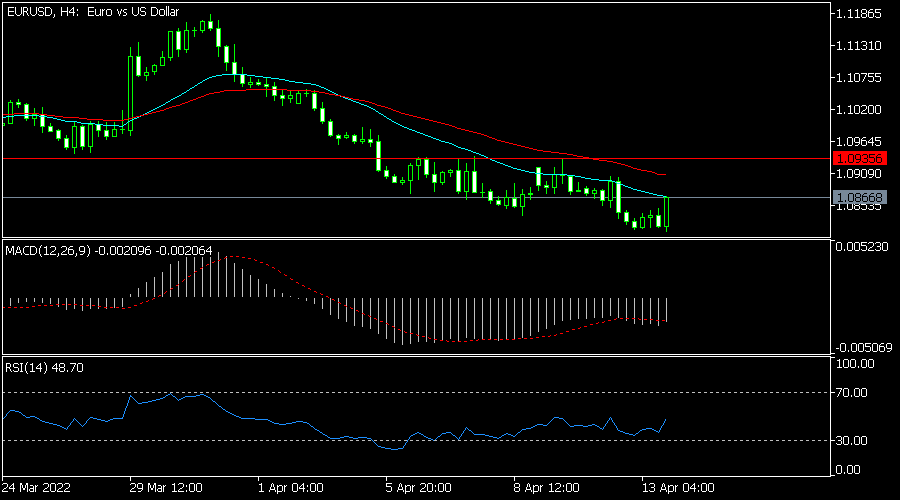
The EURUSD pair tilted upwards as investors waited for today’s ECB decision. The pair rose to a high of 1.0866, which was slightly higher than this week’s low of 1.0810. On the four-hour chart, the pair remains below the short and longer moving averages. The MACD has moved below the neutral level while the Relative Strength Index (RSI) has tilted upwards. Therefore, the pair will likely keep rising ahead of the ECB decision.
XBRUSD
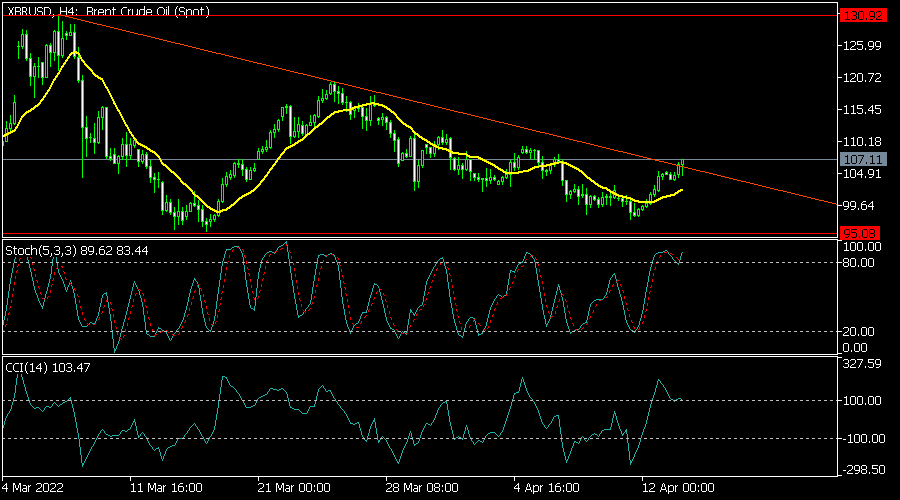
The XBRUSD pair rose to an intraday high of 106.87 after the report by IEA. On the four-hour chart, the pair managed to move above the upper side of the descending trendline. It also moved slightly above the 25-day and 50-day moving averages while oscillators have been rising. Therefore, the pair will likely resume the bearish trend because of the descending triangle pattern.
GBPCAD Creeps Up, Eyeing the Falling 200 MA
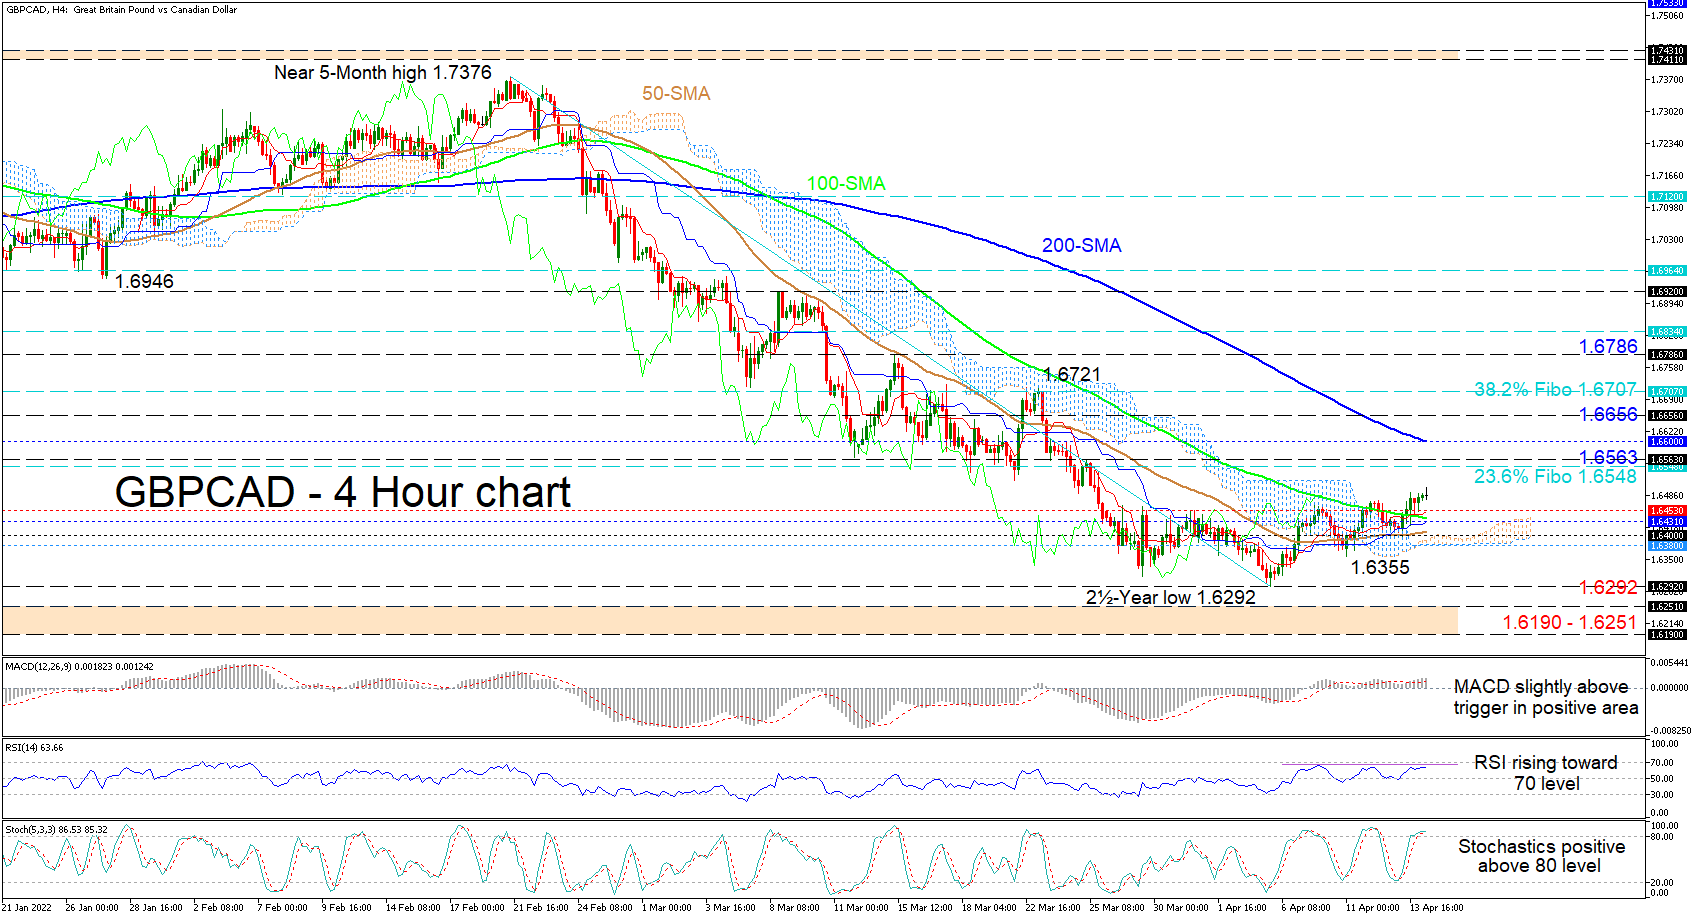
GBPCAD is sustaining its moderate bullish strides from the recently recorded two-and-a-half-year low of 1.6292, which has now steered the price over the Ichimoku cloud and the 50- and 100-period simple moving averages (SMAs). The unwavering bearish 200-period SMA continues to promote the downtrend. Meanwhile, the softened decline of the 100-period SMA, along with the gradual incline in the 50-period SMA, suggests the price may hike towards the 1.6548 level, which is the 23.6% Fibonacci retracement level of the down leg from 1.7376 until 1.6292.
The improving Ichimoku lines imply that positive forces are active, while the short-term oscillators hint that positive momentum is looking feeble. The MACD is holding a tad above its red trigger line in the positive region. However, the positive charge of the stochastic oscillator is softening in the overbought section, while the RSI is struggling to reach the 70 level.
If negative price action intensifies, a fortified support zone from the red Tenkan-sen line at 1.6453 until the 1.6400 handle may prove difficult to dive past. If sellers overpower this critical section, the cloud’s floor at 1.6380 and the adjacent 1.6355 low could then be challenged. Moving lower, the pair may attempt to revisit the near 30-month low of 1.6292. Should the pair rekindle the downtrend, the 1.6190-1.6251 support boundary stretching back to the troughs from the first half of October 2019 could draw attention.
On the other hand, if the pair maintains its upward bearing, resistance could commence at the 23.6% Fibo of 1.6548 and the March 25 high of 1.6563 before a more profound positive retracement confronts the descending 200-period SMA at 1.6600. If the 200-period SMA fails to curb additional advances in the pair, the price may test the 1.6656 barrier prior to aiming for the 38.2% Fibo of 1.6707. If the pair overruns the 1.6721 high too, the bulls could then be encouraged to target the 1.6786 border.
Summarizing, GBPCAD is exhibiting a positive vibe as the price is improving above the cloud and the 50- and 100-period SMAs. However, should the price remain beneath the 23.6% Fibo of 1.6548 and the 1.6563 high, risks to the downside may linger.
AUDUSD Stuck Below 20-SMA; Short-Term Outlook Still Fragile
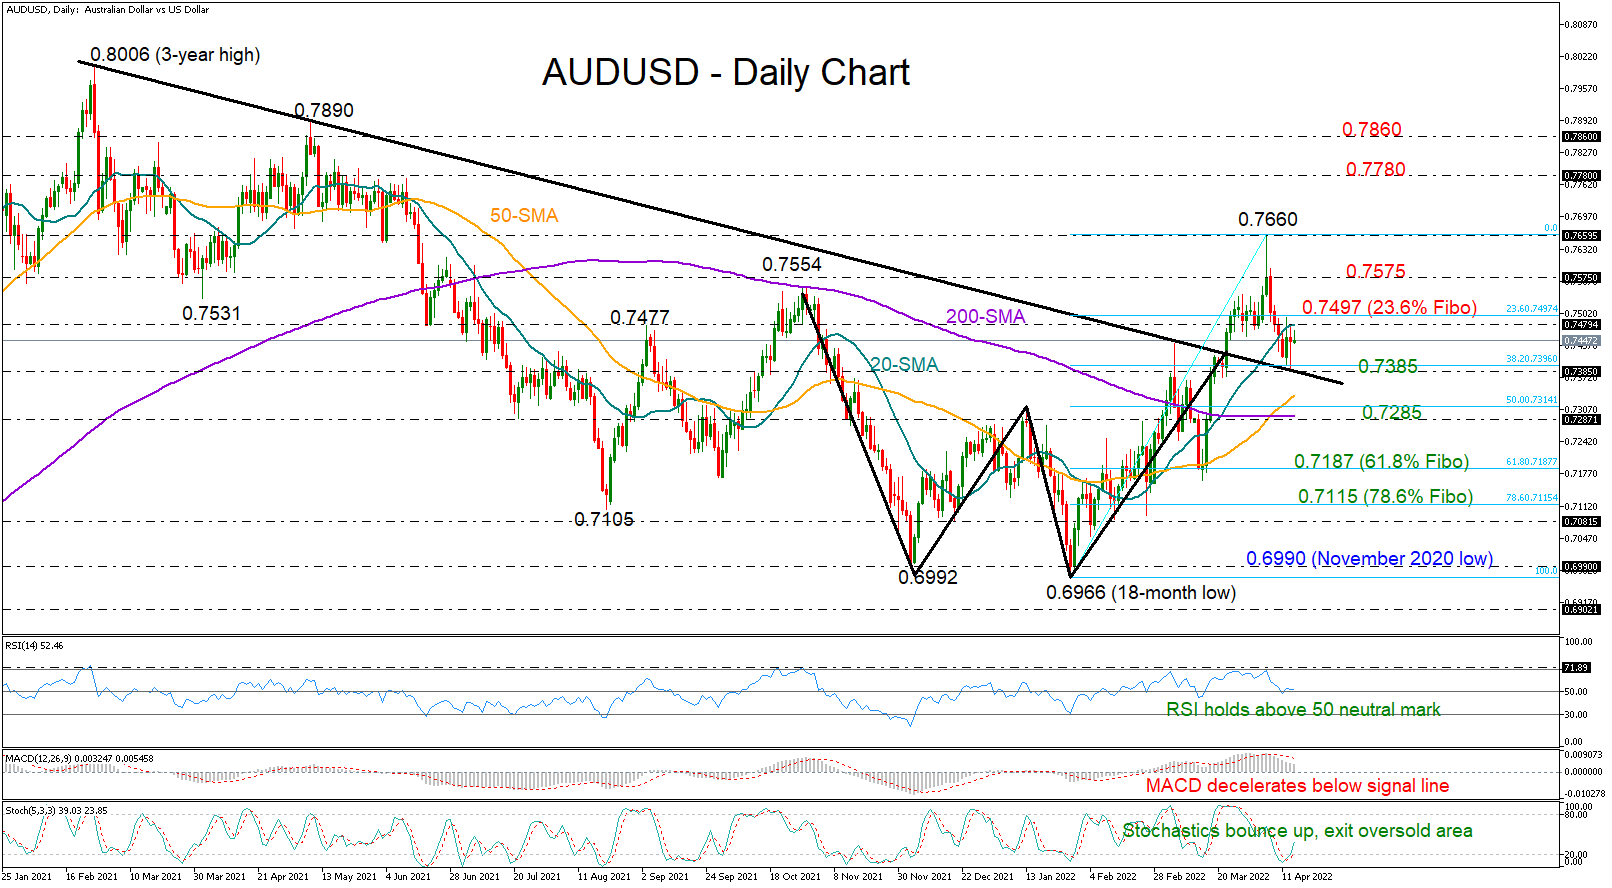
AUDUSD recouped most of Wednesday’s losses to stay within the 0.7400 zone after stepping on the resistance-turned-support trendline. Despite that, bullish actions were limited as the 20-day simple moving average (SMA) prevented any increases above 0.7480.
This line continues to block the way higher so far on Thursday, questioning the upside reversal in the RSI and the Stochastics. The MACD remains negatively charged below its red signal line, feeding some caution as well. As regards the market trend, however, the golden cross between the 50- and the 200-day SMAs is preserving optimism that the short-term positive pattern following the completion of a bullish double bottom structure around 0.6992 could gain extra legs.
For now, a decisive move above 0.7480 and, more importantly, an extension above the 23.6% Fibonacci retracement of the 0.6966 – 0.7660 upleg at 0.7497 is required to boost the price towards last week’s barrier of 0.7575. The previous peak at 0.7660 could be the next target, with the bulls likely aiming to upgrade the short-term positive outlook above that bar and drive the price towards 0.7780.
In the negative scenario, where the 20-day SMA fortifies selling tendencies, the spotlight will shift back to the trendline and the 0.7385 level. The 38.2% Fibonacci is in the neighborhood too. Hence, any violation at this point could confirm additional declines towards the 200-day SMA at 0.7287, unless the 50-day SMA manages to add strong footing beforehand at 0.7336. Should the bears persist, the door would open for the 61.8% Fibonacci of 0.7187.
In brief, despite its latest bounce in AUDUSD, negative risks continue to linger in the background. A continuation above 0.7497 could reduce skepticism, while a drop below 0.7385 could enhance selling appetite.
US Dollar in Peak Inflation Hopes
Rallies by the euro and sterling pushed the US dollar lower overnight as markets in New York continued to price in peak inflation expectations and assume that all the Fed tightening was now priced into US markets. The dollar index fell sharply by 0.46% to 99.85 after touching my initial target of 100.50 earlier in the day. The selloff has continued in Asia with euro and sterling leading the way, with the yen also rallying after some official noise from Tokyo around exchange movements. The dollar index has fallen by 0.24% to 99.60.
The dollar index is now approaching support around 99.45, and there appears to be some pre-holiday long covering in the market as investors reduce long US dollar exposure and book profits. Several tightening moves by central banks this week, as well as hawkish risk around the ECB, are also prompting a rebalancing. Failure of 99.45 could see losses extend to 97.70 next week, but the US dollar remains in an uptrend if longer-term support at 96.50 holds.
EUR/USD jumped 0.60% overnight to 1.0890, adding another 0.23% to 1.0915 in Asian trading. A widening lead in the election polls by France’s President Macron lifted euro sentiment, and investors bought back shorts ahead of the ECB policy meeting today. Given the hawkish moves by central banks over the last week, that is a sensible strategy ahead of the Easter holiday, despite Ukraine risks. A hawkish tilt by the ECB could set off a large, short squeeze that could extend to the 1.1200 to 1.1300 region where the longer-term resistance line comes in. On the downside, the 1.0800 region is crucial longer-term support. The support line extends back to 2017 and then, if your charts are long enough, all the way back to 1985. A time when I was putting my Air Force application in and had pastel coloured tee-shirts and a flat-top haircut. A daily and weekly close below 1.0800 will be a major bearish signal for EUR/USD.
Sterling jumped by 0.90% to 1.3117 overnight as UK inflation climbed to 30-year highs. That saw tightening by the Bank of England quickly priced into the UK yield curve, starting with 0.25% next month. GBP/USD has climbed another 0.20% in Asia to 1.3140 as shorts are unwound ahead of Easter. A hawkish ECB today should allow sterling to coattail the expected euro rally and could extend gains to 1.3250.
With US yields edging lower overnight, USD/JPY remained steady once again at 125.40 before easing to 125.30 in Asia. USD/JPY is just below its multi-year highs at 125.80 and despite some more official noise from Tokyo today, it still looks likely to test higher next week. The cross remains entirely at the mercy of the US/Japan rate differential, and if US yields fall once again tonight, a short-term below 125.00 is entirely possible. Any drop to 124.00 and 123.50 should find plenty of keen dip buyers. Only a very sharp fall by US yields changes the bullish outlook.
Asian currencies held steady overnight once again, with lower US yields and a weaker US dollar versus the majors being offset by higher oil prices and ongoing China concerns. Asian currencies booked only minor gains overnight and remain steady in Asia today. The only mover of note has been USD/SGD, which has fallen by 0.75% to 1.3520 after the MAS tightened monetary policy via the S$NEER today and maintained a hawkish outlook. USD/CNY and USD/CNH are almost unchanged overnight as any US dollar weakness is offset by Euro strength in the CFETs basket and the expectation of an imminent RRR rate cut. Both USD/CNY and USD/CNH are approaching one-year trendline resistance levels at 6.3770 and 6.3950 respectively. Daily closes above would signal another leg of yuan weakness and limit gains versus the greenback by other Asian currencies.
GBP/JPY Daily Outlook
Daily Pivots: (S1) 163.58; (P) 164.21; (R1) 165.46; More...
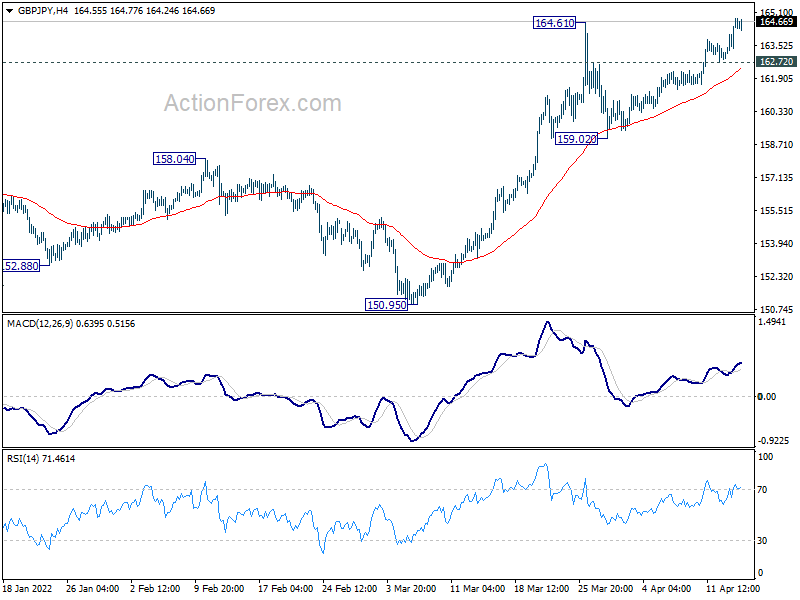
GBP/JPY's breach of 164.61 resistance indicates resumption of larger up trend. Intraday bias is back on the upside. Further rise should be seen to long term fibonacci level at 167.93 next. On the downside, below 162.72 minor support will turn intraday bias neutral again first. But overall outlook will stay bullish as long as 159.02 support holds.
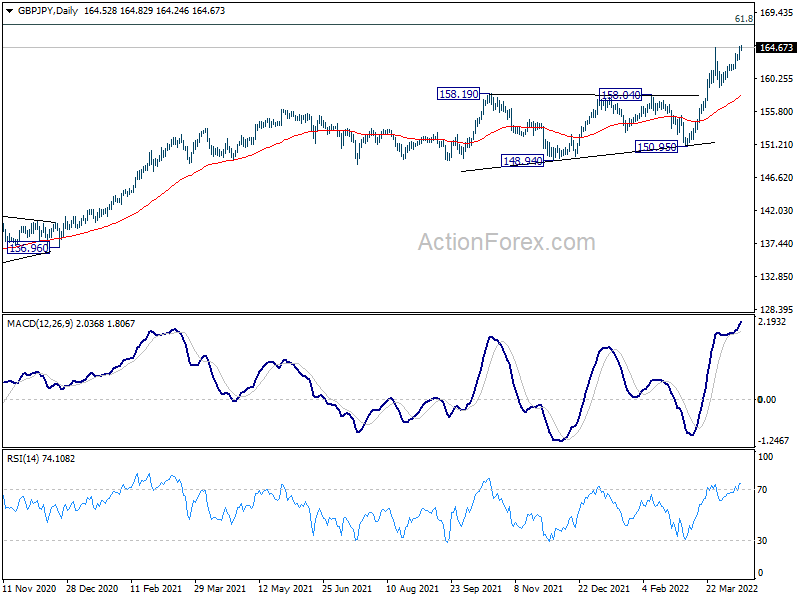
In the bigger picture, up trend from 123.94 (2020 low) is still in progress, and notable support from 55 week EMA affirms medium term bullishness. Next target is 61.8% retracement of 195.86 (2015 high) to 122.75 (2016 low) at 167.93. Sustained break there will be a long term bullish signal. This will now remain the favored case as long as 150.95 support holds.
EUR/JPY Daily Outlook
Daily Pivots: (S1) 136.08; (P) 136.48; (R1) 137.26; More....
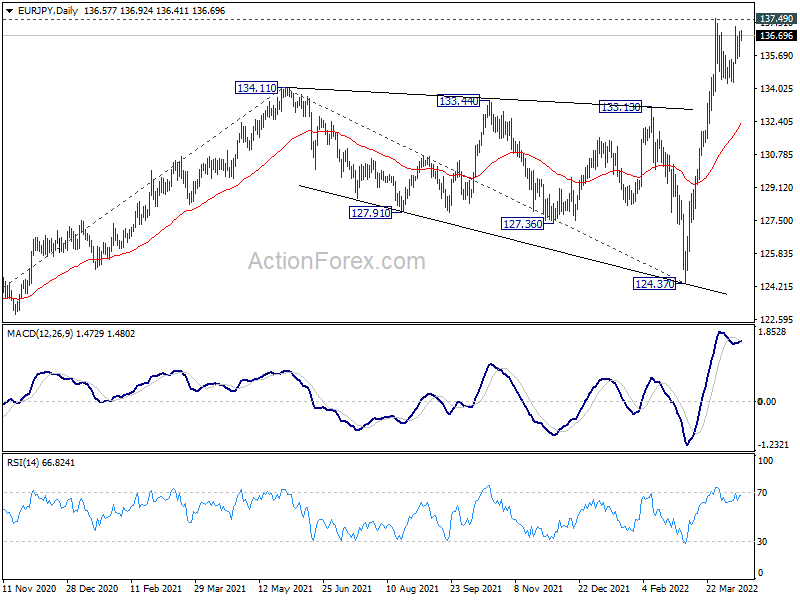
Range trading continues in EUR/JPY and intraday bias remains neutral. Further rise is expected with 133.70 support intact. On the upside, sustained break of 137.49 resistance will resume larger up trend for 144.06 projection level next. However, firm break of 133.70 will turn bias back to the downside for deeper pull back.
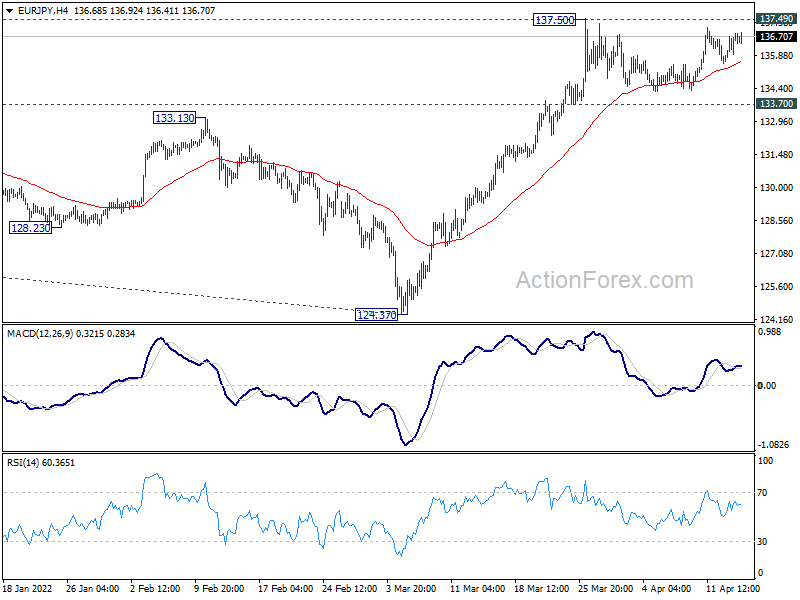
In the bigger picture, up trend from 114.42 (2020 low) is in progress. Sustained break of 137.49 (2018 high) will resume larger pattern from 109.30 (2016 low). Next target will be 100% projection of 114.42 to 134.11 from 124.37 at 144.06. In any case, outlook will now remain bullish as long as 124.37 support holds, in case of deep pull back.
EUR/GBP Daily Outlook
Daily Pivots: (S1) 0.8289; (P) 0.8316; (R1) 0.8331; More...
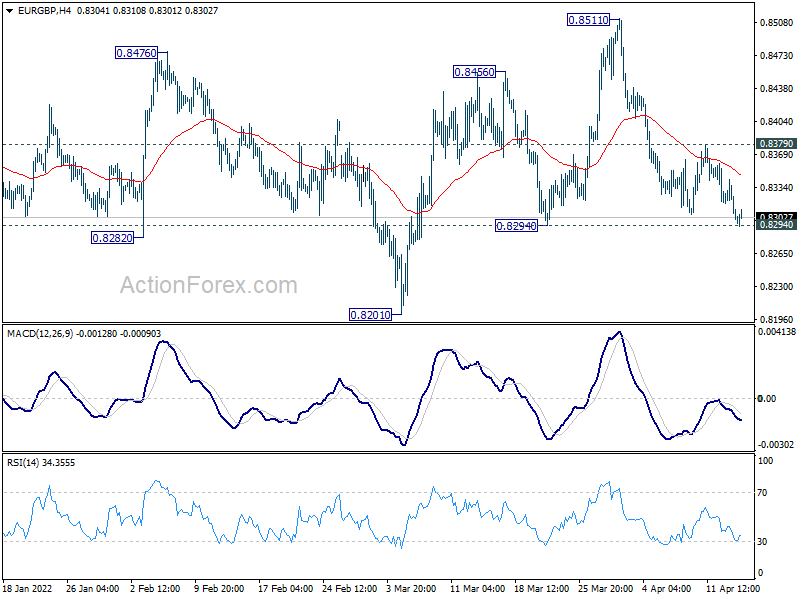
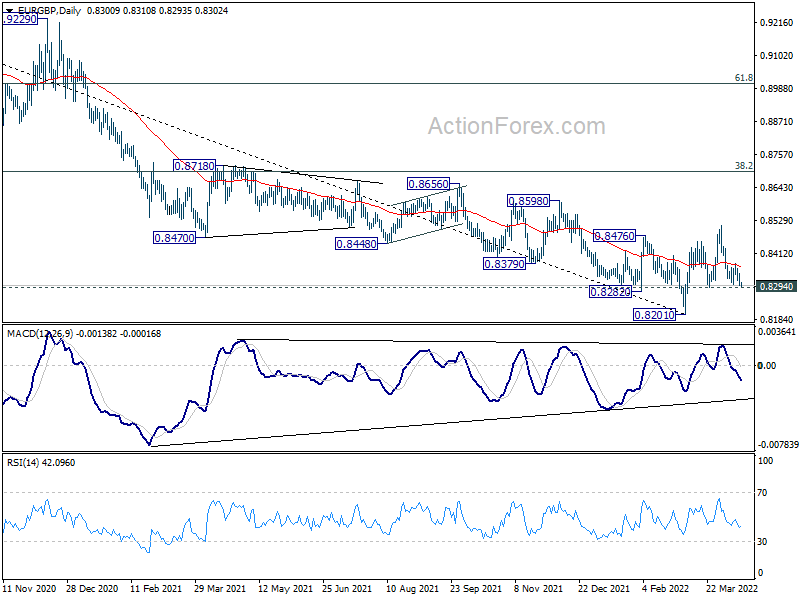
Intraday bias in EUR/GBP remains neutral for the moment. On the downside, break of 0.8294 will argue that rebound from 0.8201 has completed at 0.8511, and revive near term bearishness. Intraday bias will be back on the downside for retesting 0.8201 low. On the upside, however, above 0.8379 minor resistance will turn bias back to the upside. Further break of 0.8511 will reaffirm that 0.8201 is a medium term bottom, and target 0.8697 medium term fibonacci level next.
In the bigger picture, a medium term bottom should be in place at 0.8201, on bullish convergence condition in daily and weekly MACD. Rise from there could either be a correction to the down trend from 0.9499 (2020 high), or a medium term up trend itself. In either case, further rise should be seen to 38.2% retracement of 0.9499 to 0.8201 at 0.8697. Sustained break there will target 61.8% retracement at 0.9003. This will remain the favored case as long as 0.8294 support holds.
EUR/AUD Daily Outlook
Daily Pivots: (S1) 1.4522; (P) 1.4583; (R1) 1.4673; More...
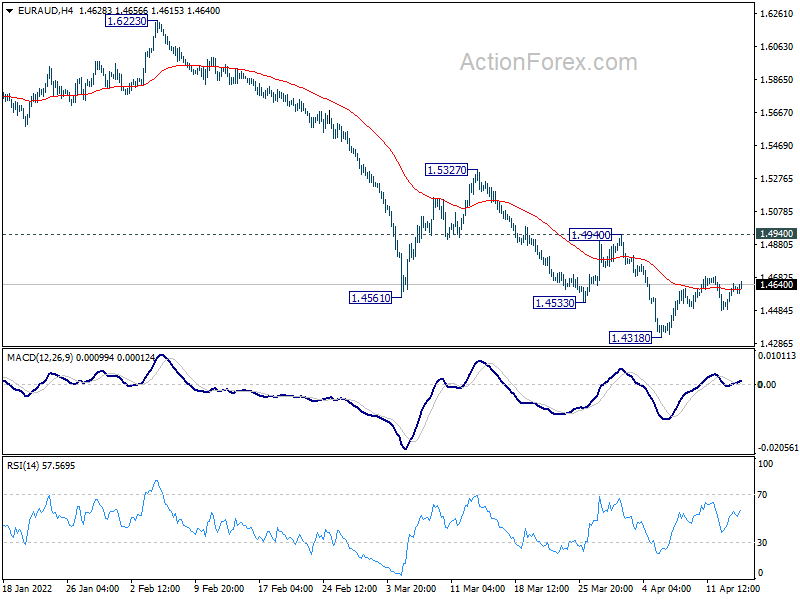
Intraday bias in EUR/AUD remains neutral as sideway trading continues. Outlook also stays bearish with 1.4940 resistance intact. On the downside, break of 1.4318 will resume larger down trend to 1.3624 long term support next. On the upside, however, firm break of 1.4940 will indicate short term bottoming and turn bias back to the upside for 1.5327 resistance instead.
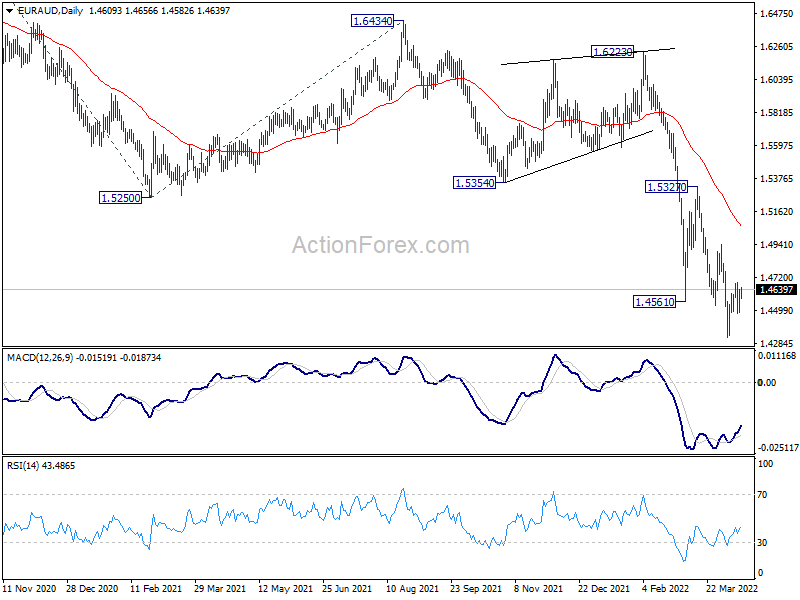
In the bigger picture, fall from 1.9799 is seen as a long term impulsive move. Next target is 61.8% projection of 1.9799 to 1.5250 from 1.6434 at 1.3623, which is close to 1.3624 long term support (2017 low). Some support could be seen there to bring interim rebound. But overall, break of 1.5354 support turned resistance is needed to be the first sign of medium term bottoming. Otherwise, outlook will stay bearish in case of recovery.
EUR/CHF Daily Outlook
Daily Pivots: (S1) 1.0118; (P) 1.0151; (R1) 1.0213; More....
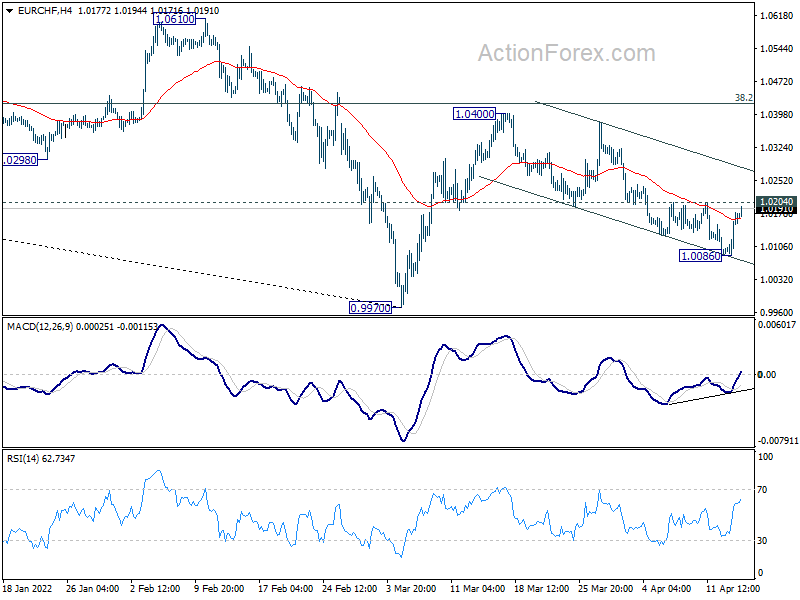
Intraday bias in EUR/CHF is turned neutral with current recovery. On the upside, break of 1.0204 minor resistance will argue that pull back form 1.0400 has completed already. Intraday bias will be back on the upside for 1.0400 first. Break will resume whole rebound from 0.9970 towards 1.0610 resistance. On the downside, though, below 1.0086 will resume the fall towards 0.9970 low.
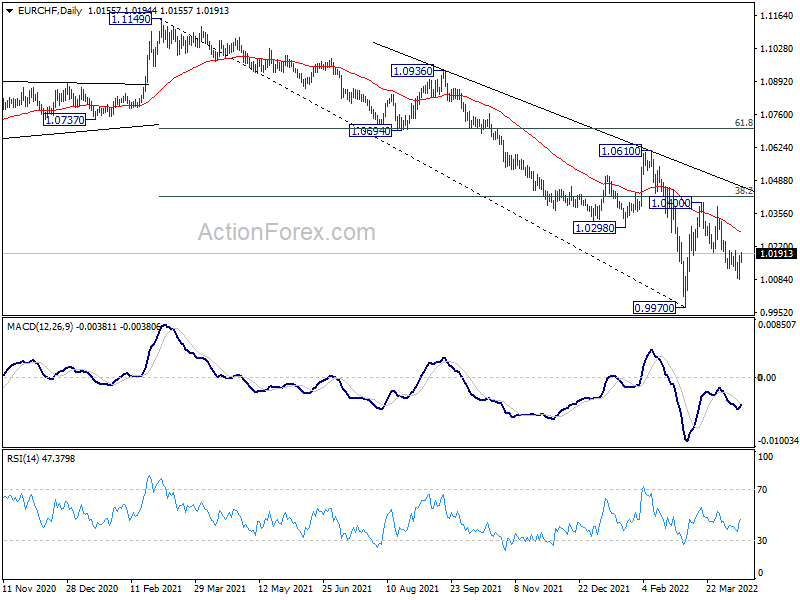
In the bigger picture, long term down trend from 1.2004 (2018 high) is still in progress. Next target is 100% projection of 1.2004 to 1.0505 to 1.1149 at 0.9650. In any case, sustained break of 1.0505 support turned resistance (2020 low) is needed to be the first sign of medium term bottoming. Otherwise, outlook will remain bearish.
USD/CAD Daily Outlook
Daily Pivots: (S1) 1.2520; (P) 1.2598; (R1) 1.2641; More...
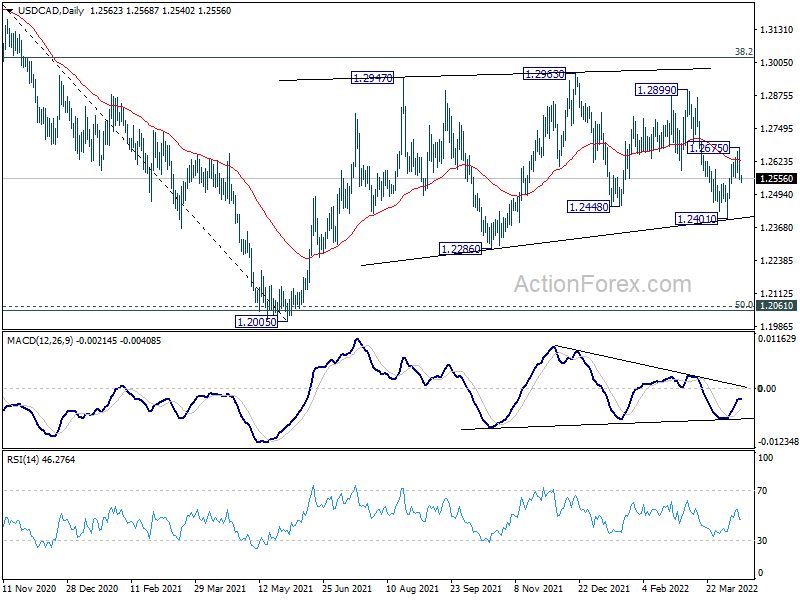
Break of 1.2561 minor support argues that rebound from 1.2401 has completed at 1.2675. Intraday bias is back on the downside for 1.2401 support again. ON the upside, break of 1.2675 will flip bias back to the upside for 1.2899 resistance instead.
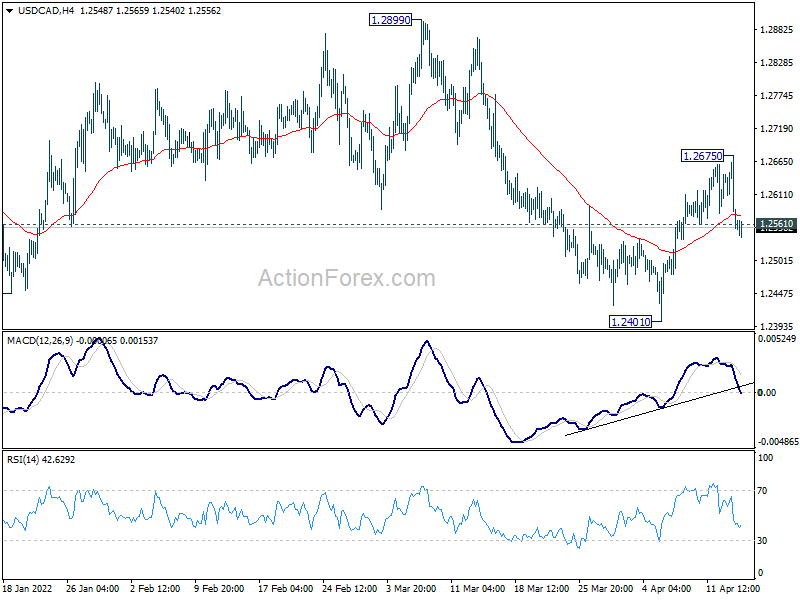
In the bigger picture, focus stays on 38.2% retracement of 1.4667 (2020 high) to 1.2005 (2021 low) at 1.3022. Sustained break there should confirm that the down trend from 1.4667 has completed after defending 1.2061 long term cluster support. Further rise would then be seen towards 61.8% retracement at 1.3650. However, rejection by 1.3022 will maintain medium term bearishness. Break of 1.2005 will resume the down trend from 1.4667 and that carries larger bearish implications too.