Sample Category Title
AUDUSD Posts Some Bearish Correction in Short Term
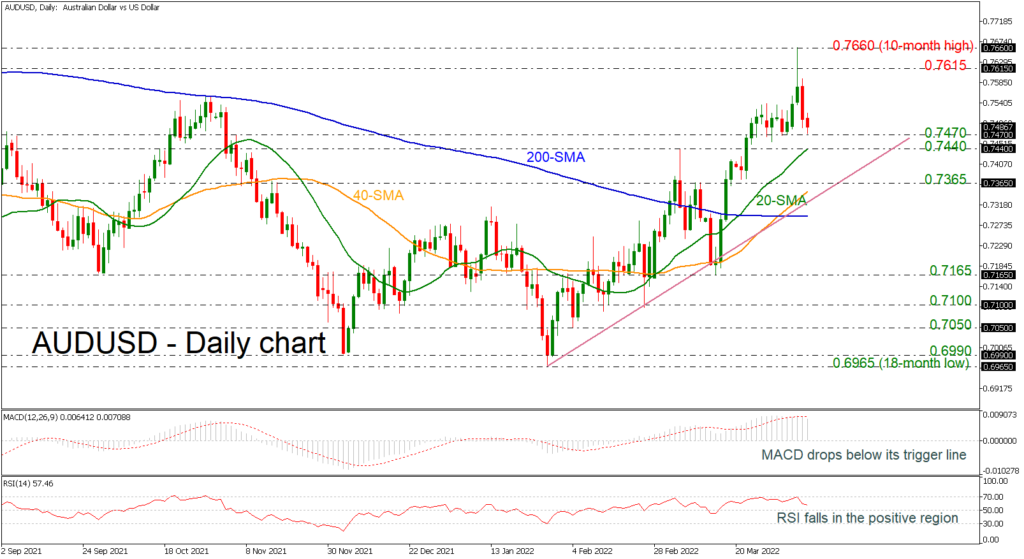
AUDUSD is retreating after the aggressive jump towards the ten-month peak of 0.7660 in the previous days. The price reversed back towards the 0.7470 support, having failed to ease below it over the last two weeks. The MACD oscillator dropped beneath its trigger line in the positive region, while the RSI is slowing momentum in the bullish territory.
Further declines may meet support around the 0.7440-0.7470 zone, which encapsulates the 20-day simple moving average (SMA). Even lower, support could occur around the 0.7365 barrier, which holds around the medium-term ascending trend line. If there is a successful decline beneath this line, the bottom of 0.7165 would turn the bias to neutral.
On the upside, resistance could come around the 0.7615 resistance ahead of the latest high of 0.7660, that being the ten-month high of 0.7660. Higher still, the May’s 2021 high of 0.7775 would increasingly come into scope.
The medium-term picture continues to look predominantly bullish, with trading activity taking place above the 200-day SMAs.
Overall, the very short-term outlook appears mostly bearish, and the medium-term one remains bullish for the most part.
BTCUSD Falls Below 45,000; Bias Weakens
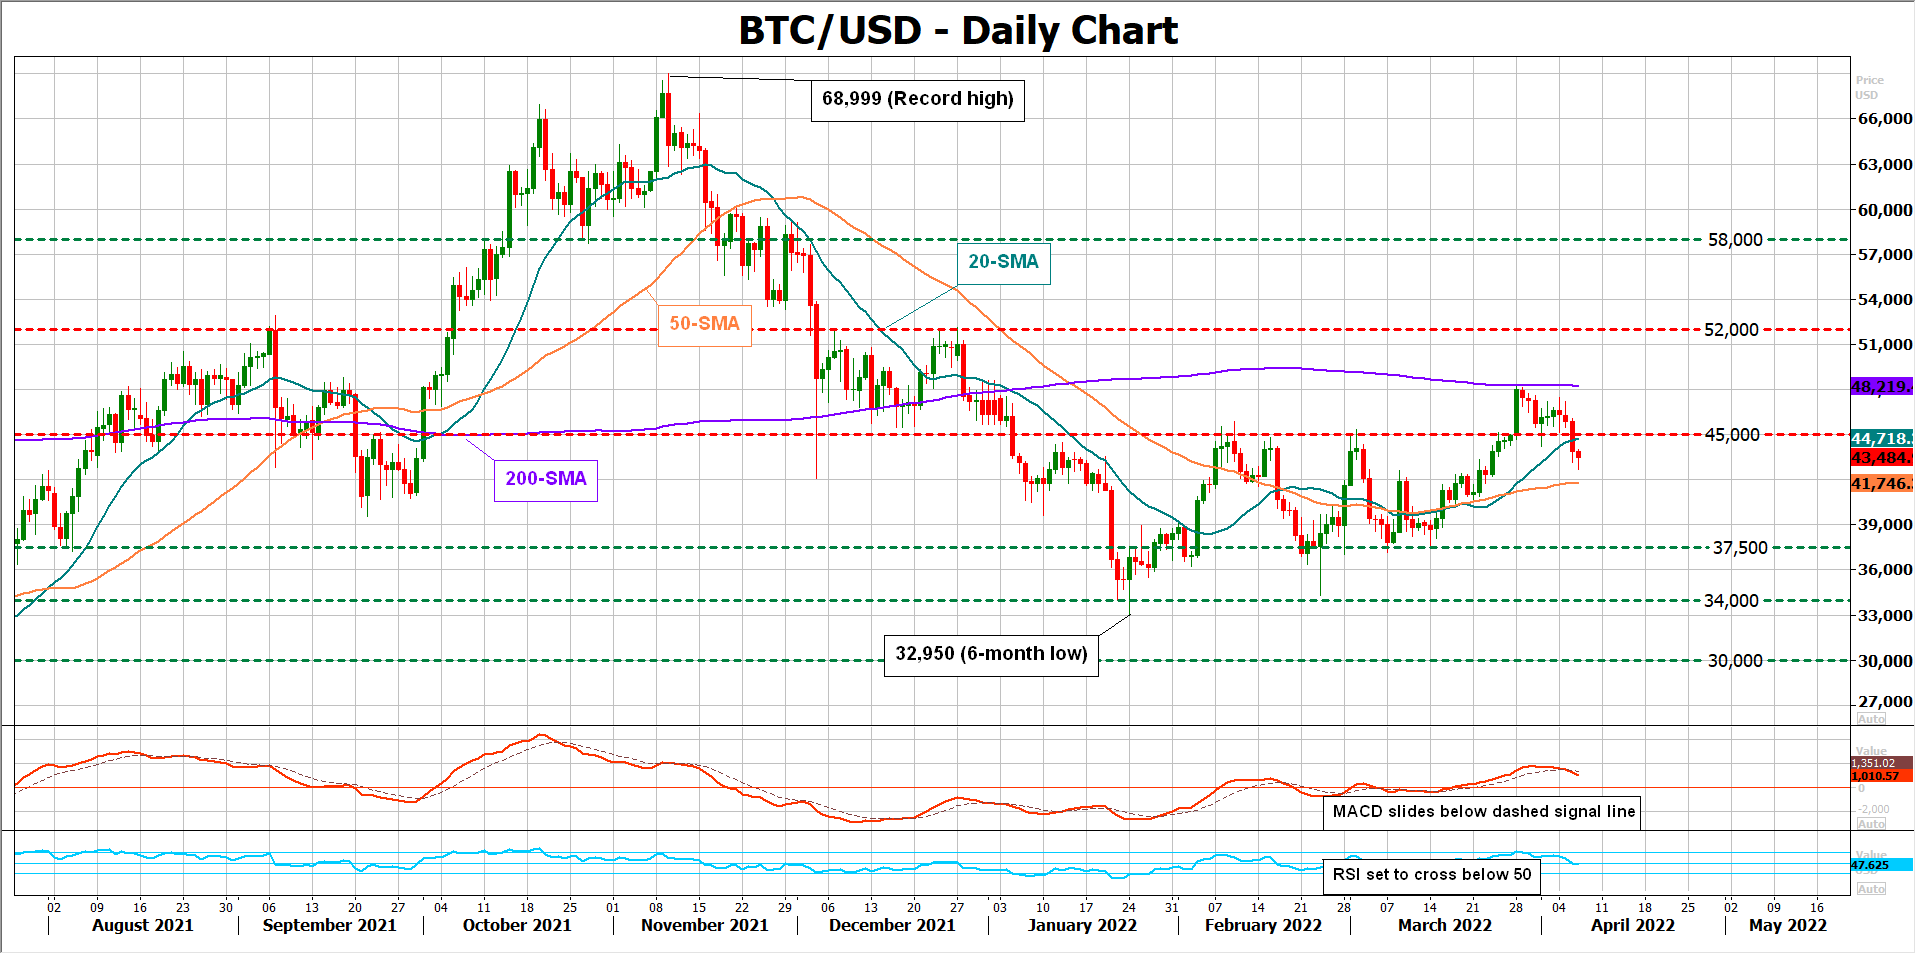
BTCUSD (Bitcoin) extended its pullback from the 200-day simple moving average (SMA) below the key 45,000 barrier on Wednesday, raising speculation that selling pressures could further grow in the short term.
The momentum indicators endorse the negative momentum in the popular crypto as the MACD has slid beneath its dashed signal line, while the RSI is set to cross below its 50 neutral mark.
The 50-day SMA is nearby at 41,744 and unless it stands firm, the bears could pick up steam towards the 37,500 support zone. Moving lower, the sell-off could then take a breather near January’s and February’s lows around 34,000 before it heads for the 30,000 round-level.
On the upside, a step above the 45,000 mark could push for a break beyond the flattening 200-day SMA at 48,218. If efforts prove successful this time, the price could speed up to 52,000, while higher, another impressive rally could follow up to 58,000.
Summarizing, the latest decline in BTCUSD increased negative risks in the market. Traders could further reduce exposure in the market if the price breaks below its 50-day SMA at 41,746.
Daily Technical Analysis
EUR/USD
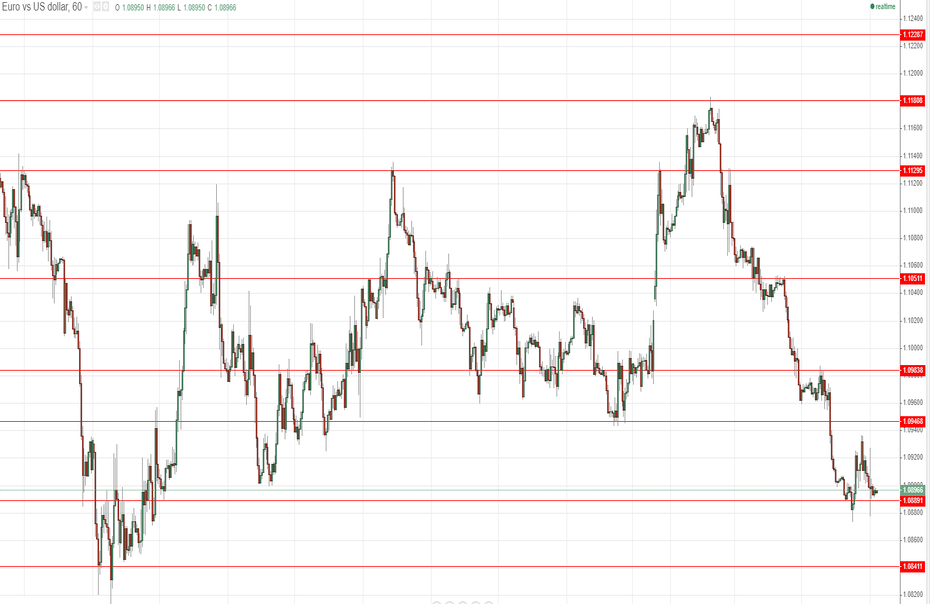
The bears still cannot gain enough momentum to violate the support zone at 1.0890 and the expectations for today’s trading session are for this level to limit the sell-offs and for the pair to enter a consolidation phase between the levels at 1.0890 and the resistance at 1.0946. A test of the aforementioned level of resistance could be considered a possible scenario before an eventual resumption of the downtrend takes place. Only a confirmed breach of the support at 1.0890 would pave the way for the pair towards the support at 1.0840. The current level seems to be a good entry point for the bulls, who could take advantage of a short-term correction targeting the resistance zones at 1.0946 and at 1.0983. Higher volatility can be expected at 11:30 GMT when the ECB meeting minutes regarding its monetary policy will be released, as well as at 12:30 GMT when the data regarding the initial jobless claims for the U.S. will also be published.
USD/JPY
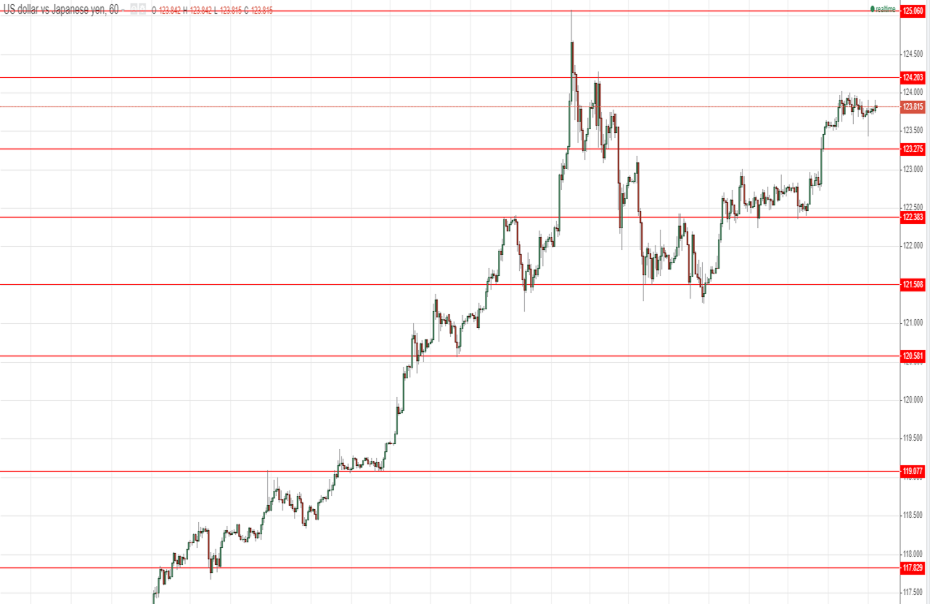
The pair is still consolidating in the tight range between the levels of 123.27 and 124.20 and only a confirmed breach of either the upper or the lower border would define the market’s direction. However, the expectations remain positive – for a test of 124.20. A confirmed breach of this level would most likely lead to a test of the local high at 125.00. On the other hand, if the bears prevail and manage to violate the critical support at 123.27, then this should lead to a sell-off targeting the support at 122.38.
GBP/USD
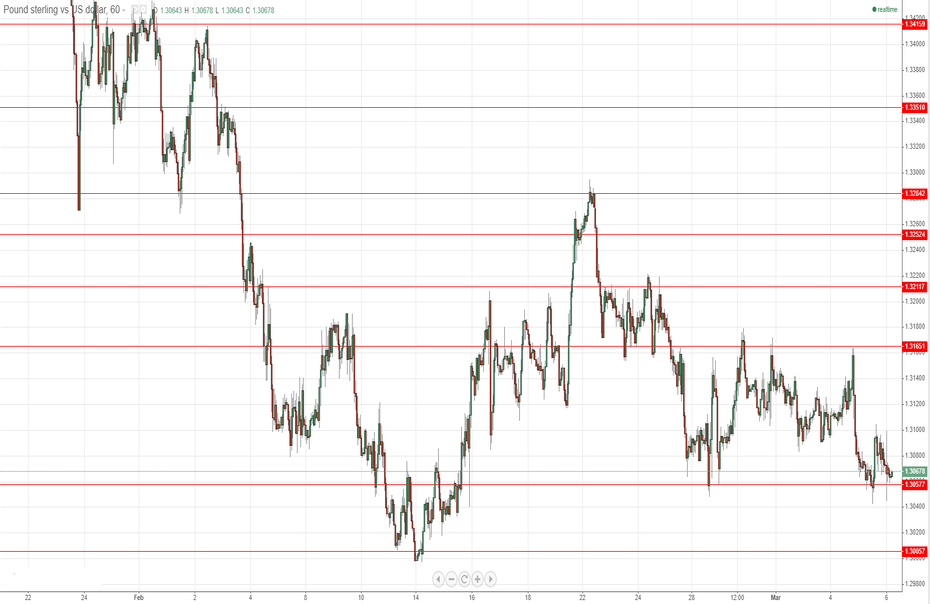
The bears still cannot violate the critical support at 1.3050, and at the time of writing, the pair is hovering just above this level. The forecasts for today’s trading session are for this zone to remain unbreached and for the pair to head towards a test of the resistance at 1.3165. However, a possible breach of the support at 1.3057 would most probably lead to an impulsive downward movement and a test of the psychological level at 1.3000.
EUGERMANY40
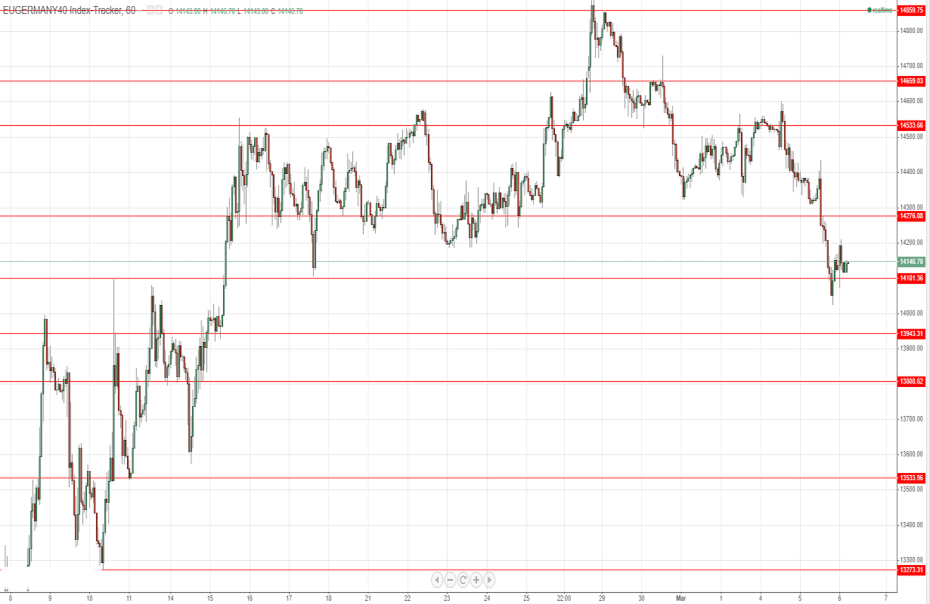
The German index still cannot drop below the psychological level at 14000 and the forecasts are for a corrective move towards the resistance at 14300. A short consolidation in the range of 14100 –14300 seems to be the most likely scenario for today’s trading session. The market’s sentiment, however, remains negative – for a depreciation of the index and a test of the support zone at 13943, but only a confirmed breach of the level at 14100 could be considered a signal for a downward move towards the mentioned level. A spike in volatility can be expected at 11:30 GMT when the ECB meeting minutes regarding its monetary policy will be published.
US30
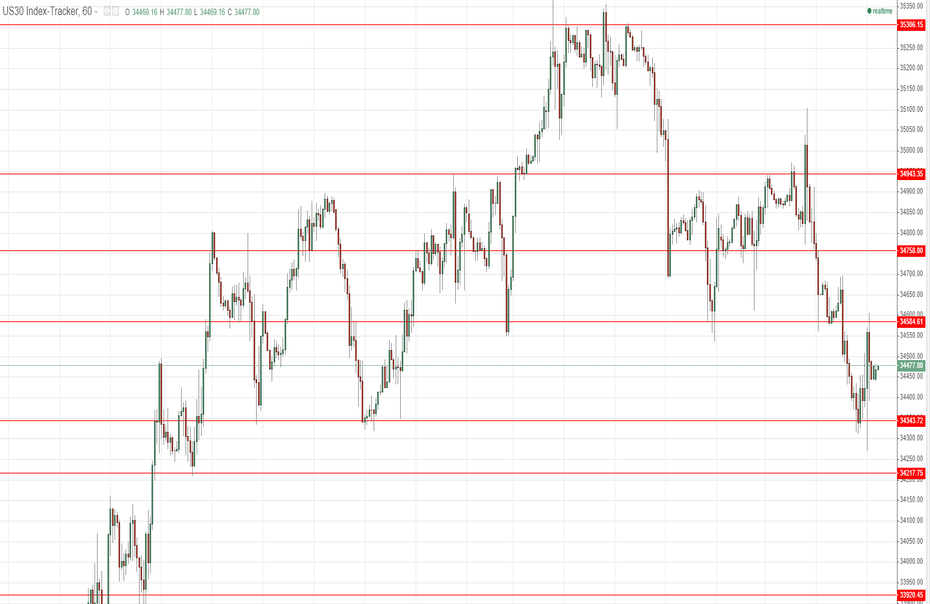
The sell-off was limited at the support zone, located at around 34343, and we witnessed a corrective move and a test of the resistance at 34584. The test of the resistance was unsuccessful, leading to the assumption that this was a corrective move and so the expectations for today’s trading sessions are for the bears to attack the support at 34343, where a successful breach would most likely lead to another downward movement towards the support level at 34217.
S&P 500, Nasdaq 100 Slip after Hawkish FOMC Minutes
American stocks declined for the third straight day as concerns over the Federal Reserve continued. The Dow Jones declined by more than 300 points while the Nasdaq 100 fell by 350 points. Minutes published by the Fed showed that most officials were comfortable with a hawkish stance. As such, many advocated for a more aggressive policy to curb the rising inflation. Some of the proposed measures are to increase interest rates in six of this year's meetings and to start scaling down the balance sheet in a process known as quantitative tightening. It will cut its assets by $95 billion per month. Some of the top movers in Wall Street were companies like Confluent, Workhorse, and Carvana.
The price of crude oil declined slightly after the latest inventories data from the Energy Information Administration (EIA). The agency said that inventories in the US rose by 2.42 million barrels last week after falling by over 3.4 million barrels a week earlier. Analysts were expecting the numbers to show that inventories fell by over 2 million barrels. The report showed that crude oil imports declined by over 665k barrels because of the recent sanctions on Russia. Gasoline inventories declined by more than 2.04 million barrels. Meanwhile, the European Union is considering sanctioning the Russian oil and gas industries.
The economic calendar will not have any major events today. Therefore, investors will continue focusing on the FOMC minutes and the crisis in Ukraine. Some of the key economic events will be the Switzerland unemployment rate data and Eurozone retail sales. The European Central Bank will also publish minutes of its last meeting. Also, investors will listen to speeches by Fed members Williams, Bostic, and Charles Evans.
EURGBP
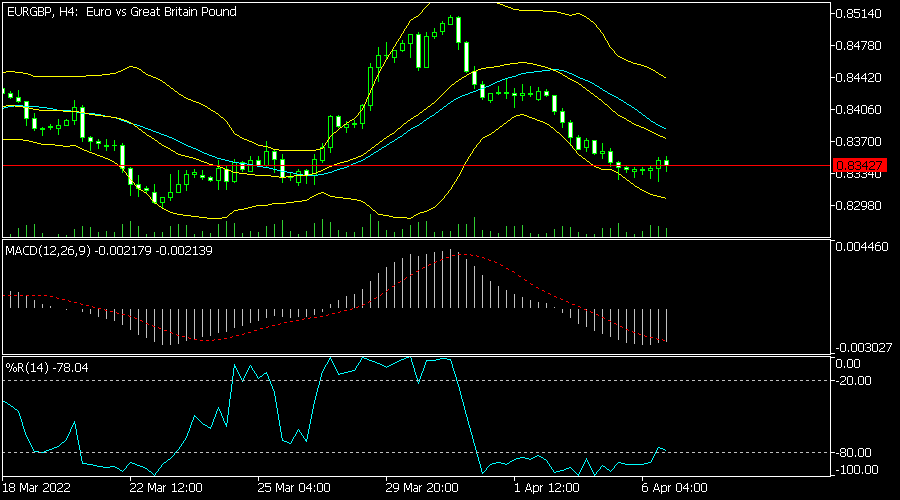
The EURGBP pair declined slightly as the euro continued its weakness. It dropped to a low of 0.8342, which was slightly lower than last month's low of 0.8511. It has also moved below the 25-day moving average while the price is between the lower and middle lines of the Bollinger Bands. The MACD and the Williams % Range have moved to the oversold level. Therefore, the pair will likely have a bearish breakout in the coming days.
XNGUSD
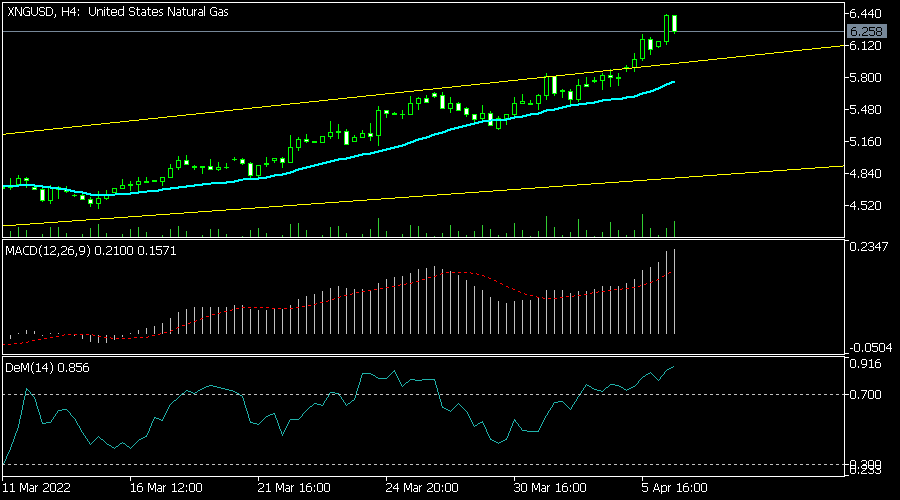
The XNGUSD pair has been in a strong bullish trend in the past few days. It rose to a high of 6.41, which was the highest point in months. It has moved above the upper side of the ascending channel pattern and the 25-day moving average. The MACD has also risen above the neutral level. DeMarker has risen above the overbought level. Therefore, the pair will likely continue rising today.
EURUSD
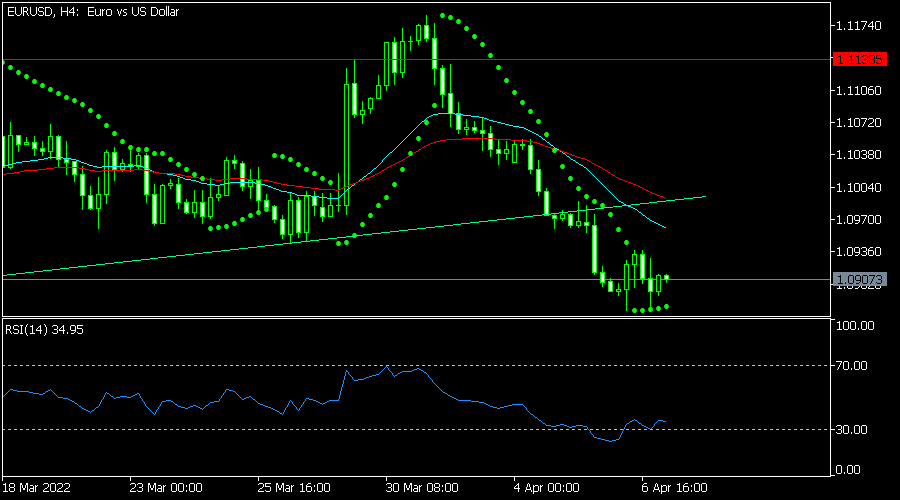
The EURUSD pair declined in the overnight session after the latest Fed minutes. It moved to a low of 1.0910, which was the lowest level since the first week of March. It remains below the dots of the Parabolic SAR and the 25-day moving average. It also fell below the 23.6% Fibonacci retracement level. Therefore, the pair will likely keep falling amid a hawkish Fed tone.
Fed’s Hasty Normalization Plans Have a Feeling of “Behind the Curve” Around Them
Markets
FOMC Minutes took centre stage yesterday and rightly so. They confirmed willingness from Fed governors to step up the tightening cycle. Many participants noted that one or more [half-percentage-point] increases in the target range could be appropriate at future meetings, particularly if inflation pressures remained elevated or intensified. Apart from the bigger rate hikes, Minutes offered details on the Fed’s balance sheet reduction plan which will be presented and started at the May 4 policy meeting. The Fed will stop reinvesting the proceeds of maturing assets at a monthly pace of $95bn. This will be split over $60bn of US Treasuries and $35bn of mortgage-backed securities. The US central bank gives itself three months’ time to arrive at this pace. Once the quantitative tightening process is decently up and running, the Fed will contemplate active selling of mortgage-backed securities in addition to the natural roll-off. The US central bank indicated earlier that it wants to end up with US Treasuries only (currently $5.8tn) on its balance sheet. The total amount of MBS on the Fed’s $9tn balance sheet is around $2.7tn. If the natural amount of monthly maturities doesn’t reach the targeted $95bn, the Fed will top-up the amount by releasing treasury bills. The Fed’s hasty normalization plans have a feeling of “behind the curve” around them. Only 1 month ago, the Fed was still buying bonds on a net basis. In the previous QT-cycle, it took them one year to hit the maximum speed of $50bn/month. The US yield curve steepened again in a daily perspective with 2-5y tenors losing up to 5 bps (3-yr) and 7-30y tenors gaining up to 5.9 bps (20-yr). The German yield curve steepened as well with the pivot point at the 5y. Intraday changes ranged between -1.8 bps (2-yr) and +6.3 bps (30-yr). The trade-weighted dollar set a new recovery high at 99.77, eventually closing around 99.60. EUR/USD dipped below 1.09 for the first time since early March to close at 1.0896. Stock markets didn’t take the message (and the recent bond sell-off) well with key European and US indices losing over 2%. From a technical point of view, the EuroStoxx50 rebound failed to regain lost support just above the 4k, triggering strong return action lower and keeping the sell-on-upticks pattern in place. Today’s eco calendar is thin with only US weekly jobless claims. A speech by BoE chief economist Pill serves as a wildcard. Markets are disconnected with the BoE’s recent more dovish guidance going forward. They don’t think that the BoE will be able to slow its tightening cycle because of the developing cost-of-living crisis.
News Headlines
China’s State Council at a meeting yesterday hinted it will step up monetary policy stimulus to support the economy. It said so as “complexity and uncertainty of domestic and foreign environments have intensified, and some have exceeded expectations”. The State Council didn’t mention any specific steps. Similar hints previously, however, came just days before the central bank cut the reserve requirement ratio. The pledge for more support followed Chinese PMI’s (Caixin) dropping deep into contraction territory as a result of harsh lockdowns and a zero-Covid policy. The Chinese yuan finished stronger yesterday, at USD/CNY 6.36. In a broader perspective, the currency has been remarkably strong even as monetary policy divergence probably couldn’t be bigger. Italian PM Draghi yesterday said it would support an embargo on Russian gas if proposed by the EU. Currently it is not on the table, Draghi added. It does show how minds are evolving since Italy imports about 95% of the gas it consumes, with 40% coming from Russia. Draghi’s comments came after the EU just recently decided to impose a ban on Russian coal imports. European coal futures as a result this month alone already jumped by 14%. The EU is by far the most important buyer of Russia’s thermal coal.
IEA Announces a Collective Reserve Release
Market movers today
ECB minutes from the March meeting will be released today, focus will naturally be on the inflation outlook, recession risks and the pace of future policy normalization. Euro Area February Retail Sales will also be released, but the data is already largely outdated due to the war.
From the US, weekly jobless claims will be released. In the evening, we will have several Fed speakers on the wires, including Bullard, Evans and Williams.
The 60 second overview
Oil release: Oil prices fell yesterday, as the member countries of International Energy Agency (IEA) announced a collective reserve release of 120 million barrels, of which 60 million barrels comes from the US SPR release announced last week. While the US oil will be released at a pace of 1M barrels per day, the pace for the non-US release is not yet known. Nevertheless, if released over the same 6 month period as the US oil, the new release announced today would account for around 11 % of the IEA-estimated decline in Russian oil supply. Significant uncertainty still persists on the scale of the supply drop. China was the largest pre-war buyer of Russian crude, but so far Chinese state-owned refiners have refrained from entering new buying contracts for Russian oil despite the heavy discount due to the risk of US secondary sanctions. Unless Russia finds alternative buyers for its oil, the persistent drop in supply should likely keep prices elevated for longer despite the reserve releases.
FOMC minutes: While the Fed hiked by 'just' 25bp in March, "many" participants were favouring a 50bp hike if it were not for elevated geopolitical uncertainty after the Russian invasion of Ukraine. Also "many" participants believe one or more 50bp rate increases would be appropriate near-term, as inflation is high and labour demand is strong. This is in line with what we have heard since the FOMC meeting with no one excluding a 50bp rate hike and it is clear that the Fed would like to front-load rate hikes in order to get back to neutral faster, as monetary policy is way too accommodative given the economic situation. We continue to expect the Fed to hike by 50bp on each of the next three meetings (May, June and July) and 25bp on each of the following meetings. This would take the Fed funds target range to 2.50-2.75% by the end of the year. We discussed in further details in Fed Update: Quickly back to neutral by front-loading rate hikes, 30 March. The minutes also support our call that the Fed will announce the beginning of QT at the next meeting in May. The runoff cap of likely USD95bn per month (possibly phased in over three months) is slightly lower than we anticipated.
Equities: Risk off in markets on Wednesday, especially in Europe while US recovered well off day's lows. Cyclicals and growth retreated lower for a second day and quite markedly so (growth underperformed value by 200bp). Defensives and materials were the only sectors higher. Dow -0.4%, S&P 500 -1%, Nasdaq -2.2% and Russell 2000 -1.4%. US futures are pointing somewhat lower this morning too.
FI: The aggressive pricing of both the Federal Reserve and ECB continues with almost 220bp discounted from the Federal Reserve and almost 70bp from ECB by the end of 2022. However, yesterday we saw a decent steepening of the US yield curve, where the 2Y US government bond yield dropped 5bp while 10Y Treasuries rose 5bp. The positive sentiment in the front end of the US Treasury curve has continued this morning in Asian trade.
FX: Oil prices fell yesterday. USD/JPY has continued higher.
Credit: With equities selling off across all major indices, Credit markets continued along in risk-off mode on Wednesday. Itraxx main widened 2.8bp to close at 76.4bp, while Xover was 17.6bp wider, closing the day at 365.4bp.
Fed is Coming for Inflation
The FOMC minutes gave the clarity that every investors was looking for: the Federal Reserve (Fed) will be scaling back its near $9 trillion balance sheet by $95 billion per month, more than a trillion dollars per year.
On top, many Fed officials noted that ‘one or more 50-bps increases in the target range could be appropriate at future meetings, particularly if inflation measures remained elevated or intensified’.
Stock and bond markets didn’t react well to the cruel hawkishness of the latest FOMC minutes. Three major US indices fell, but value names lost less than the growth stocks. As such, we saw the Dow Jones retreat 0.42% to its 50-DMA, the S&P500 fall close to 1% below its 200-DMA, and Nasdaq slip more than 2% to an important Fibonacci support.
The US 2-10 year spread is back in the positive after having slipped below zero, but the recession threat is real, keeping the investor mood sour as the Fed pulls back support.
The equity and bond prices must go lower if the Fed wants to counter the supply-side inflation by a demand-side cool down.
In the FX
The US dollar remains well bid, and the dollar index consolidates just below the 100 level. It is probably just a matter of time before we see the index surpass the 100 mark, but in the very short run, we shall see a minor downside correction in the greenback following the Fed-minutes boost. The EURUSD slipped shortly below the 1.09 as the divergence between the hawkish Fed and the undecided and unresponsive European Central Bank (ECB) plays in favour of a softer euro, combined with the rising popularity of right-wing Marine Le Pen in French election polls, which is also seen as a threat for the European integrity.
Good news?
Good news is, China announced it will step up monetary stimulus to give support to counter the negative impacts of the latest Covid restriction measures which sent the Caixin services PMI to the scary level of 42 in March.
And US crude prices are back to the levels before the war. The barrel of US crude slid below the critical 50-DMA support, and the negative move appears to be more sustainable than the ones we saw over the past weeks. The loss of bullish momentum hints at a deeper downside correction which could pull the price of a barrel down toward the $88/90 barrel zone where it could meet the 100-DMA and the major 61.8% retracement on the December to March rally. If the fall is sustainable, we could start seeing some easing on the inflationary pressures, but it’s unsure how sustainable the oil pullback will be, and how low the prices could go considering the widening gap between supply and demand.
Anyway, it’s better to see the price of a barrel below the $100 mark, then above it!
Ruble back to the pre-war levels
One of the major drivers of the pullback in oil prices is European reluctance to ban the Russian oil. The West sticks however to new measures to pressure Putin to end the war in Ukraine, it sanctions his daughters, the family of Lavrov, the Russian banks. The UK froze Sberbank assets, as the US imposed full blocking sanctions on Sberbank and Alfa bank. More importantly, the US doesn’t allow Russia to process payments in US dollars, which obliged the country to service its $650 million worth of interest payment in rubles instead. But contractually, they are not allowed to pay in rubles, so the bonds could actually default. We are now within the 30-day grace period.
But interestingly, the Russian ruble is doing fine. The USD-RUB fell to the levels pre-war, as the generous income for its oil and gas keeps the currency well valued despite sanctions. The European Council President Michel Charles told the European Parliament yesterday that ‘measures on oil and even gas will be needed sooner or later’. In market language, that means that risks to oil prices remain tilted to the upside.
Gold, on the other hand, remains little changed near the $1920 per ounce. The rising yields hint that the medium-term direction should be the south, and we could see the price of an ounce sink sustainably to $1800/1820 area, which includes the 200-DMA. What keeps gold prices sustained right now is the fact that Russia is one of the largest gold miners, and that the safe haven demand remains tight, as the geopolitical tensions remain relatively high.
Technical Outlook and Review
DXY:
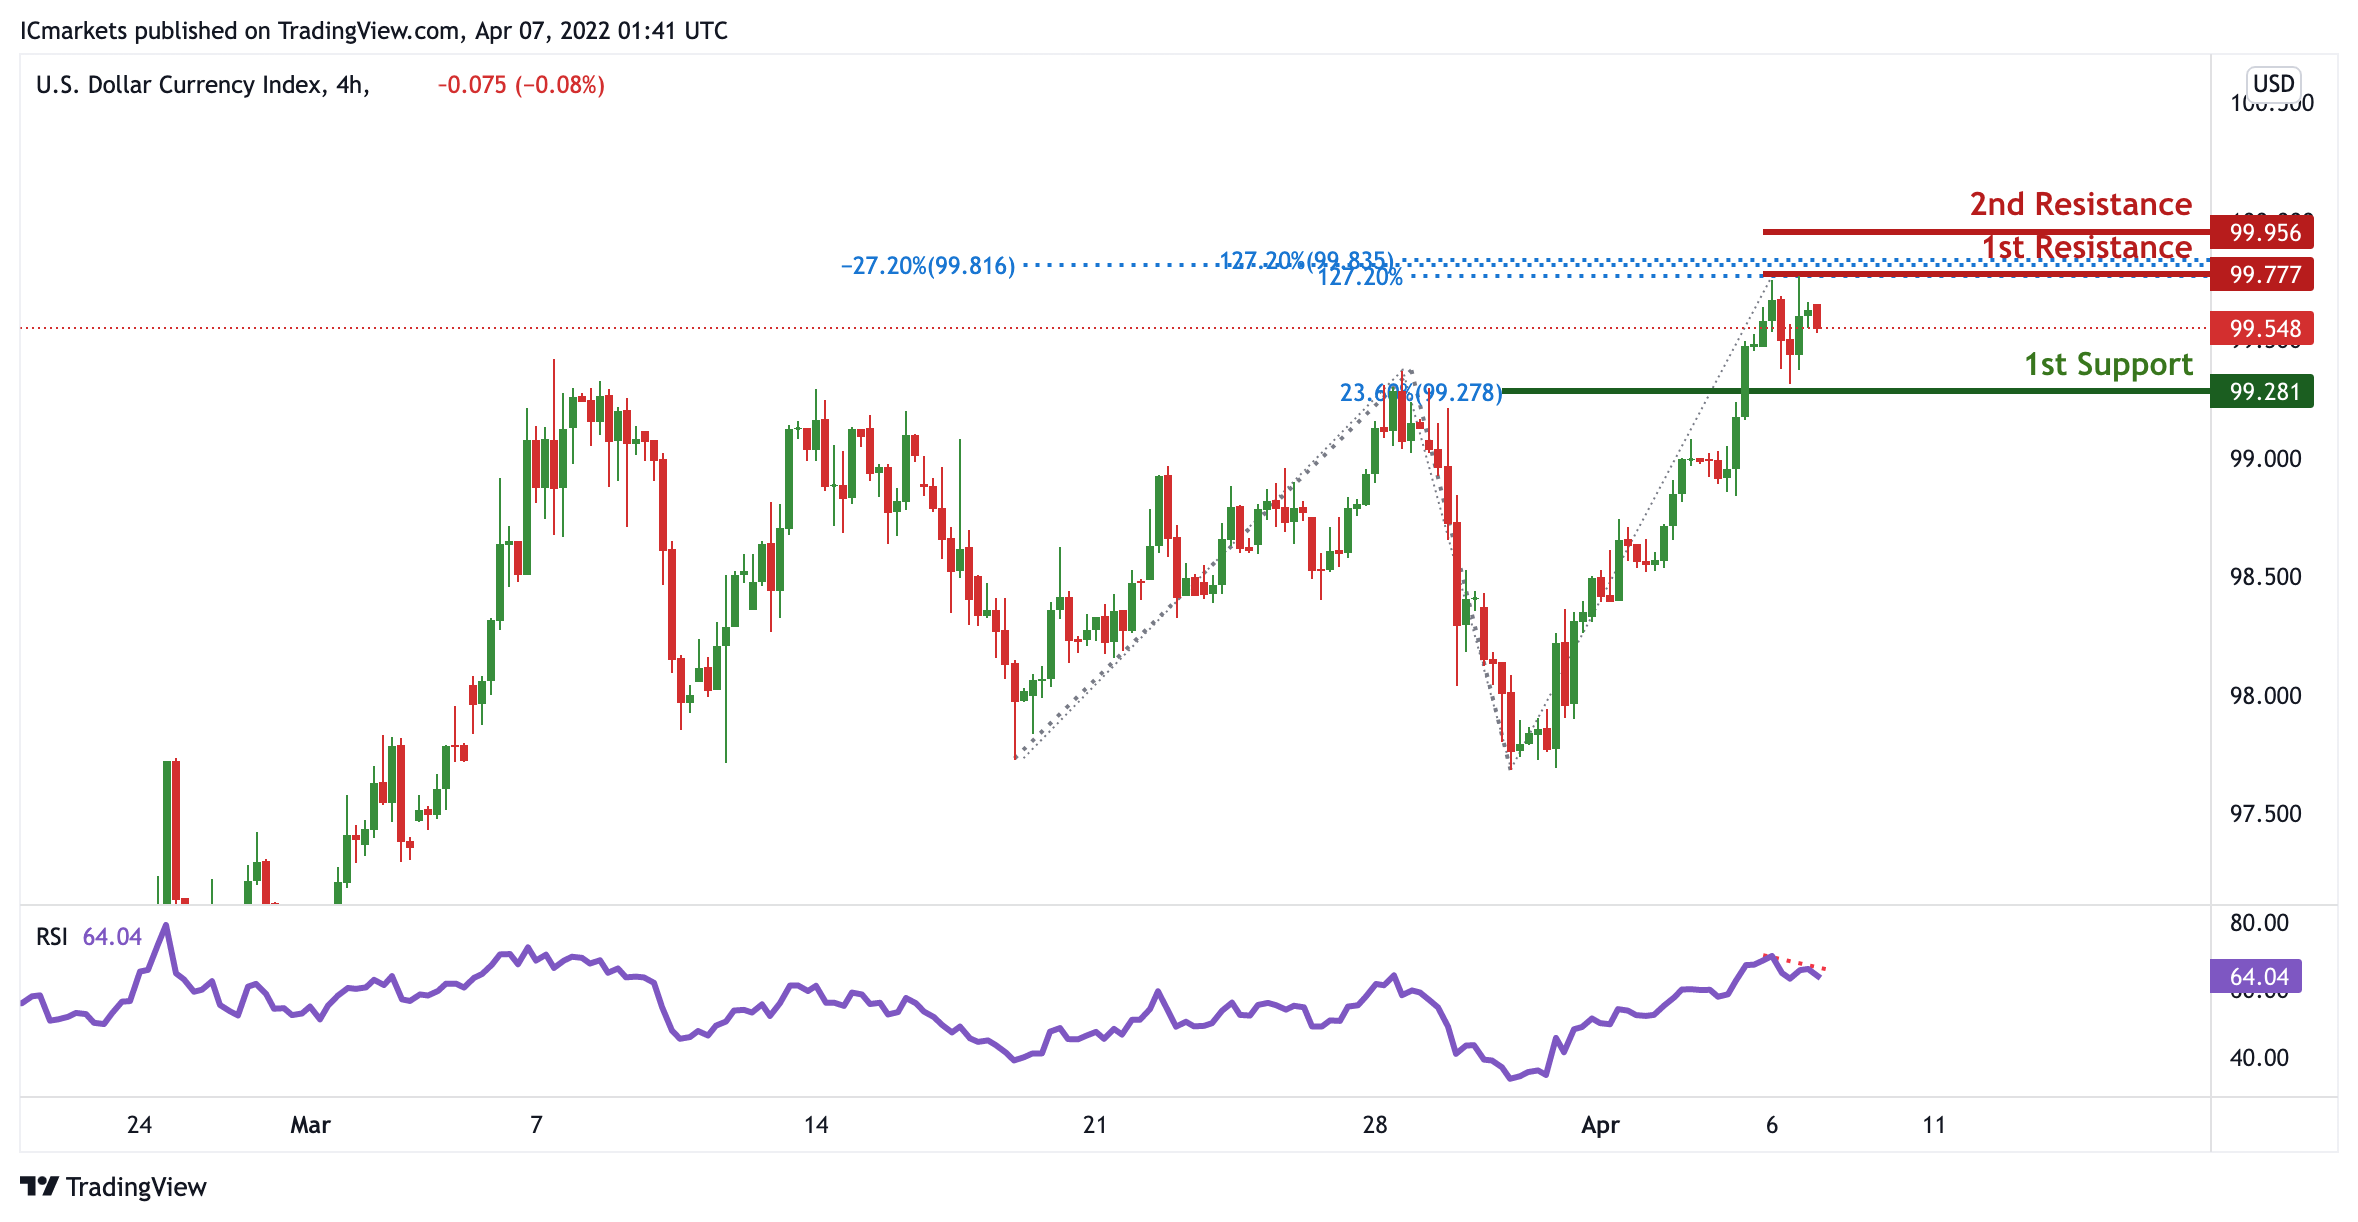
On the H1 timeframe, prices have approached pivot. We see the potential for a dip from our 1st resistance at 99.777 in line with which is an area of Fibonacci confluences towards our 1st support at 99.281 in line with 23.6% Fibonacci retracement. RSI is showing bearish momentum, further supporting our bearish bias.
Areas of consideration:
- H4 time frame, 1st resistance at 99.777
- H4 time frame, 1st support at 99.281
XAU/USD (GOLD):
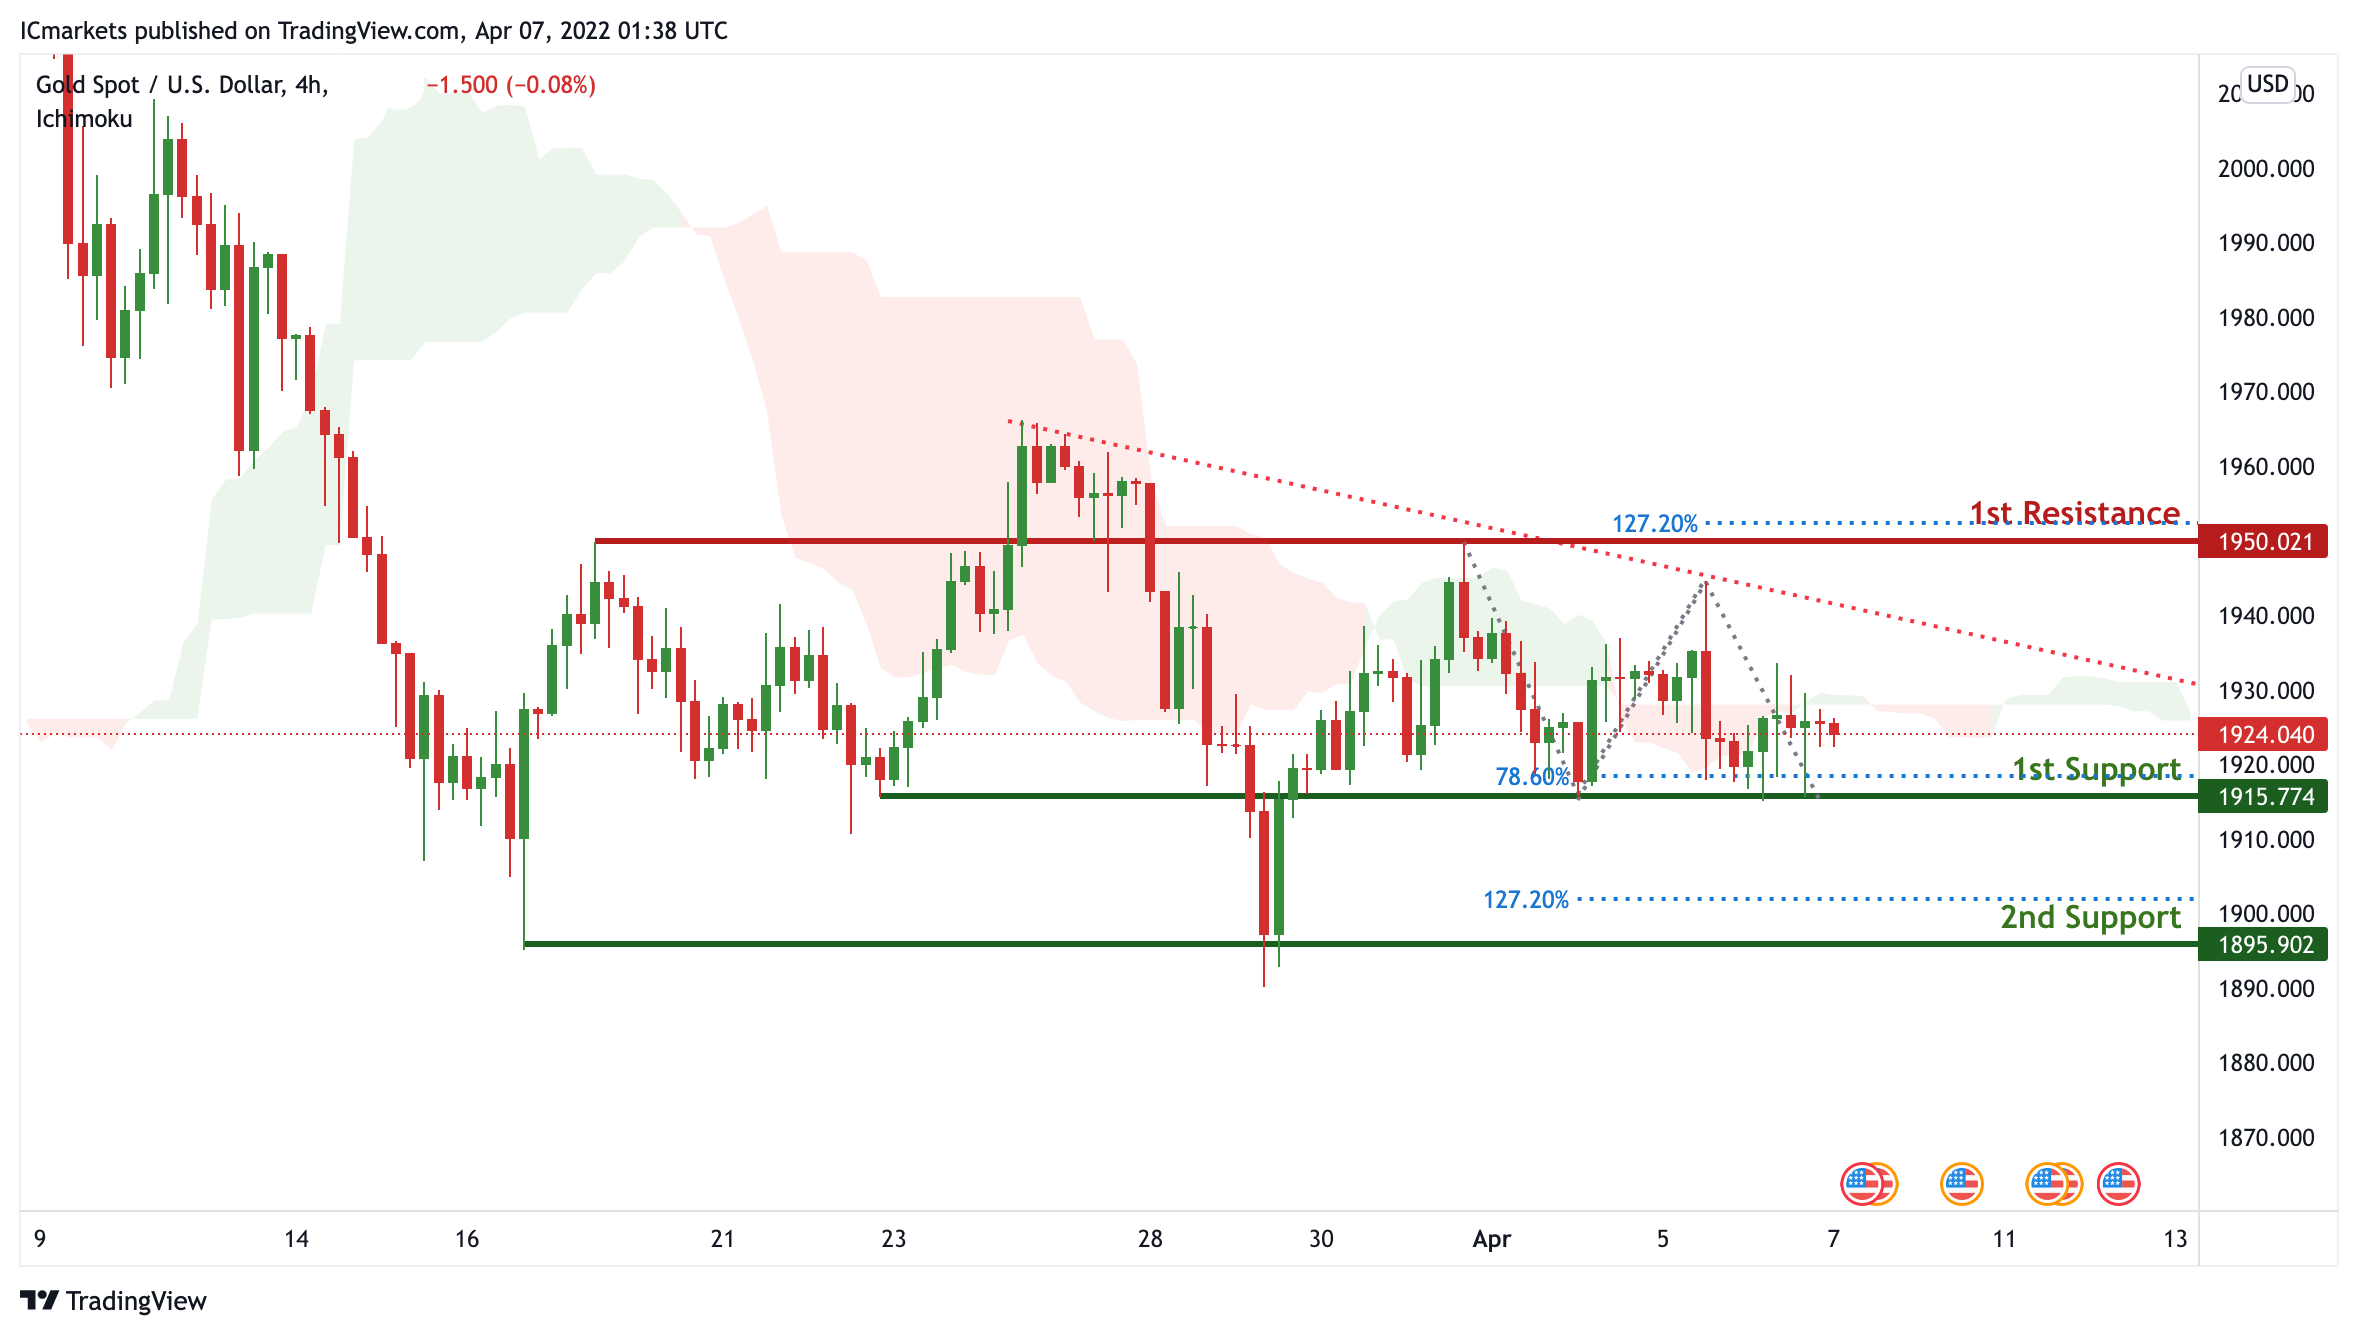
On the H1, prices are on bearish momentum and abiding by a descending trendline. We see the potential for a dip from our 1st resistance at 1950.021 which is in line with 127.2% Fibonacci extension towards our 1st support at 1915.774 in line which is a graphical overlap and in line with 78.6% Fibonacci Projection. Ichimoku is supporting our bullish bias.
Areas of consideration:
- 4h 1st support at 1915.774
- 4h 1st resistance at 1950.021
GBP/USD:
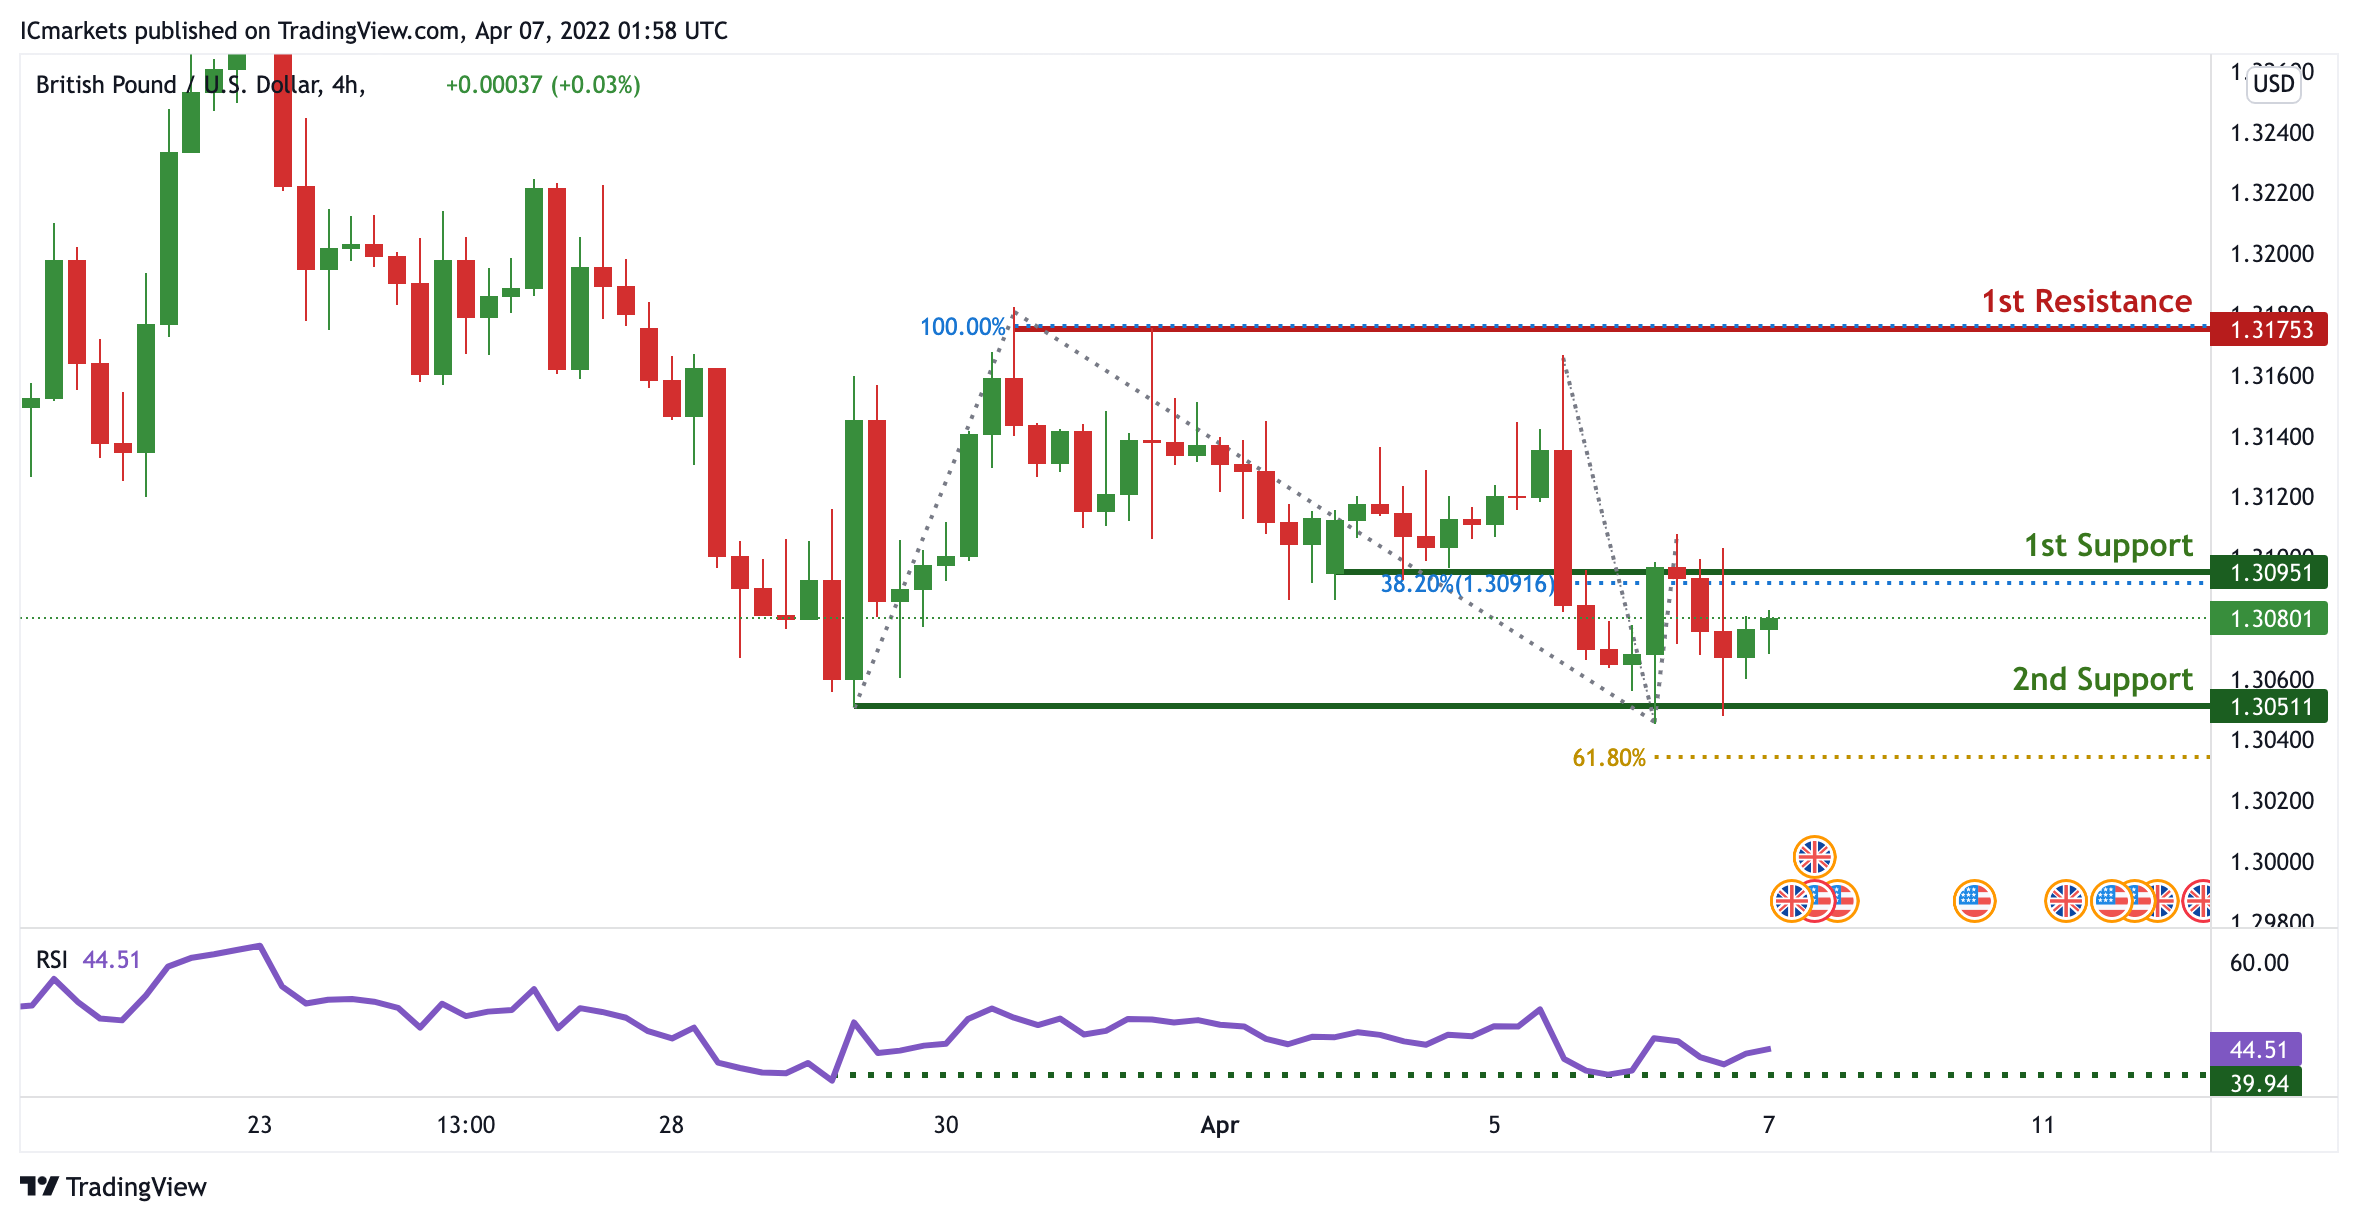
On the H4, prices are approaching a pivot. We see the potential for further bullish continuation from our 1st support at 1.30951 in line with 38.2% Fibonacci retracement towards our 1st resistance at 1.31763 in line with 100% Fibonacci Projection. Alternatively, if prices continue to dip, we might find prices dropping further towards our 2nd support at 1.30511 in line with 61.8% FIbonacci projection. Our bullish bias is further supported by RSI being at levels where bounces previously occurred.
Areas of consideration:
- H4 1st resistance at 1.30511
- H4 1st support at 1.30951
USD/CHF:
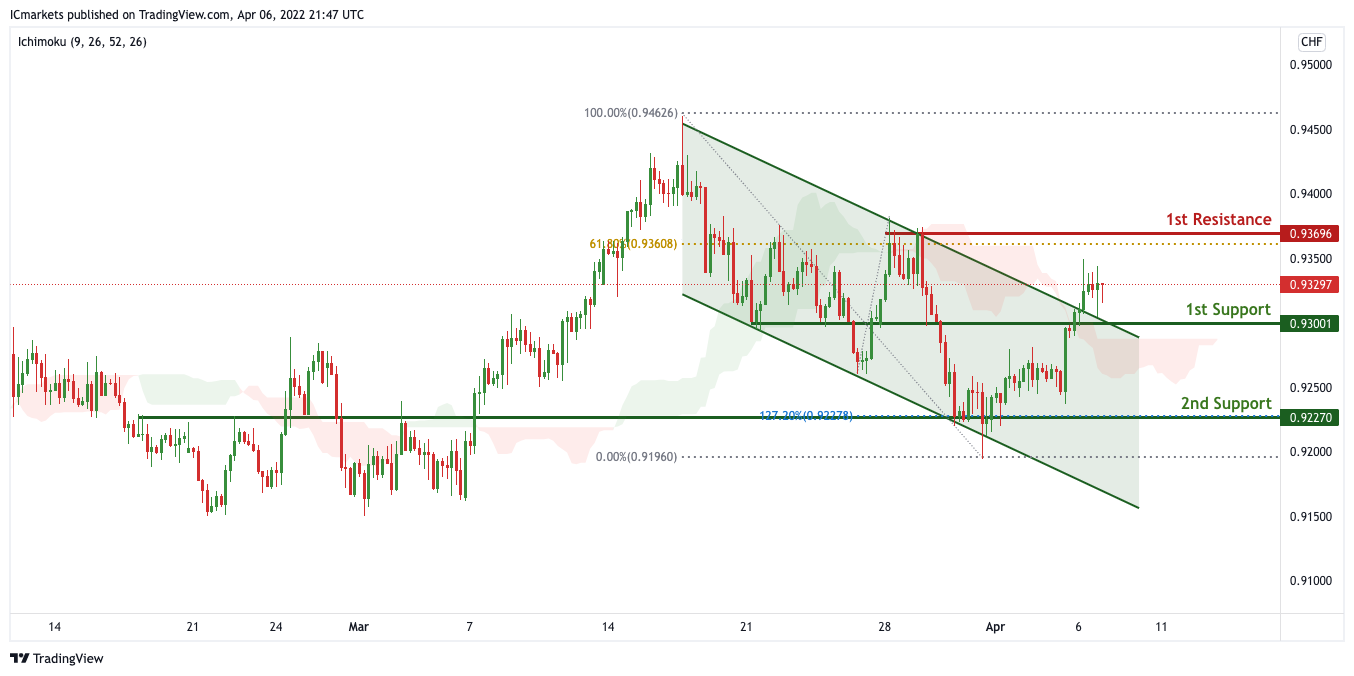
On the H4, with price moving above the ichimoku cloud and the recent break of the channel, we have a bias that price will rise to our 1st resistance at 0.93696 in line with the 61.8% Fibonacci retracement from our 1st support at 0.93001 in line with the horizontal pullback support. Alternatively, price may break 1st support structure and head for 2nd support at 0.92270 in line with the swing pullback support.
Areas of consideration
- 1st support level at 0.93001
- 1st resistance level at 0.93696
EUR/USD :
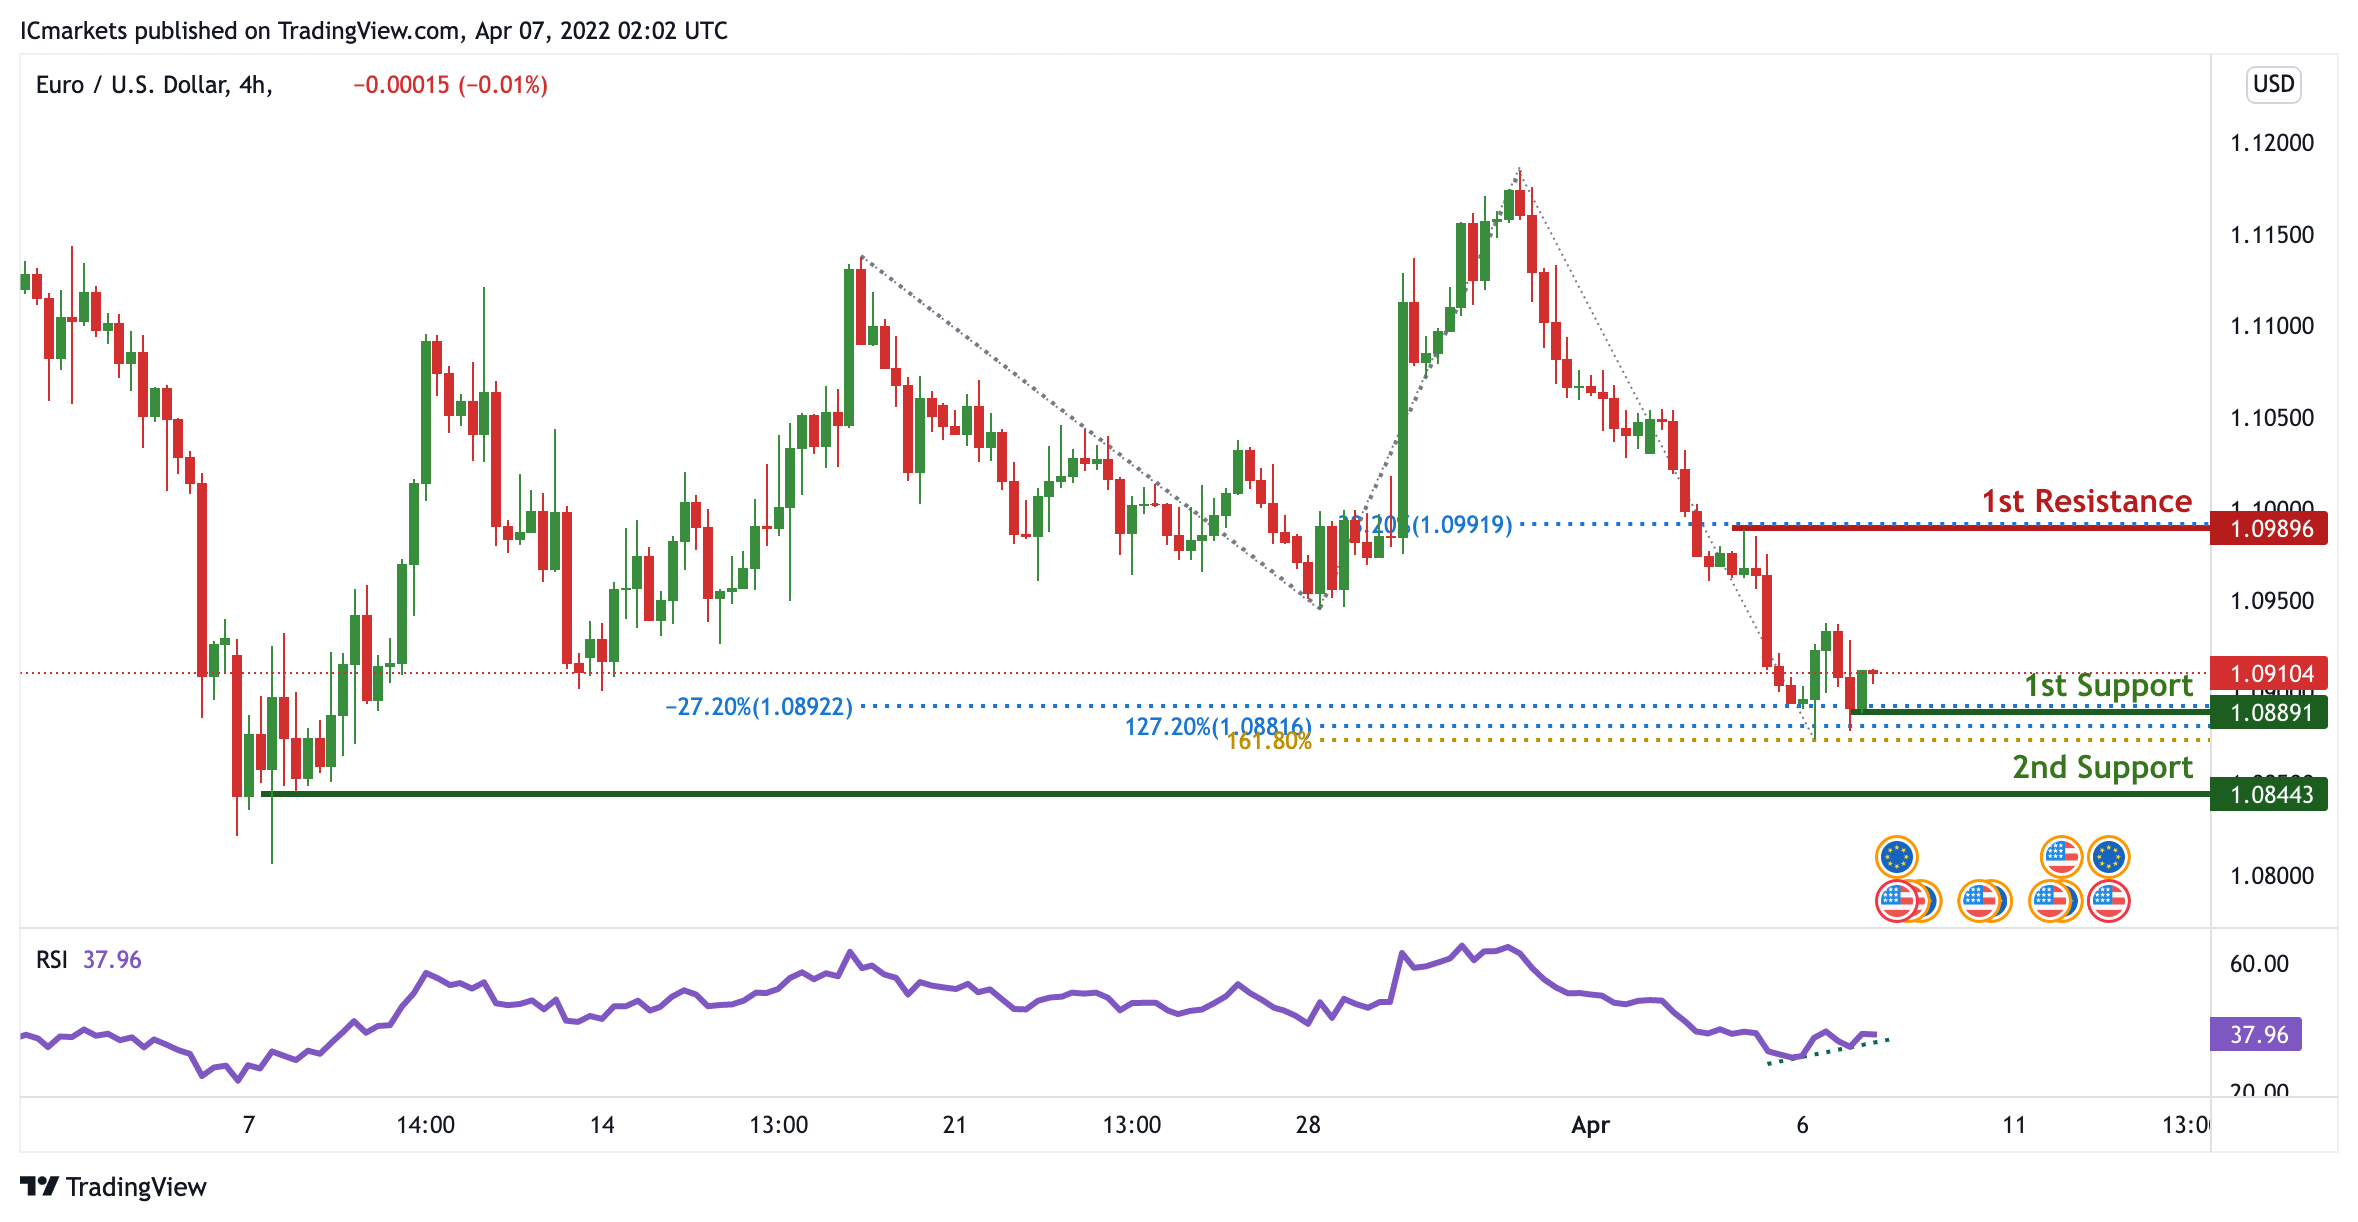
On the H4 timeframe, prices are at a key pivot. We see the potential for a bounce from our 1st support at 1.08891 which is an area of Fibonacci confluences towards our 1st resistance at 1.09896 in line with 38.2% Fibonacci retracement. RSI is on bullish momentum, further supporting our bullish bias.
Areas of consideration :
- H4 1st resistance at 1.09896
- H4 1st support at 1.08891
USD/JPY:
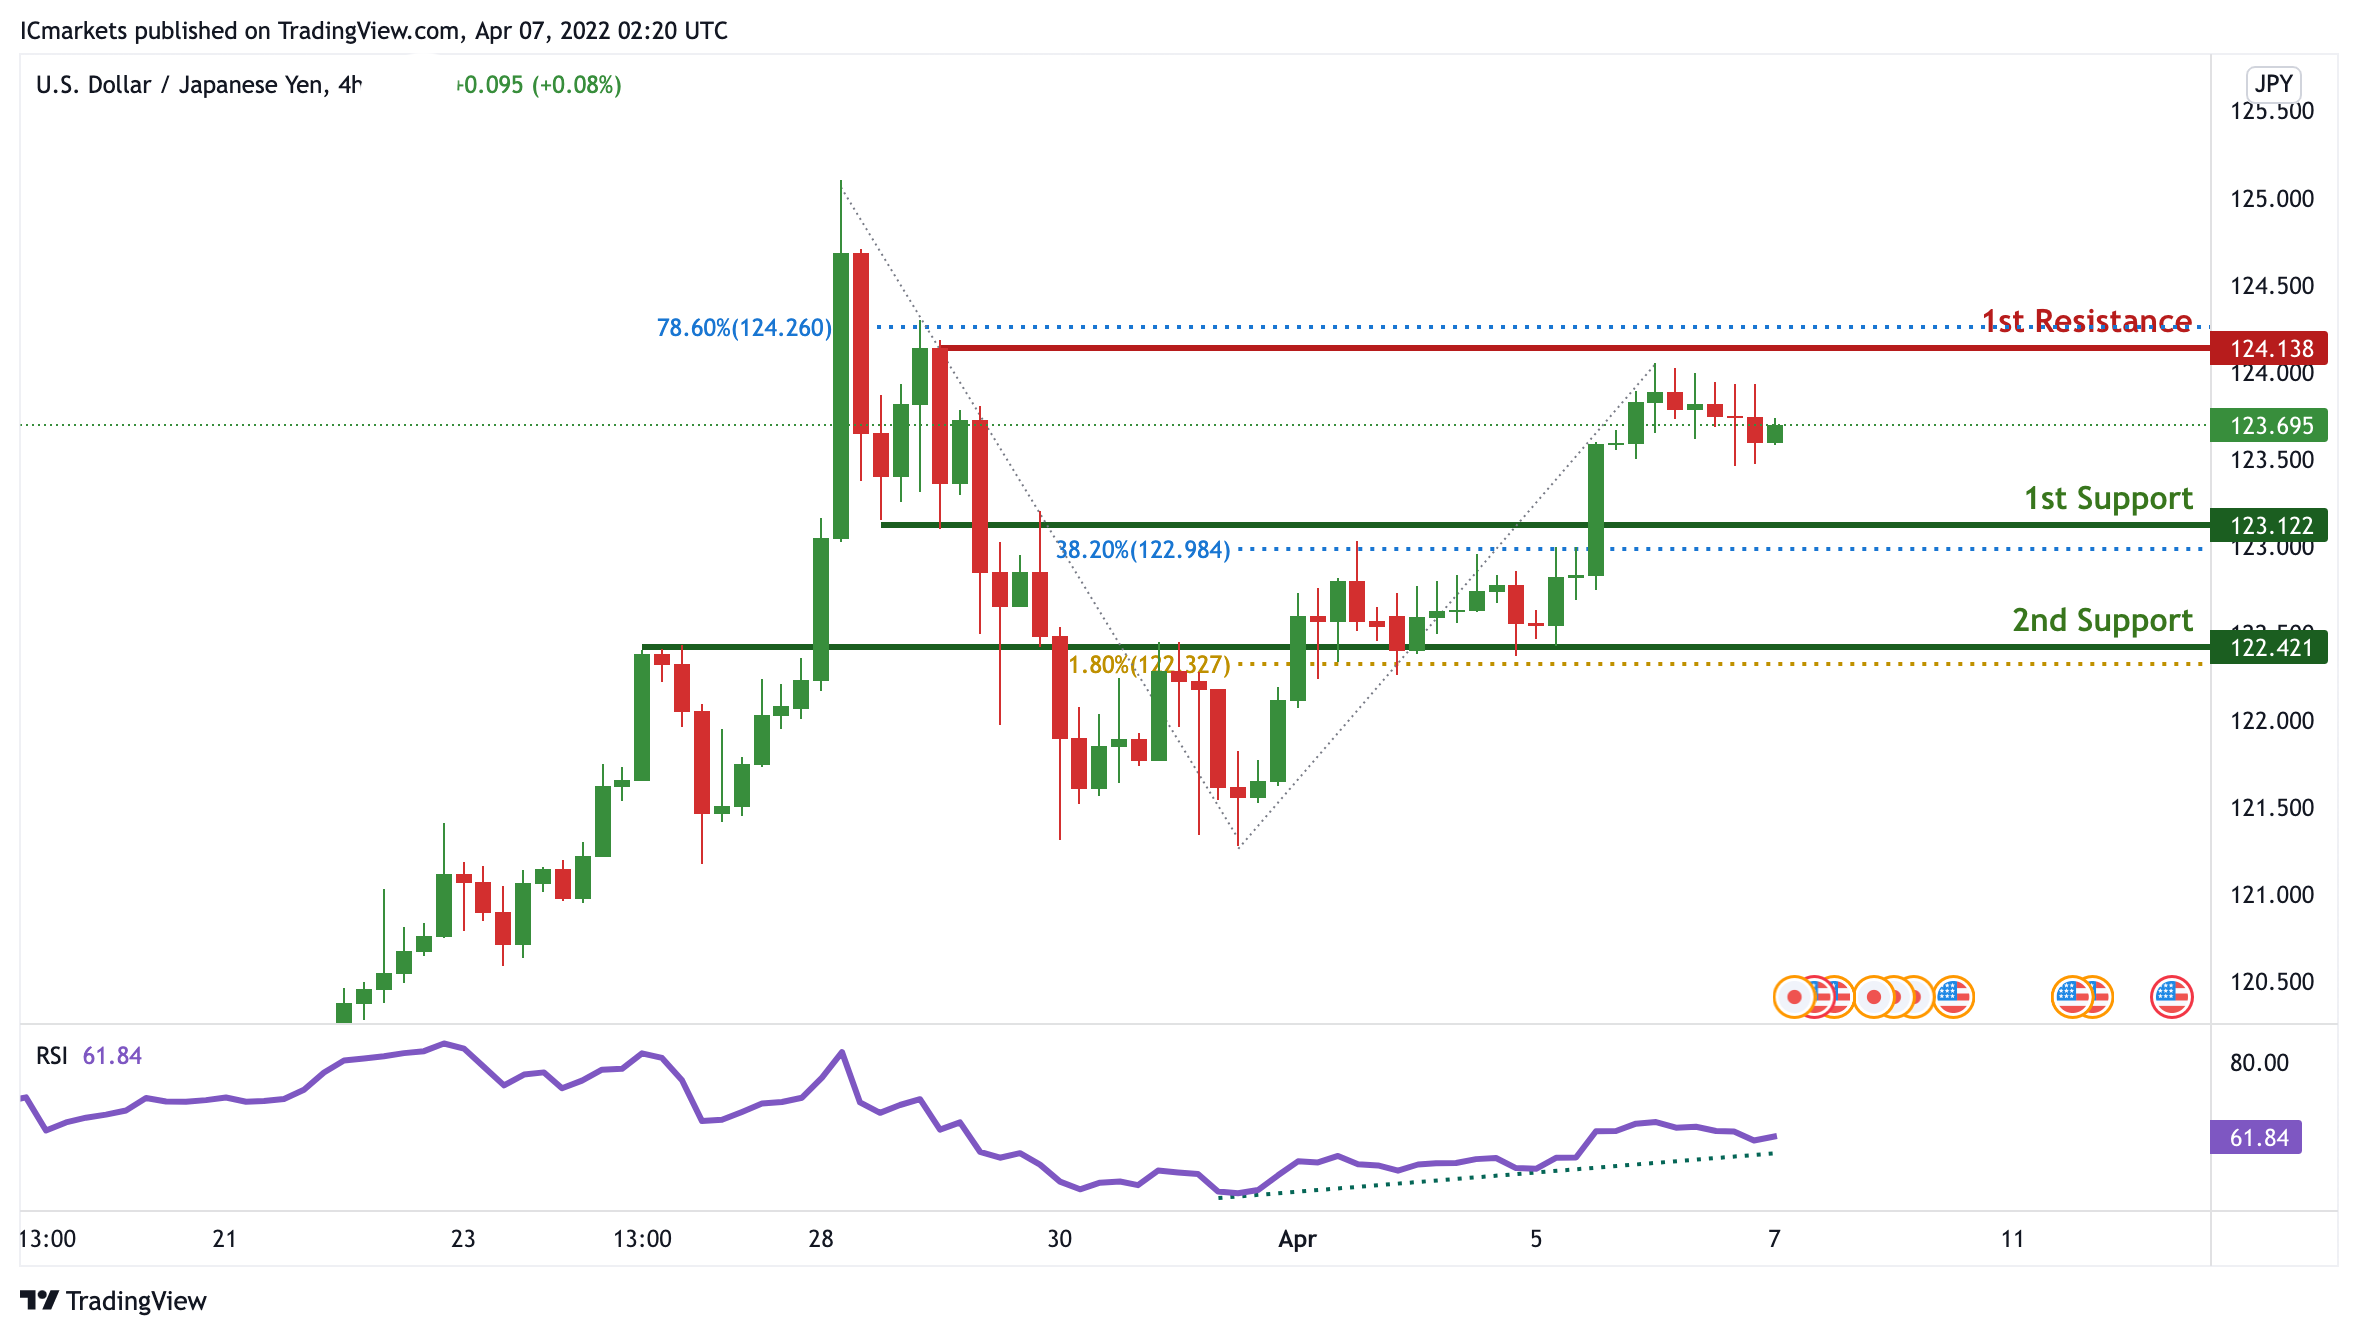
On the H4 timeframe, prices have bounced off a pivot. We see the potential for further bullish continuation at 123.122 in line with 38.2% Fibonacci retracement towards our 1st resistance at 124.138 in line with 78.6% Fibonacci Projection. RSI is on bullish momentum, further supporting our bullish bias.
Areas of consideration:
- H4 time frame, 1st resistance at 124.138
- H4 time frame, 1st support at 123.122
AUD/USD:
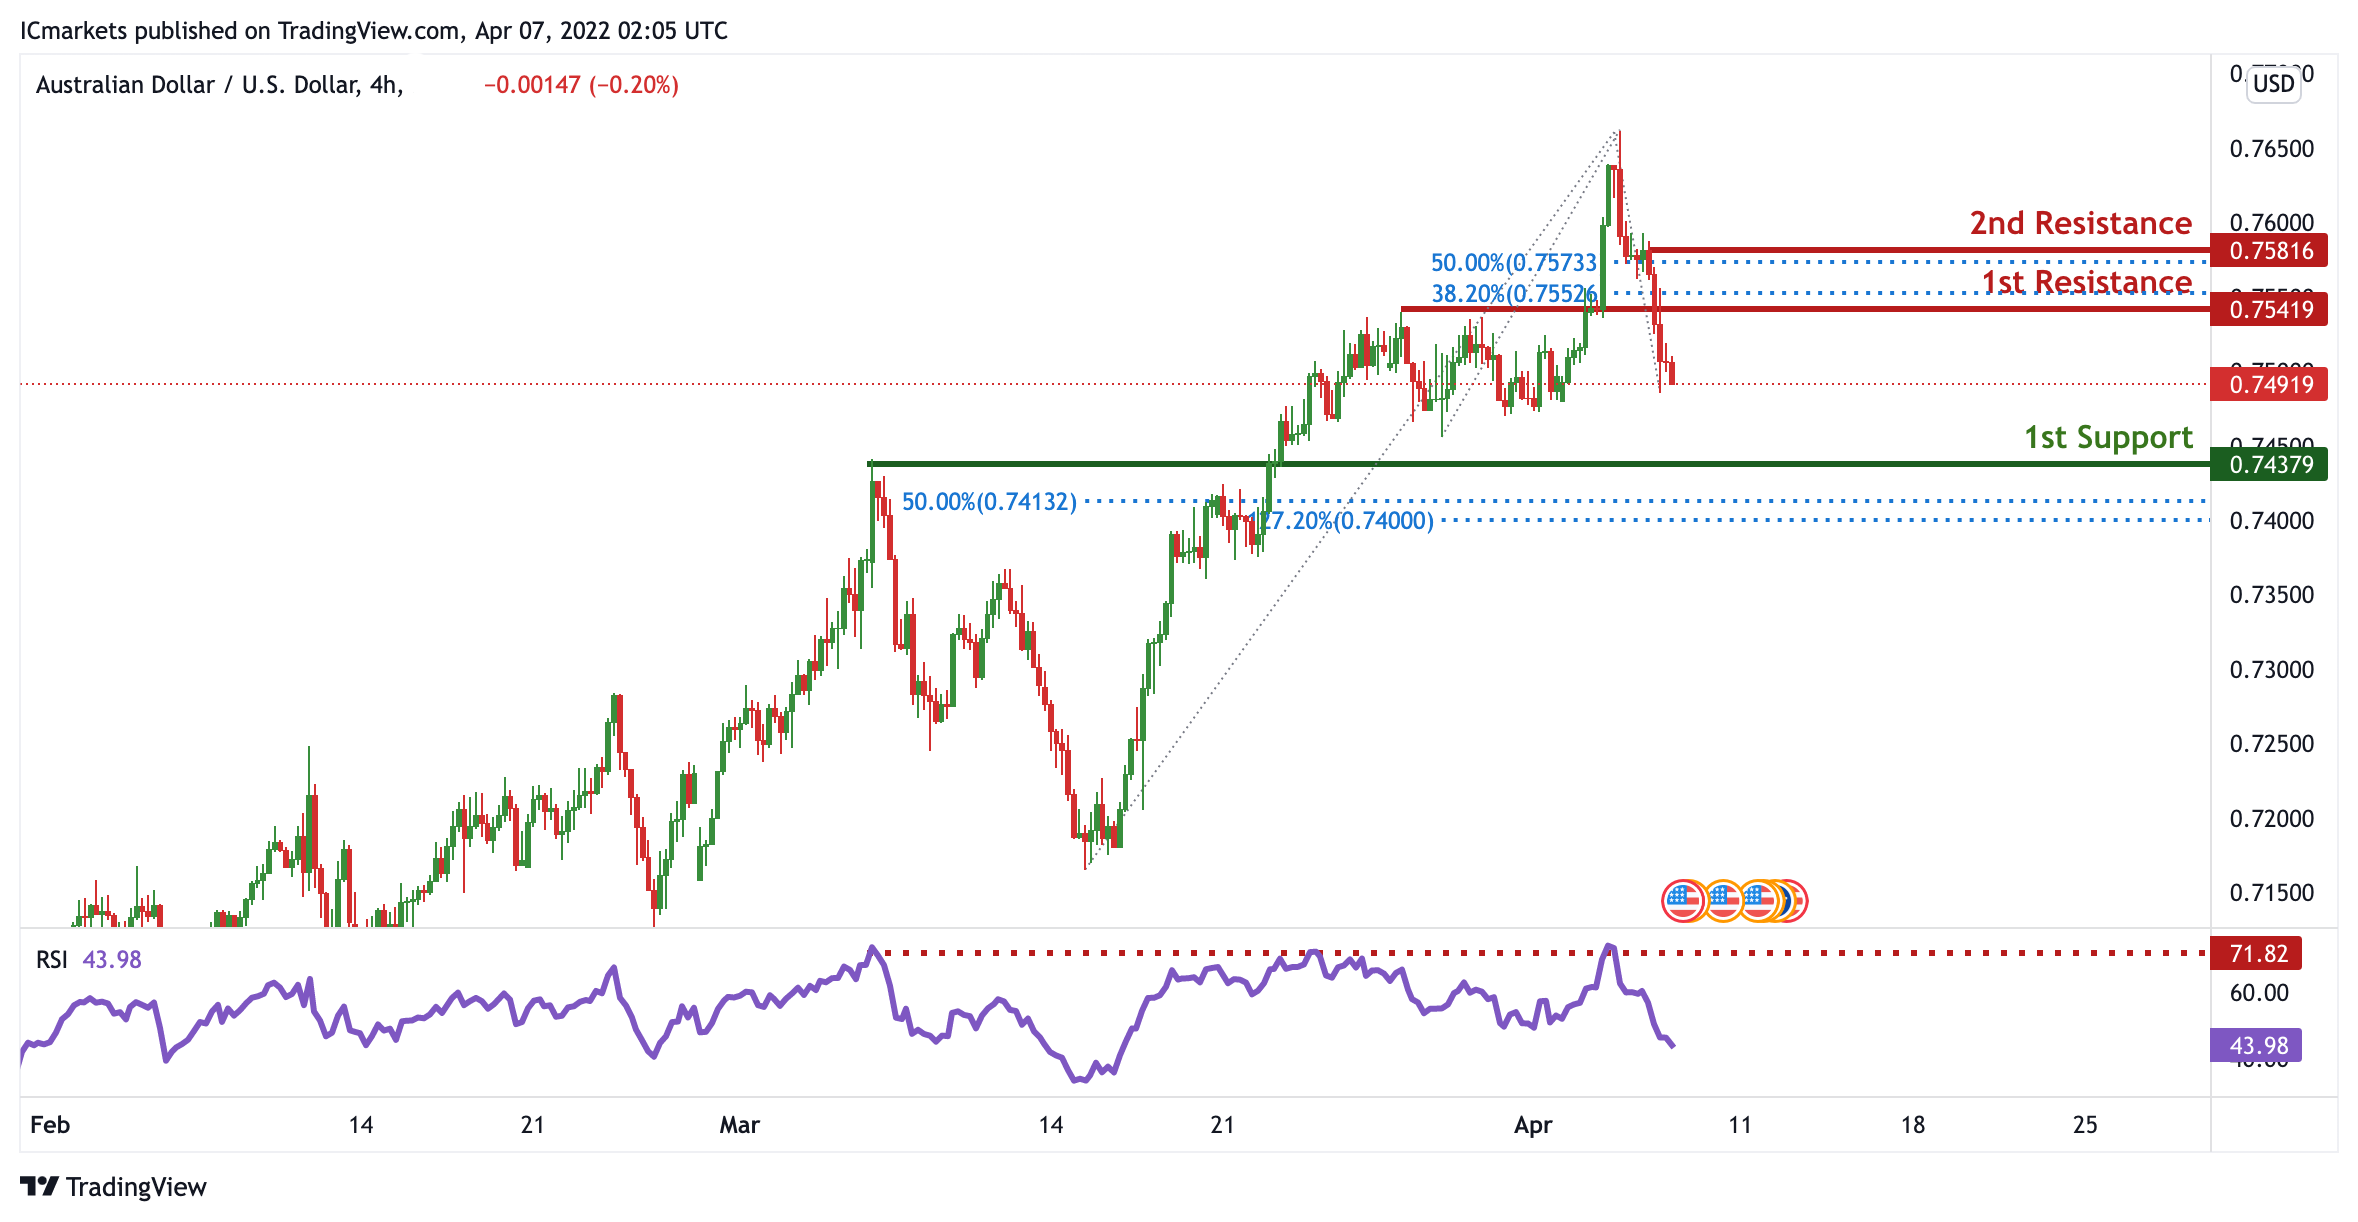
On the H4 timeframe, prices have bounced off a pivot. We see the potential for a dip from our 1st resistance at 0.75419 in line with 38.2% Fibonacci retracement towards our 1st support at 0.74379 which is an area of Fibonacci confluences. Our bearish bias is supported by RSI being at levels where dips previously occurred.
Areas of consideration
- H4 1st resistance at 0.75419
- H4 1st support at 0.74379
NZD/USD:
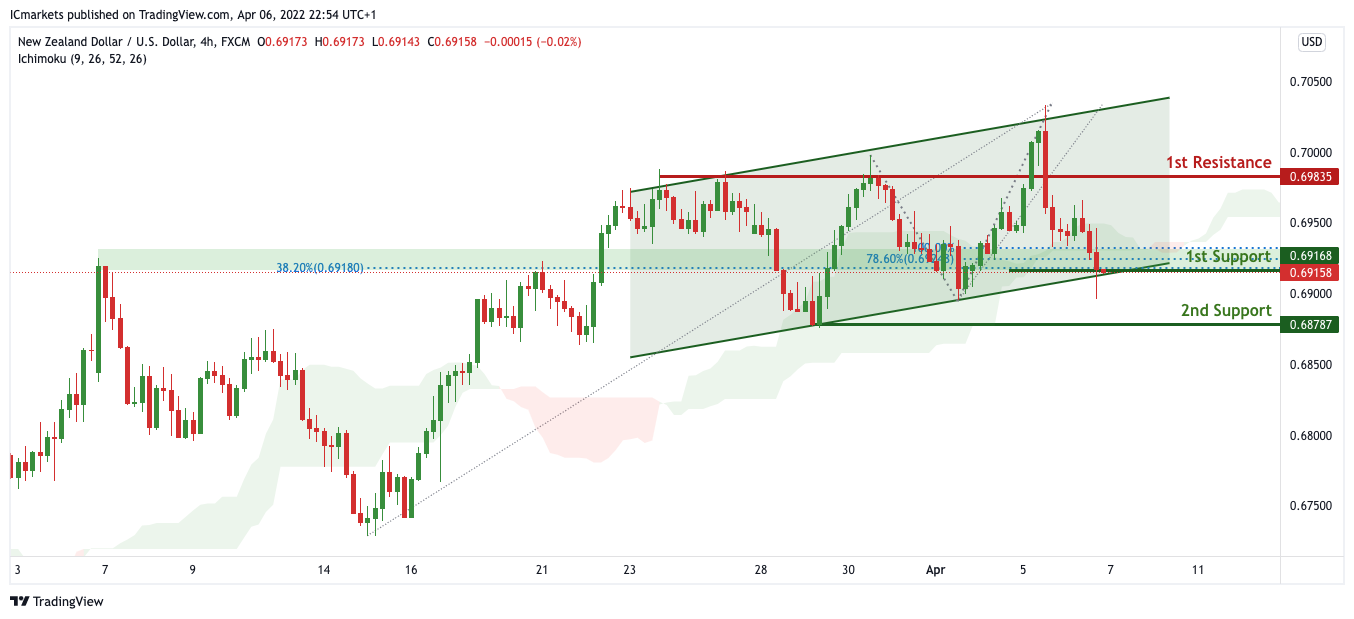
On the H4, with price expected to bounce off the support of the ichimoku cloud, we have a bias that price will rise to our 1st resistance at 0.69835 in line with the swing high resistance from our 1st support at 0.69168 in line with the horizontal overlap support, 78.6% Fibonacci projection. Alternatively, price may break 1st support structure and head for 2nd support at 0.68787 in line with the swing low support.
Areas of consideration:
- H4 time frame, 1st support at 0.69168
- H4 time frame, 1st resistance at 0.69835
USD/CAD:
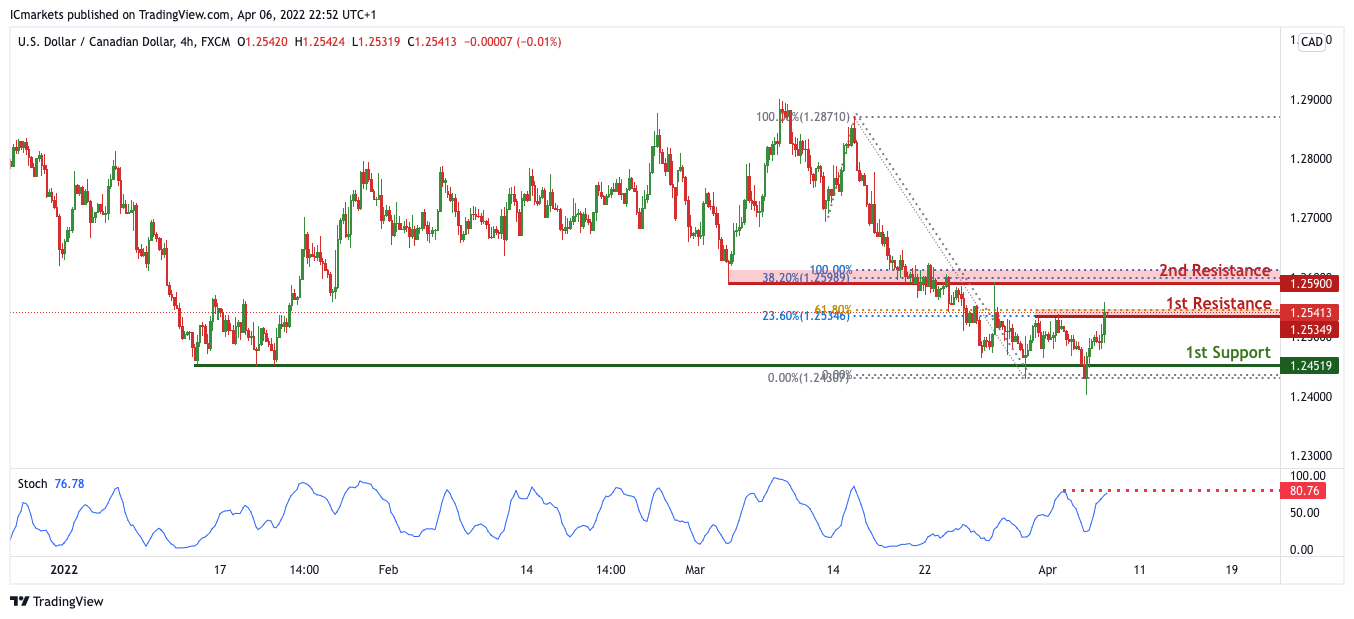
On the H4, with price expected to reverse off the stochastic indicator, we expect to see a potential for bearish drop from our 1st resistance of 1.25349 in line with the 23.6% fibonacci retracement and 61.8% Fibonacci projection towards our 1st support level at 1.24519 in line with the swing low support. Alternatively, If price breaks out, it can potentially move towards our 2nd resistance level at 1.25900 which is in line with the 38.2% Fibonacci retracement and 100% Fibonacci projection.
Areas of consideration:
- H4 time frame, 1st support at 1.24519
- H4 time frame, 1st resistance at 1.25349
OIL:
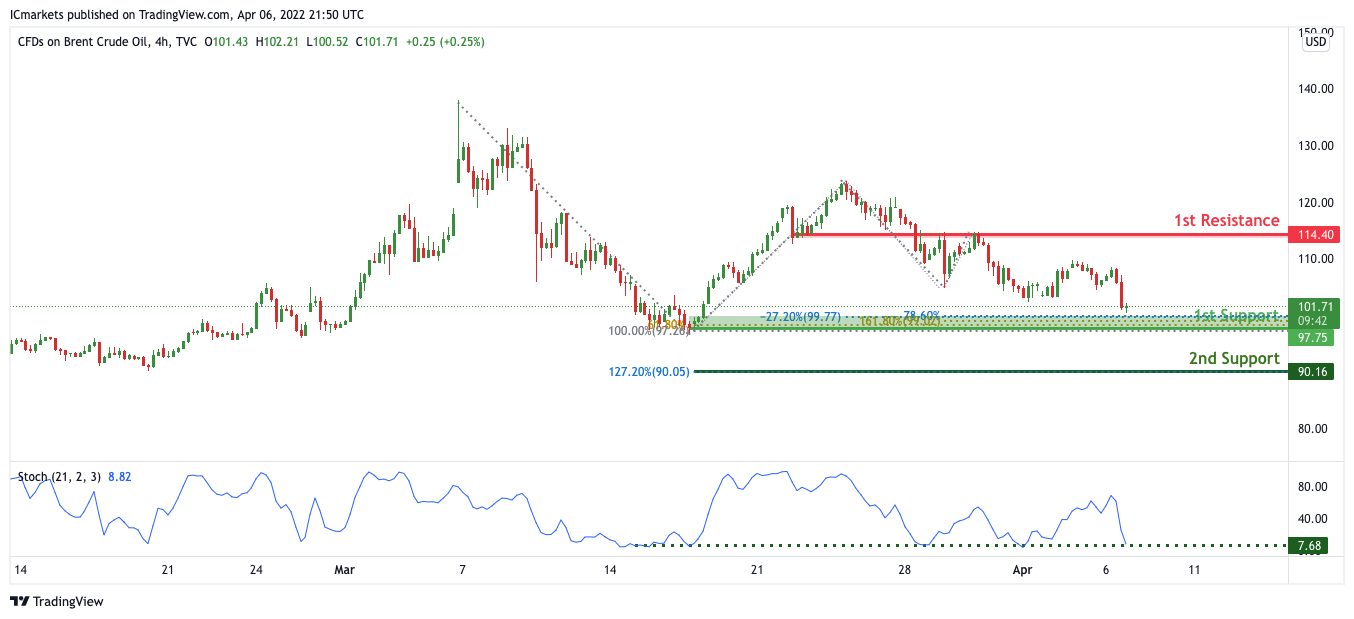
On the H4, with price expected to bounce off the support of the stochastics indicator, we have a bias that price will rise to our 1st resistance at 114.40 in line with the horizontal pullback resistance from our 1st support at 101.71 in line with the horizontal overlap support, 78.6% Fibonacci projection. Alternatively, price may break 1st support structure and head for 2nd support at 90.16 in line with the 127.2% Fibonacci extension
Areas of consideration:
- H4 time frame, 1st resistance of 114.40
- H4 time frame, 1st support of 101.71
Dow Jones Industrial Average:
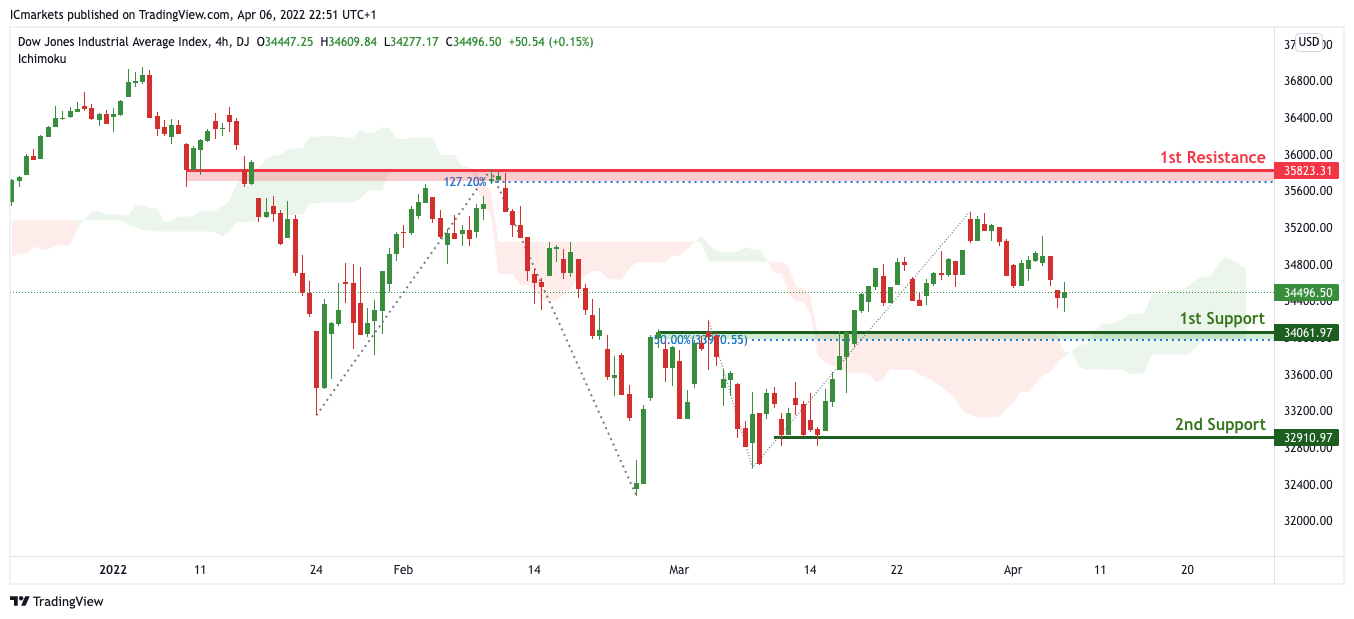
On the H4, with price moving above the ichimoku cloud, we have a bias that price will rise to our 1st resistance at 35823 in line with the 127.2% Fibonacci extension from our 1st support at 34061 in line with the horizontal pullback support and 50% Fibonacci retracement. Alternatively, price may break 1st support structure and head for 2nd support at 32910 in line with the horizontal swing low support.
Areas of consideration :
- H4 1st support at 34569
- H4 1st resistance at 35823
GBP/JPY Daily Outlook
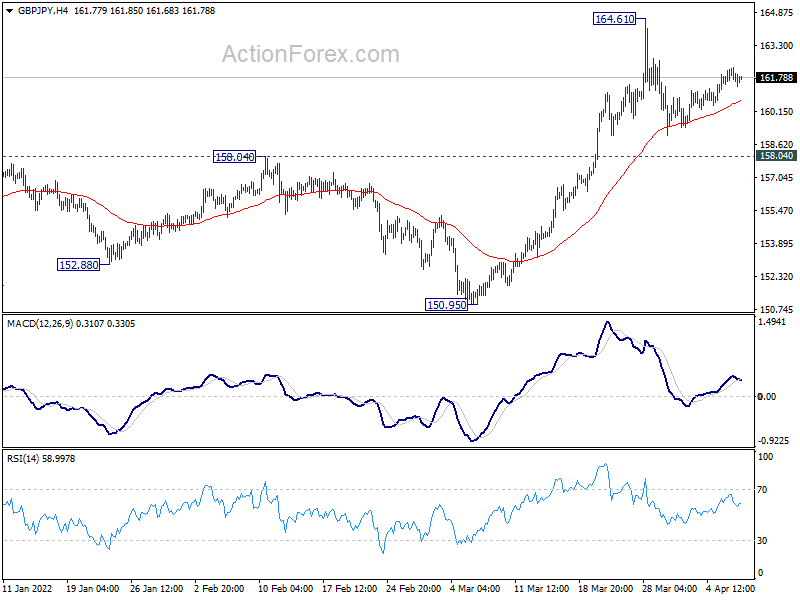
Daily Pivots: (S1) 161.44; (P) 161.86; (R1) 162.19; More...
GBP/JPY is staying in consolidation from 164.61 and intraday bias remains neutral. Outlook remains bullish with 158.04 resistance turned support intact, and further rally is expected. On the upside, break of 164.61 will resume larger up trend to long term fibonacci level at 167.93. However, firm break of 158.19 will turn bias to the downside and bring deeper pull back.
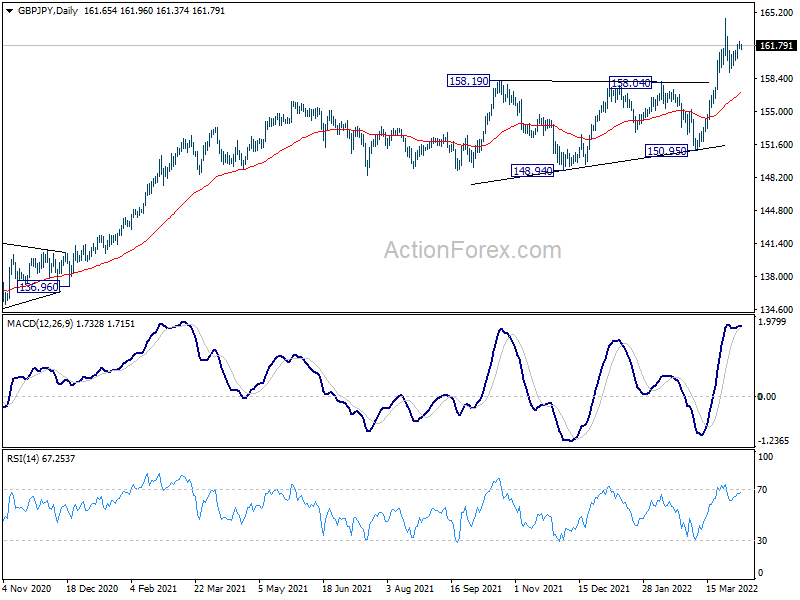
In the bigger picture, up trend from 123.94 (2020 low) is still in progress, and notable support from 55 week EMA affirms medium term bullishness. Next target is 61.8% retracement of 195.86 (2015 high) to 122.75 (2016 low) at 167.93. Sustained break there will be a long term bullish signal. This will now remain the favored case as long as 150.95 support holds.
EUR/JPY Daily Outlook
Daily Pivots: (S1) 134.58; (P) 135.03; (R1) 135.35; More....
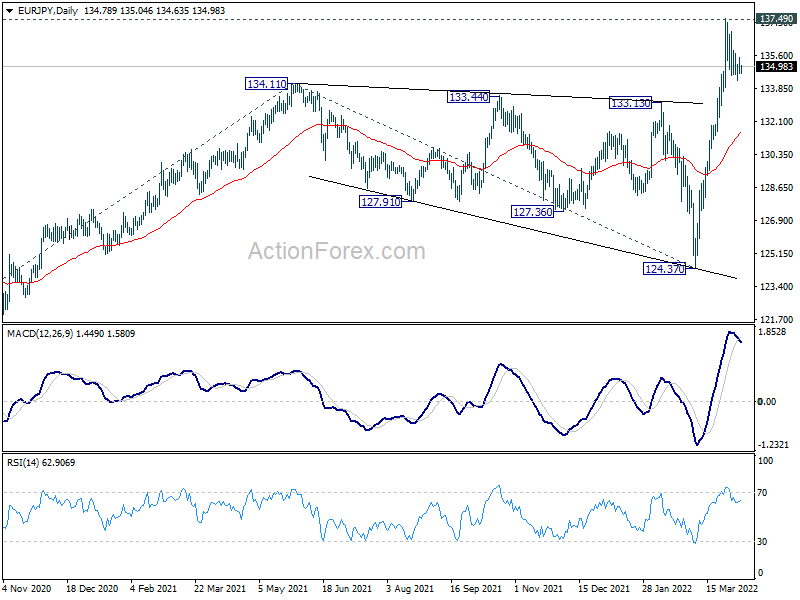
Intraday bias in EUR/JPY remains neutral as consolidation from 137.50 is extending. With 133.70 minor support intact, further rally is expected. On the upside, sustained break of 137.49 resistance will resume larger up trend for 144.06 projection level next. However, firm break of 133.70 will indicate short term topping, and turn bias back to the downside for deeper pull back.
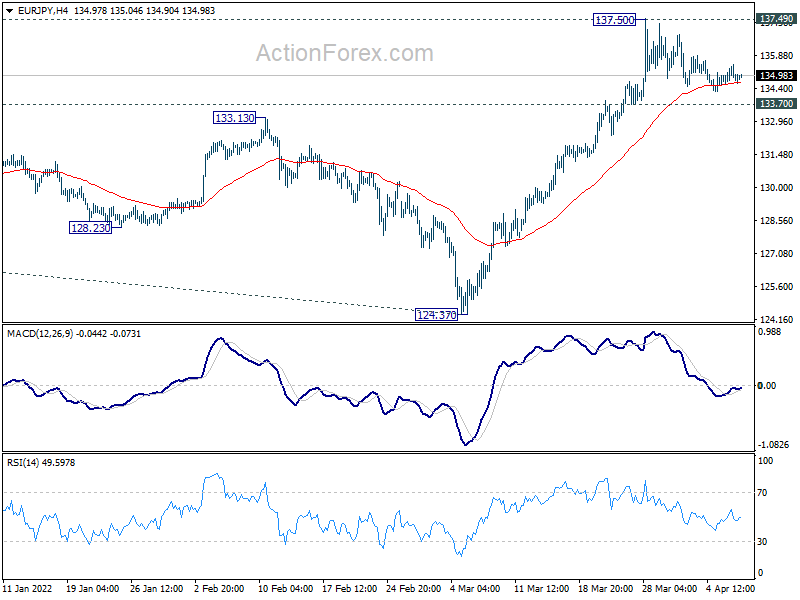
In the bigger picture, up trend from 114.42 (2020 low) is in progress. Sustained break of 137.49 (2018 high) will resume larger pattern from 109.30 (2016 low). Next target will be 100% projection of 114.42 to 134.11 from 124.37 at 144.06. In any case, outlook will now remain bullish as long as 124.37 support holds, in case of deep pull back.