Sample Category Title
Platinum Wave Analysis
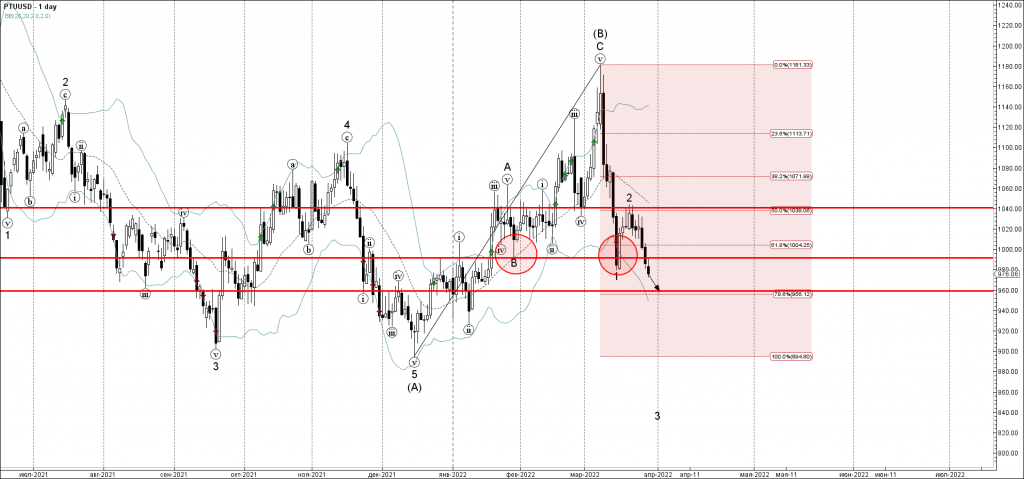
- Platinum broke round support level 1000.00
- Likely to fall to support level 959.00
Platinum recently broke the round support level 1000.00 (which has been repeatedly reversing the price from last January).
The breakout of the support level 1000.00 coincided with the breakout of the 61.8% Fibonacci correction of the previous wave (B) from December.
Platinum can be expected to fall further in the active impulse wave 3 toward the next support level 959.00.
EURNZD Wave Analysis
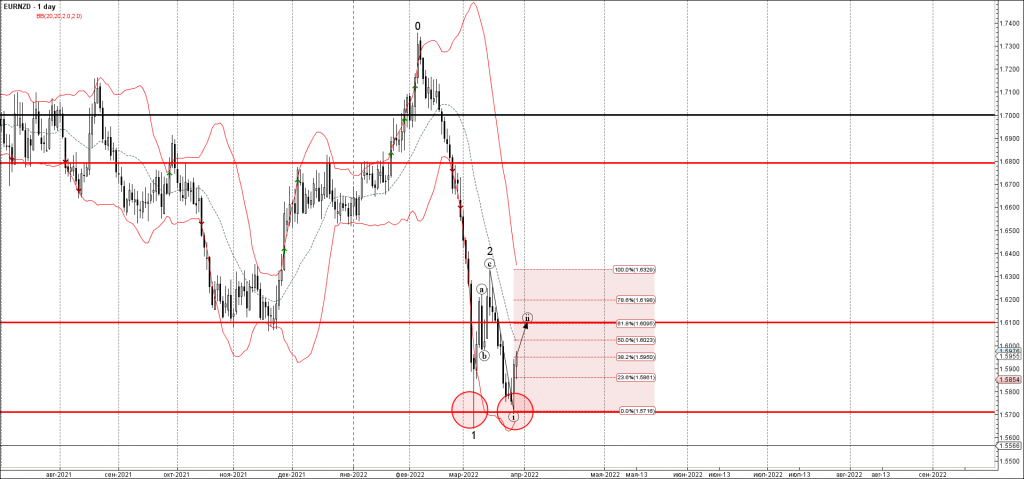
- EURNZD reversed from support level 1.5710
- Likely to rise to resistance level 1.6100
EURNZD earlier reversed up from the key support level 1.5710 (which stopped the previous sharp downward impulse wave 1), intersecting with the lower daily Bollinger Band.
The upward reversal from the support level 1.5710 started the active short-term correction (ii).
Given the strength of the support level 1.5710 and strong NZD outflows – EURNZD can be expected to rise further toward the next resistance level 1.6100 (target for the end of the active correction (ii)).
Crude Oil: Not a One-Way Street, But Bulls Still in Charge
Brent lost 7.7% to $106.4 on Monday on fears of a drop in demand due to a lockdown in Shanghai, China’s financial hub. In addition, the Saudi and Yemeni cease-fire and the upcoming Ukraine-Russia talks in Turkey helped reduce the heat on the energy market.
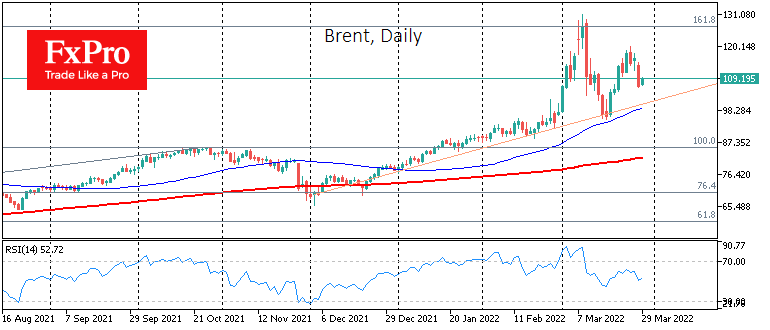
However, Monday’s decline looks like only a temporary respite, and all these factors are still too weak to break the momentum that has been sustained since December.
Brent has gained 2% since Tuesday morning to $108.5, with buyers buoyed by reports that Saudi Arabia might raise the selling price of its Oil by as much as 5% in May. The pipeline accident in the Caspian Sea and falling exports from Russia are also on the side of oil bulls right now.
OPEC has denied plans to accelerate quota increases at its next monthly meeting on the 31st of March. Cartel officials also note that it is not yet possible to replace Oil from Russia entirely.
Meanwhile, Iran’s nuclear programme talks have taken a few steps back, removing hopes of a supply surge from the market. US oil producers are in no hurry to exploit market conditions. The number of working rigs is increasing, but no production increase has taken place so far, which has averaged 11.6 million barrels per day over the last six months. US commercial oil inventories are now 17.8% lower than a year ago.
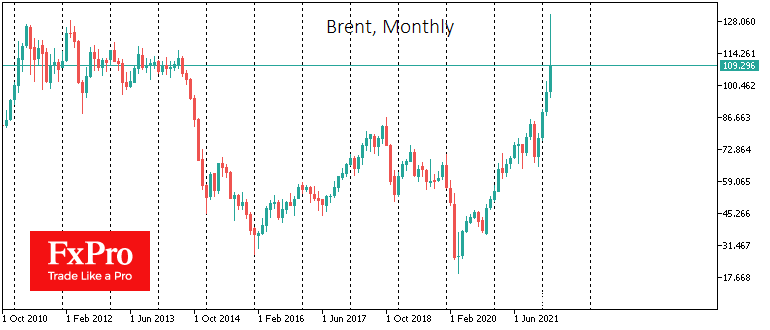
Oil has remained in a bull market even though its movements are no longer unidirectional. From a state of panic buying in early March, Oil has become more pragmatic. Its price now looks high compared with levels a year and two years ago, but from 2011 to 2014, it traded around current levels, with demand being notably weaker. A period of heightened geopolitical uncertainty is setting up a $100-120 Brent range in the coming weeks. A break in the upward trend will only occur with a final turn towards détente.
Bitcoin as a Leading Indicator of Risk On
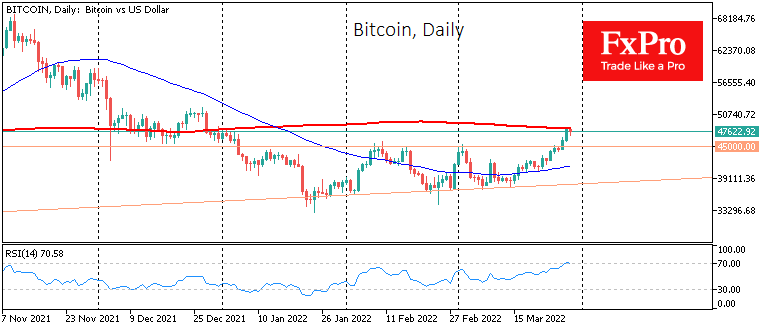
BTC is up 4% on Monday, ending the day around $48K, and corrected by about 1% to $47.5K on Tuesday morning. Ethereum was up 1.8% in the last 24 hours to $3.4K. Among the leading altcoins, Terra soared by 10%, Doge corrected by 2%. In most others, there is a slight correction in the growth of the last days, but they are in positive territory over the last day.
According to CoinMarketCap, the total capitalization of the crypto market increased by 1% over the day, to $2.15 trillion. The Bitcoin dominance index fell by 0.1 points to 42.1%.
The crypto-currency index of fear and greed rose by 11 points over the day, to 60, and moved from neutral level to the “greed” grade. On Tuesday, the index dropped to 56 points.
Bitcoin continued to rise on Monday after it broke through the strong resistance of the February highs around $45K in the previous evening. By the end of the day, BTC has renewed the highs of early January above $48K, having won back the decline since the beginning of the year. The growth of the first cryptocurrency rested on the 200-day moving average ($48.2K). Confident consolidation above it promises to strengthen and expand the growth of the entire crypto market and breathe fresh impetus into the growth of bitcoin. In December, we saw a false break, but then the price levels were higher, and corrective sentiment intensified in the stock markets.
Now Bitcoin is growing along with the rise of stock indices and often even acts as a leading indicator of investor sentiment. According to Arcane Research, BTC’s correlation with the S&P 500 stock indicator recently hit a 17-month high.
According to CoinShares, institutions invested $193 million in crypto funds last week, and it was the most significant amount in three months. Glassnode believes that the Bitcoin trend has already changed to bullish, as evidenced by the increase in the number of addresses accumulating BTC.
EURJPY Pulls Below 7-Year High; Still Bullish but Overbought
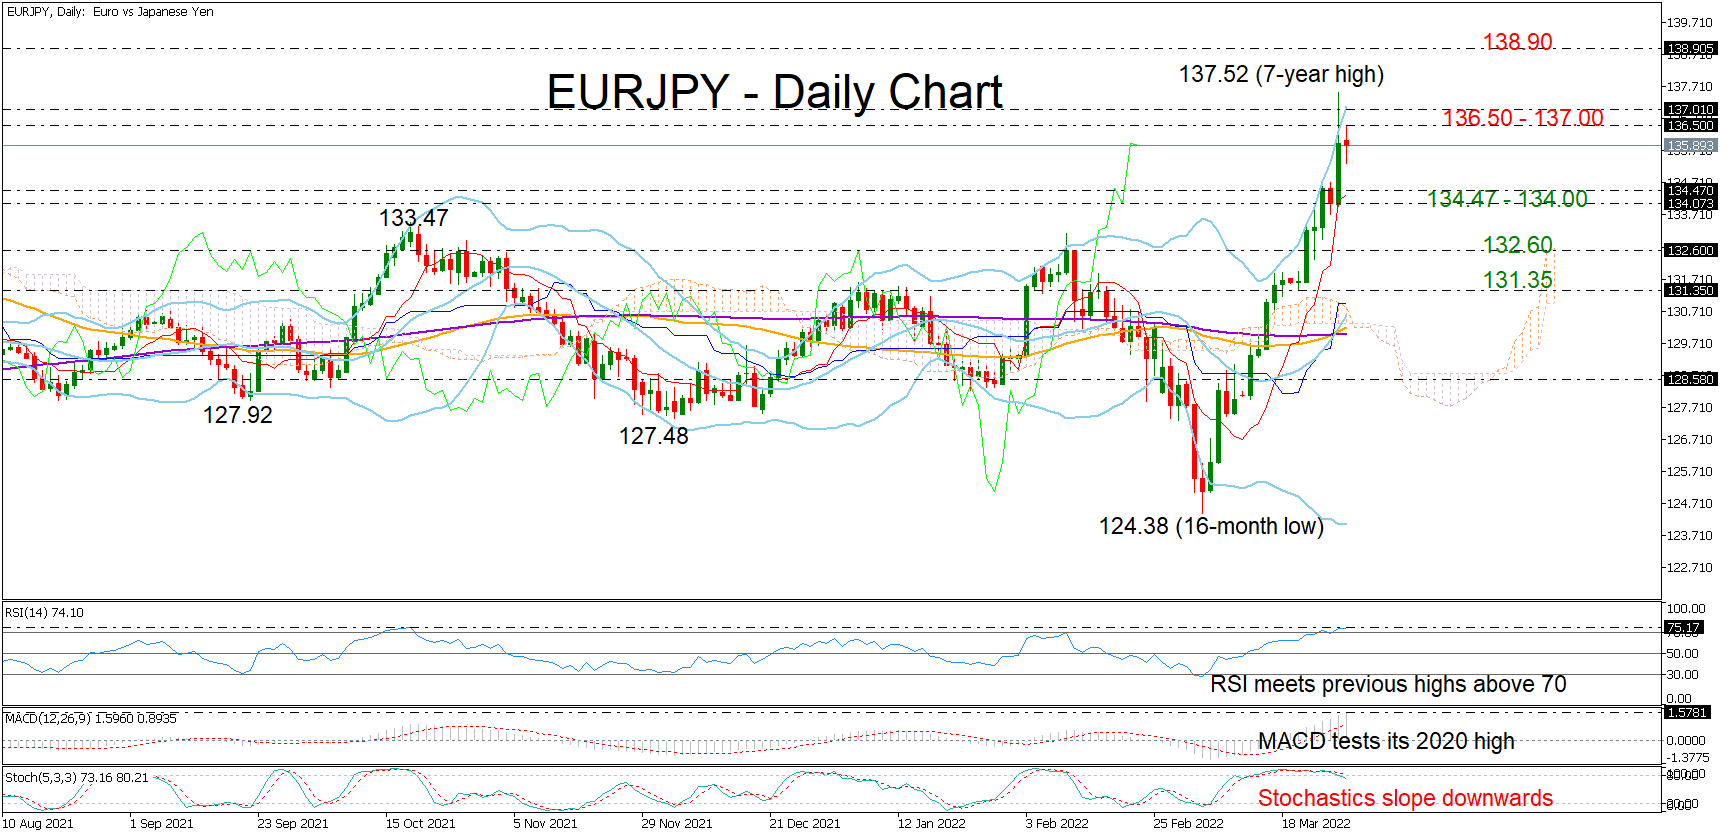
EURJPY pulled back to close at 135.93 on Monday after its aggressive rally topped at an almost seven-year high of 137.52 on Monday.
The price is trying to regain some ground today, but the 2018 resistance of 136.50 – 137.00 is keeping the bulls under control as the widened Bollinger bands foresee some stabilization in the short term. The fact that the Stochastics are sloping downwards to exit the overbought area, the RSI is very close to its October peak, and the MACD is testing its 2020 highs, is also endorsing weaker price momentum in the coming sessions.
Should selling pressures intensify, traders could initially seek support within the 134.47 – 134.00 territory. A break below that base and a step beneath 133.47 would downgrade the bullish long-term outlook back to neutral, likely triggering a sharper decline towards the 132.60 level. Moving lower, the bears may take a rest around 131.35.
In the positive scenario, where the price crawls back above the 136.50 – 137.00 wall, the bulls may attempt to pierce the 137.50 high and reach the 138.90 resistance from August 2015. The next target could be the 140.65 hurdle from June 2015.
Summarizing, the technical picture for EURJPY hints at a potential slowdown, though if the bulls manage to claim the 136.50 – 137.00 region, the pair may chart new higher highs.
GBPUSD Fails to Pilot Past 1.33; Bearish Bias Strengthens
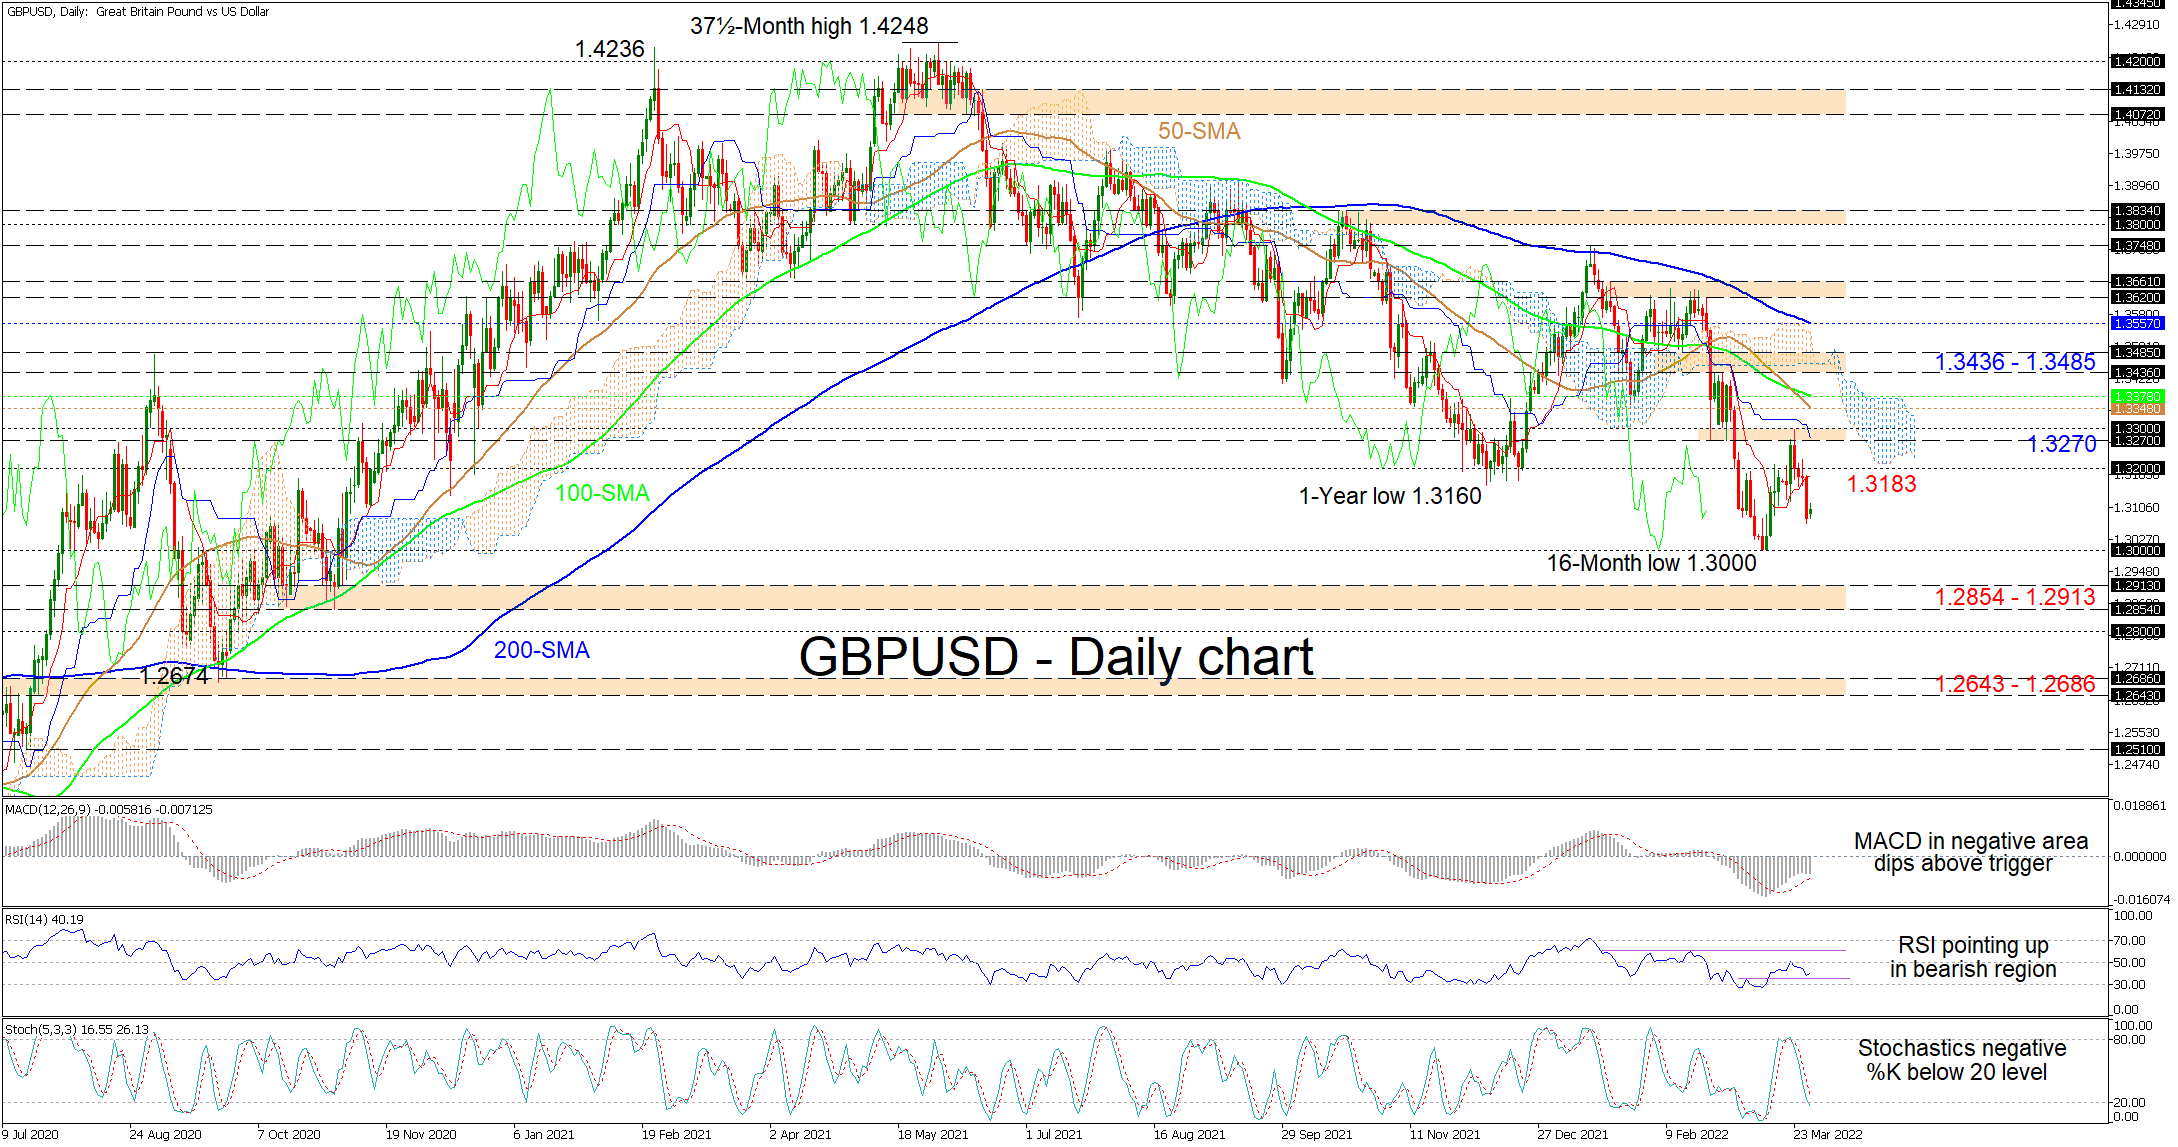
GBPUSD’s negative bearing has been rekindled after the 1.3270-1.3300 resistance band curbed advances, which began from the recorded 16-month low of 1.3000. The falling simple moving averages (SMAs) suggest that the intensity of the downward trend is intact.
Currently, the Ichimoku lines signal prevailing bearish forces despite the rising red Tenkan-sen line. The short-term oscillators are conveying mixed messages in directional momentum. The MACD, in the negative zone, is above its red trigger line but has started to turn lower again, while the RSI is improving in the bearish region. The negatively charged stochastic oscillator, whose %K line has pierced into oversold territory, is promoting additional negative moves in the pair.
If the price slips underneath yesterday’s intraday low of 1.3066, support could commence around the 16-month trough of 1.3000. Diving past this would resuscitate the broader descent that began from the more than three-year high of 1.4248, turning sellers’ focus towards the 1.2854-1.2913 support band. From here, should the price sink deeper and not consider the 1.2800 hurdle, the bears may then aim for the 1.2643-1.2686 support border that extends back to mid-June 2020.
Alternatively, if buying interest ramps up, the red Tenkan-sen line at 1.3183 along with the 1.3200 handle could provide initial upside constraints. Not much higher, the 1.3270-1.3300 resistance boundary may challenge buyers’ efforts to reinstate optimism in the pair. That said, if the pair successfully climbs north of the 1.3300 barrier, the bulls could then encounter the approaching 50- and 100-day SMAs at 1.3348 and 1.3378 respectively. Should upside momentum endure, they may then confront the Ichimoku cloud and the 1.3436-1.3485 resistance barricade.
Summarizing, GBPUSD is exhibiting a bearish bias below the 1.3300 high and the SMAs. A break below 1.3000 could power the bearish outlook, while a price hike beyond the 1.3300 level would be required to trigger positive developments in the pair.
Japanese Yen Settles Down
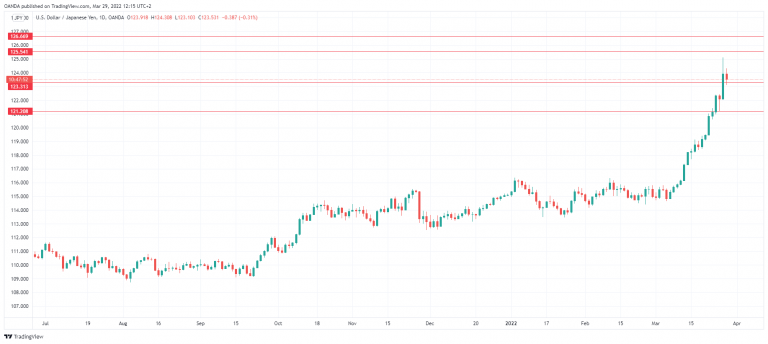
The Japanese yen has stabilized on Tuesday, after starting the week with sharp losses. USD/JPY is trading at 123.60 in the European session.
Yen flirts with 125 line
The yen took investors on a wild ride on Monday. USD/JPY climbed almost 300 points and broke above the symbolic 125 line for the first time since August 2015 before retreating and closing at 123.90. The yen was hammered after the BoJ rushed to defend its yield target, making an unlimited bid for 10-year JGBs at 0.25%. The bid has been extended until Thursday. The 4-day period is the longest intervention ever by the BoJ, and the move could lead to further losses for the wobbly yen. So far, the intervention hasn’t pushed 10-year yields downwards, as they are currently at 0.25%.
The BoJ has intervened in dramatic fashion so as to keep benchmark yields at an upper limit of 0.25%, as the Bank is committed to maintain a loose policy in order to kickstart the weak economy. This puts the BoJ out of sync with the Federal Reserve and other major central banks which are tightening policy in order to contain re-hot inflation.
The yen has been on a massive slide, with USD/JPY up over 7% in March. The weak yen is exacerbating inflation by making imports more expensive, which could make it difficult for the BoJ to continue trying to cap yields at ultra-low rates. The US/Japan rate differential has been widening, which has been the driver behind the yen’s spectacular slide.
Besides the BoJ, another player that should be monitored is Japan’s Ministry of Finance (MOF). The MOF is uncomfortable with the yen’s sharp downswing, and a BofA note on Monday said that if the yen climbs above 125, the ministry could warn speculators against intervention, while a break above 1.30 could trigger actual intervention by the MOF, according to BofA.
Don’t change channels – things could get very interesting if the yen continues to lose ground.
USD/JPY Technical
- 123.32 is a weak support line. Below, there is support at 121.21
- There is resistance at 124.55 and 126.66
Gold Bears are Back in Play: Elliott Wave Analysis
US Dollar Index, DXY still eyeing for more upside, out of a triangle while SP500 is approaching resistance. Risk-off will be a catalyst for more dollar strength, even vs. some comm. currencies. The question is what can cause risk-off? Well, it can be a disappointment for Ukraine-Russia talk that just started in Turkey.
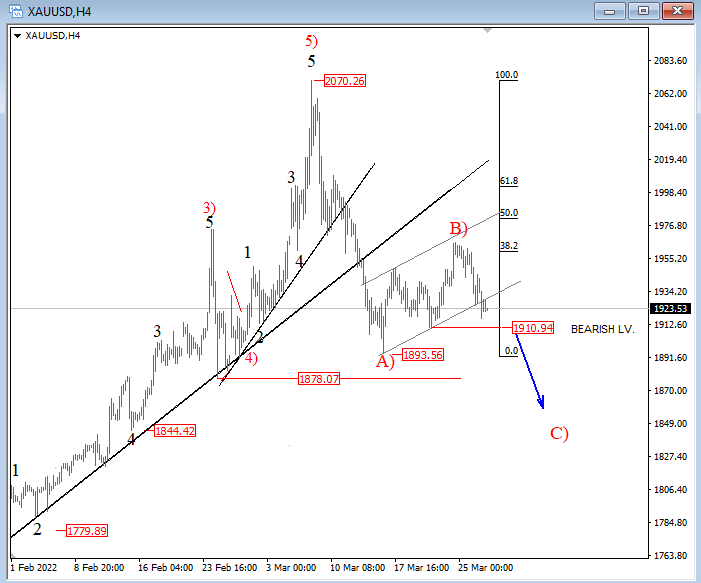
Gold is coming down after three up, so bears are back in play and they could extend even lower this week, below 1895 as the corrective rally should be fully retracted.
Gold 4h Elliott Wave analysis
Market Mood Lifted By Renewed Peace Talks Hopes
A sense of positivity returned to financial markets as the prospects of more ceasefire talks between Russia and Ukraine soothed investor jitters.
Asian shares opened higher on Tuesday morning, tracking the positive overnight cues from Wall Street as market players cast aside fears of rising interest rates to focus on geopolitical developments. European pushed higher this morning amid the improving market mood, with the risk-on sentiment potentially keeping US equity bulls in the driving seat later this afternoon.
In the currency arena, the yen hijacked our attention by weakening to levels not seen in seven years as the Bank of Japan intervened in bond markets to cap yields. Oil prices tumbled as China lockdowns prompted demand worries, while gold stood little chance against an appreciating dollar and rising Treasury yields. The widely watched US 10-year Treasury yield hit 2.5% yesterday.
On the geopolitical front, Ukraine’s president has said he is willing to discuss becoming a neutral country as part of a peace deal with Russia. Should a ceasefire agreement become reality, this could boost global sentiment further and revive investor confidence, sending equity markets higher.
Japanese Yen melts as BoJ intervenes
The yen is struggling to nurse the deep wounds inflicted by yesterday’s painful selloff. It weakened to a seven-year low against the dollar after the Bank of Japan (BoJ) offered to buy an unlimited amount of 10-year Japanese Government Bonds after yields rose to a fresh six-year high of 0.255%.
One would think that the extreme levels of uncertainty and geopolitical risks would send investors rushing towards the yen. However, the currency has weakened against every G10 currency since 24 February, when Russia began its invasion of Ukraine.
It is becoming clear that the yen’s weakness is a product of central bank divergence among other themes. While the Fed is willing to raise interest rates aggressively to tame rising inflation, the BoJ continues to stick with its dovish policy settings. If it carries on intervening to prevent yields from rising beyond the 0.25% policy target while other major market yields continue to rise, this could result in further yen weakness.
Looking at the technical picture, USD/JPY is heavily bullish on the daily charts. A strong close above 125.00 could open the door to the 2015 high around 125.85. Should 125.00 prove to be reliable resistance, prices could decline back towards 122.50 before experiencing some consolidation.
Oil prices shaky ahead of OPEC+ meeting
Oil benchmarks were shaky this morning after falling in the previous session amid fears over weaker fuel demand in China. WTI Crude and Brent have shed over 7% since the start of this week.
The world’s second-largest economy has announced its biggest city-wide lockdown since the Covid outbreak started more than two years ago. Given how China is the world’s largest crude consumer, this development continues to weigh on oil markets.
There could also be more volatility ahead with the OPEC+ meeting on Thursday. The cartel will determine output production beginning in May with markets expecting the group to stick with its pre-planned production quota hike of 400,000 barrels per day. Expect oil to remain sensitive to any news revolving around the China lockdown and Ukraine developments.
Gold breakdown on the horizon?
This could be a rough week for gold as renewed peace talks rekindle risk appetite. An appreciating dollar and rising Treasury yields are likely to rub salt into the wound, sending the precious metal on a slippery decline. On top of this, the US jobs report on Friday could compound gold’s woes if the numbers exceed market expectations.
Looking at the technical picture, prices have the potential to sink lower if a solid breakdown below the $1910 support is achieved. This could open the door towards $1900 and $1875. Should $1910 prove to be reliable support, prices may rebound back towards $1965 and $2000, respectively.
American Equities Mixed as Bond Yields Flash Warning Signs
American equities were relatively mixed on Monday as investors watched the performance of the bond market and the war in Ukraine. On Monday, the yield curve inverted for the first time since 2016 as the yields of shorter-term bonds outperformed the longer-term ones. The 10-year yield retreated to 2.45% while the 30-year yield was about 2.50%. The performance of these bonds is a sign that the market is now pricing in a recession as the Fed embraces a more hawkish sentiment. Officials have warned that they could be forced to implement several 50 basis point rate hikes in upcoming meetings. Some of the top movers in Wall Street were firms like AMC, Gamestop, Coinbase, and Tesla.
The US dollar index rose slightly as investors waited for the upcoming consumer confidence data. Economists expect that data by Conference Board will show that the country’s confidence declined slightly in March as inflation concerns remain. They see the confidence number falling from 111 in February to 107 in February. Last week, a similar number by Michigan University showed that confidence declined to the lowest level in about a decade. The Bureau of Labor Statistics will also publish the latest job openings numbers.
Cryptocurrency prices continued doing well in the overnight session even as the yield curve inverted. Analysts expect that Russia and other countries will start to embrace Bitcoin as a means of exchange or store of value. For one, western countries like the US have deployed their currencies as a form of economic warfare. Also, there is optimism that some countries will embrace more user-friendly regulations this year. Bitcoin prices rose to over $48,000 while the total market cap of all digital currencies rose to over $2 trillion.
EURUSD
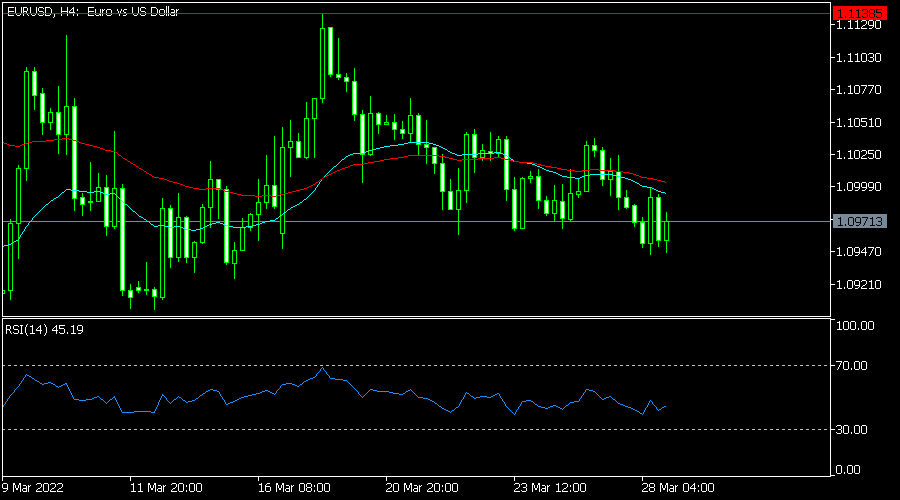
The EURUSD pair remained in a consolidation mode as investors watched the performance of the American bond market. It is trading at 1.0970, where it has been in the past few days. This price is along the 23.6% Fibonacci retracement level. It has also moved slightly below the 25-day and 50-day moving averages while the Relative Strength Index (RSI) has moved to the neutral level. Therefore, the pair will likely remain in this range today.
GBPUSD
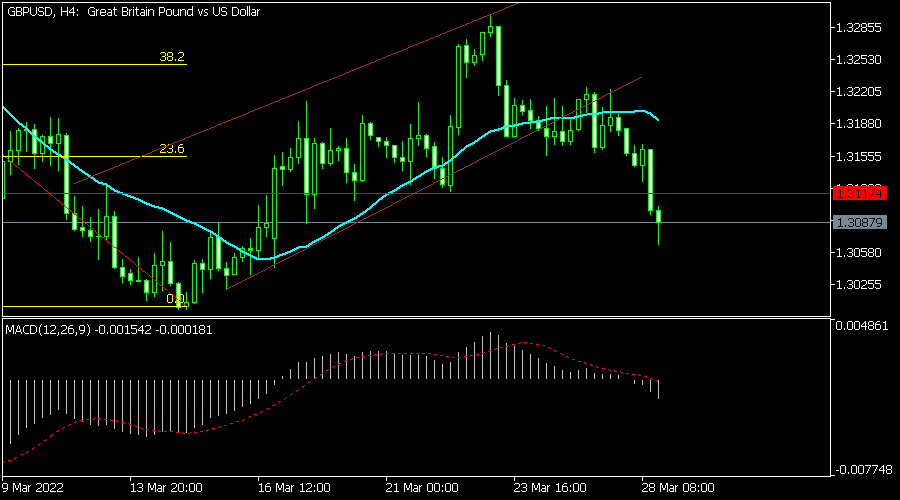
The GBPUSD pair has been in a strong bearish trend in the past few days. It is trading at 1.3087, which is close to the lowest level since March 17. It has moved below the ascending channel shown in brown and the 25-day moving average. Further, the pair has moved below the important support level at 1.3117 while oscillators are pointing downwards. Therefore, the pair will likely have a bearish breakout in the coming days.
XNGUSD
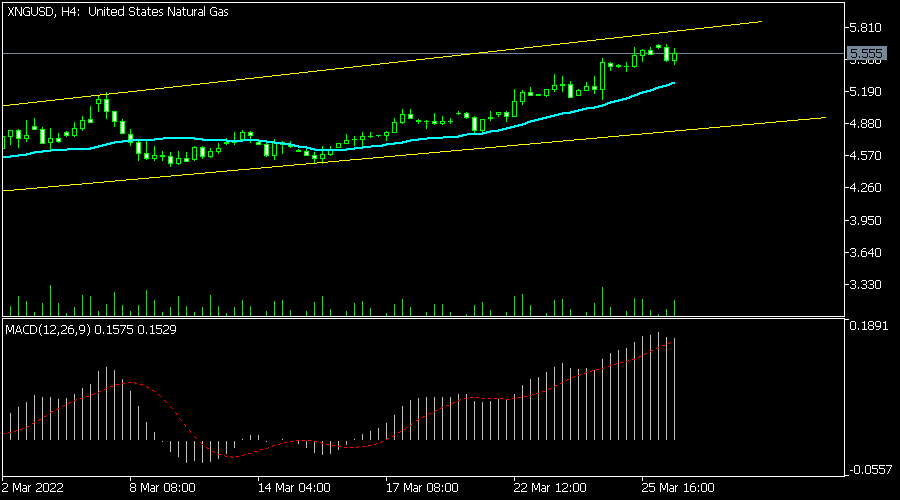
The XNGUSD pair has been in a bullish trend because of the ongoing crisis in Russia. There are expectations that Russia will limit the flow of natural gas to some European countries, which will lead to shortages. It is slightly below the upper side of the ascending channel and is also slightly above the 25-day moving average. Therefore, the pair will likely maintain its bullish trend.