Sample Category Title
Fed Bostic penciled in only six hikes this year
Atlanta Fed President Raphael Bostic said, "I penciled in six rate hikes for 2022 and two more for 2023,"
"I recognize that I am toward the bottom of the distribution relative to my colleagues, but the elevated levels of uncertainty are front forward in my mind and have tempered my confidence that an extremely aggressive rate path is appropriate today," he added.
"The risks go both ways," Bostic said. "Should demand falter in the face of economic uncertainty or removal of monetary policy accommodation, then the appropriate path may be shallower than I currently project. But there are other developments, such as shifts in supply strategies, that could mean higher costs and thus motivate a steeper policy path than I expect."
Canadian Dollar Posts Best Week of 2022
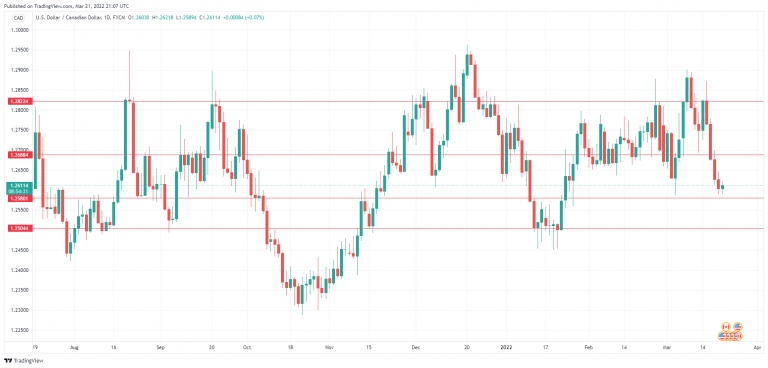
The Canadian dollar is coming off its best week of the year, in which it gained 1.14%. The currency has posted slight gains on Monday, dropping below the 1.26 line for the first time since late January.
Retail sales rebound
The Canadian dollar has extended its rally on Monday, after posting four straight winning days. USD/CAD fell 1.14% last week, as the Canadian dollar enjoyed its best week this year. The week ended on a positive note, as retail sales for January bounced back after sharp losses in December. Headline retail sales rose 3.2% MoM, smashing the estimate of 2.4%. Core retail sales rose 2.5%, above the estimate of 2.4%. In December, the headline figure fell by -2.0% and core retail sales by -2.7%.
The Fed finally hit the rate trigger last week, raising interest rates for the first time since December 2018. The Bank of Canada is expected to keep pace with a rate hike in April, after raising rates from 0.25% to 0.50% at the March meeting. The markets are expecting the BoC to be aggressive in its fight against high inflation and have priced in up to six more hikes this year. Similar to the Fed, the BoC is concerned with stagflation and will have to be cautious as it raises rates, in order not to choke growth as the economy emerges from Covid.
The war in Ukraine has raged for a month, and the Russian invasion has stalled in the face of stiff Ukrainian resistance. Civilian casualty figures continue to rise as Russia has stepped up its campaign of hitting civilian targets. Over the weekend, the Turkish foreign minister said that the two sides were making progress on a peace agreement, but previous such announcements all proved to be premature. If there are tangible signs of progress towards a ceasefire, the Canadian dollar would likely continue its upswing.
USD/CAD Technical
- USD/CAD faces resistance at 1.2688 and 1.2822
- 1.2580 is under pressure in support. Below, there is support at 1.2504
Oil and Gold Paths Diverged
Gold has remained in a one-and-a-half per cent range since last Thursday. The correction from a peak of $2070 to values below $1900 caused a brief aftershock, but it was not sustained. Gold has now stabilised above the peaks of May and June last year and is currently searching for further meaningful momentum.
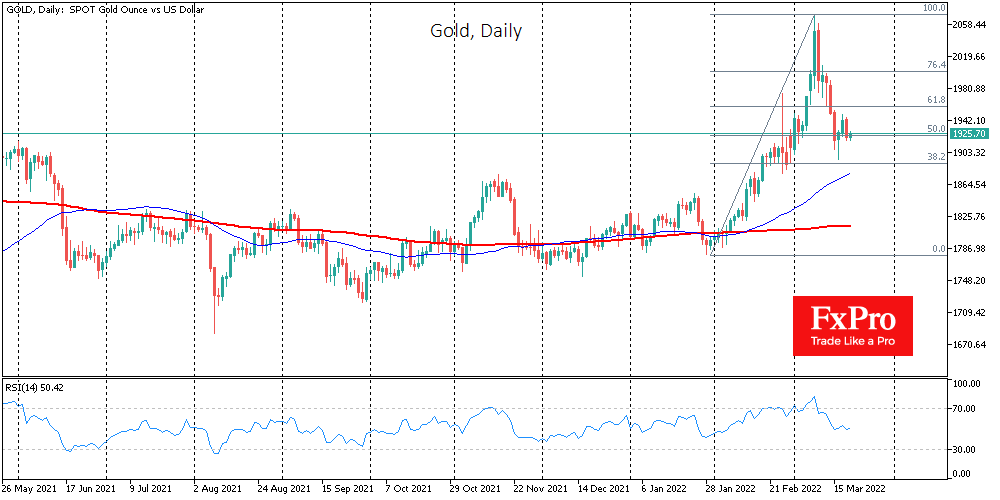
For short-term traders, gold has taken a back seat as markets try to assess the impact of disrupted supply chains and the amount of supply shortfall in raw materials and food. At the same time, medium-term traders should not lose sight of the fact that the current situation will not allow central banks to act adequately. As a result, the supply of fiat money will increase faster than the supply of commodities. In other words, we should expect greater tolerance for higher inflation from the CBs.
In addition, governments should also be expected to provide financial support to the economy. In practice, that means more money supply and a higher level of public debt to GDP. And that is another disincentive for monetary policy, which is negative for the currency. It is also favourable for gold, which is used as protection against capital depreciation.
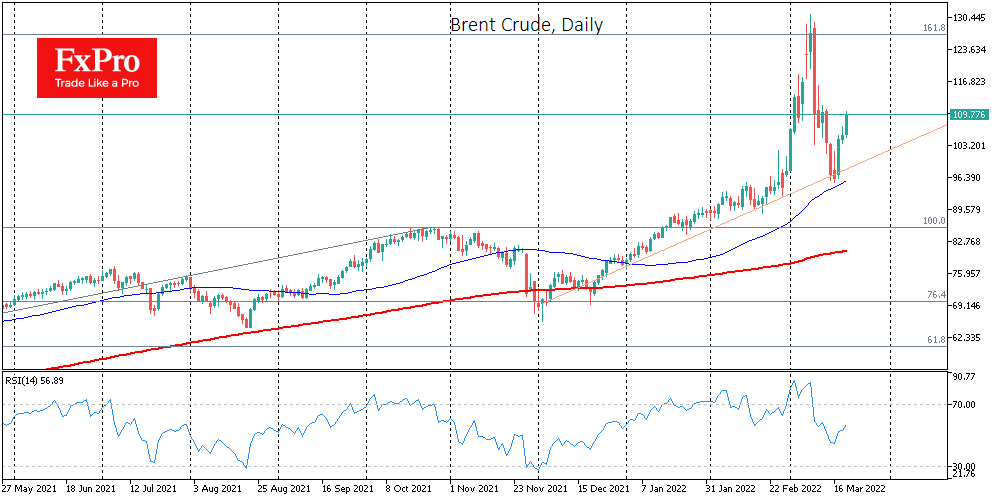
Oil is gradually becoming the opposite of gold. After bouncing back to the trend support level of the last four months, Brent got back above $100 reasonably quickly and is adding 4% on Monday, trading at $109.
Speculative demand for oil is picking up again amid discussions of a Russian energy divestment, which could be the agenda for the EU leaders and Biden meeting later this week. In addition, the US oil supply has been slow to rise, with data on Friday showing that the number of working oil drilling rigs declined a week earlier.
Oil producers appear to be cautious about demand prospects with record fuel prices and are in no hurry to flood the market. This will fuel prices in the short term but is becoming an increasing drag on the economy in the medium term.
Locally, we also risk suggesting that Europe will once again make it clear that it cannot substitute Russian energy, preferring to focus on sanctions against other sectors. And that could prove to be a dampening factor for oil later in the week. Oil prices above $110 still look unsustainably high, and a range with support at $85 looks more adequate for the coming months.
EUR/USD Elliott Wave Analysis: More Weakness Ahead
Stocks are higher since the FED decision last week, so buy the rumor sell the news is what caused a turn. We see commodity currencies doing well, with more upside in view in the very near term. If you favor the USD strength then track it vs EUR as this one can stay weak due to the situation in Ukraine.
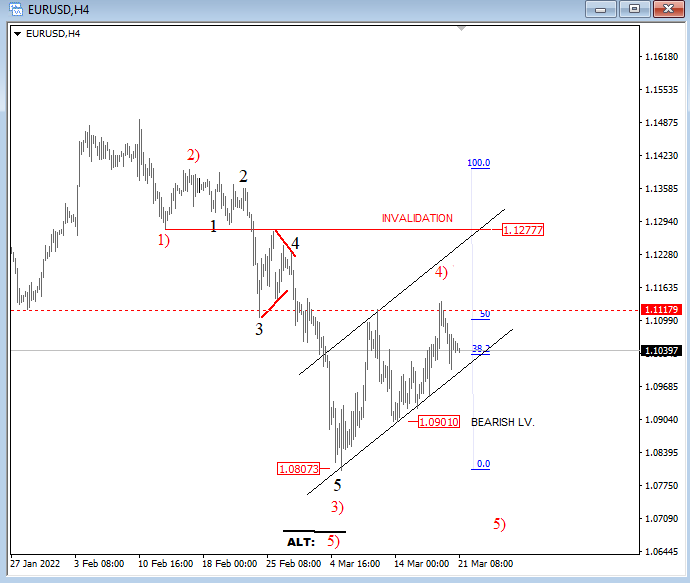
Technically we see EURUSD making a corrective rise from the low, so more weakness can be seen, especially when trendline is support broken.
EUR/USD 4h Elliott Wave analysis
Bundesbank: Significantly weaker recovery expected in Q2
In the monthly report, Bundesbank said "significantly weaker recovery expected in the second quarter". The effects of Russia's attack on Ukraine are "likely to have a noticeable impact on economic activity in Germany from March". Supply chain problems are likely to "intensify again", and energy prices have "risen massively".
"From today's perspective, the strong recovery planned for the second quarter is likely to be significantly weaker". Also, the extent of the effects of war is "very uncertain and depends on how events unfold".
EURUSD is Consolidating
On Monday, 21 March, the major currency pair is trading at 1.1055. Investors couldn’t “save” the previous rising wave and the short-term prospects are looking rather uncertain.
Later today, market players should pay attention to the speech to be delivered by the US Fed Chairman Jerome Powell. He is rather unlikely to announce something investors don’t know. However, if he confirms the regulator’s plans to raise the rate several times this year and to cut its own portfolio, it will calm down financial markets.
This week, Powell is scheduled to speak several times. Apart from him, other FOMC members are also expected to address the audience.
Fundamentally, the “greenback” is now supported by a restrained risk attitude – these days, investors require “safe haven” assets.
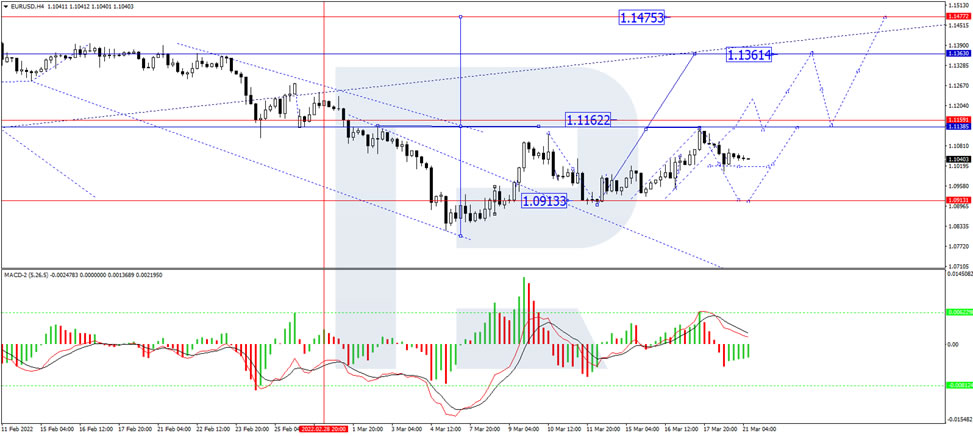
In the H4 chart, EUR/USD has finished the ascending wave at 1.1138; right now, it is correcting towards 1.0948 and may later form one more ascending wave the target at 1.1361. From the technical point of view, this scenario is confirmed by MACD Oscillator: its signal line is falling and may later break 0. After that, it is expected to continue moving towards new lows.
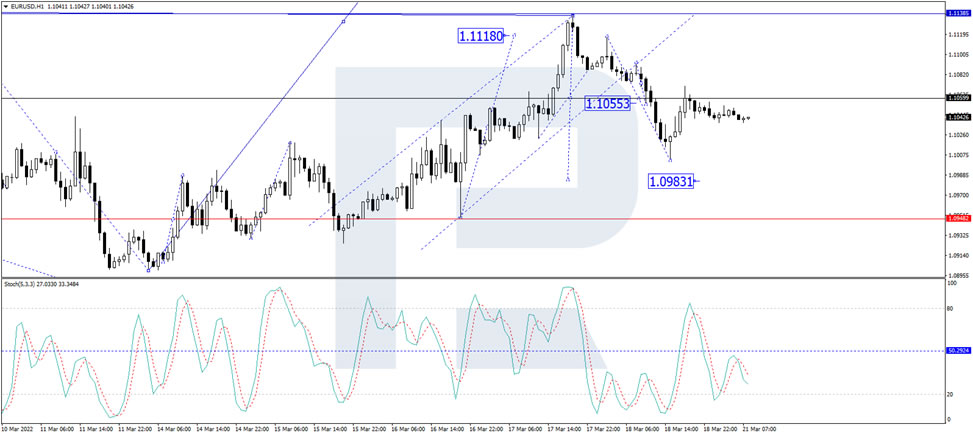
As we can see in the H1 chart, after reaching the short-term correctional target at 1.1000 and then forming a new ascending structure towards 1.1060, EUR/USD has rebounded from the latter level; right now, it is trading downwards again with the target at 1.0983 (at least). From the technical point of view, this idea is confirmed by the Stochastic Oscillator: its signal line is moving below 50 and may continue falling to reach 20. Later, the line may rebound from 20 and start a new growth towards 80.
ECB Lagarde: Even in the bleakest scenario, there is no stagflation
ECB President Christine Lagarde said that Russia invasion of Ukraine will have "consequences" for growth. However, "even in the bleakest scenario, with second-round effects, with a boycott of gas and petrol and a worsening of the war that goes on for a long time -- even in those scenarios we have 2.3% growth." Hence, "we are not seeing elements of stagflation now," she said.
Lagarde also reiterated that the US and Eurozone are in "difference universes", at a "different stage" in the economic cycle, with "different starting points". "We in the euro area are at negative rates, while the U.S. never went below zero."
Fed Raising Rates But Stocks Rallying… What is Going On?
The era of COVID-19 cheap money is over. Who is afraid of the Fed's tightening cycle? Apparently not the stock market!
In a move aimed to fight the worst inflation in the US in 40 years, the Federal Reserve announced on March 16 a 0.25% increase in interest rates. It's the first time in more than three years that the Fed raises the benchmark interest rate. The last increase was in December 2018. The 25 basis point hike brings the current interest rate to the range of 0.25%-0.5%. All of this was expected because markets have priced in this increase for a long time. However, the strange thing was the US stock markets' reaction after the rate hike. Markets didn't behave the way they are supposed to.
In theory, higher rates should make stocks less attractive, because higher rates mean higher borrowing costs for businesses and consumers, which lowers the overall spending. In turn, profits are affected, which is reflected in stock market prices. However, this time, investors have rebelled against this traditional wisdom, and have pounced on the stock markets. US markets jumped after the Fed announced its long-awaited rate hike and indicated the possibility of six more hikes this year. The S&P 500 closed that day 2.2% higher.
Why did US stocks rise after Fed's rate hike?
- The US stocks have rallied because stocks usually reflect what’s best for the economy. And, raising rates now is the best solution for the economy. Investors are finally relieved that the Fed is taking action to fight the highest level of inflation in decades.
- The Fed surprised the market by indicating the possibility of raising rates in all the remaining six meetings, indicating that the US economy is strong and can withstand the tightening cycle.
- Signs that the conflict between Russia and Ukraine is beginning to enter the stage of resolution and settlement.
- Signs from China that it will ease its broad regulatory crackdown.
What does history say about raising rates and US stocks?
Over the past two years, the stock market has soared and stayed strong in the face of the worst global pandemic in a century, one of the most divisive presidential elections in US history, and the Capitol building under attack. Now stocks are facing Europe's biggest ground war since World War II, and the fastest inflation since the 1980s. History indicates that US stocks are poised to face more volatility after a rate hike. This, however, does not mean that the bull market is over. In fact, in the previous eight tightening cycles, S&P 500 was higher a year after the first increase each time, according to LPL Financial.
Here's a look at what history has to say about the US stock market when the Fed starts raising rates:
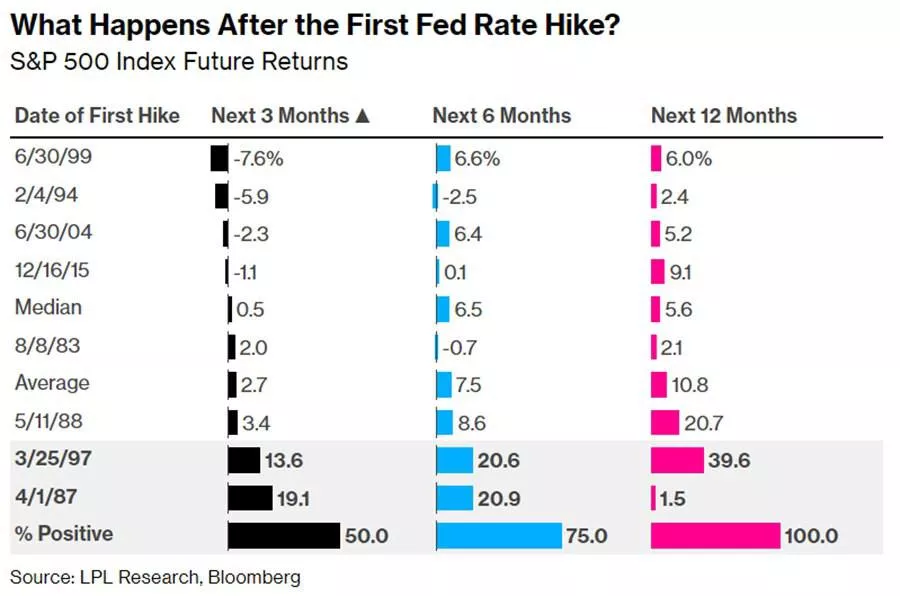
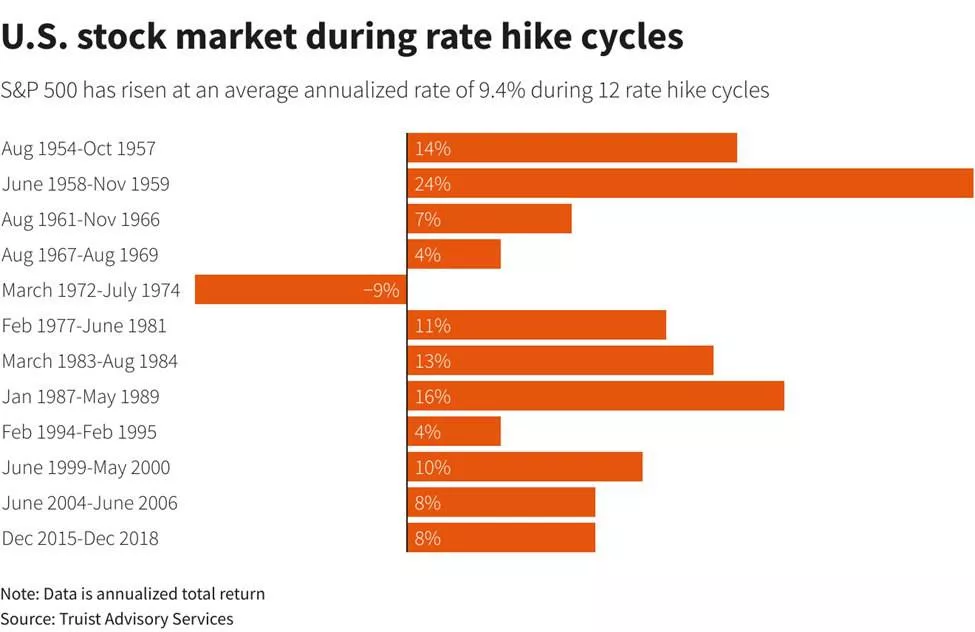
Finally, the free money from the Federal Reserve was such a wonderful gift to the stock market during the pandemic that they became addicted to it. Therefore, although the high rates may pose a challenge to the US stock market, it may be able to overcome it by the end of the year. Traders must manage this volatility carefully to profit from it.
EURUSD Faces Fading Bearish Bias, But Confirmation Required
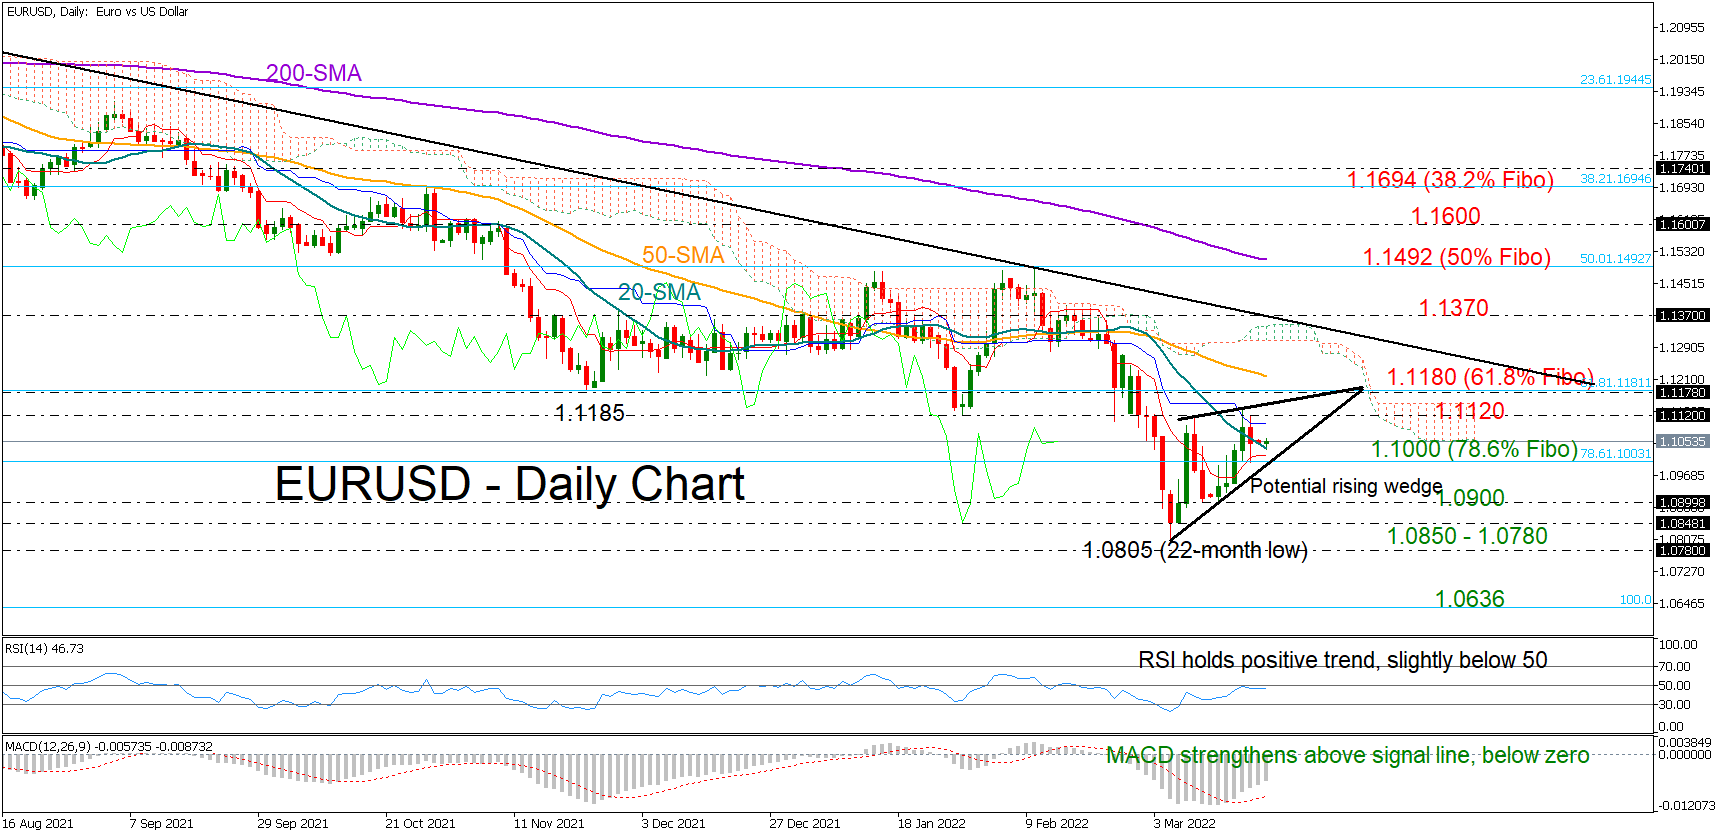
EURUSD opened the week silently, hovering near Friday’s closing price and around the 20-day simple moving average (SMA) at 1.1046.
The 1.1120 – 1.1180 territory, which has been a key constraint to upside and downside movements since the end of November, remains the main target following the bounce off 1.0805. Interestingly, the 61.8% Fibonacci retracement of the 1.0636 – 1.2348 upleg is placed within this zone, while the 50-day SMA is approaching that area too, making any violation here important to watch. Should the bulls successfully knock down that wall, the price could accelerate towards the tentative descending trendline at 1.1350 drawn from the peak of 1.2265. Another victory at this point, and particularly a decisive close above the former resistance of 1.1370, could see an extension towards the 50% Fibonacci of 1.1492 and the 200-day SMA.
From a technical perspective, downside risks have faded but they have not been eliminated in the short-term picture as the MACD keeps distancing itself above its red signal line and within the negative area, while the RSI, although below its 50 neutral mark, is maintaining a positive trend. On the other hand, up until now, the market structure in March has taken the shape of a rising wedge at the bottom of a downtrend, which is usually dissolved on the downside. Nevertheless, if the price manages to set a foothold above the 20-day SMA in the coming sessions, that could be an encouraging sign that buying appetite has started to grow in the market.
Otherwise, if the pair dives below the 1.1000 mark, where the 78.6% Fibonacci retracement is intersecting the short-term supportive trendline, the 1.0900 level could come first to the rescue. If not, the bears may attempt to breach the 1.0850 – 1.0780 floor with scope to reach the pandemic low of 1.0636.
Summarizing, although the medium-term outlook for EURUSD remains blurry below 1.1492, some recovery cannot be ruled out in the short-term. However, traders may wisely wait for a break above 1.1120 – 1.1180 to become more confident that the latest rebound in the pair will continue.
Crude Oil Supply and Demand Imbalances Remain
Crude oil prices remained at elevated levels on Monday morning as investors reacted to the rising fears of supply and demand imbalances. Brent is trading at $107 while WTI is at $103. These prices are significantly below their highest levels this year. In a report published last week, the International Energy Agency (IEA) said that supply will drop sharply in April as oil traders swerve Russian crude to avoid sanctions. It estimates that over 3 million barrels will be cut from the market per day. The price action has been complicated by ongoing negotiations in Iran and Venezuela.
American and European futures held steady as investors bought the dips. The Dow Jones rose by over 270 points while the Nasdaq 100 rose by 280 points. Still, there are significant concerns among investors. For example, there are margin concerns considering that the price of most commodities has been in an upward trend. Also, the cost of shipping rose as companies navigate longer routes. Another concern is that the number of Covid-19 cases has reportedly been rising sharply in China. As a result, the government has announced several lockdowns affecting over 50 million people.
The economic calendar will be muted on Monday. As such, investors will continue focusing on new developments on the war in Ukraine. Russia is expected to continue bombarding cities now that its military offensive has stalled. Investors will also reflect on the interest rates decision by the Federal Reserve. The bank decided to hike interest rates on Wednesday last week. Therefore, a speech by Jerome Powell will likely have an impact on stocks and currencies.
EURJPY
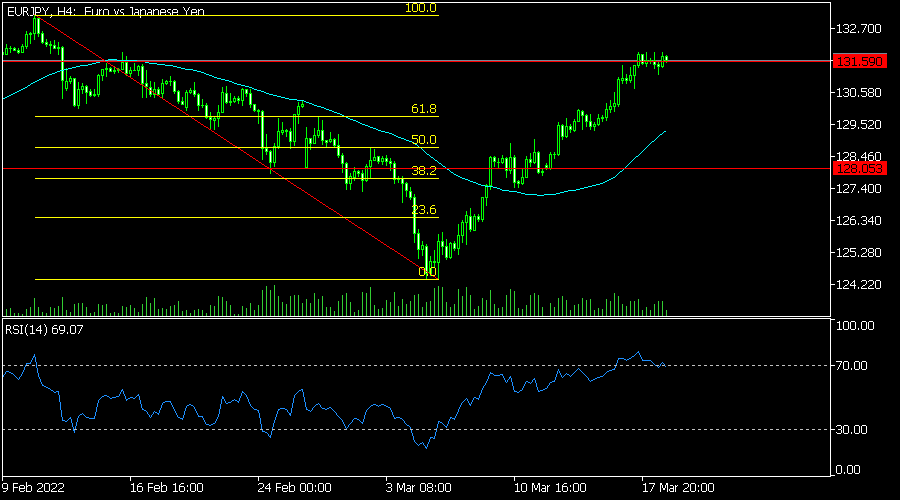
The EURJPY pair has been in a strong bullish trend in the past few days as investors react to the latest decisions by the Bank of Japan and European Central Bank. The pair rose to a high of 131.60, which is significantly above this month’s low at 124.40. On the four-hour chart, the pair moved above the 25-day and 50-day moving averages. It has also risen above the 78.6% retracement level. Therefore, the pair will likely keep rising in the near term.
EURUSD
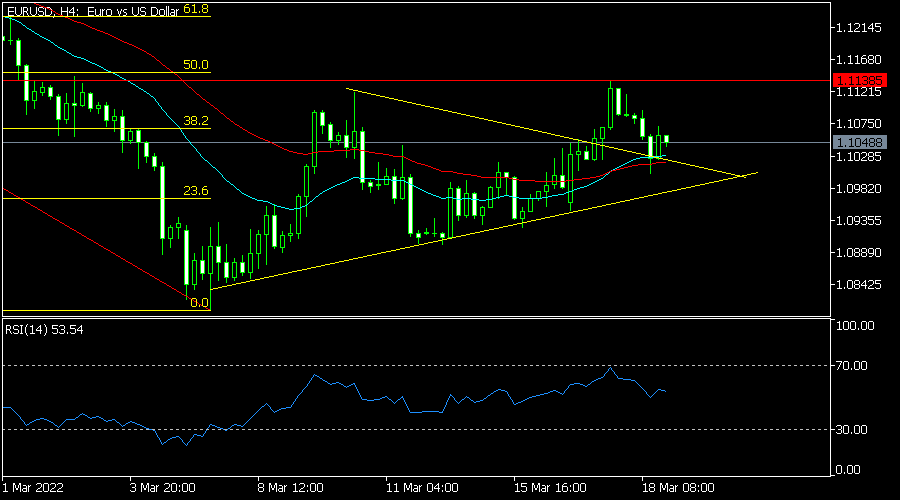
The EURUSD pair was little changed on Monday morning. It is trading at 1.1050, which was slightly lower than last week’s high of 1.1140. It is slightly above the upper side of the yellow symmetrical triangle pattern. It is slightly above the 25-day moving average and slightly below the 38.6% Fibonacci retracement level. The pair will likely keep falling as bears target the lower side of the triangle pattern.
NZDUSD
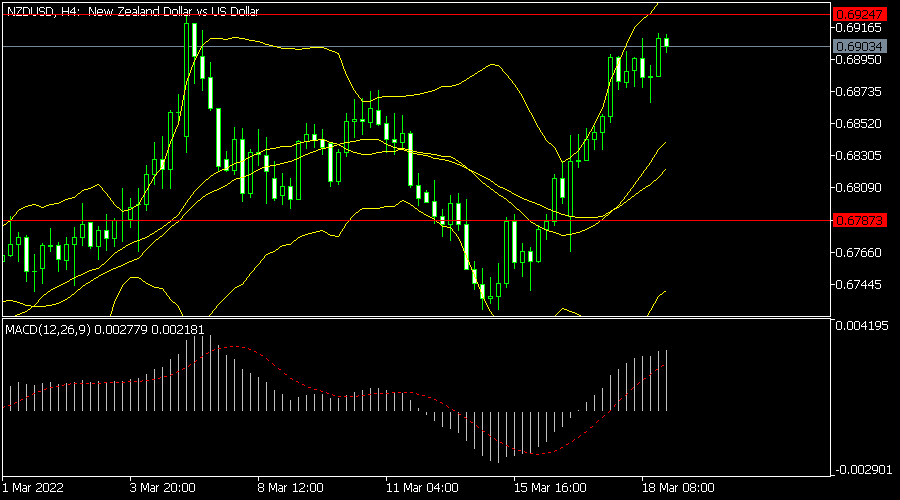
The NZDUSD maintained a bullish trend after the latest New Zealand trade numbers. It rose to a high of 0.6900, which is slightly below the key resistance at 0.6925. On the four-hour chart, it has formed a V-shaped recovery and moved above the 25-day and 50-day moving averages. The pair has also moved between the middle and upper lines of the Bollinger Bands. Therefore, the pair will likely keep rising in the near term.