Sample Category Title
GBP/USD Weekly Outlook
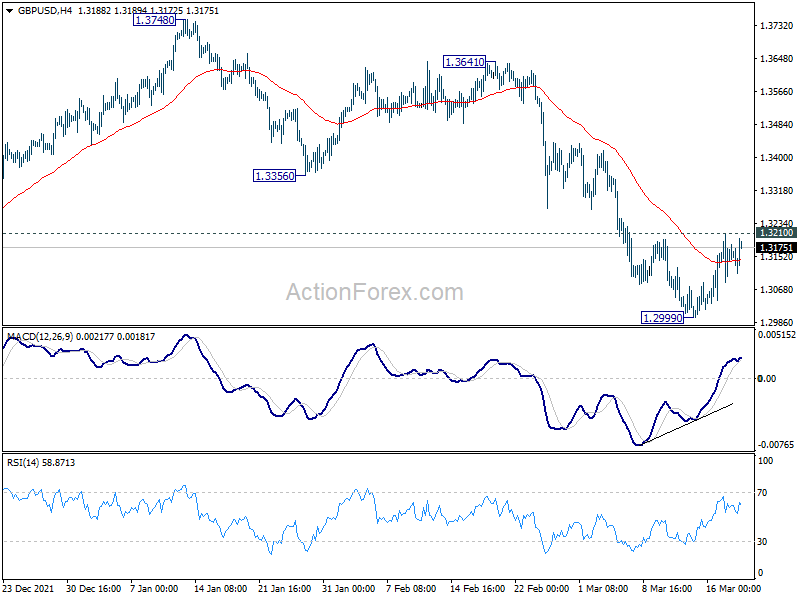
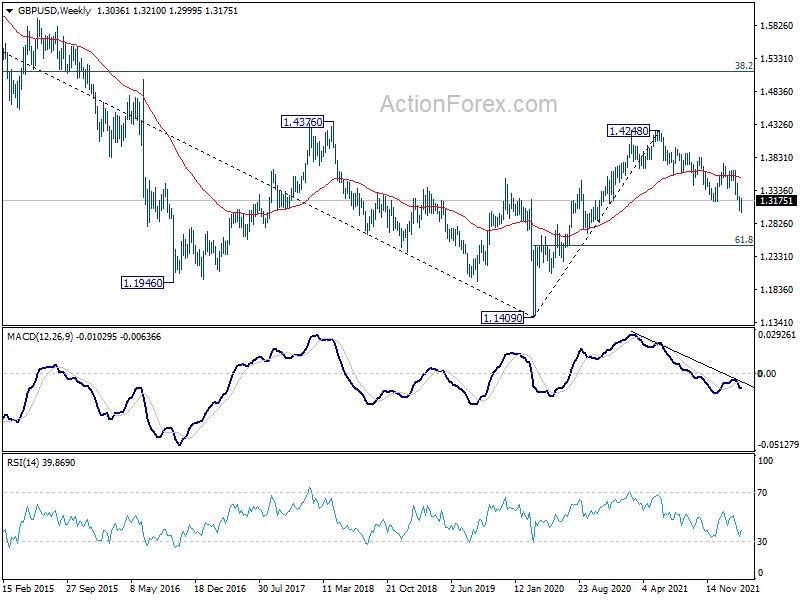
GBP/USD recovered after edging lower to 1.2999 last week. But recovery was capped at 1.3210. Initial bias remains neutral this week first. On the downside, break of 1.2999 will resume later down trend from 1.4248. However, firm break of 1.3210 should confirm short term bottoming. Stronger rise should be seen back to 55 day EMA (now at 1.3369).
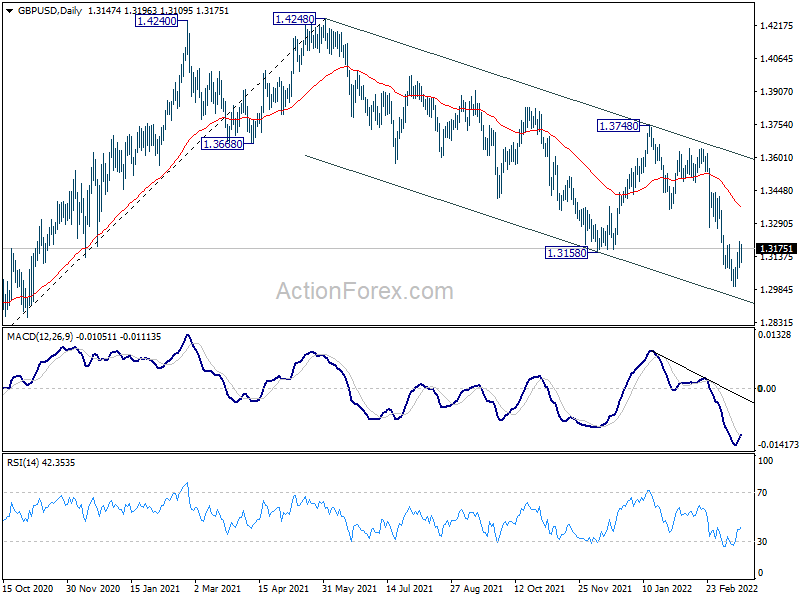
In the bigger picture, current development suggests that the up trend from 1.1409 (2020 low) has completed at 1.4248. Decline from 1.4248 could still be a corrective move, or it could be the start of a long term down trend. In either case, deeper decline would be seen back to 61.8% retracement of 2.1161 to 1.1409 at 1.2493. In any case, break of 1.3748 resistance is needed to indicate medium term bottoming, or outlook will stay bearish.
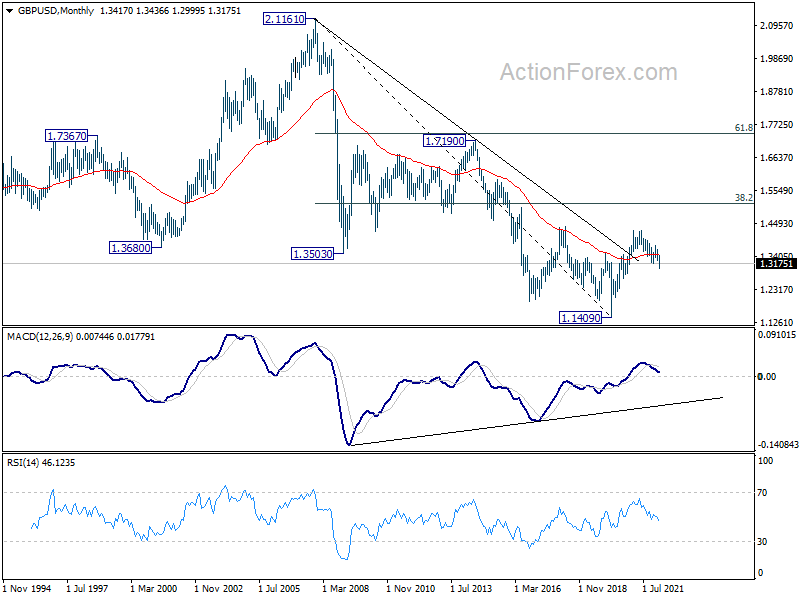
In the longer term picture, rebound from 1.1409 long term bottom could have completed at 1.4248 already, ahead of 38.2% retracement of 2.1161 to 1.1409 at 1.5134. The development argues that price actions from 1.1409 are developing into a corrective pattern only. That is, long term bearishness is retained for resuming the downside from 2.1161 (2007 high) at a later stage.
USD/CHF Weekly Outlook
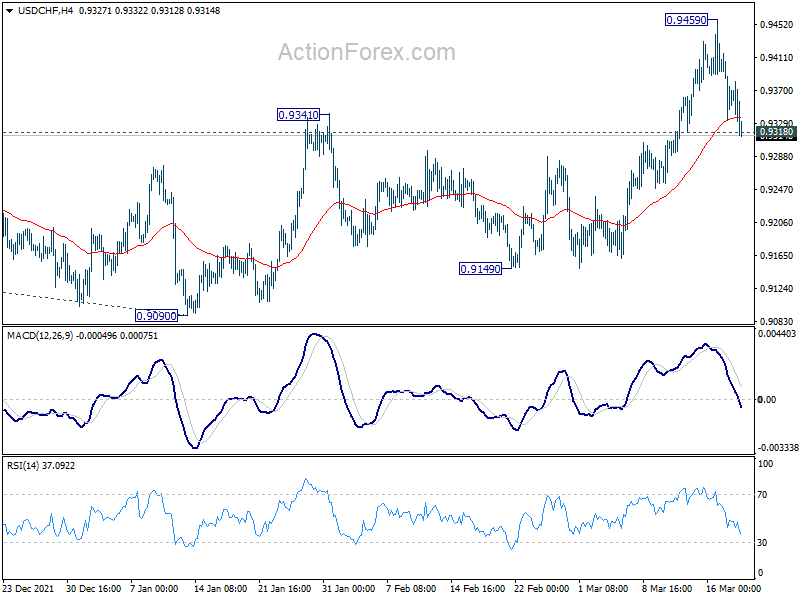
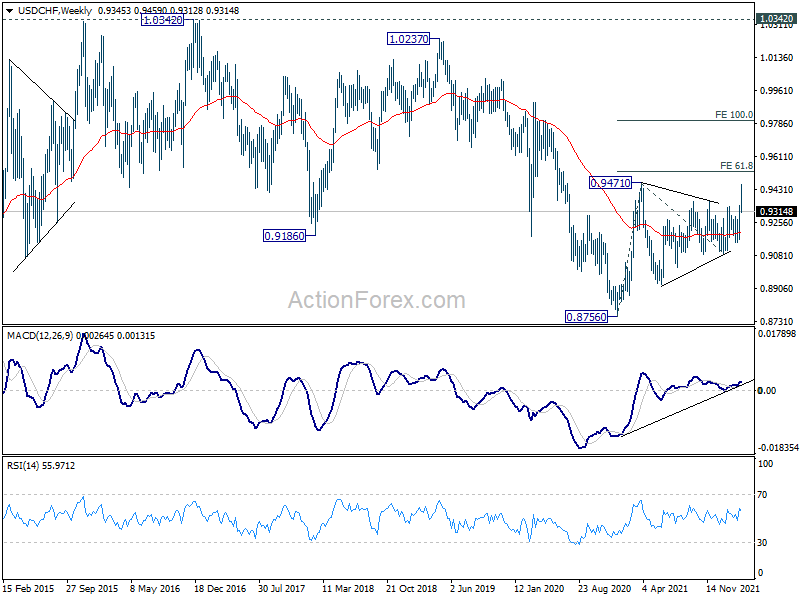
USD/CHF surged to as high as 0.9459 last week but failed to break through 0.9471 resistance and retreated sharply. Break of 0.9318 minor support suggest short term topping. Initial bias is mildly on the downside this week for 55 day EMA (now at 0.9242). On the upside, firm break of 0.9471 will resume the rise from 0.8756 to 61.8% projection of 0.8756 to 0.9471 from 0.9090 at 0.9532.
In the bigger picture, medium term outlook will be neutral at best as long as 0.9471 resistance holds. Larger down trend could still extend through 0.8756 (2021 low). However, firm break of 0.9471 will argue that whole down trend form 1.0342 (2016 high), has completed with waves down to 0.8756. A medium term up trend should be set up to target 1.0237/0342 resistance zone.
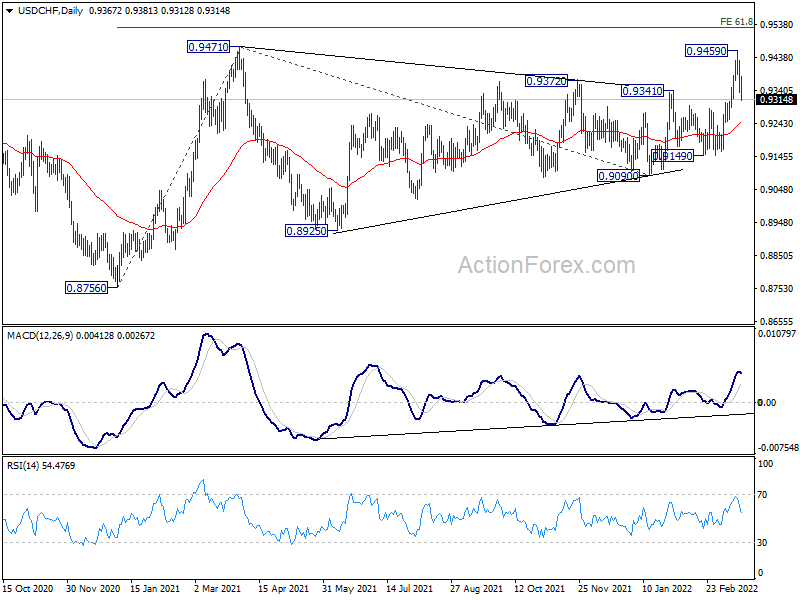
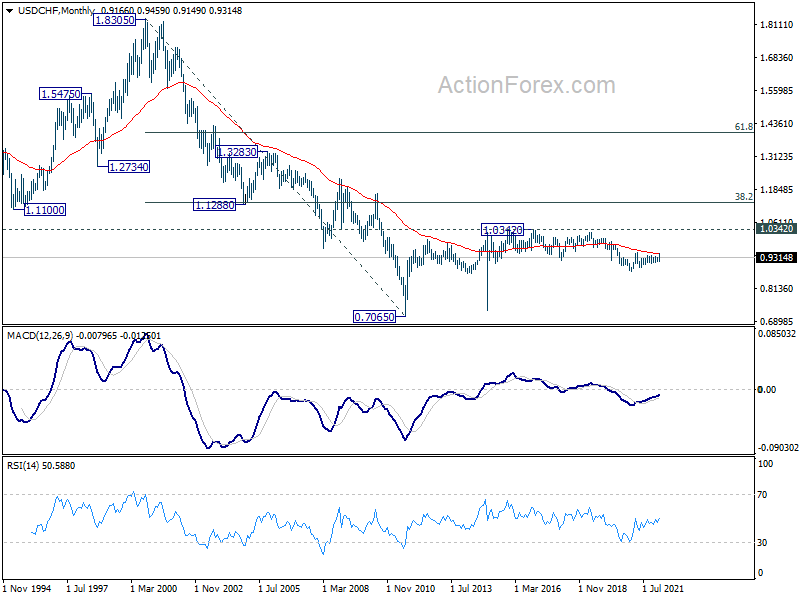
In the long term picture, price actions from 0.7065 (2011 low) are currently seen as developing into a long term corrective pattern, at least until a firm break of 1.0342 resistance.
AUD/USD Weekly Outlook
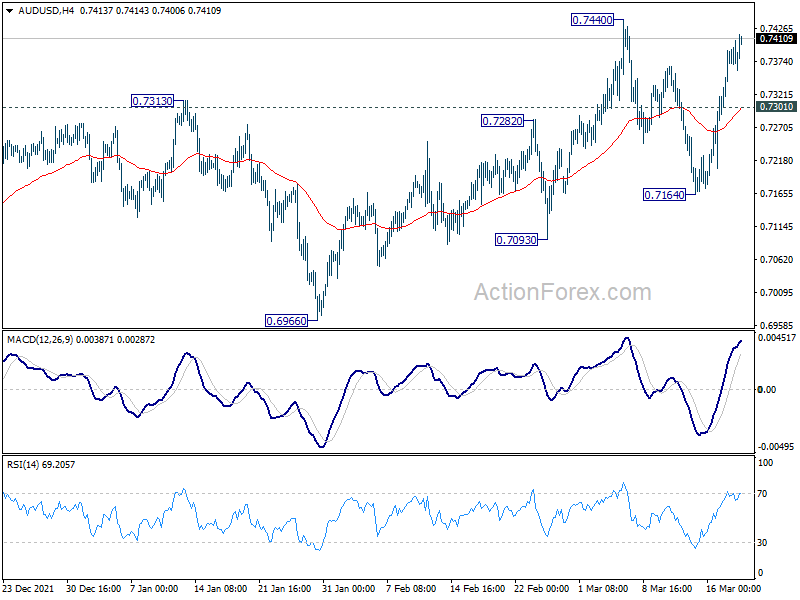
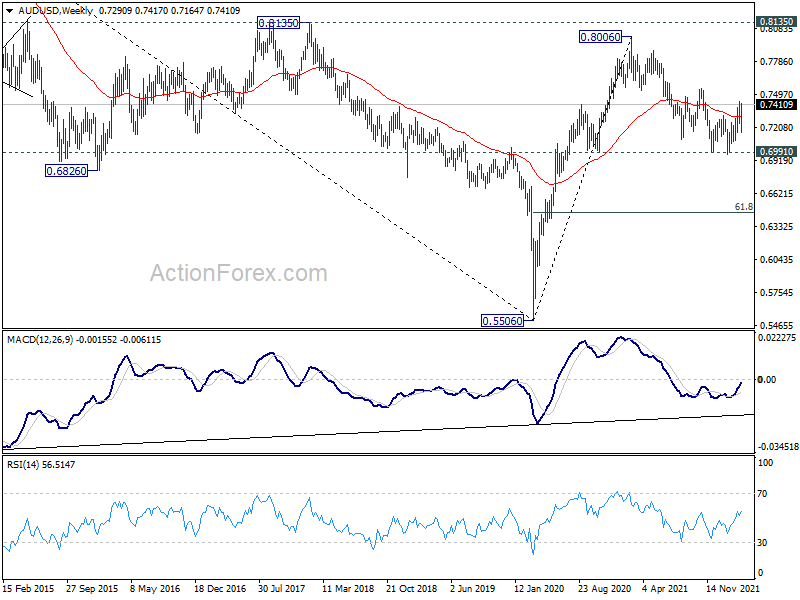
AUD/USD rebounded strongly after initial dip to 0.7164 last week. Initial bias is mildly on the upside this week for 0.7440 resistance. Break there will resume whole rise from 0.6966 to 0.7555 resistance. Decisive break there should confirm that whole corrective decline from 0.8006 has completed at 0.6966. On the downside, below below 0.7301 minor support will turn bias neutral first. But further rally will remain in favor as long as 0.7164 support holds.
In the bigger picture, focus remains on 0.6991 key structural support. Sustained break there will argue that the whole up trend from 0.5506 might be finished at 0.8006, after rejection by 0.8135 long term resistance. Deeper decline would then be seen back to 61.8% retracement of 0.5506 to 0.8006 at 0.6461. Meanwhile, strong rebound from 0.6991 will retain medium term bullishness. That is, whole up trend from 0.5506 is still in progress for another rise through 0.8006 at a later stage.
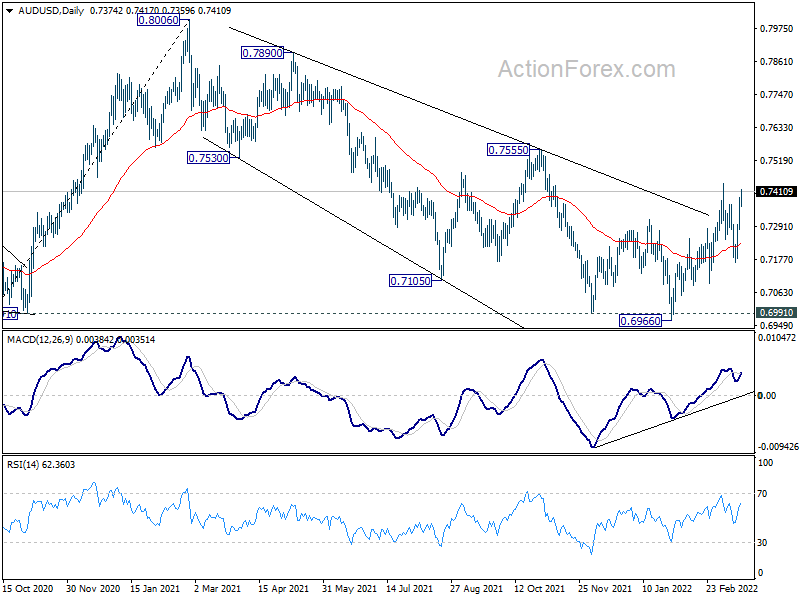
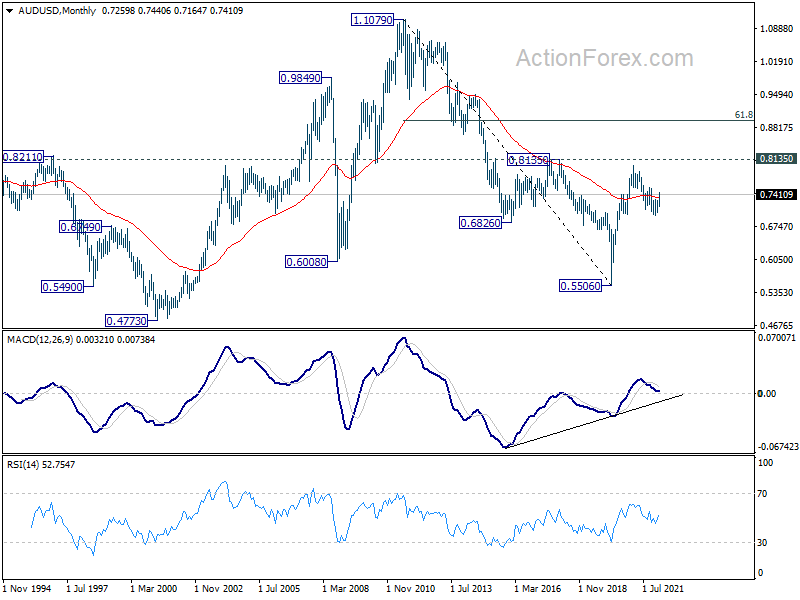
In the longer term picture, focus remains on 0.8135 structural resistance. Decisive break there will argue that rise from 0.5506 is developing into a long term up trend that reverses whole down trend from 1.1079 (2011 high). However, rejection by 0.8135 will keep long term outlook neutral at best.
USD/CAD Weekly Outlook
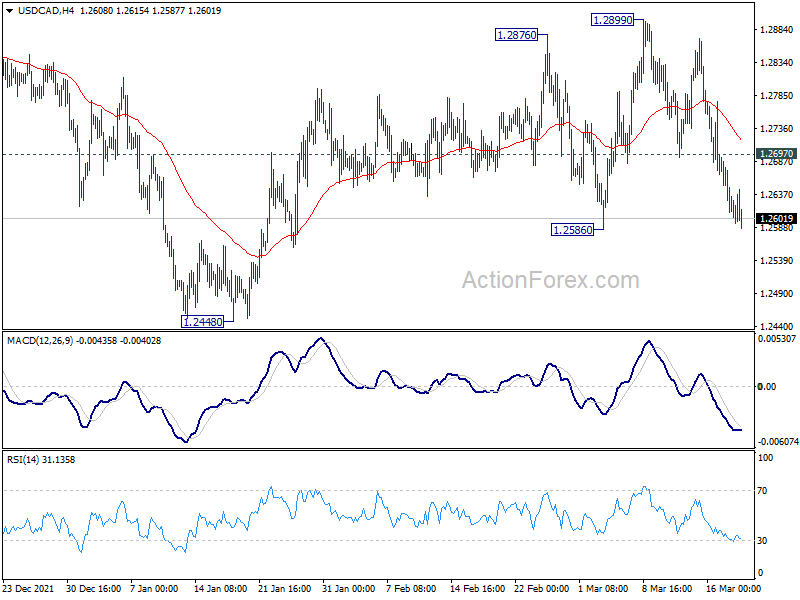
USD/CAD dropped sharply last week but stayed in range of 1.2586/2899. Initial bias is mildly on the downside this week with focus on 1.2586 support. Firm break there will argue that rebound from 1.2448 has completed at 1.2899. Deeper fall would be seen back to 1.2448 support first. On the upside, however, break of 1.2697 minor resistance will turn intraday bias neutral again.
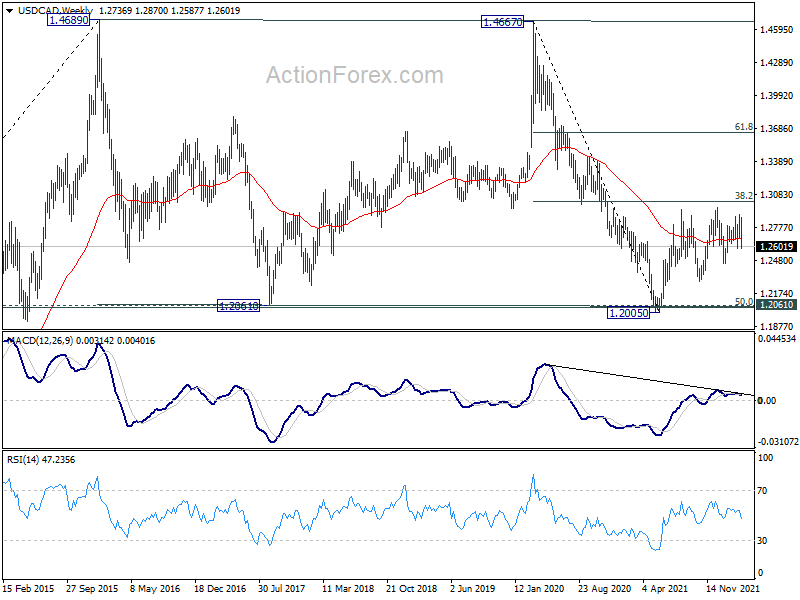
In the bigger picture, focus stays on 38.2% retracement of 1.4667 (2020 high) to 1.2005 (2021 low) at 1.3022. Sustained break there should confirm that the down trend from 1.4667 has completed after defending 1.2061 long term cluster support. Further rise would then be seen towards 61.8% retracement at 1.3650. However, rejection by 1.3022 will maintain medium term bearishness. Break of 1.2005 will resume the down trend from 1.4667 and that carries larger bearish implications too.
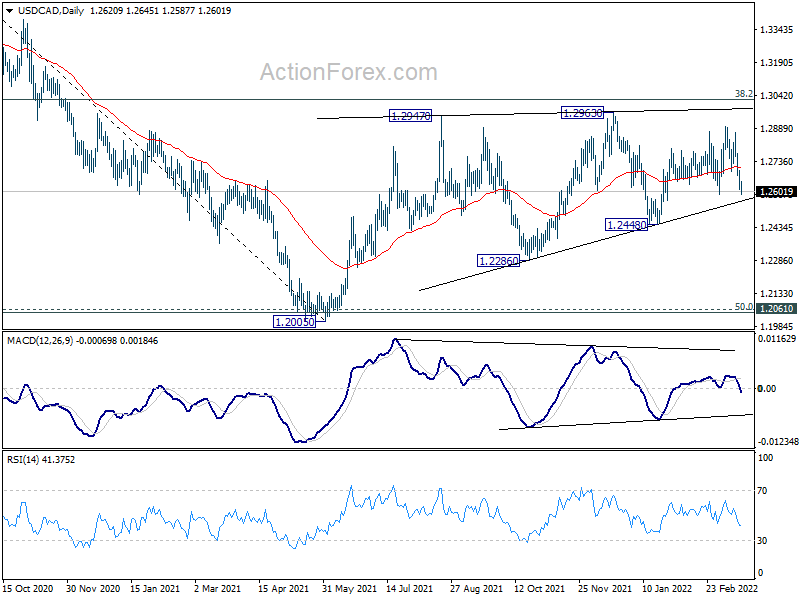
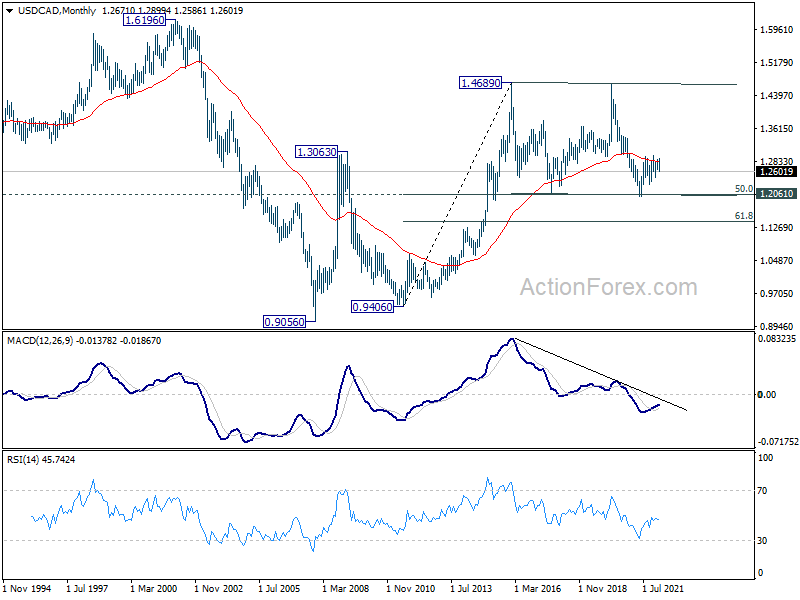
In the longer term picture, we're viewing price actions from 1.4689 as a consolidation pattern. Thus, up trend from 0.9506 (2007 low) is still expected to resume at a later stage. This will remain the favored case as long as 1.2061 support holds, which is close to 50% retracement of 0.9406 to 1.4689 at 1.2048. However, firm break of 1.2061 support will argue that USD/CAD has already started a long term down trend. Next target is 61.8% retracement of 0.9406 to 1.4689 at 1.1424.
GBP/JPY Weekly Outlook
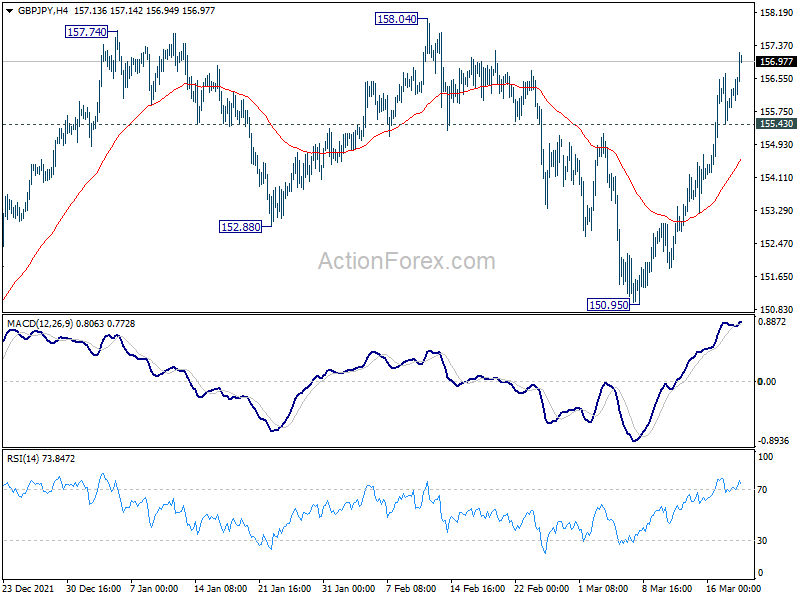
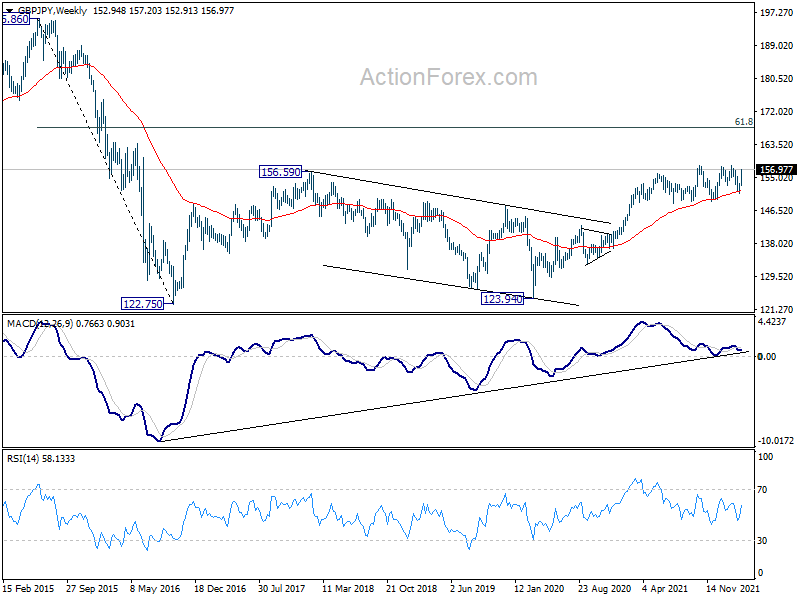
GBP/JPY's strong rebound from 150.95 accelerated further higher last week. The development suggests that corrective pattern from 158.19 has completed with three waves to 150.95 already. Initial bias remains on the upside this week for 158.04/19 resistance. Decisive break there will resume larger up trend. On the downside, below 155.43 minor support will delay the bullish case and turn intraday bias neutral first.
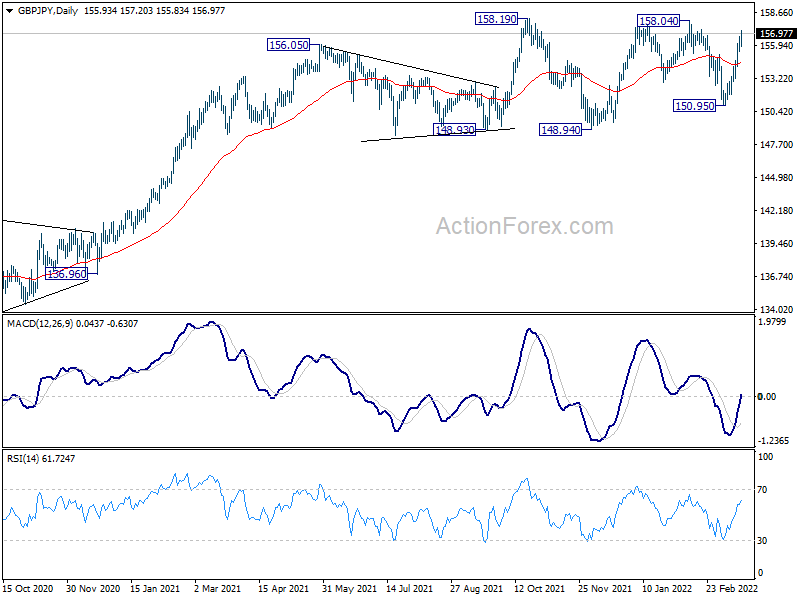
In the bigger picture, up trend from 123.94 (2020 low) should still be in progress, and notable support from 5 week EMA affirms medium term bullishness. Next target is 61.8% retracement of 195.86 to 122.75 at 167.93. This will now remain the favored case as long as 148.94 support holds.
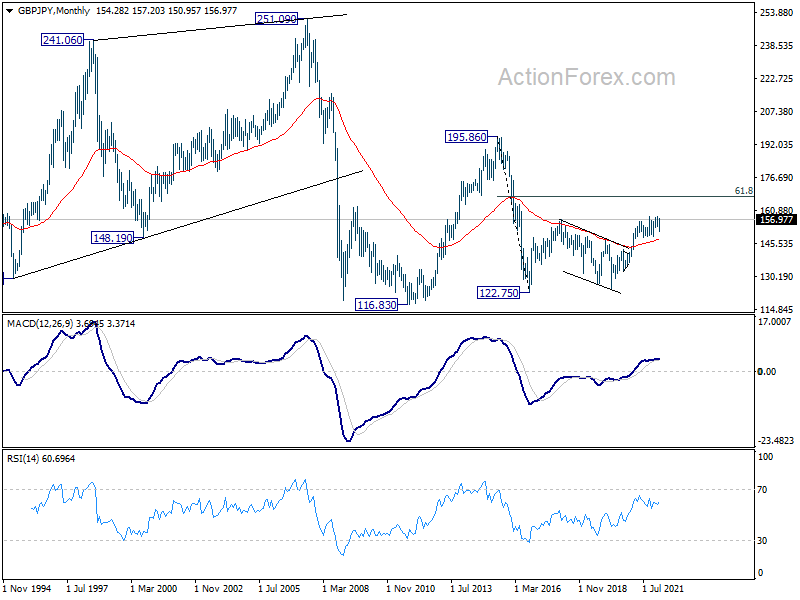
In the longer term picture, as long as 55 month EMA (now at 147.27) holds, we'd still favor more rally to 61.8% retracement of 195.86 to 122.75 at 167.93. But sustained trading below 55 month EMA will at least neutralize medium term bullishness and re-open the chance of revisiting 122.75 low (2016 low).
EUR/JPY Weekly Outlook
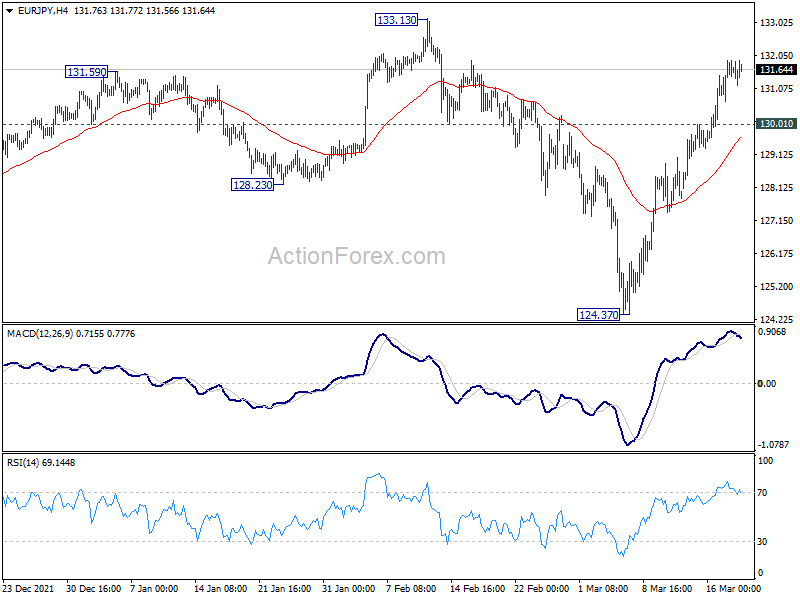
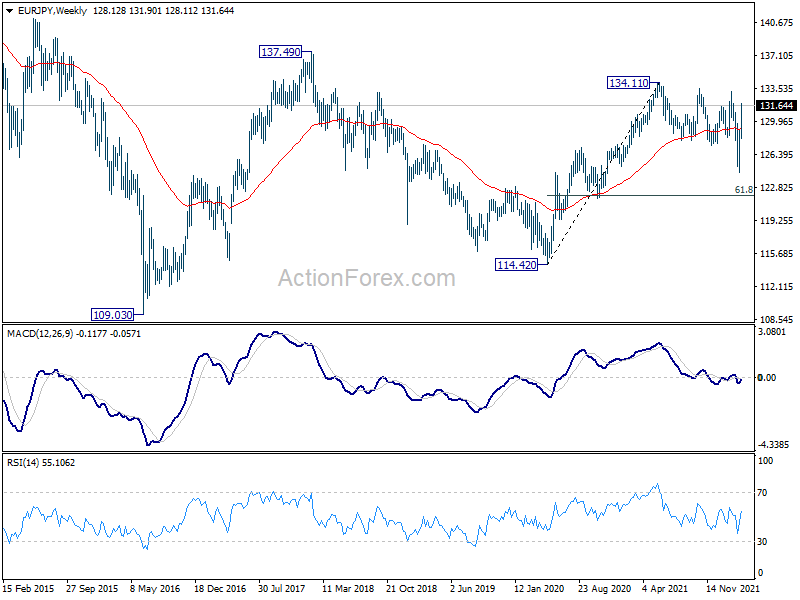
EUR/JPY's strong rebound from 124.37 accelerated further last week. The development argues that whole corrective pattern from 134.11 has completed already. Initial bias stays on the upside for retesting 133.13/134.11 resistance zone first. Decisive break there will resume larger up trend. However, break of 130.01 minor support will mix up the near term outlook and turn intraday bias neutral first.
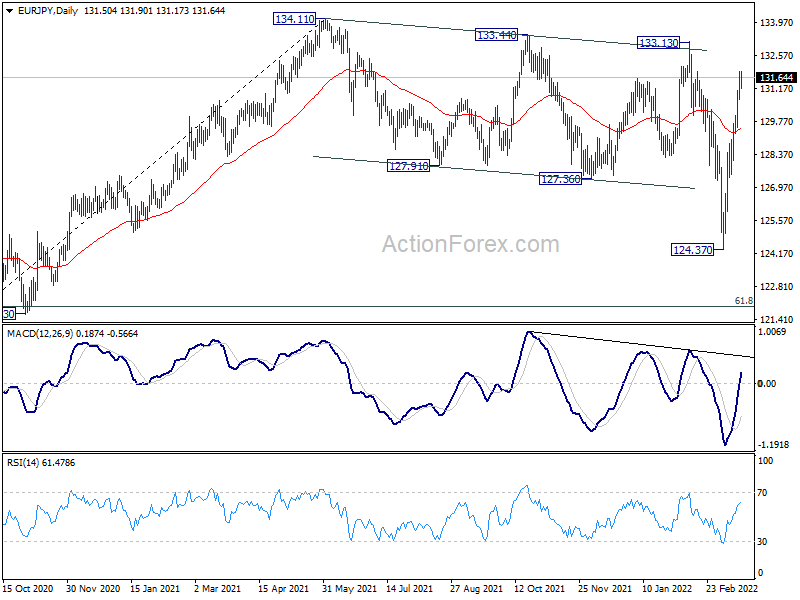
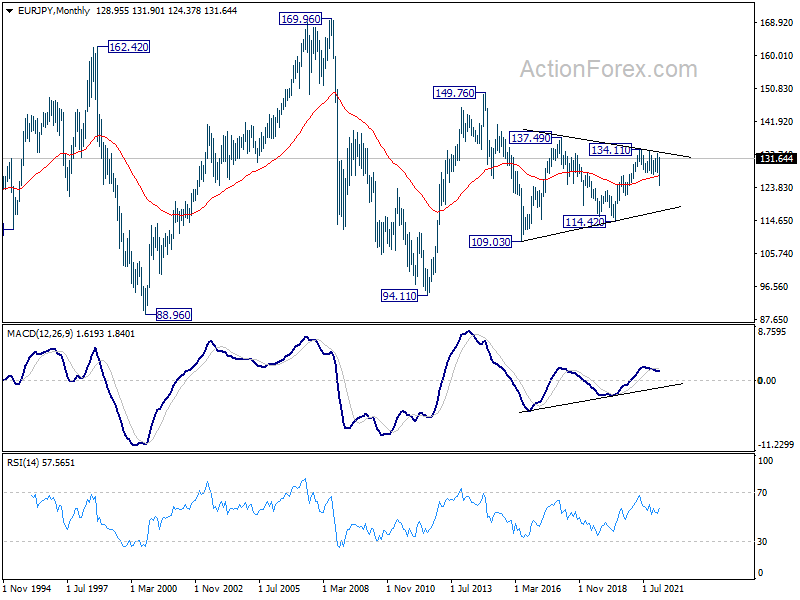
In the bigger picture, medium term outlook remains neutral for now. Price actions from 134.11 are so far still seen as a corrective pattern. That is, rise from 114.42 (2020 low) is in favor to resume at a later stage. But before that, the corrective pattern from 134.11 could still extend further, sideway or downward. In the latter case, break of 124.37 will target 61.8% retracement of 114.42 to 134.11 at 121.94.
In the long term picture, EUR/JPY is staying in long term sideway pattern, established since 2000. Long term outlook will remain neutral until breakout from the range of 109.03/137.49.
EUR/GBP Weekly Outlook
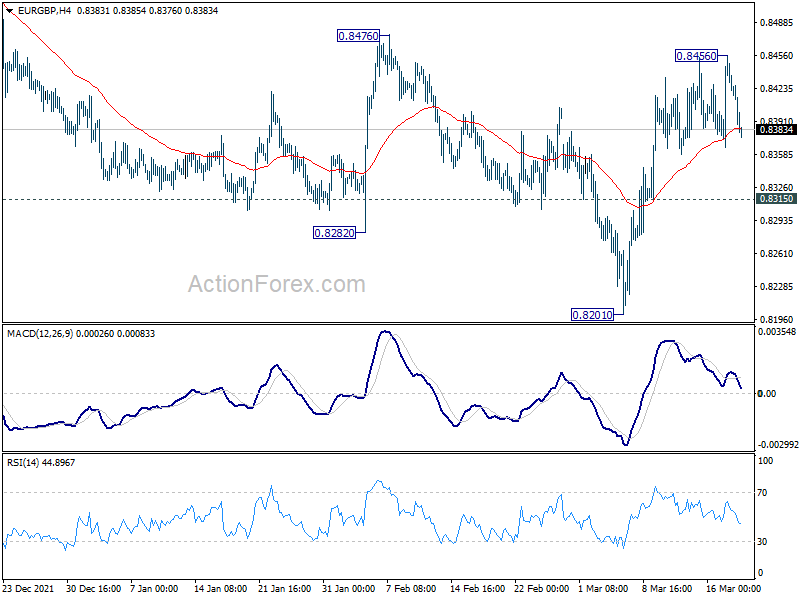
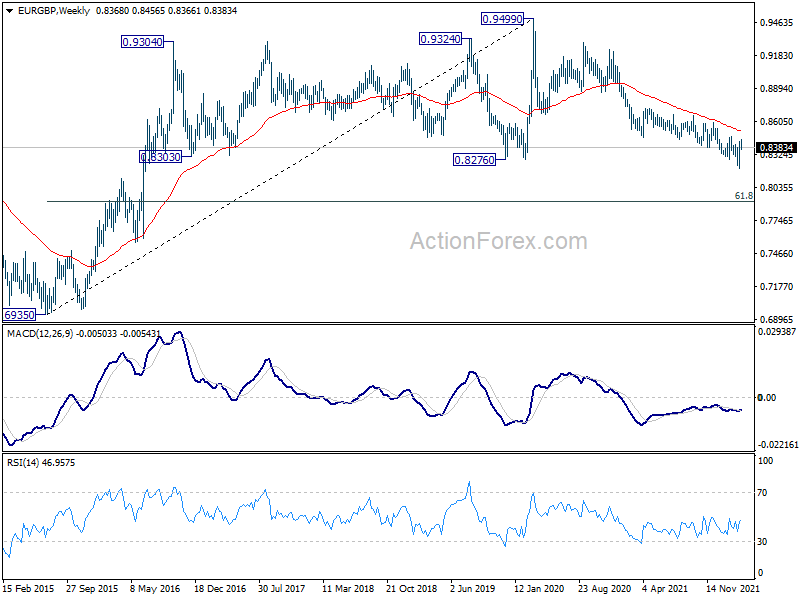
EUR/GBP edged higher last week but quickly retreated back into familiar range. Initial bias remains neutral this week first. On the upside, above 0.8456 will target 0.8476 structural resistance first. Firm break there will carry larger bullish implication and target 0.8598 resistance next. However, on the downside, break of 0.8315 minor support will retain near term bearishness, and bring retest of 0.8201 low.
In the bigger picture, the down trend from 0.9499 is expected to continue as long as 0.8476 resistance holds. Sustained trading below 0.8276 support will argue that the whole up trend from 0.6935 (2015 low) has reversed. Deeper fall should be seen to 61.8% retracement of 0.6935 to 0.9499 at 0.7917 next. However, firm break of 0.8476 will indicate medium term bottoming at least. Focus will be back on 55 week EMA (now at 0.8523) for more evidence of bullish reversal.
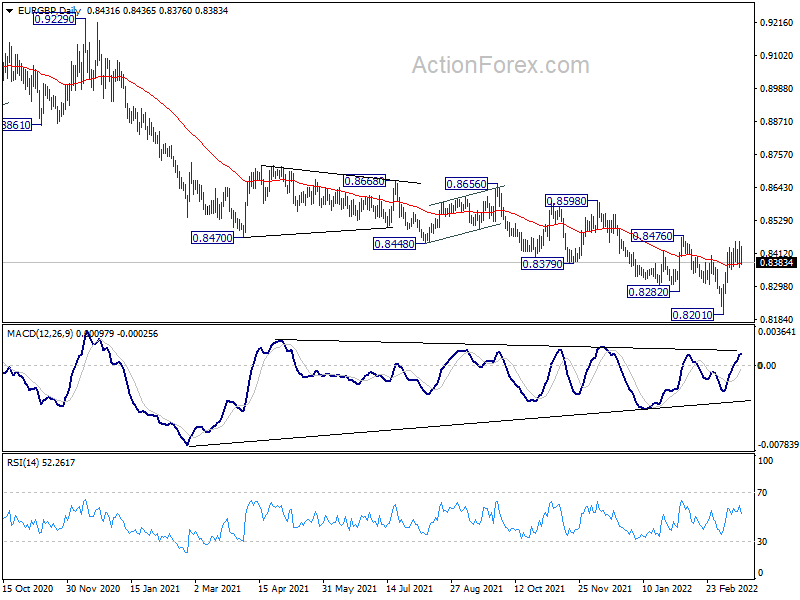
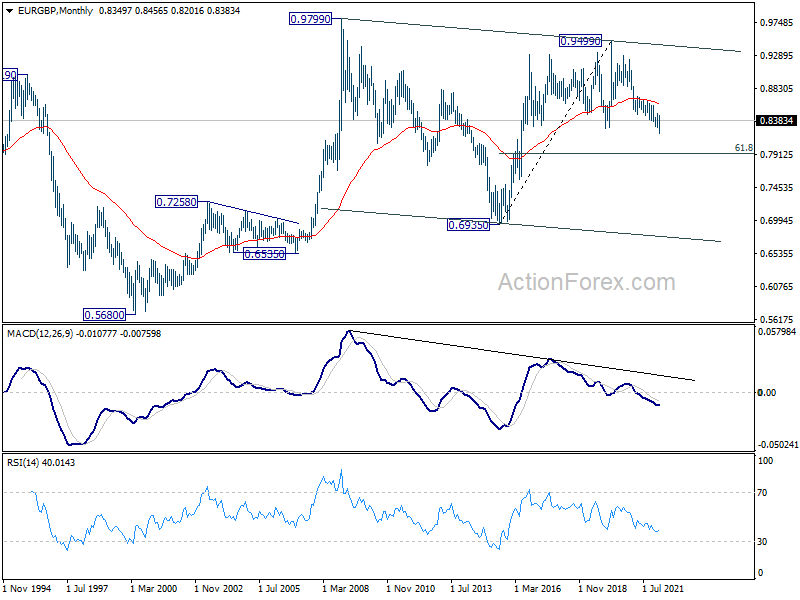
In the long term picture, current development argues that fall from 0.9499 is probably the third leg of the pattern from 0.9799 (2008 high). Sustained break of 61.8% retracement of 0.6935 to 0.9499 at 0.7917 will pave the way back to 0.6935 (2015 low) and probably below.
EUR/AUD Weekly Outlook
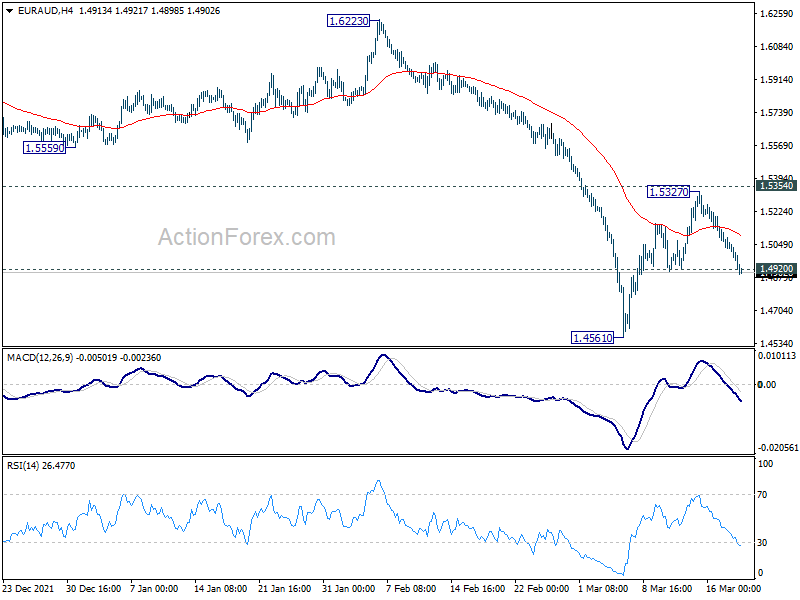
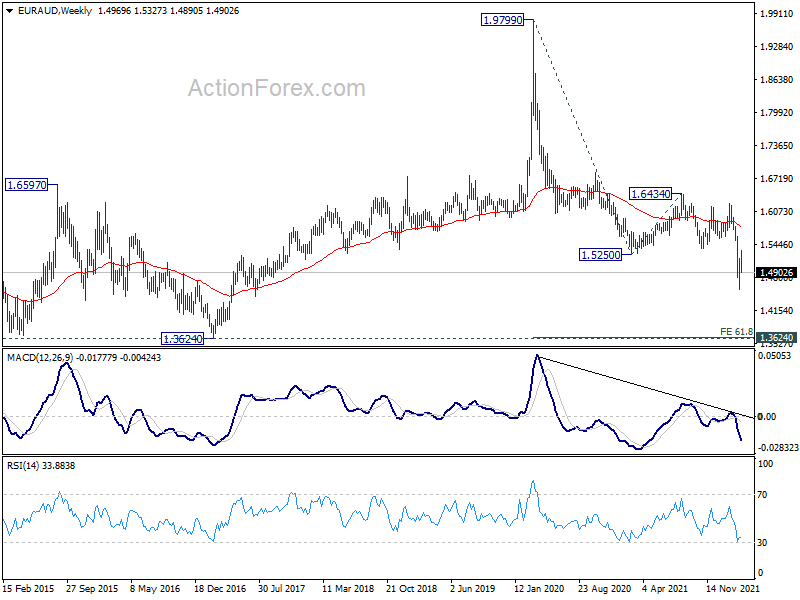
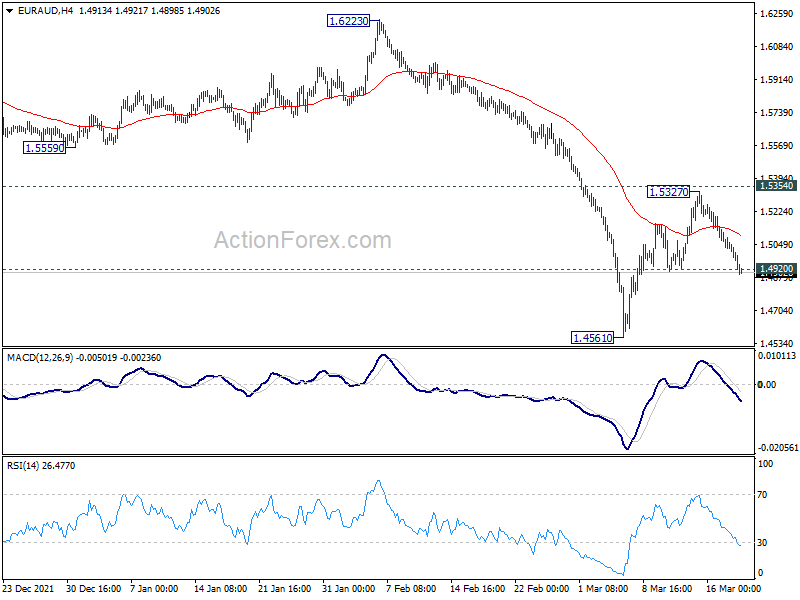
EUR/AUD rebounded to as high as 1.5327 last week but failed through break through 1.5354 support turned resistance. Break of 1.4920 minor support argues that the rebound is completed. Initial bias is now on the downside this week for retesting 1.4561 low first. Break there will resume larger down trend. In any case, outlook will remain bearish as long as 1.5354 holds.
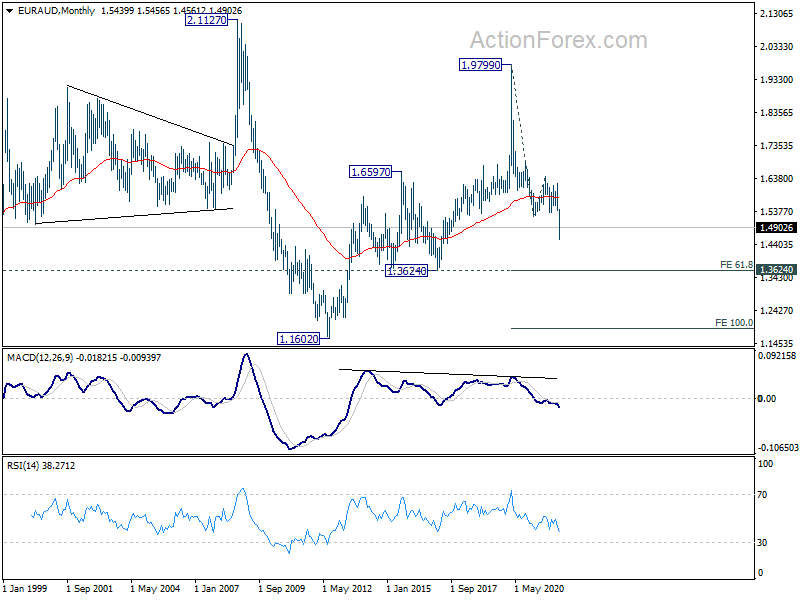
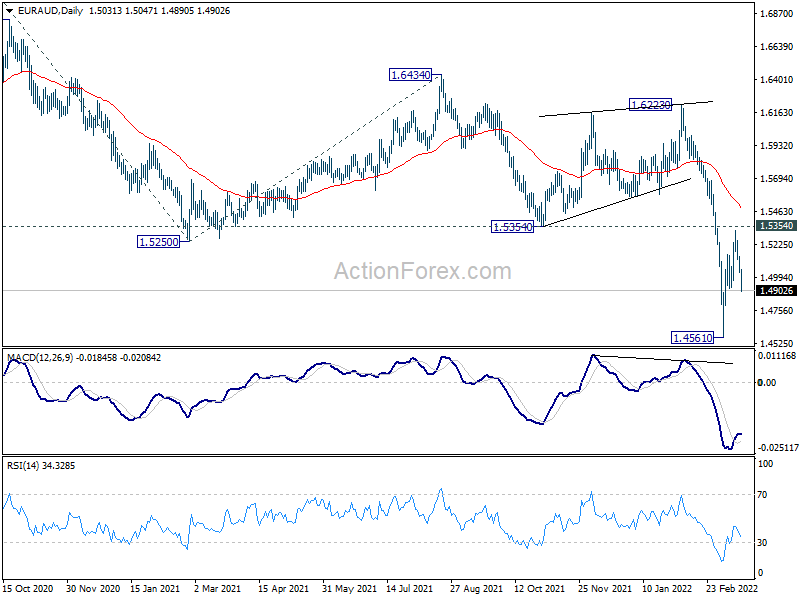
In the bigger picture, fall from 1.9799 is seen as a long term impulsive move. Next target is 61.8% projection of 1.9799 to 61.8% projection of 1.9799 to 1.5250 from 1.6434 at 1.3623, which is close to 1.3624 long term support (2017 low). Some support could be seen there to bring interim rebound. But overall, break of 1.5354 support turned resistance is needed to be the first sign of medium term bottoming. Otherwise, outlook will stay bearish in case of recovery.
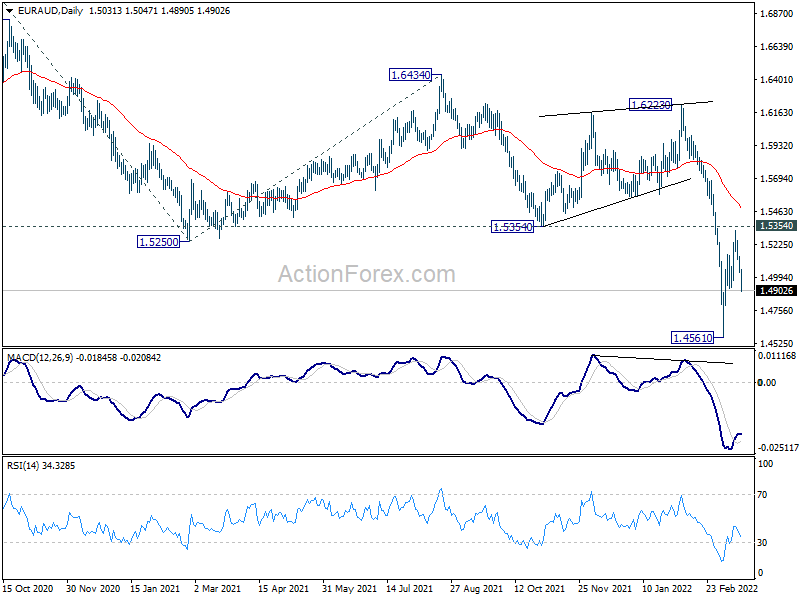
In the longer term picture, fall from 1.9799 (2020 high) is seen as the third leg of the pattern from 2.1127 (2008 high. Deeper fall should be seen to 1.3624 support. Decisive break there would pave the way back to 1.1602 (2012 low).
EUR/CHF Weekly Outlook
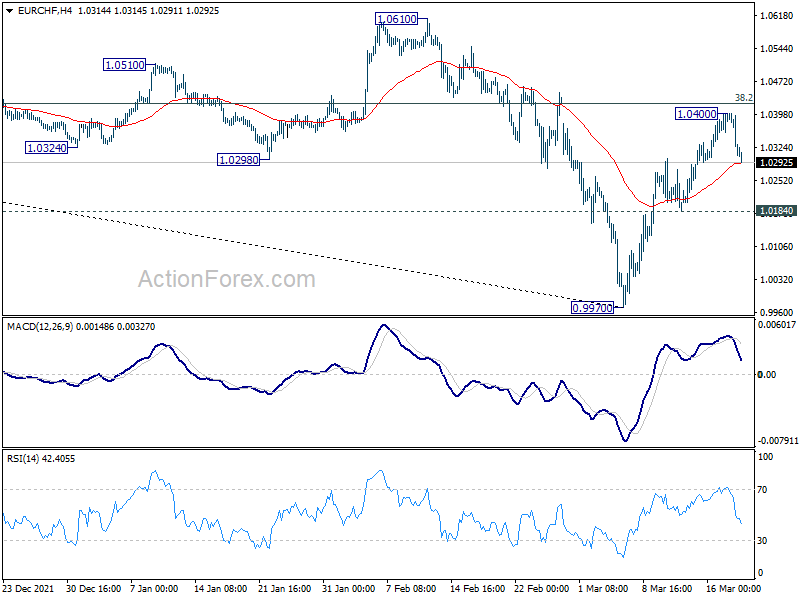
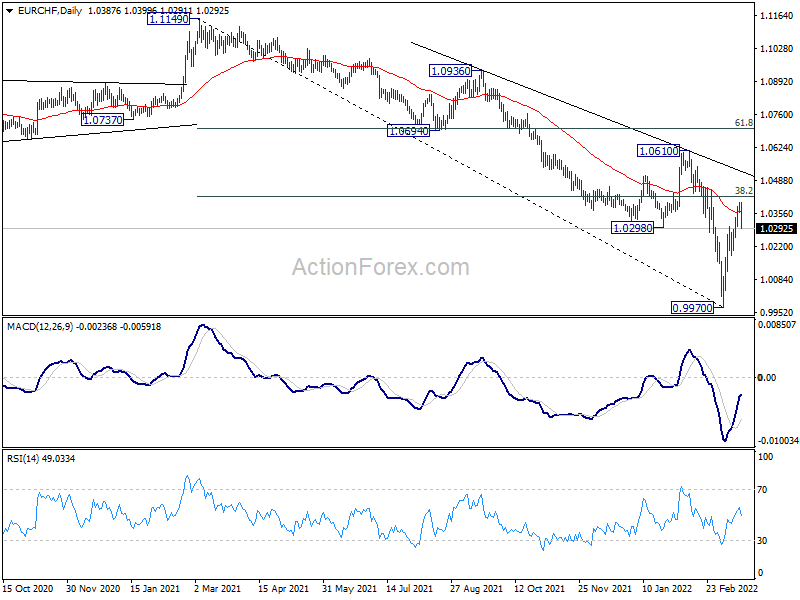
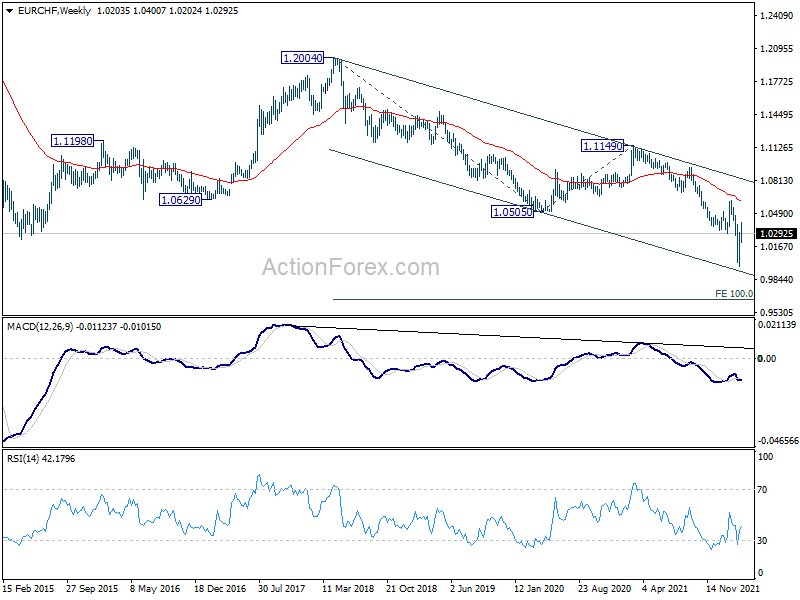
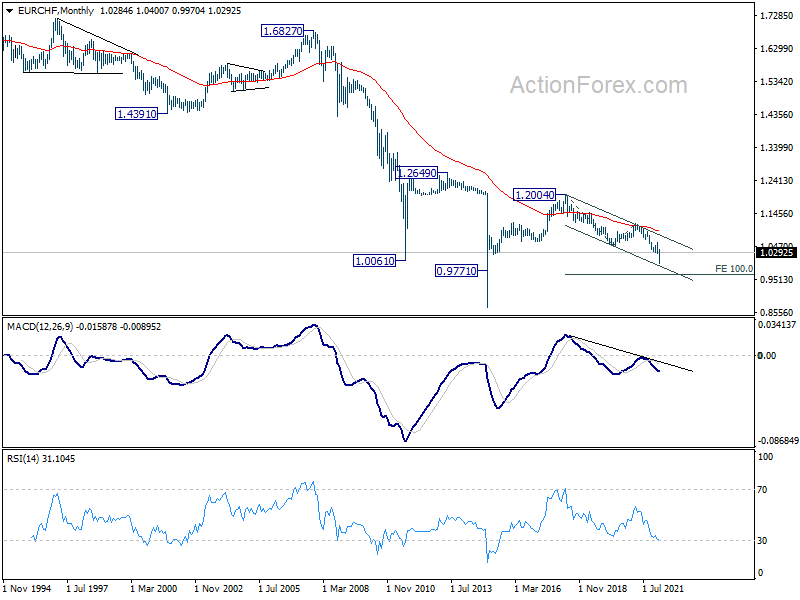
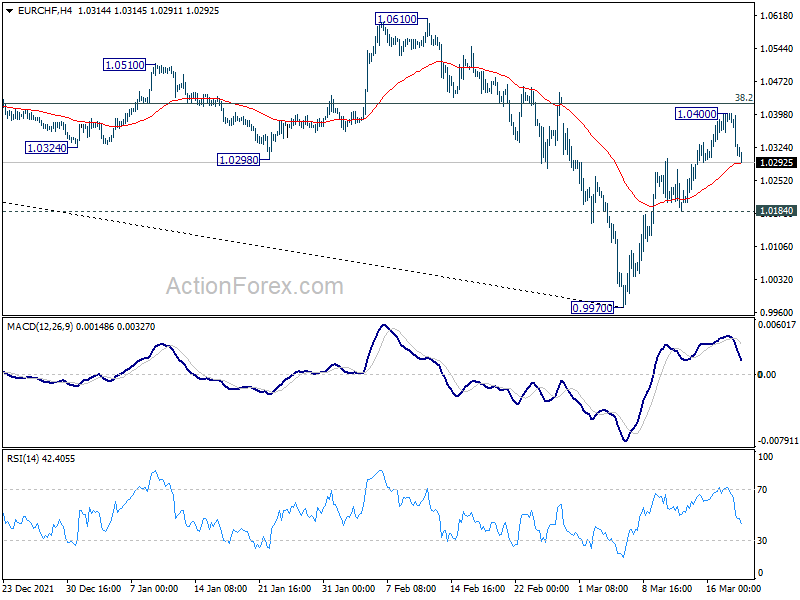
EUR/CHF rebounded further to as high as 1.0400 last week, but retreated ahead of 38.2% retracement of 1.1149 to 0.9970 at 1.0420. Initial bias is turned neutral this week first. On the upside, break of 1.0400 would resume the rebound to 1.0610 key structural resistance. However, break of 1.0184 minor support will argue that the rebound is finished, and bring retest of 0.9970 low.
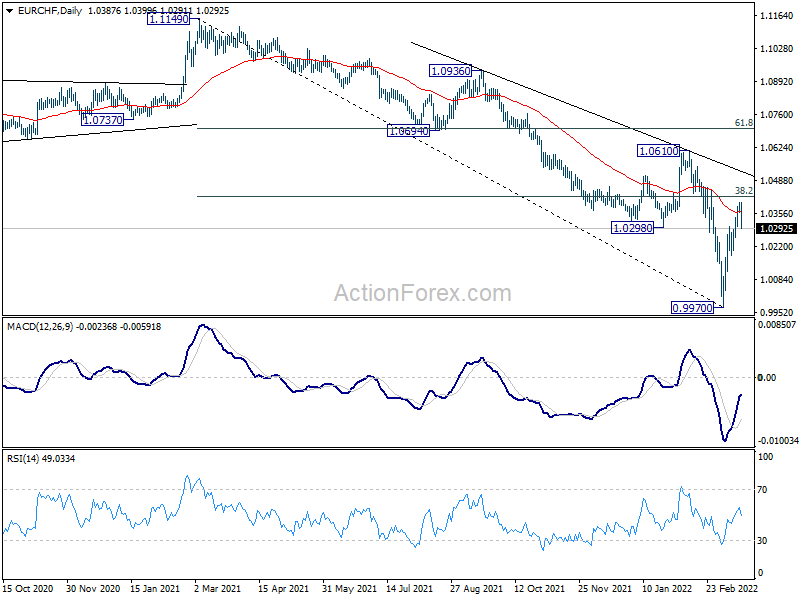
In the bigger picture, long term down trend from 1.2004 (2018 high) is still in progress. Next target is 100% projection of 1.2004 to 1.0505 to 1.1149 at 0.9650. In any case, sustained break of 1.0505 support turned resistance is needed to be the first sign of medium term bottoming. Otherwise, outlook will remain bearish.
In the long term picture, capped below 55 month EMA, EUR/CHF is seen as extending the multi-decade down trend. There is no prospect of a bullish reversal until some sustained trading above the 55 month EMA (now at 1.0909).
Yen Extended Down Trend on Rise in Yields and Rebound in Stocks
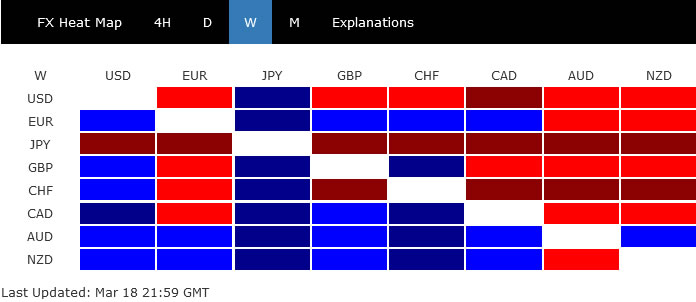
Yen's down trend continued last week and even accelerated against commodity currencies. Persistent rally in benchmark yields, rebound in stocks, and diverging central bank expectations are expected to weigh on Yen further. Meanwhile, expected rate hike by Fed and BoE didn't provide much support to Dollar and Sterling, as both closed among the weakest.
On the other hand Aussie and Kiwi ended as the best performer. Euro followed as third, but there was also sign of turning around towards the end of the week. The development in the coming days might decide whether Euro's rebound has completed and selloff is returning.
Fed started tightening, S&P 500 completed correction
Fed finally started the tightening cycle by delivering a 25bps rate hike to 0.25-0.50% last week. It also indicated that quantitative tightening will start "at a coming meeting". Fed Governor Christopher Waller later said that he actually preferred 50bps, but voted for 25bps hike only because of geopolitical events. That's probably the view of the majority in the FOMC. But then, by not "front-loading" the hikes now, Fed might risk being forced to doing it more aggressive later. The dot plot currently suggests a peak of 2.80% in federal funds rate next week, but that is clearly subject to revision based on upcoming developments.
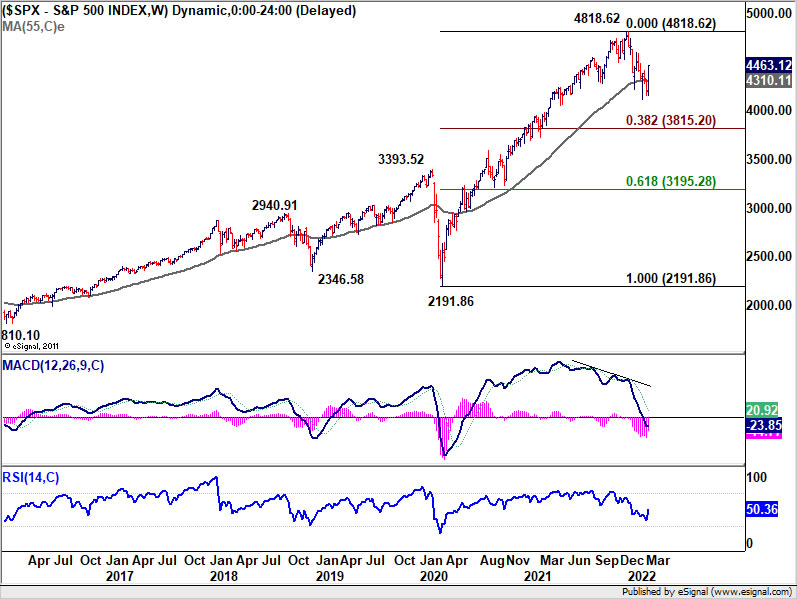
Anyway, stocks responded well last week. S&P 500's rebounded strongly last week and broke 4416.78 near term resistance. Corresponding levels in DOW (34179.07) and NASDAQ (13837.58) were also taken out. The development suggests that SPX's correction correction from 4818.62 has completed with three waves down to 4114.65 already. Further rise should seen to 4595.31 resistance next. Firm break there will pave the way to retest 4818.62 high.
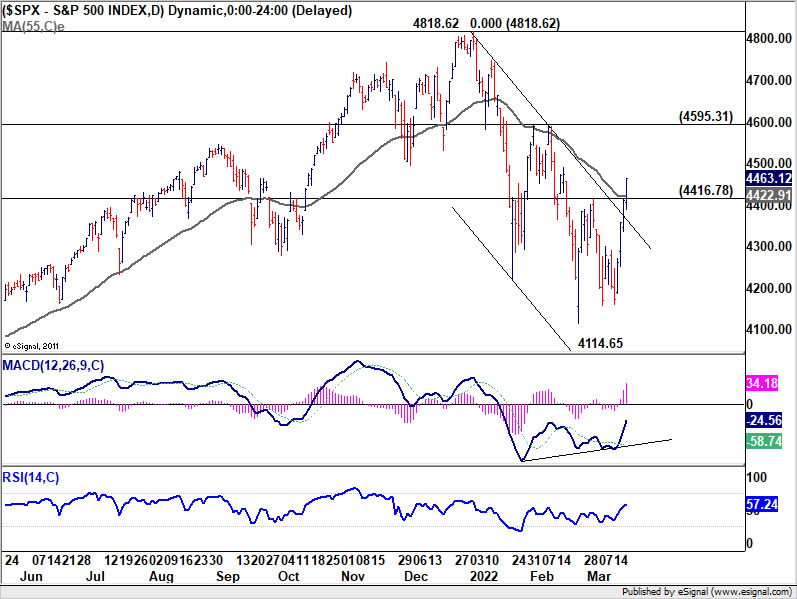
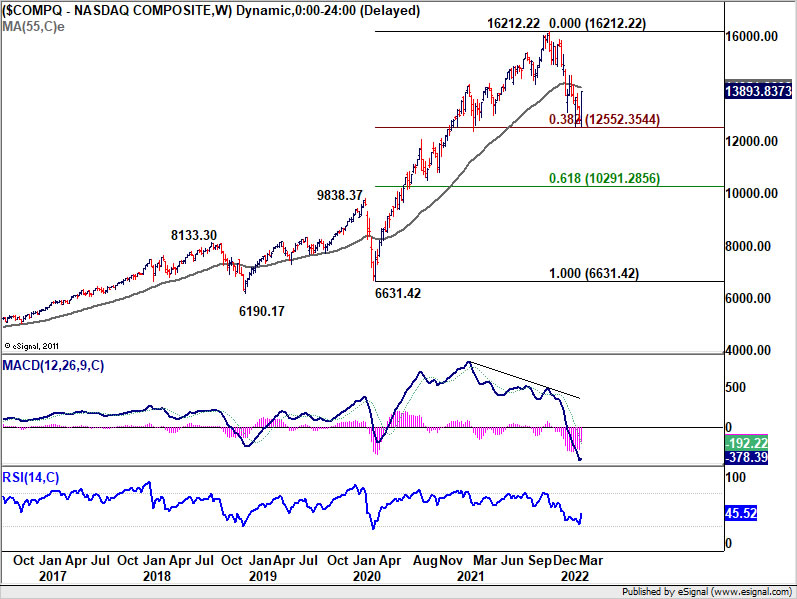
It's too early to say that long term up trend in SPX is ready to resume. The index could still extend the corrective pattern from 4818.62 with another falling leg towards 38.2% retracement of 2191.86 to 4818.62 at 3815.20. However, NASDAQ has already did that by testing corresponding level of 38.2% retracement of 6631.42 to 16212.22 at 12552.35 already. Hence, SPX's correcting could turn out to be shorter and shallower than envisaged.
10-year yield hit 2.246, pressing key resistance zone
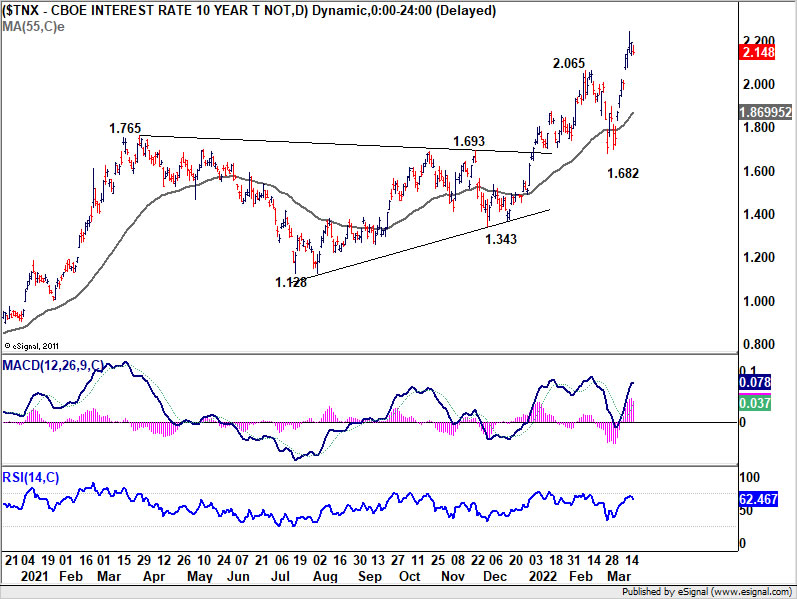
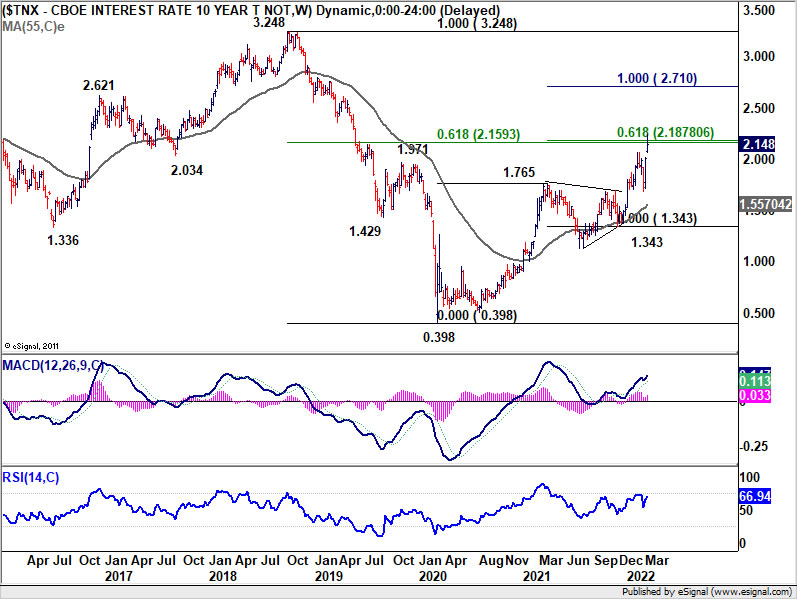
10-year yield surged through 2.065 high to resume the long term up trend last week, hitting as high as 2.246. It's still unsure if TNX would eventually be rejected by key cluster resistance level at 2.159/2.187 (61.8% retracement of 3.248 to 0.398 at 2.159, 61.8% projection of 0.398 to 1.765 to 1.343 at 2.187).
But in any case, break of prior week's high at 2.021 is needed to be the first sign of short term topping. Otherwise, further rally is still in favor. Sustained trading above 2.159.87 will pave the way to 100% projection at 2.710, which would be a rather significant development.
AUD/JPY and CHF/JPY resumed long term up trend
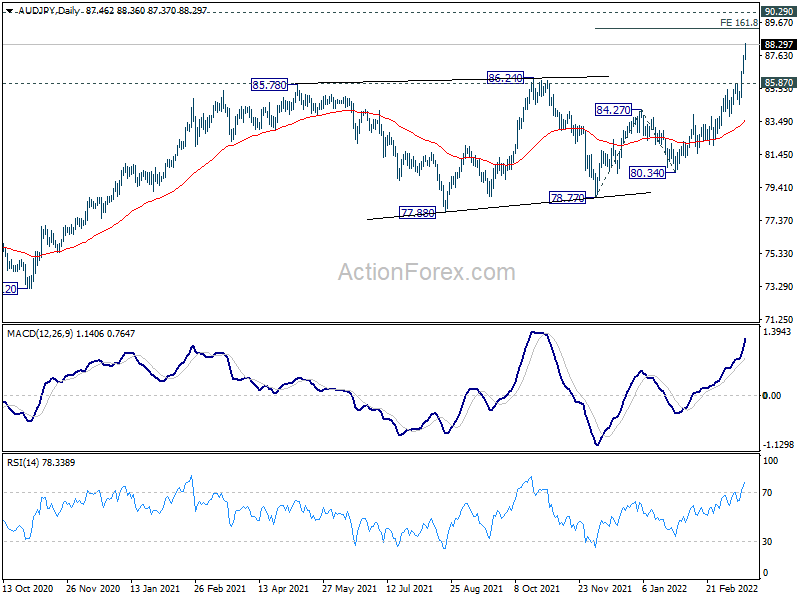
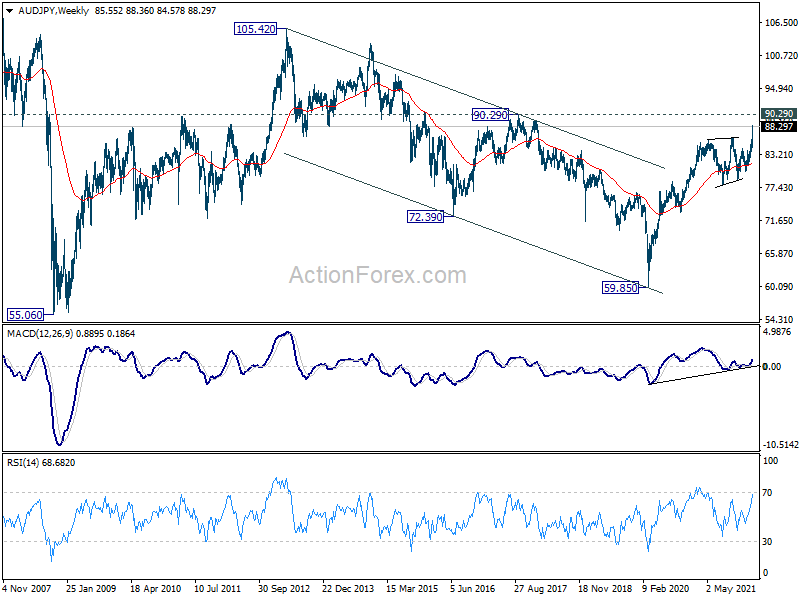
Yen ended as the worst performer on a combined factor of central bank divergence, rising global benchmark yields, and return of risk appetite. AUD/JPY was the top mover last week, gaining 3.12%. The strong break of 86.24 high confirms long term up trend resumption. Outlook will stay bullish as long as 85.87 resistance turned support holds. Next near term target is 161.8% projection of 78.77 to 84.27 from 80.34 at 89.23, which is close to 90.29 long term resistance.
It should also be noted that the whole down trend from 105.42 (2013 high) has completed with three waves down to 59.85. The support from 55 week EMA was a medium term bullish sign, and argues that AUD/JPY is reversing the whole down trend from 105.42. Sustained break of 90.29 would confirm this case and target 105.42 again.
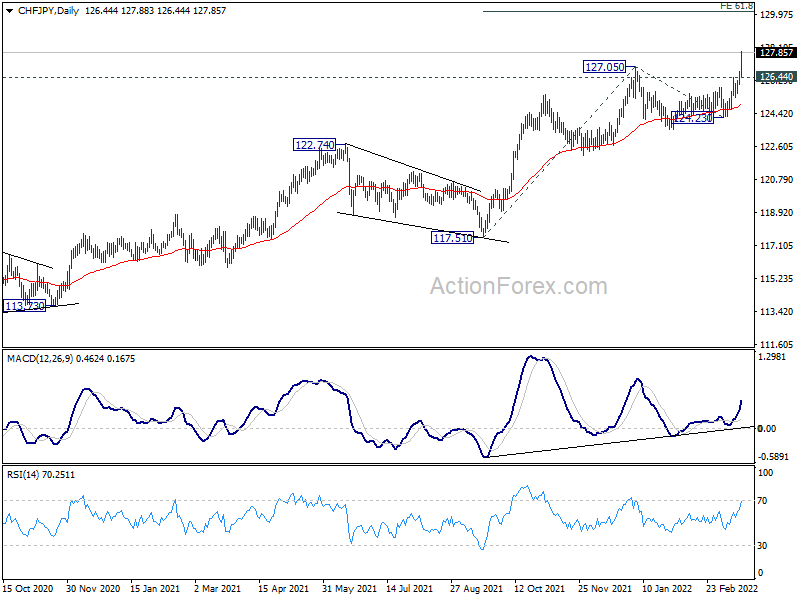
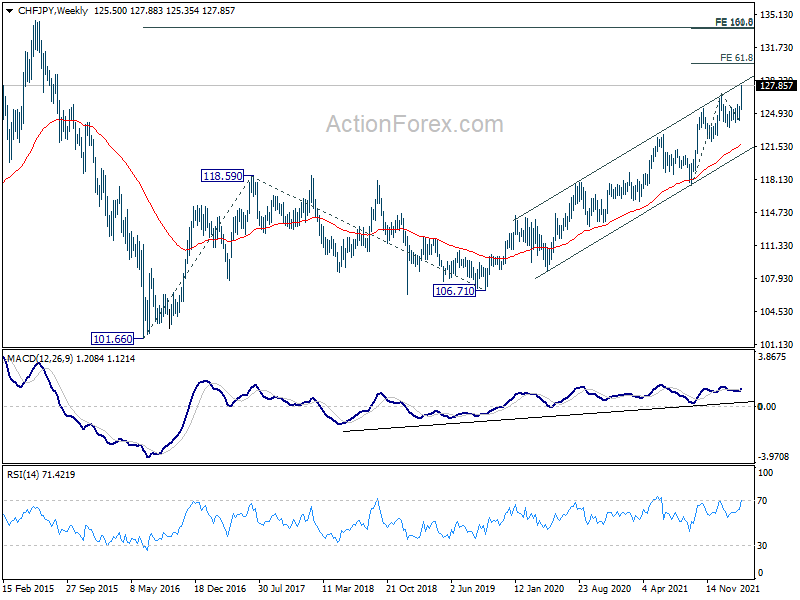
CHF/JPY also broke through 127.05 resistance last week to resume long term up trend from 106.71. The multiple support from 55 day EMA is a medium term bullish sign. Outlook will now stay bullish as long as 126.44 minor support holds. Current rally should now target 61.8% projection of 117.51 to 127.05 from 124.23 at 130.12 next.
More importantly, the next rise could come with a break of long term channel resistance, which signals upside acceleration. Further break of 130.12 would solidify this acceleration. CHF/JPY could then target cluster projection level of 100% projection of 117.51 to 127.05 from 124.23 at 133.77, and 161.8% projection of 101.66 to 118.59 from 106.71 at 134.10.
EUR/AUD finished rebound, EUR/CHF to follow lower?
Euro spent most of the week attempting to extend the near term rebound. But its effort has somewhat faltered towards the end, except versus Yen. EUR/AUD's break of 1.4920 support on Friday argues that the rebound from 1.4561 has completed at 1.5327 already. The rejection by 1.5453 support turned resistance keeps near term outlook bearish. Retest of 1.4561 low should be seen next. Break there will resume long term down trend from 1.9799.
At same time, attention will be paid to development in EUR/CHF to confirm if selloff is back on Euro. The cross faced initial rejection by 38.2% retracement of 1.1149 to 0.9970 at 1.0420 and dropped notably to close the week. At this point, further rally could still be seen as long as 1.0184 support holds.
However, deeper decline this week, followed by break of 1.0184 support, should confirm that rebound from 0.9970 has finished. If happens, the development will keep medium term outlook bearish in EUR/CHF and bring retest of 0.9970 low first, even though there might still be another rebound before down trend finally resumes. Anyway, break of 1.0184 in EUR/CHF would be a sign of return to weakness in Euro in general.
USD/JPY Weekly Outlook
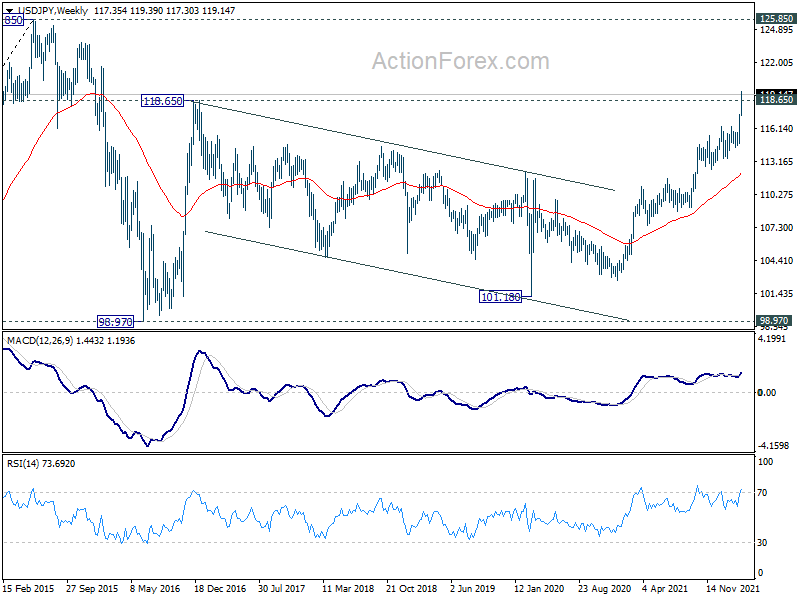
USD/JPY's up trend accelerated further to as high as 119.39 last week. Initial bias remains on the upside this week. Next target is 100% projection of 109.11 to 116.34 from 114.40 at 121.63 next. On the downside, below 118.35 will turn intraday bias neutral again and bring retreat. But downside should be contained above 116.34 resistance turned support to bring another rally.
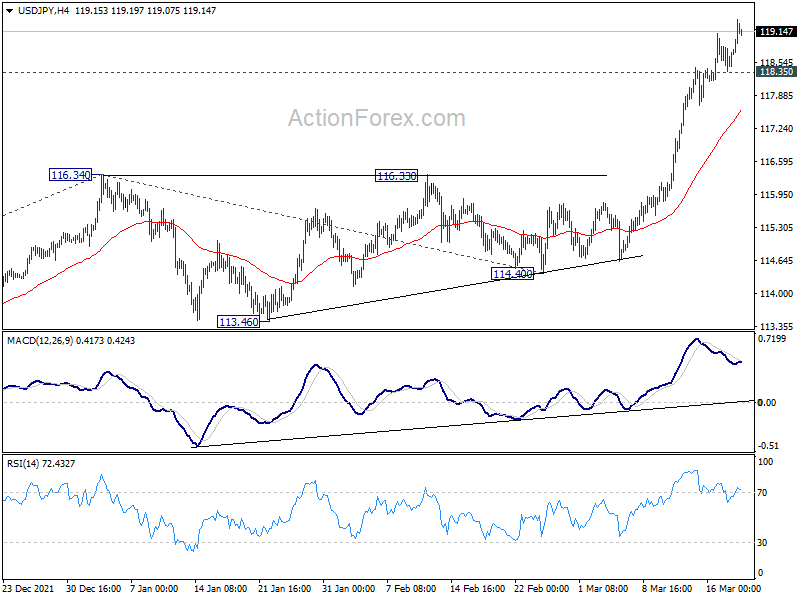
In the bigger picture, the break of 118.65 resistance (2016 high) suggest that up trend from 98.97 (2016 low) is resuming, with rise from 101.18 (2020 low) as the third leg. Medium term outlook will remain bullish as long as 113.46 low. Sustained trading above 118.65 will pave the way to 125.85 (2015 high).
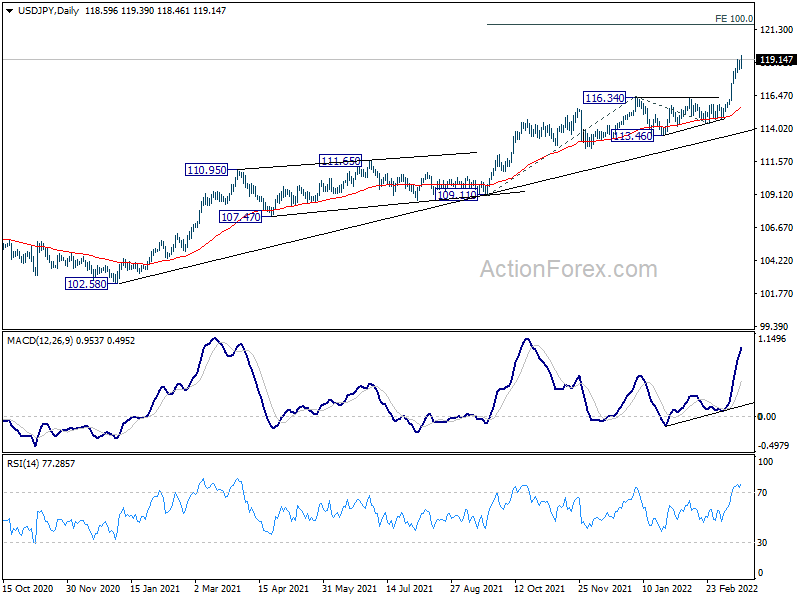
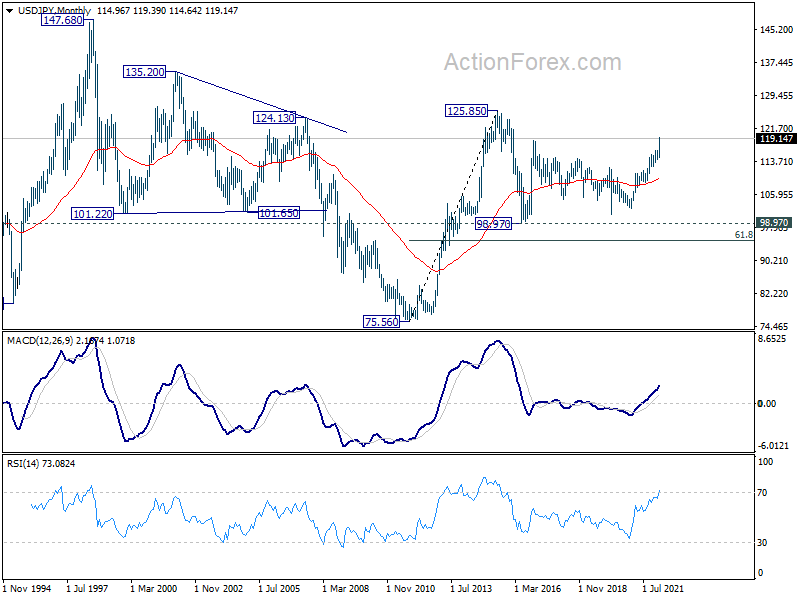
In the long term picture, the rise from 75.56 (2011 low) long term bottom to 125.85 (2015 high) is viewed as an impulsive move, no change in this view. Price actions from 125.85 are seen as a corrective pattern which could still extend. However, firm break of 128.85 will resume the up trend form 75.56 towards 135.20 long term resistance next.