Sample Category Title
USD/CHF Daily Outlook
Daily Pivots: (S1) 0.9269; (P) 0.9289; (R1) 0.9323; More....
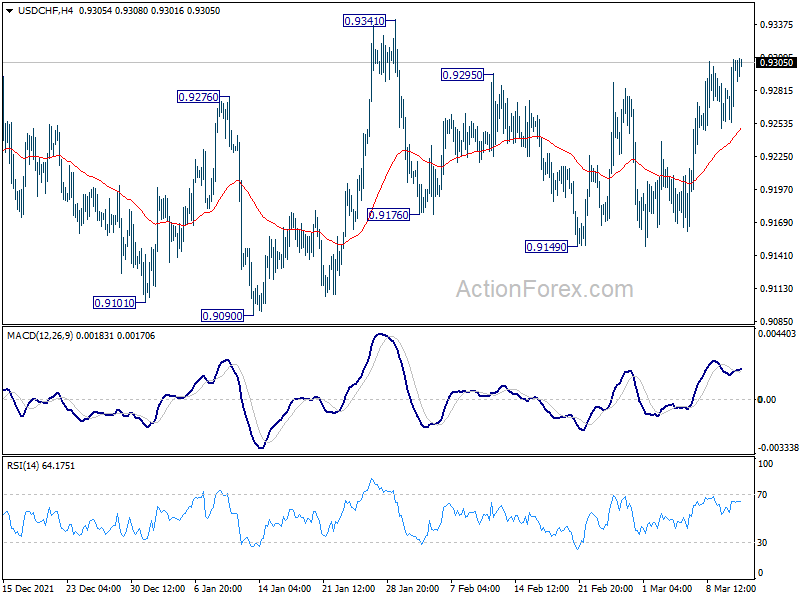
Range trading continues in USD/CHF and intraday bias remains neutral for the moment. Choppy rise from 0.8925 would still be in favor to extend higher as long as 0.9090 support holds. Break of 0.9341 will target 0.9372 resistance and then 0.9471. On the downside, however, break of 0.9090 will bring deeper fall back to 0.8925 support.
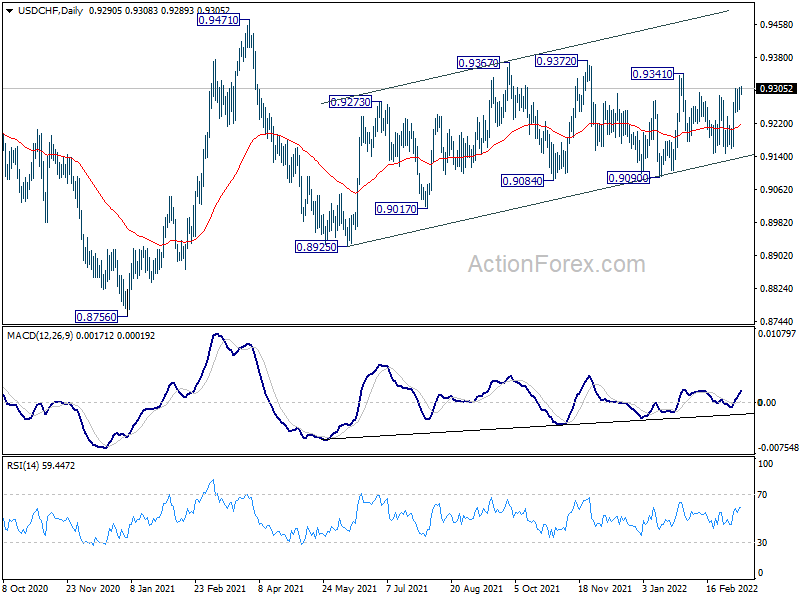
In the bigger picture, medium term outlook will be neutral at best as long as 0.9471 resistance holds. Larger down trend could still extend through 0.8756 (2021 low). However, firm break of 0.9471 will argue that the trend has already reversed and rebound the rally from 0.8756 with another impulsive move.
USD/JPY Daily Outlook
Daily Pivots: (S1) 115.91; (P) 116.05; (R1) 116.29; More...
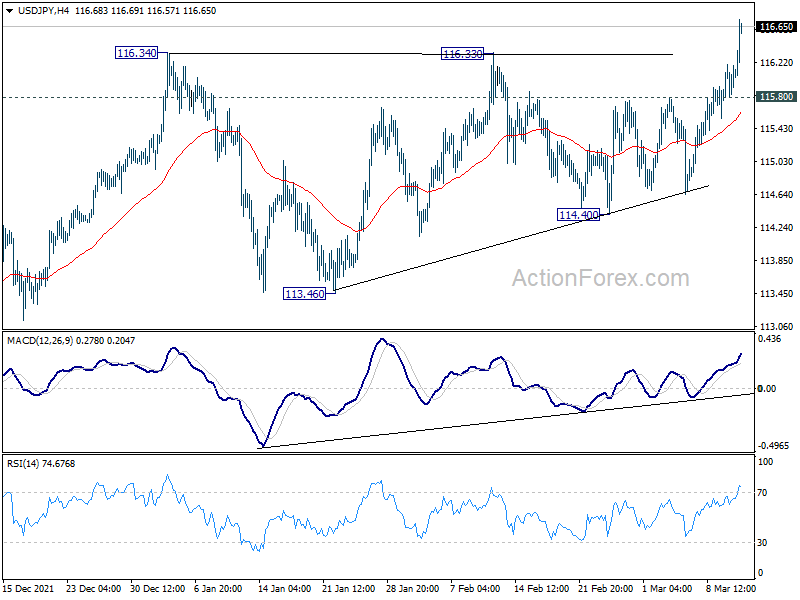
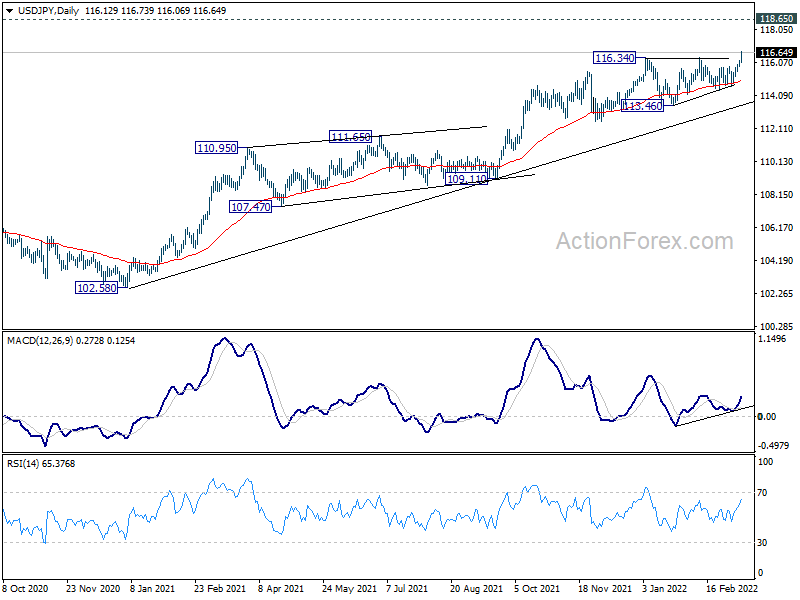
USD/JPY's break of 116.34 resistance confirms up trend resumption. Intraday bias is back on the upside. Current rally should now target next long term resistance at 118.65. On the downside, below 115.80 minor support will turn intraday bias neutral first. But outlook will remain bullish as long as 114.40 support holds, in case of retreat.
In the bigger picture, no change in the view that rise from 102.58 is the third leg of the up trend from 101.18 (2020 low). Such rally should target a test on 118.65 (2016 high). Sustained break there will pave the way to 120.85 (2015 high) and raise the chance of long term up trend resumption. This will remain the favored case as long as 55 week EMA (now at 111.75) holds.
Yen Under Pressure on Rate Outlook and Rising Yield, USD/JPY Breakout
Yen is under some broad based pressure in Asia session despite some mild risk aversion sentiment. BoJ is clear to lag behind other major central bank in raising interest rates, due to the still underperforming inflation. Rally in global treasury yields is also weighing on the Japanese currency. Euro is maintaining this week's recovery, but is apparently struggling to extend rebound as Russia invasion of Ukraine drags on. Dollar is firm and the upside breakout against Yen is a positive sign.
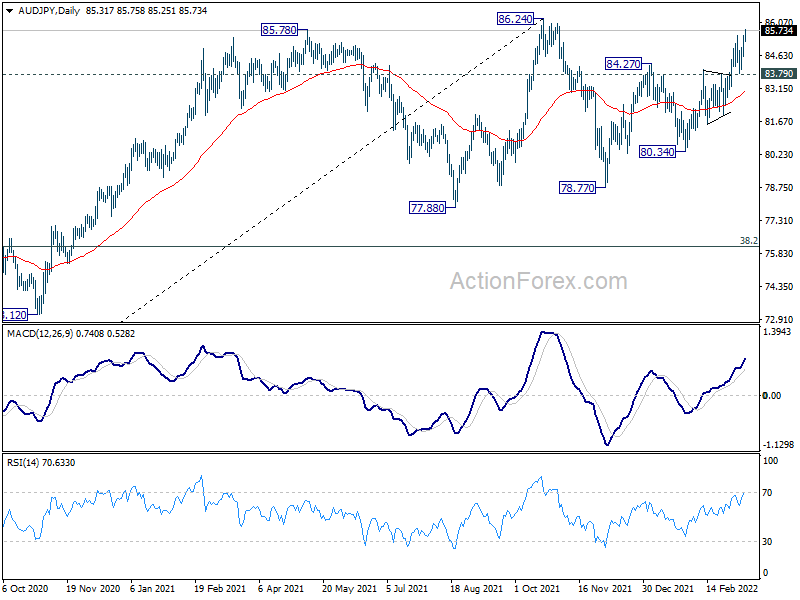
Technically, USD/JPY finally breaks through 116.34 resistance to resume medium term up trend. Next target is long term resistance level at 118.65. At the same time, AUD/JPY is also marching towards 86.24 high. Firm break there will resume medium term up trend too and would add to the case of more broad based Yen selloff. Though, break of 83.79 support will suggest rejection by 86.24 and bring near term reversal.
In Asia, Nikkei closed down -2.05%. Hong Kong HSI is down -1.69%. China Shanghai SSE is down -0.22%. Singapore Strait Times is up 0.22%. Japan 10-year JGB yield is down -0.0078. Overnight, DOW dropped -0.34%. S&P 500 dropped -0.43%. NASDAQ dropped -0.95%. 10-year yield rose 0.063 to 2.011 (but it's retreating in Asia).
IMF Georgieva: Global growth forecast to be downgraded, but remains in positive territory
IMF Managing Director Kristalina Georgieva told CNBC yesterday, "we think that we would be downgrading our growth projections as a result of the crisis (in Ukraine), but we still expect the world to be in positive growth territory."
In the January outlook IMF projected global growth of 4.4% in 2022. For now, it's unsure how the global economy would be affected by Russia invasion on Ukraine. "Obviously, how long this war goes is the main uncertainty factor we face," Georgieva said.
Separately, Georgieva also said, sanctions on Russia for its invasion of Ukraine would cause an abrupt contraction of the Russian economy. Russia is facing a "deep recession" this year, and sovereign debt default is no longer seen as "improbable".
RBA Lowe: It's prudent to plan for an interest rate increase
RBA Governor Philip Lowe said it's "plausible" for interest to be lifted from the current 0.1% this year. "It would be prudent to plan for an increase," he added. "For many borrowers that's going to come as quite an unwelcome development, although I know from the letters that I get every day when I turn up at work that many depositors have a different view,"
Meanwhile, he said "I don't feel mounting pressure," on raising rates. "We do what we think is the right thing at each of our meetings, so the pressure, it's great for media stories, but I don't feel that myself."
New Zealand BNZ manufacturing rose to 53.6, next result may see fallout from Russia/Ukraine conflict
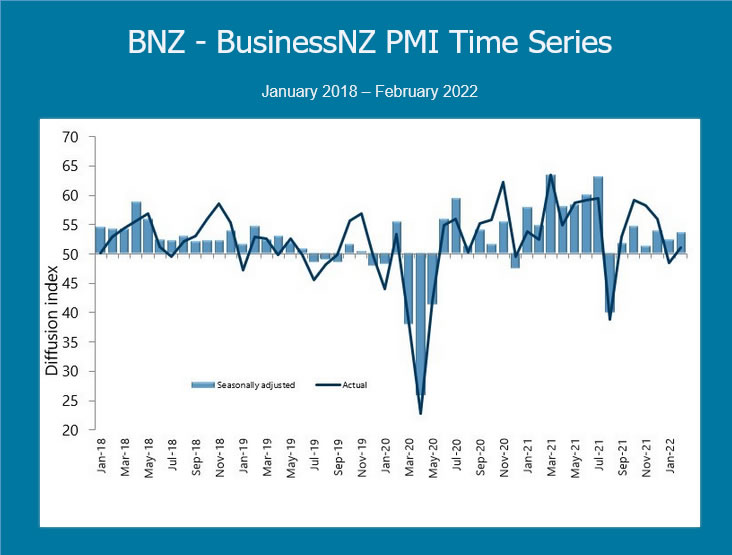
New Zealand BNZ Performance of Manufacturing Index rose from 52.3 to 53.6 in February. Looking at some details, Production rose from 51.1 to 52.1. Employment rose from 49.5 to 51.7. New Orders rose from 53.6 to 58.2. Finished stocks dropped from 52.5 to 50.0. Deliveries dropped from 54.0 to 53.5.
BNZ Senior Economist, Craig Ebert stated that "underlying unease will certainly be piqued by the sustained high COVID case numbers as we go into March. The next PMI result may also see fallout from the Russia/Ukraine conflict, whose global impacts will be felt far and wide."
Elsewhere
Japan overall household spending rose 6.9% yoy in January, above expectation of 3.6% yoy. BSI large manufacturing condition dropped sharply from 8.2 to -7.6 in Q1.
UK GDP, production and trade balance are the major focuses in European session. Germany will release CPI final. Later in the day, Canada employment data will take center stage. US will release U of Michigan consumer sentiment.
USD/JPY Daily Outlook
Daily Pivots: (S1) 115.91; (P) 116.05; (R1) 116.29; More...
USD/JPY's break of 116.34 resistance confirms up trend resumption. Intraday bias is back on the upside. Current rally should now target next long term resistance at 118.65. On the downside, below 115.80 minor support will turn intraday bias neutral first. But outlook will remain bullish as long as 114.40 support holds, in case of retreat.
In the bigger picture, no change in the view that rise from 102.58 is the third leg of the up trend from 101.18 (2020 low). Such rally should target a test on 118.65 (2016 high). Sustained break there will pave the way to 120.85 (2015 high) and raise the chance of long term up trend resumption. This will remain the favored case as long as 55 week EMA (now at 111.75) holds.
Economic Indicators Update
| GMT | Ccy | Events | Actual | Forecast | Previous | Revised |
|---|---|---|---|---|---|---|
| 21:30 | NZD | Business NZ PMI Feb | 53.6 | 52.1 | 52.3 | |
| 23:30 | JPY | Overall Household Spending Y/Y Jan | 6.90% | 3.60% | -0.20% | |
| 23:50 | JPY | BSI Large Manufacturing Conditions Index Q1 | -7.6 | 8.2 | 7.9 | |
| 07:00 | EUR | Germany CPI M/M Feb F | 0.90% | 0.90% | ||
| 07:00 | EUR | Germany CPI Y/Y Feb F | 5.10% | 5.10% | ||
| 07:00 | GBP | GDP M/M Jan | 0.20% | -0.20% | ||
| 07:00 | GBP | Index of Services 3M/3M Jan | 1.20% | 1.20% | ||
| 07:00 | GBP | Industrial Production M/M Jan | 0.30% | 0.30% | ||
| 07:00 | GBP | Industrial Production Y/Y Jan | 0.20% | 0.40% | ||
| 07:00 | GBP | Manufacturing Production M/M Jan | 0.20% | 0.20% | ||
| 07:00 | GBP | Manufacturing Production Y/Y Jan | 3.10% | 1.30% | ||
| 07:00 | GBP | Goods Trade Balance (GBP) Jan | -12.6B | -12.4B | ||
| 13:30 | CAD | Net Change in Employment Feb | 123.0K | -200.1K | ||
| 13:30 | CAD | Unemployment Rate Feb | 6.20% | 6.50% | ||
| 15:00 | USD | Michigan Consumer Sentiment Index Mar P | 61.3 | 62.8 | ||
| 15:00 | GBP | NIESR GDP Estimate (3M) Feb | 1.10% | 0.90% |
New Zealand BNZ manufacturing rose to 53.6, next result may see fallout from Russia/Ukraine conflict
New Zealand BNZ Performance of Manufacturing Index rose from 52.3 to 53.6 in February. Looking at some details, Production rose from 51.1 to 52.1. Employment rose from 49.5 to 51.7. New Orders rose from 53.6 to 58.2. Finished stocks dropped from 52.5 to 50.0. Deliveries dropped from 54.0 to 53.5.
BNZ Senior Economist, Craig Ebert stated that "underlying unease will certainly be piqued by the sustained high COVID case numbers as we go into March. The next PMI result may also see fallout from the Russia/Ukraine conflict, whose global impacts will be felt far and wide."
RBA Lowe: It’s prudent to plan for an interest rate increase
RBA Governor Philip Lowe said it's "plausible" for interest to be lifted from the current 0.1% this year. "It would be prudent to plan for an increase," he added. "For many borrowers that's going to come as quite an unwelcome development, although I know from the letters that I get every day when I turn up at work that many depositors have a different view,"
Meanwhile, he said "I don't feel mounting pressure," on raising rates. "We do what we think is the right thing at each of our meetings, so the pressure, it's great for media stories, but I don't feel that myself."
IMF Georgieva: Global growth forecast to be downgraded, but remains in positive territory
IMF Managing Director Kristalina Georgieva told CNBC yesterday, "we think that we would be downgrading our growth projections as a result of the crisis (in Ukraine), but we still expect the world to be in positive growth territory."
In the January outlook IMF projected global growth of 4.4% in 2022. For now, it's unsure how the global economy would be affected by Russia invasion on Ukraine. "Obviously, how long this war goes is the main uncertainty factor we face," Georgieva said.
Separately, Georgieva also said, sanctions on Russia for its invasion of Ukraine would cause an abrupt contraction of the Russian economy. Russia is facing a "deep recession" this year, and sovereign debt default is no longer seen as "improbable".
Surge in Commodity Prices Boosts Forecasts and Outlook for AUD
The horrific developments in Ukraine have turbo-charged commodity prices, a key driver of the AUD.
We have made significant changes to our commodity price forecasts. These forecasts are set out the Westpac Market Outlook which has been released today. Our working assumption is that almost all the surge in the oil price is behind us. Russia's crude exports have been largely eliminated from global supply as official sanctions, voluntary sanctions and shipping disruptions have already severely curtailed supply.
From this point we expect there will be some slow responses on the supply side, from other producers, while some demand will be dented by high prices. We are assuming an oil price of US$100/bbl through to end 2022. Other key commodity prices for Australia – coal and base metals – are also expected to hold at extremely high levels through to year's end.
Given our new commodity price forecasts, fair value AUD models that do not include a subjective proxy for risk are screaming that it is heavily undervalued. But our expectation of ongoing elevated commodity prices is also coinciding with a period in which high risk aversion is dominating markets.
The Australian dollar is a 'risk on' currency so we have been quite cautious with near term upward revisions to our currency forecasts. Our June target has been lifted from USD0.70 to USD0.73, bearing in mind that by this time we also expect the FOMC to have raised the federal funds rate by 75bps, in three quick tranches.
One potential factor that may offset Australia's traditional position in markets as a 'risk on' asset is its remoteness from Ukraine and Russia. But nervous investors might also view our geographic position as vulnerable insofar as the current conflict plays into China's stated plans for Taiwan.
As risk concerns gradually ease through the second half of 2022, and the RBA begins its own tightening cycle by August, the boost to the AUD from the elevated commodity prices can be more sustained. Accordingly we have lifted our AUD forecast by end 2022 from USD0.73 to USD0.76 – above its long term average.
Risk fears will be further contained through 2023 as markets accept that inflation can slow and central banks can navigate soft landings for their economies. A more 'risk on' sentiment in markets from late 2022 will further embolden the AUD and, with relatively high (although easing) commodity prices through 2023 the Australian dollar is expected to move back to USD0.80.
A genuine risk to this strong AUD scenario in 2023 will be that markets are likely to need to reassess the peak in the RBA's tightening cycle. We expect a peak of 1.75% by the first quarter of 2024 whereas markets are currently priced for a peak of around 2.4%. However we expect that the risk on/high commodity price profile will more than compensate for the interest rate disappointment.
The persistence of risk aversion in 2022 will favour safehaven investments like US Treasuries (USTs) and gold. We acknowledge that inflation pressures and persistent rate hikes from the FOMC will still mean higher US bond rates. The inflation component of USTs has already lifted to around 2.75% (implying unrealistically negative real yields). We also expect five FOMC rate hikes over 2022. However we have slightly lowered our 10yr rate profile by end 2022, from 2.4% to 2.3%, to account for this increased safe-haven demand.
Risk aversion does not favour Australian Government Securities (AGSs) in global markets, given Australia's 'high risk' label. Current spreads between AGSs and USTs are likely to remain wide but, nevertheless, contract to around 20bps from the current recent historical extremes of 40bps.
We have lifted our forecast peak in Australia's headline inflation in 2022 from 4.2% to 5.0%, capturing both the direct and indirect effects of the higher oil price profile.
That has only slightly impacted our forecast for underlying inflation with the peak increasing from 3.5% to 3.7%. Consequently our profile for the RBA – first hike in August to be followed by a second in October – remains intact. Higher headline inflation has raised some genuine concerns for the RBA around inflation expectations (available measures are benign but have tended to be quite erratic and unreliable). However, the spectre of significant risk and lower global growth, particularly in Europe, should see the RBA remaining patient over the next few months.
Our view is that the RBA will respond to the expected Q1 CPI prints on April 27 – annual headline at 4.4% and underlying at 3.1% – with a decision that the 'patient' rhetoric needs to moderated through June/July, with a clear tightening bias emerging.
The Q2 CPI prints on July 27 – annual headline at 5.0% and underlying at 3.6% – are expected to be enough to signal 'lift off' at the August 2 Board meeting.
Technical Outlook and Review
DXY:
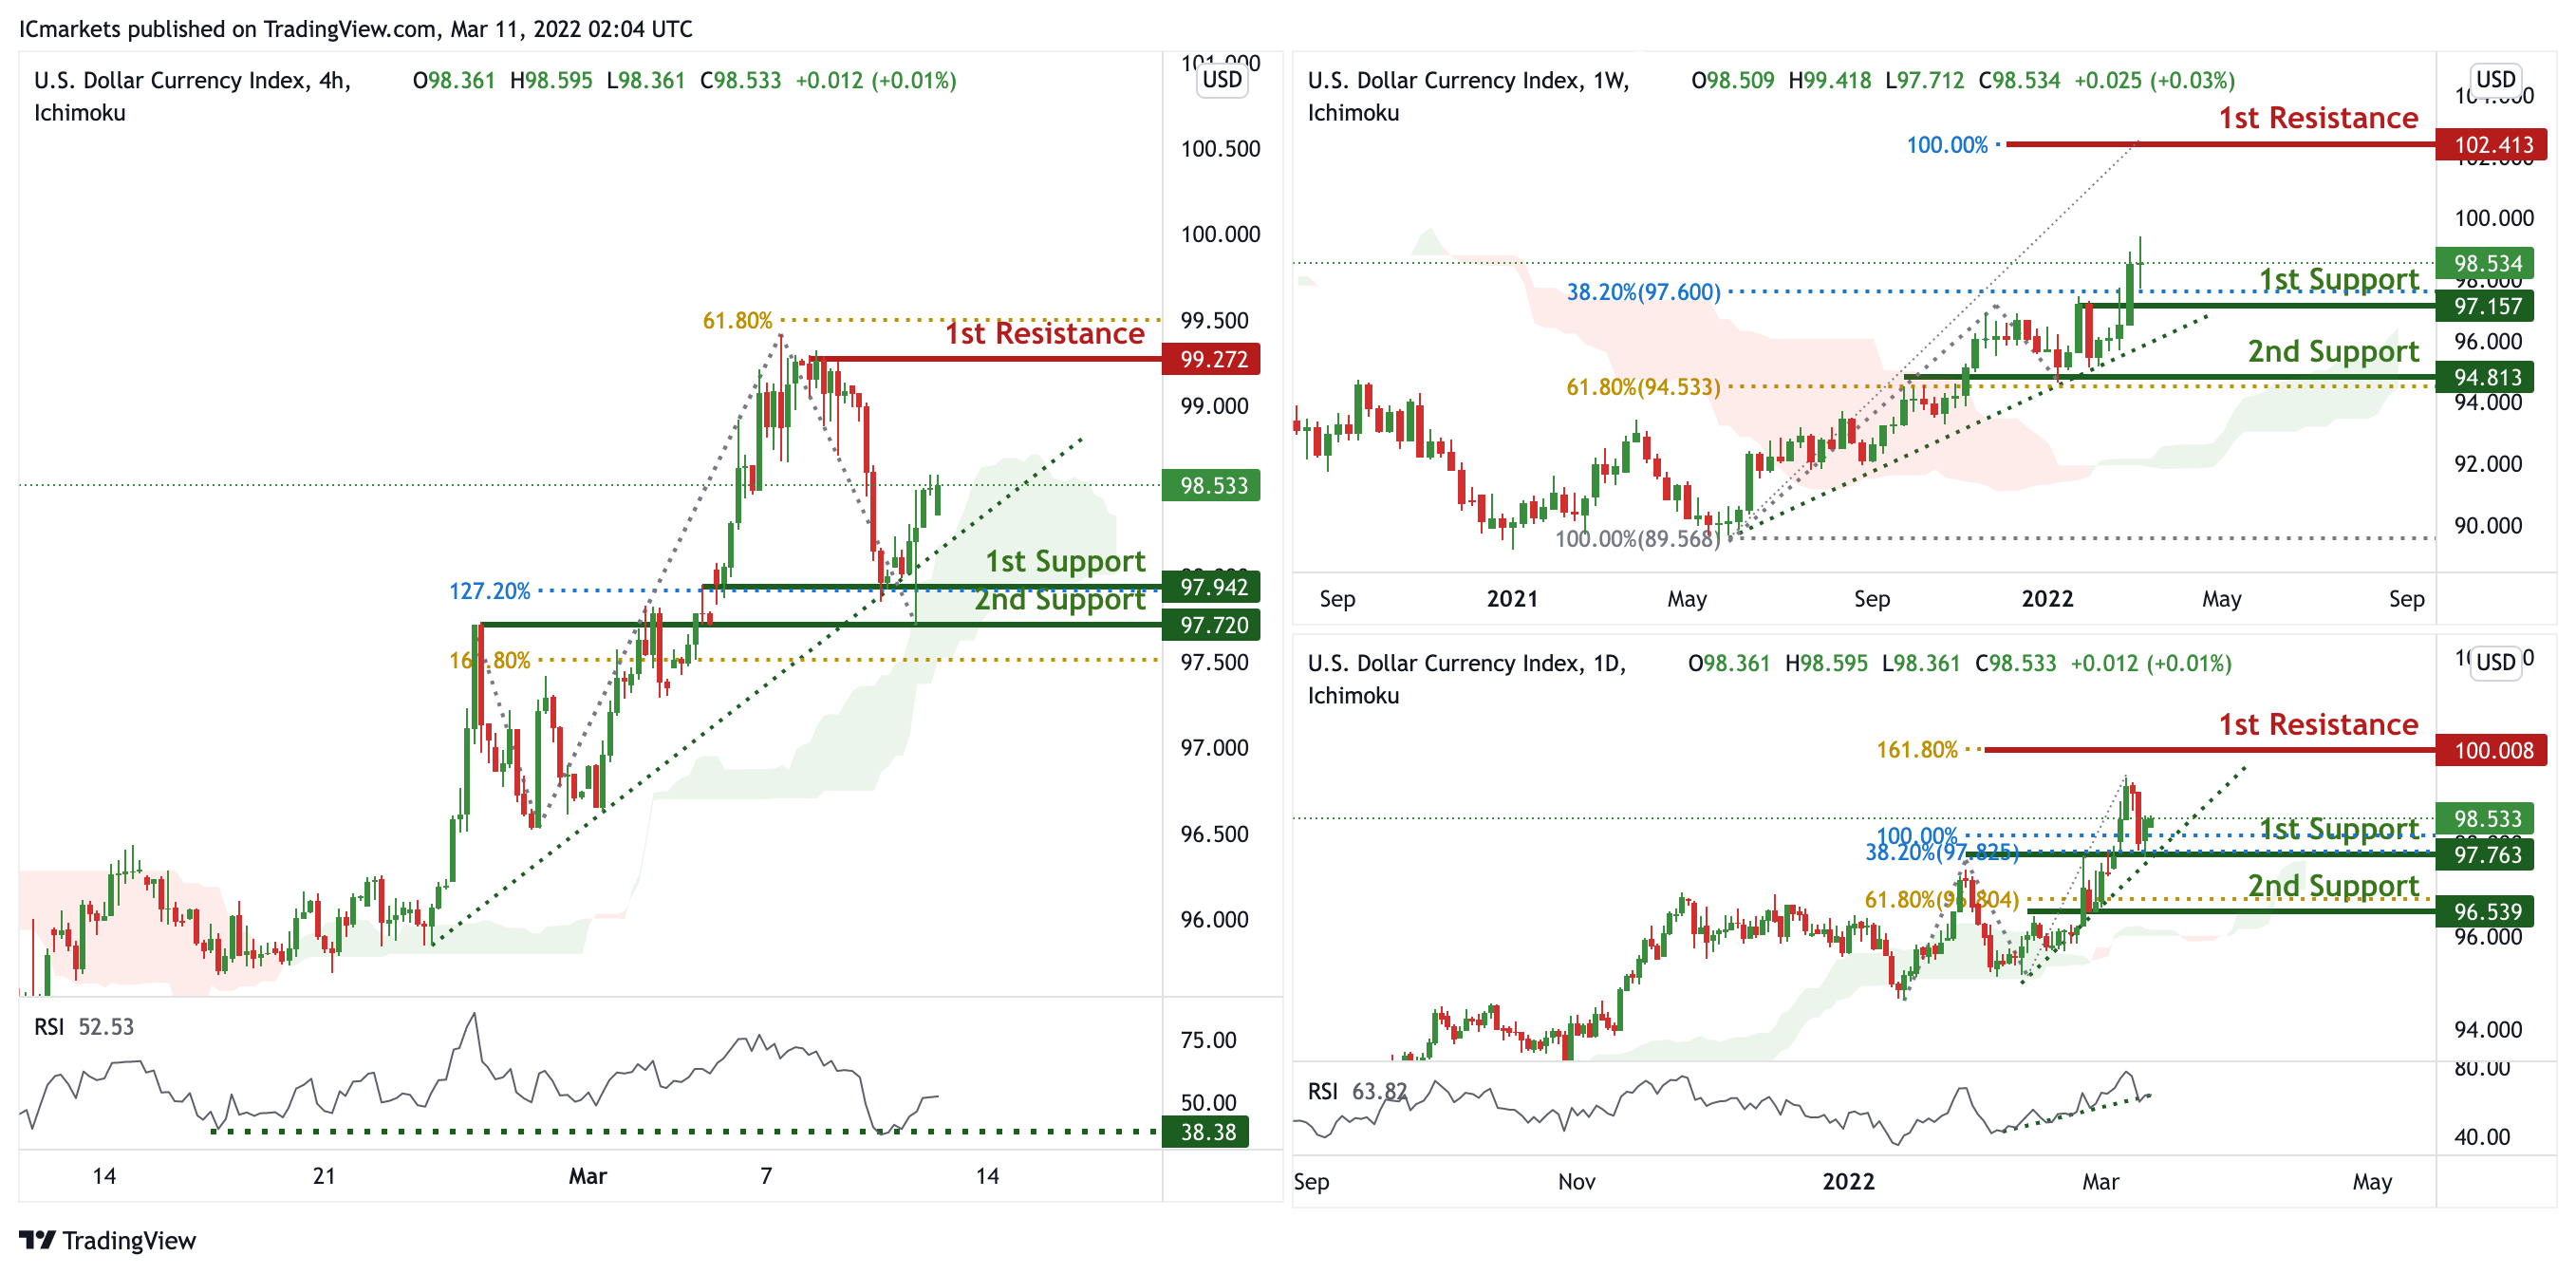
On the weekly, prices are on bullish momentum and abiding to our ascending trendline support. We see the potential for further bullish continuation from our 1st support at 97.157 in line with 38.2% Fibonacci retracement towards our 1st resistance at 102.413 in line with 100% Fibonacci projection. Prices are trading above our ichimoku clouds, further supporting our bullish bias.
On the daily, prices are on bullish momentum and abiding to our ascending trendline support. We see the potential for further bullish continuation from our 1st support at 97.763 in line with 100% Fibonacci projection and 38.2% Fibonacci retracement towards our 1st resistance at 100.008 in line with 161.8% Fibonacci projection. Prices are trading above our ichimoku clouds and RSI is on bullish momentum, further supporting our bullish bias.
On the H4 timeframe, prices are on bullish momentum and abiding to our ascending trendline support. We see the potential for further bullish continuation from our 1st support at 97.942 in line with 127.2% Fibonacci projection towards our 1st resistance at 99.272 in line with 61.8% Fibonacci retracement. Prices are trading above our ichimoku clouds and RSI is at levels where bounces previously occurred.
Areas of consideration:
- H4 time frame, 1st resistance at 99.272
- H4 time frame, 1st support at 97.942
XAU/USD (GOLD):
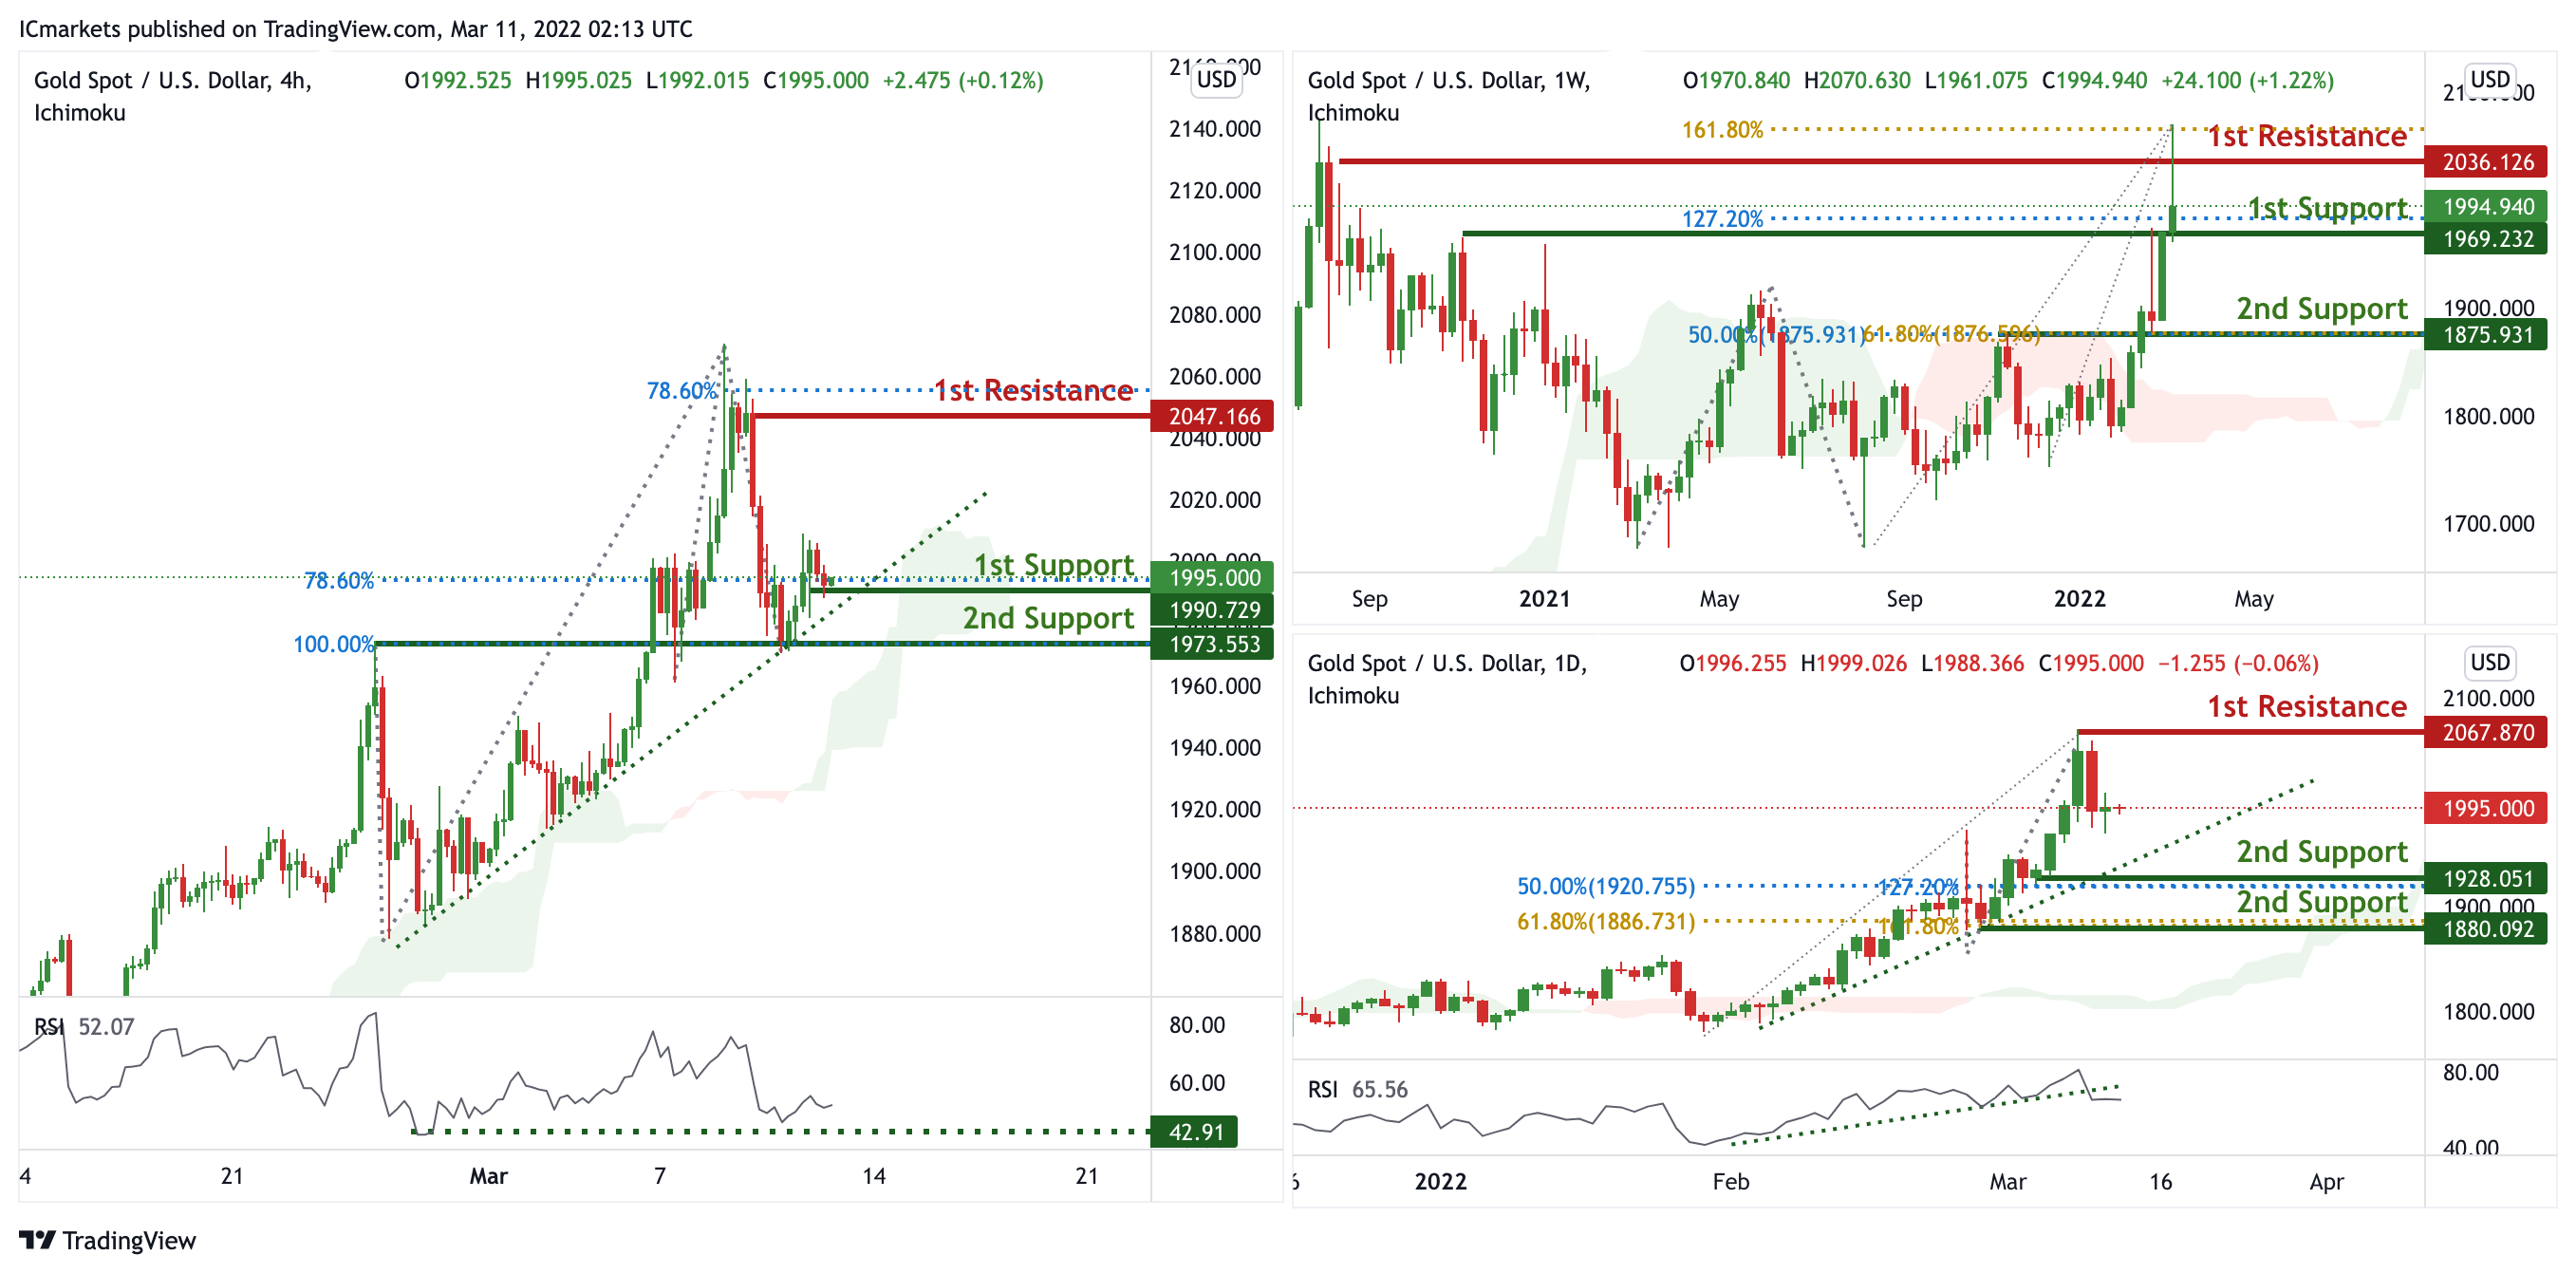
On the weekly, prices are on bullish momentum and abiding to our ascending trendline support. We see the potential for further bullish continuation from our 1st support at 1969.232 in line with 127.2% Fibonacci projection towards our 1st resistance at 2036.126 in line with 161.8% % Fibonacci projection. Prices are trading above our ichimoku clouds and RSI is on bullish momentum, further supporting our bullish bias.
On the daily, prices are on bullish momentum and abiding to our ascending trendline support. We see the potential for further bullish continuation from our 1st support at 1928.051 in line with 127.2% Fibonacci projection and 50% Fibonacci retracement towards our 1st resistance at 2067.870 which is a graphical swing high. Prices are trading above our ichimoku clouds and RSI is on bullish momentum, further supporting our bullish bias.
On the H4, prices are on bullish momentum and abiding to our ascending trendline support. We see the potential for further bullish continuation from our 1st support at 1990.729 in line with 78.6% Fibonacci projection towards our 1st resistance at 2047.166 in line with 78.6% Fibonacci projection. Prices are trading above our ichimoku clouds and RSI is on bullish momentum, further supporting our bullish bias.
Areas of consideration:
- 4h 1st support at 1990.729
- 4h 1st resistance at 2047.166
GBP/USD:
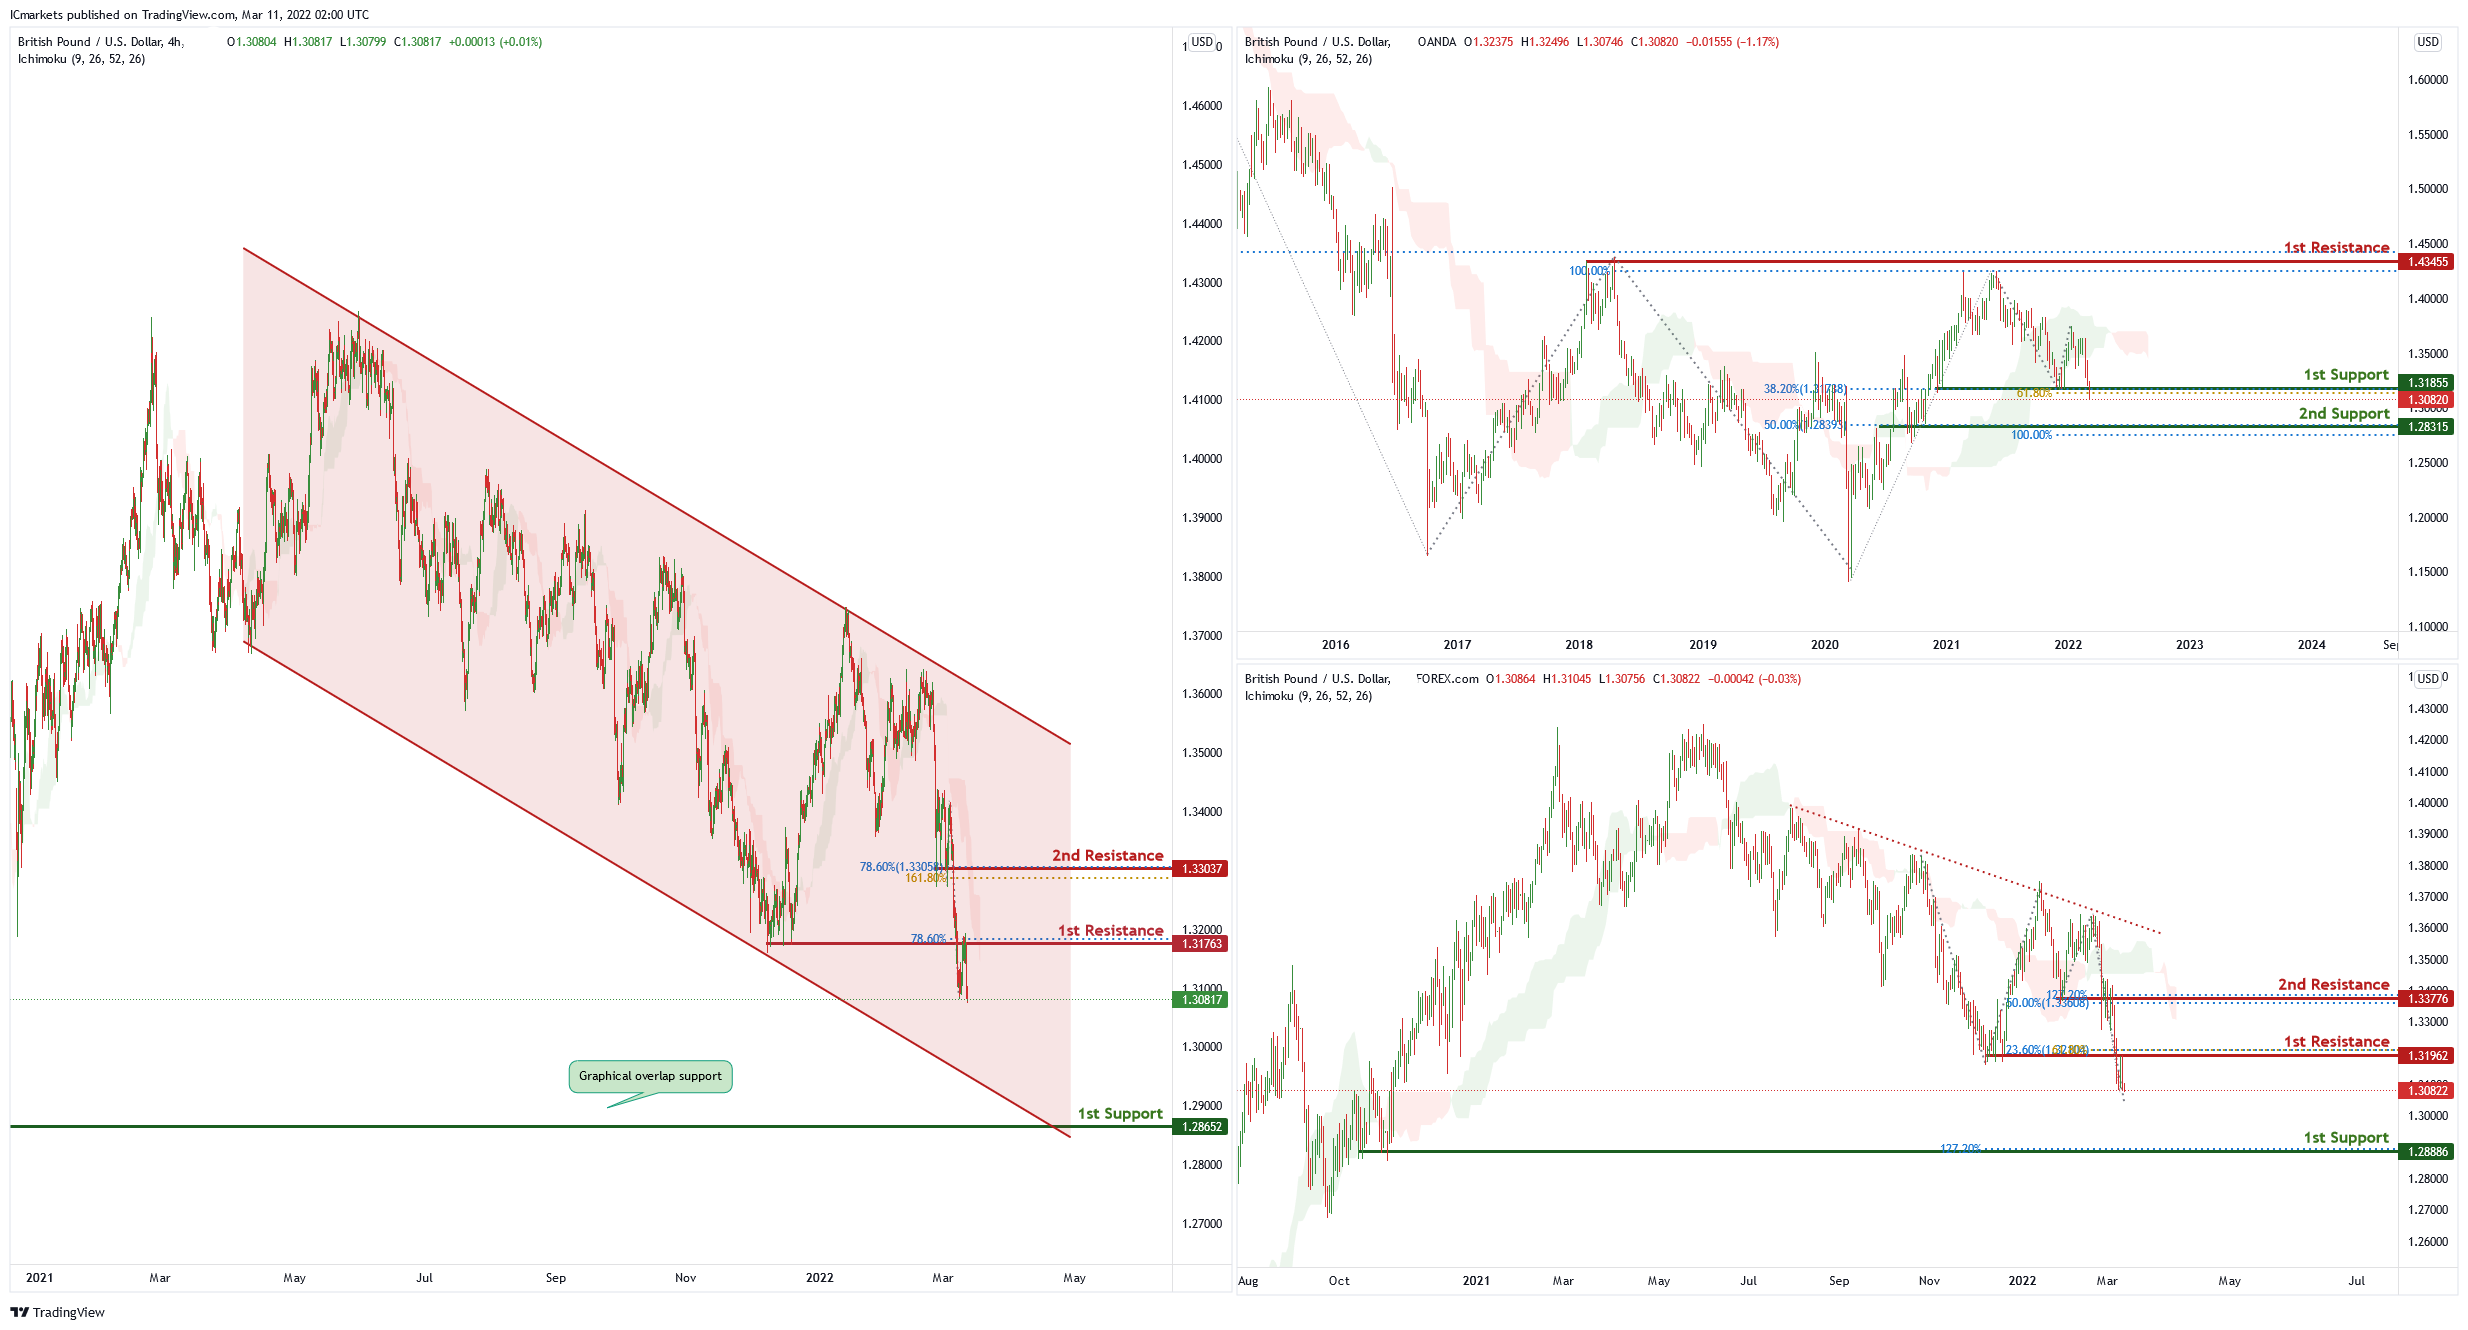
On the weekly chart , price has recently bounced off the 1st support level of 1.31885 which is also 38.2% Fibonacci retracement and 61.8% Fibonacci projection. Price can potentially go to the 1st resistance level of 1.42498 which is also 100% Fibonacci projection and 50% Fibonacci retracement. Our bullish bias is supported by the ichimoku cloud indicator.
On the daily chart , price is abiding by a descending trendline . Price is near the 1st resistance level of 1.31962 in line with 23.6% Fibonacci retracement and 61.8% Fibonacci projection. Price can potentially dip to the 1st support level of 1.28886 in line with 127.2% Fibonacci projection.Our bearish bias is supported by the ichimoku cloud indicator.
On the H4 chart price is trading in a descending channel and has recently broken the 1st resistance level of 1.31763 in line with 78.6% Fibonacci retracement. Price can potentially dip to the 1st support level of 1.28652 in line which is also the graphical overlap support. Our bearish bias is supported by the ichimoku cloud indicator as price is trading under it.
Areas of consideration
- H4 1st resistance at 1.31763
- H4 1st support at 1.28652
USD/CHF:
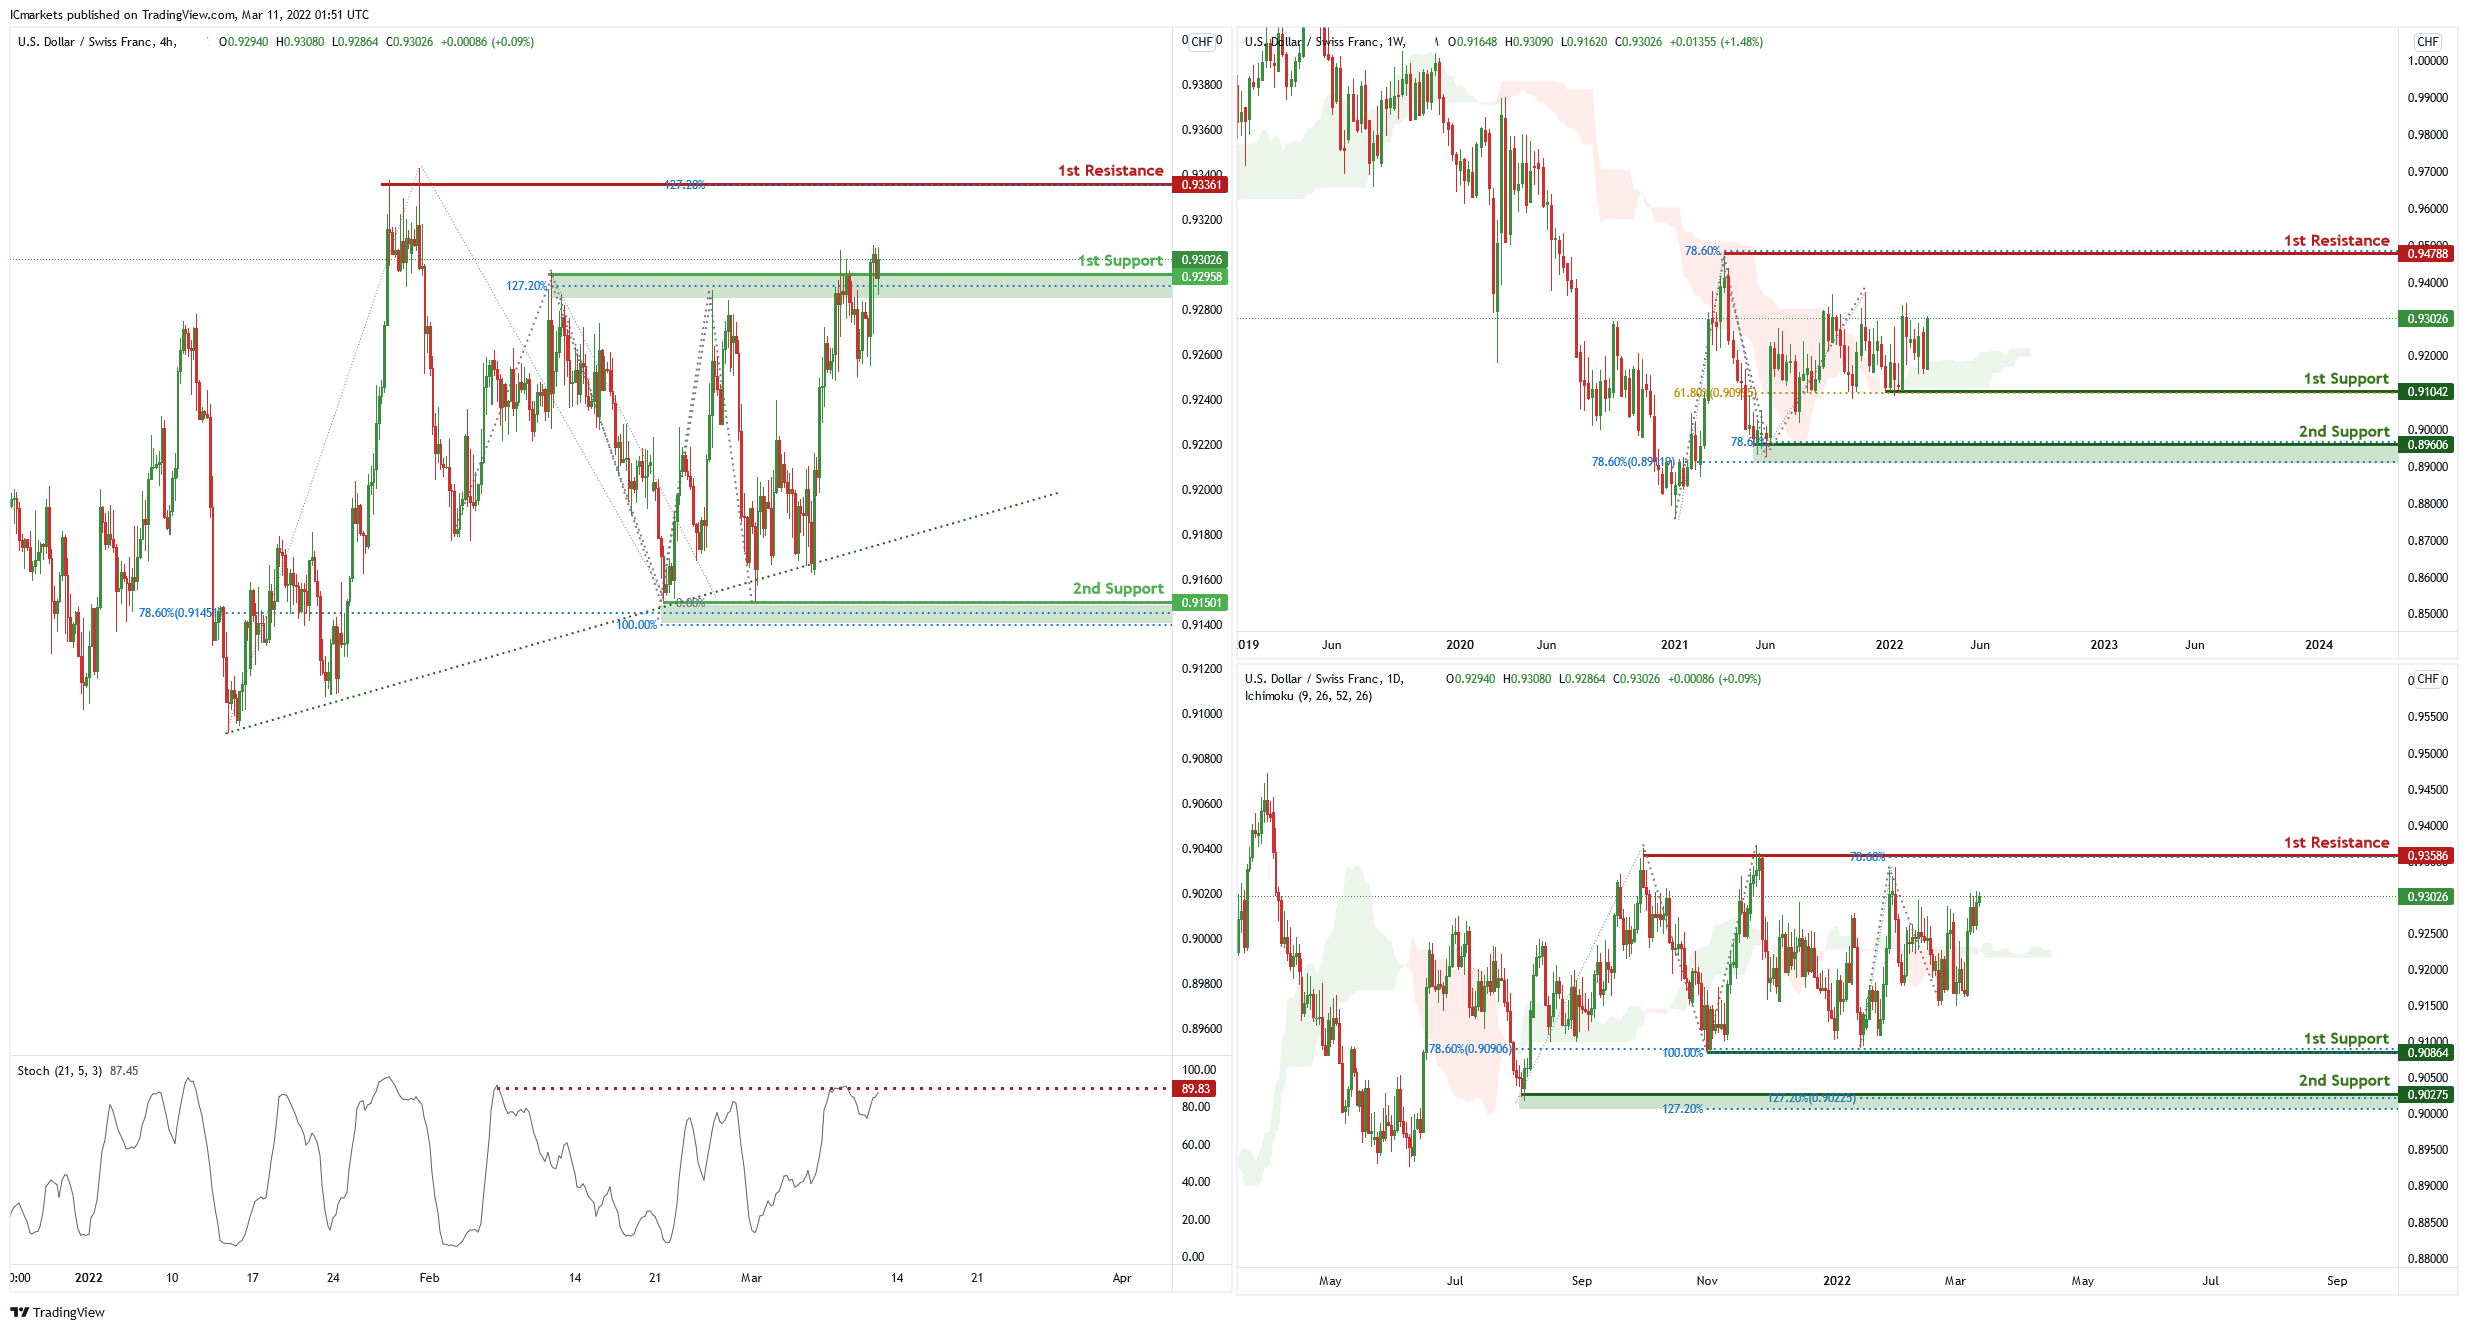
On the weekly chart, price is between 1st support level of 0.91042 in line with 61.8% Fibonacci retracement and 1st resistance level of 0.94788 in line with 78.6% Fibonacci projection. Price can potentially go to the 1st resistance level. Our bullish bias is supported by the ichimoku cloud indicator.
On the daily chart price is between 1st support of 0.90864 in line with 100% Fibonacci projection, 78.6% Fibonacci retracement and 1st resistance level of 0.93586 in line with 78.6% Fibonacci projection. Price can potentially go to the 1st resistance level which is also the graphical swing high level. Our bullish bias is supported by the ichimoku cloud indicator.
On the H4, price is abiding by an ascending trendline and near 1st support level of 0.92958 in line with 127.2% Fibonacci projection. Price can potentially dip to the 2nd support level of 0.91501 in line with 100% Fibonacci projection and 78.6% Fibonacci retracement. Our bearish bias is supported by the stochastic indicator as it is near resistance level
Areas of consideration
- 1st support level 0.92956
- 2nd support 0.91501
EUR/USD :
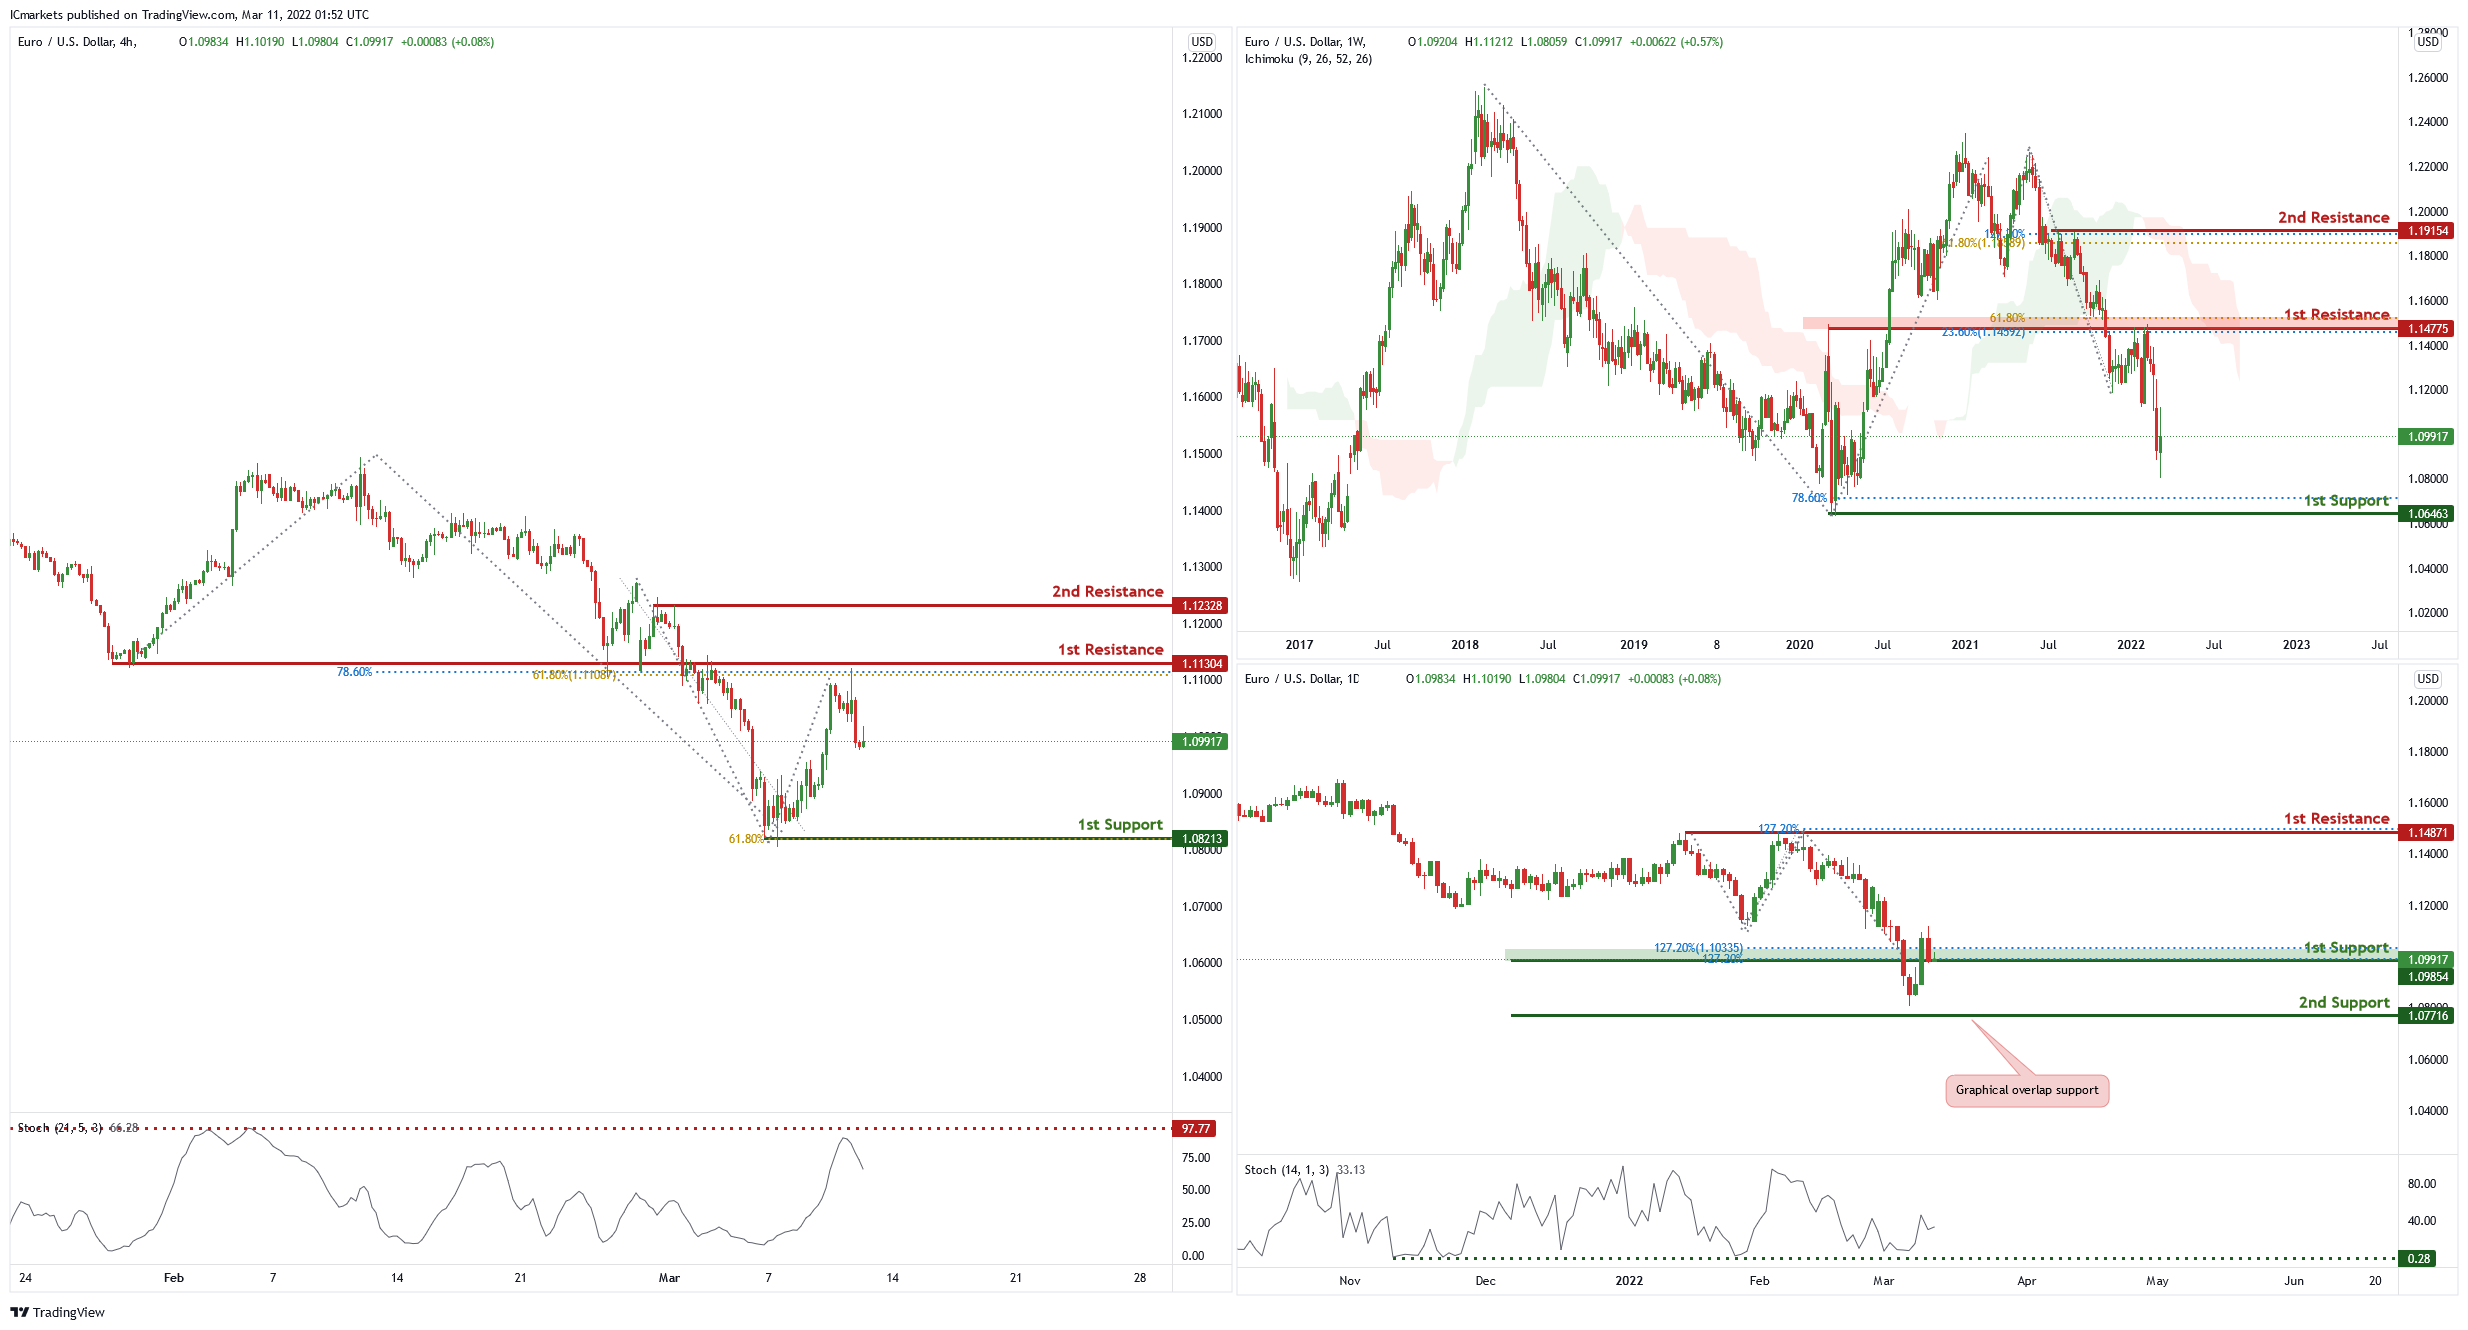
On the weekly chart , price is near 1st resistance level of 1.14775 in line with 23.6% Fibonacci retracement and 61.8% Fibonacci projection. Price can potentially dip to the 1st support level of 1.06463 in line with 78.6% Fibonacci projection. Our bearish bias is supported by the ichimoku cloud indicator as price is trading below it.
On the daily chart, price is at 1st support level of 1.09854 in line with 127.2% Fibonacci projection and 127.2% Fibonacci retracement. Price can bounce to the 1st resistance level of 1.14871 in line with 127.2% Fibonacci projection and graphical swing high . Our bullish bias is supported by the stochastic indicator as it is at support level.
On the H4 price is near 1st resistance level of 1.11304 in line with 78.6% Fibonacci projection and 61.8% Fibonacci retracement. Price can potentially dip to the 1st support level which is the graphical swing low and 61.8% Fibonacci projection. Our bearish bias is supported by the stochastic indicator as it is the graphical swing low and 61.8% Fibonacci projection
Areas of consideration :
- H4 1st resistance at 1.11304
- H4 1st support at 1.08213
USD/JPY:
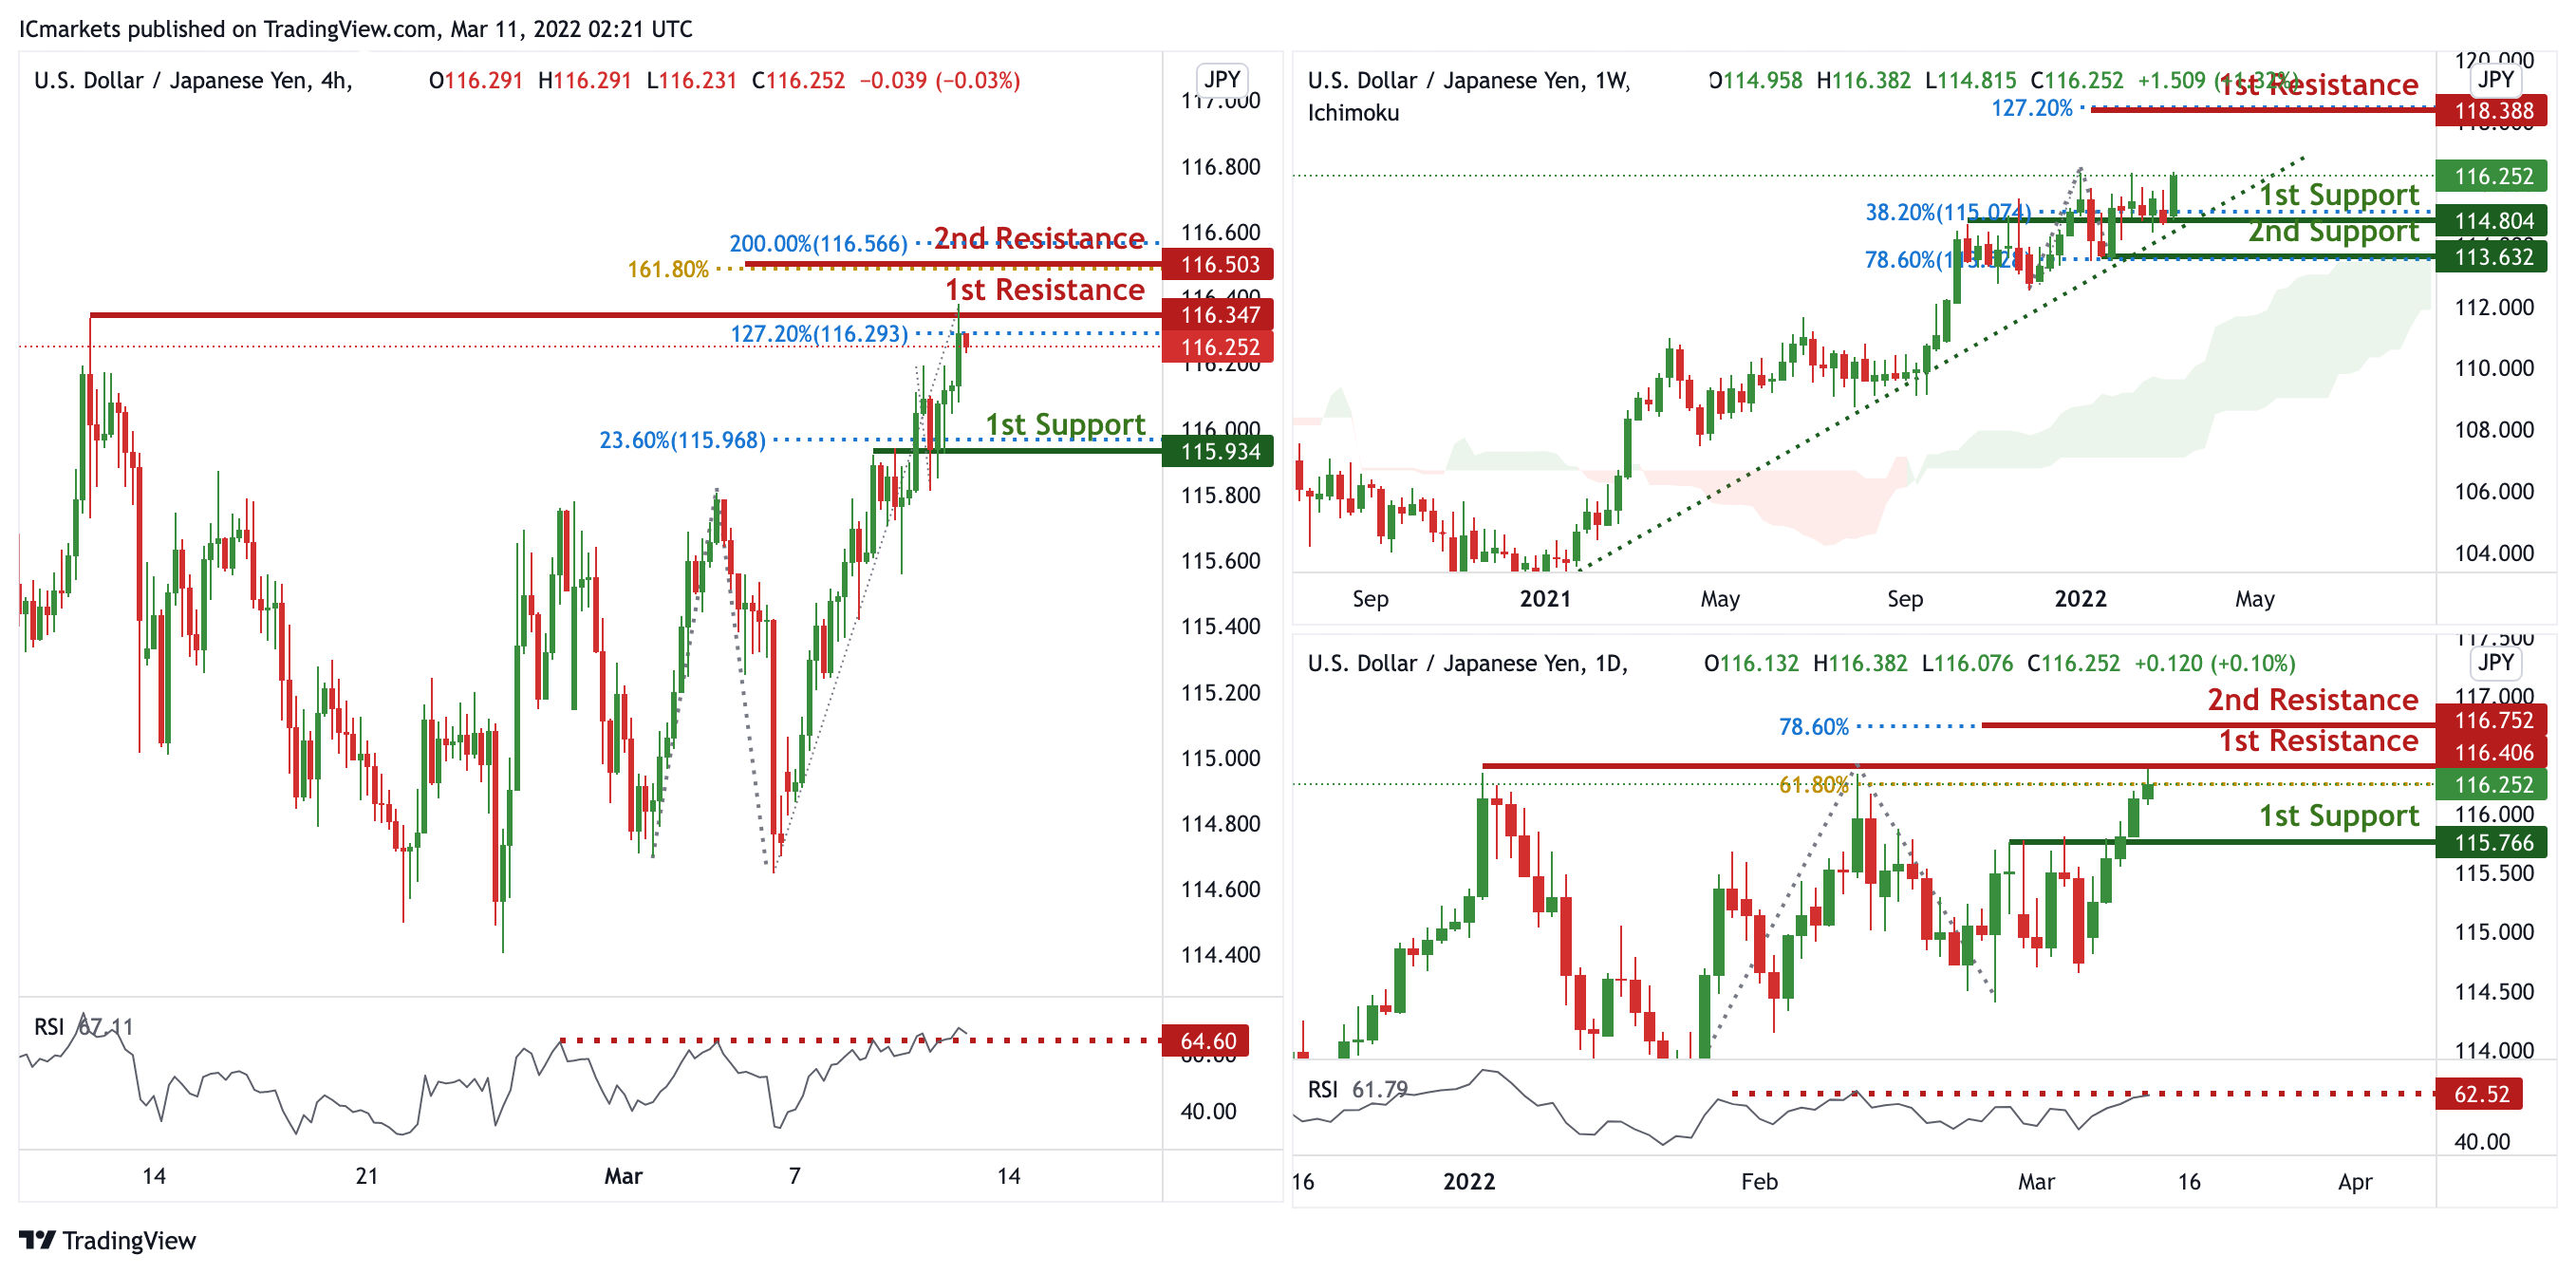
On the weekly, prices are on bullish momentum and abiding to our ascending trendline support. We see the potential for further bullish continuation from our 1st support at 114.804 in line with 38.2% Fibonacci retracement towards our 1st resistance at 118.388 in line with 127.2% Fibonacci projection. Prices are trading above our ichimoku clouds and RSI is on bullish momentum, further supporting our bullish bias.
On the daily, prices are at a strong resistance level. We see the potential for a dip from our 1st resistance at 116.406 in line with 61.8% Fibonacci projection towards our 1st support at 100.008 which is also a graphical overlap. RSI is at levels where dips previously occurred, further supporting the bias of a pullback. On the H4 timeframe prices are at a strong resistance level. We see the potential for a dip from our 1st resistance at 116.347 in line with 127.2% Fibonacci projection towards our 1st support at 115.934 which is also a graphical overlap. RSI is at levels where dips previously occurred, further supporting the bias of a pullback.
Areas of consideration:
- H4 time frame, 1st resistance at 116.347
- H4 time frame, 1st support at 115.934
AUD/USD:
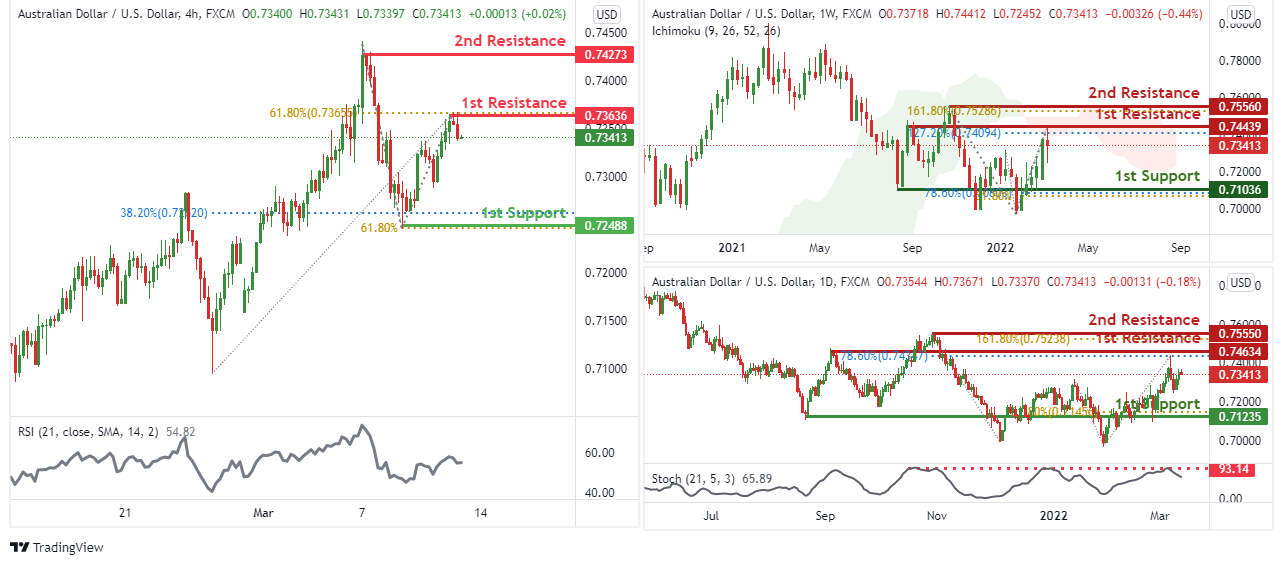
On the weekly chart, we can see that price can potentially dip from the 1st resistance level of 0.74439 which is also 127.2% Fibonacci extension. Price can move to the 1st support level of 0.71036 which is also 61.8% Fibonacci projection and 78.6% Fibonacci retracement. Our bearish bias is further supported by price trading below the Ichimoku cloud indicator.
On the daily chart, price is near the 1st resistance level of 0.73636 in line with 78.6% Fibonacci retracement. Price can potentially dip to the 1st support level of 0.71235 in line with 61.8% Fibonacci retracement. Our bearish bias is further supported by the stochastic indicator as it is near the resistance level.
On the H4 chart, price is near the 1st resistance level of 1.31763 in line with 61.8% Fibonacci retracement. Price can potentially dip to the 1st support level of 0.72488 in line with 38.2% Fibonacci retracement and 61.8% Fibonacci projection. Our bearish bias is further supported by the RSI indicator.
Areas of consideration
- H4 1st resistance at 0.73636
- H4 1st support at 0.72488
NZD/USD:
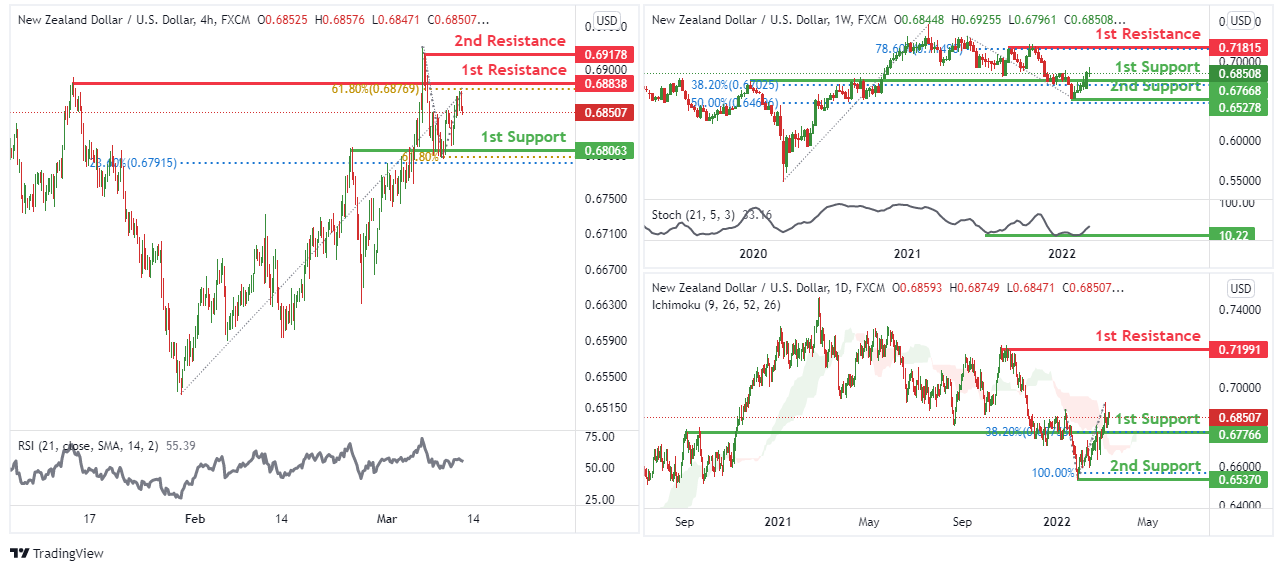
On the weekly chart , price is near 1st support level of 0.68506 in line with 38.2% Fibonacci retracement. Price can potentially move towards the 1st resistance level of 0.71815 in line with 78.6% Fibonacci retracement. Our bullish bias is supported by the stochastic indicator as it is near support level.
On the daily chart, price is at 1st support level of 0.67766 in line with 38.2% Fibonacci retracement. Price can move towards the 1st resistance level of 0.71991 which is a graphical swing high. Our bullish bias is supported by price trading above the Ichimoku cloud indicator..
On the H4 price is near 1st resistance level of 0.68838 in line with 61.8% Fibonacci retracement. Price can potentially dip to the 1st support level at 0.68063 in line with 23.6% Fibonacci retracement and 61.8% Fibonacci projection, which is also a graphical swing low. Our bearish bias is further supported by the RSI indicator.
Areas of consideration :
- H4 1st resistance at 0.68838
- H4 1st support at 0.68063
USD/CAD:
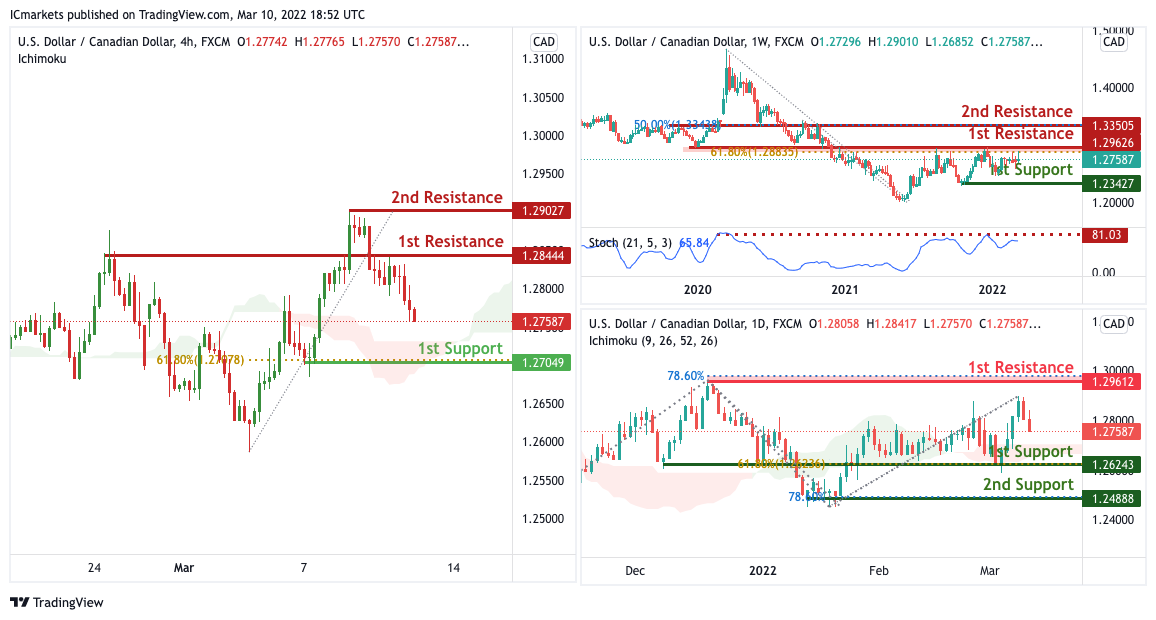
On the weekly timeframe, with price expected to reverse off the resistance of the stochastics indicator, we have a bearish bias that price will drop to our 1st support at 1.23427 in line with the horizontal swing low support from our 1st resistance of 1.29626 in line with the horizontal overlap resistance and 61.8% Fibonacci retracement. Alternatively, price may break our 1st resistance and head for 2nd resistance at 1.33505 in line with the 50% Fibonacci retracement and horizontal pullback resistance.
On the Daily timeframe, price is near 1st support level of 1.26243 in line with horizontal overlap support and 61.8% Fibonacci retracement. Price can potentially rise to the 1st resistance level of 1.29612 in line with the swing high resistance and 78.6% Fibonacci retracement. Alternatively, price may break 1st support and head for 2nd support at 1.24888 where the swing low support. Our bullish bias is supported by how price is moving above the ichimoku cloud.
On the H4 timeframe, with price expected to reverse off the resistance of the stochastics indicator, we have a bearish bias that price will drop to our 1st support at 1.27049 in line with the horizontal swing low support and 61.8% Fibonacci retracement from our 1st resistance of 1.28444 in line with the horizontal overlap resistance. Alternatively, price may break our 1st resistance and head for 2nd resistance at 1.29027in line with the horizontal swing high resistance.
Areas of consideration:
- H4 time frame, 1st support at 1.27049
- H4 time frame, 1st resistance at 1.28444
OIL:
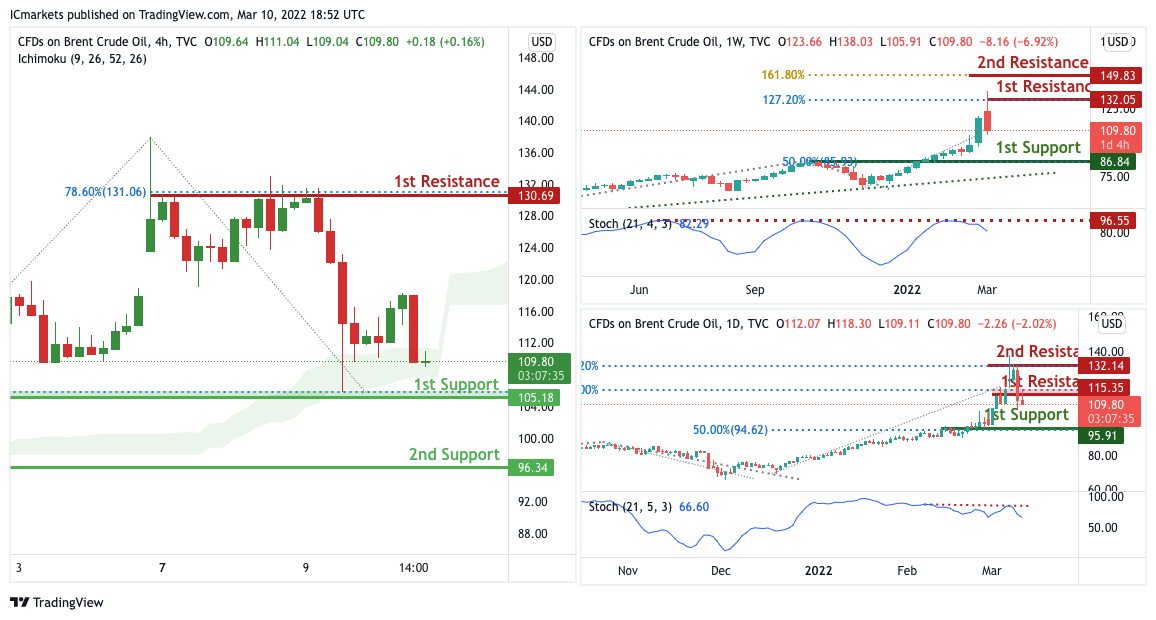
On the weekly timeframe, with price expected to reverse off the resistance of the stochastics indicator, we have a bearish bias that price will drop to our 1st support at 86.84 in line with the 50% Fibonacci retracement from our 1st resistance of 132.05 in line with the 127.2% Fibonacci extension. Alternatively, price may break our 1st resistance and head for 2nd resistance at 149.83 in line with the 161.8% Fibonacci extension.
On the Daily timeframe, with price expected to reverse off the resistance of the stochastics indicator, we have a bearish bias that price will drop to our 1st support at 95.91 in line with the 50% Fibonacci retracement from our 1st resistance of 115.35 in line with the 100% Fibonacci projection. Alternatively, price may break our 1st resistance and head for 2nd resistance at 132.14 in line with the 127.2% Fibonacci extension..
On the H4 timeframe, price is near 1st support level of 105.18 in line with horizontal overlap support and 78.6% Fibonacci retracement. Price can potentially rise to the 1st resistance level of 130.69 in line with the swing high resistance and 78.6% Fibonacci retracement. Alternatively, price may break 1st support and head for 2nd support at 96.34 where the swing low support. Our bullish bias is supported by how price is moving above the ichimoku cloud.
Areas of consideration:
- H4 time frame, 1st resistance of 130.69
- H4 time frame, 1st support of 105.18
Dow Jones Industrial Average:
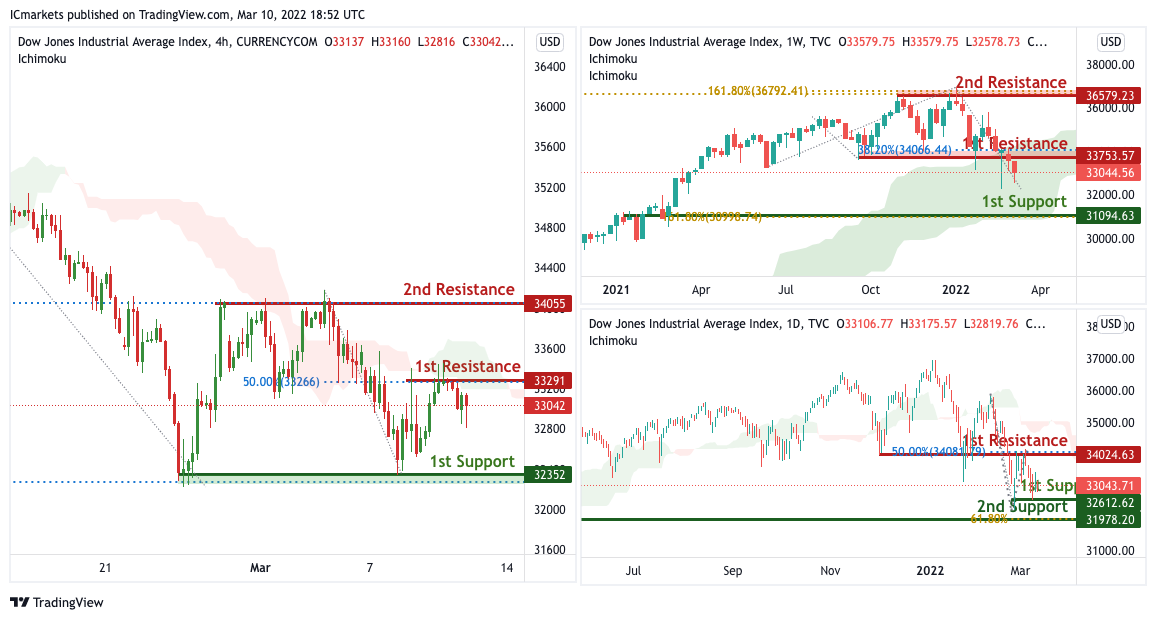
On the Weekly timeframe, we have a bearish bias that price will drop from 1st resistance at 33753 in line with the 38.2% Fibonacci retracement to 1st support at 31094 in line with 61.8% Fibonacci retracement.Alternatively, price may break pivot structure and head for 2nd support at 36579 in line with the 161.8% Fibonacci projection. Our bearish bias is supported by how price has recently broken the 1st support of the ichimoku cloud and is expected to bounce off the second support.
On the Daily timeframe, price is near 1st support level of 32612 in line with horizontal swing low support. Price can potentially rise to the 1st resistance level of 34024 in line with the 50% Fibonacci retracement. Alternatively, price may break 1st support and head for 2nd support at 31978 where the 61.8% Fibonacci retracement. Our bullish bias is supported by how price is moving above the ichimoku cloud.
On the H4 timeframe, with price at the resistance of the ichimoku cloud, we have a bearish bias that price will drop from 1st resistance at 33291 in line with the 50% Fibonacci retracement to 1st support at 32352 in line with the swing low support and 127.2% Fibonacci extension .Alternatively, price may break pivot structure and head for 2nd support at 34055 in line with the 50% Fibonacci retracement. Our bearish bias is supported by how price is moving below the ichimoku cloud.
Areas of consideration :
- H4 1st support at 32352
- H4 1st resistance at 33291
Crude Oil Price Reverse Gains And Faces Resistance
Key Highlights
- Crude oil price surged to $131 before there was a sharp decline.
- It broke a major bullish trend line at $118.50 on the 4-hours chart.
- EUR/USD corrected losses and climbed above 1.1020.
- Gold price stayed above the $1,975 support zone.
Crude Oil Price Technical Analysis
In the past few days, crude oil price saw a major increase above $100.00 against the US Dollar. The price surpassed the $120.00 level and extended gains.
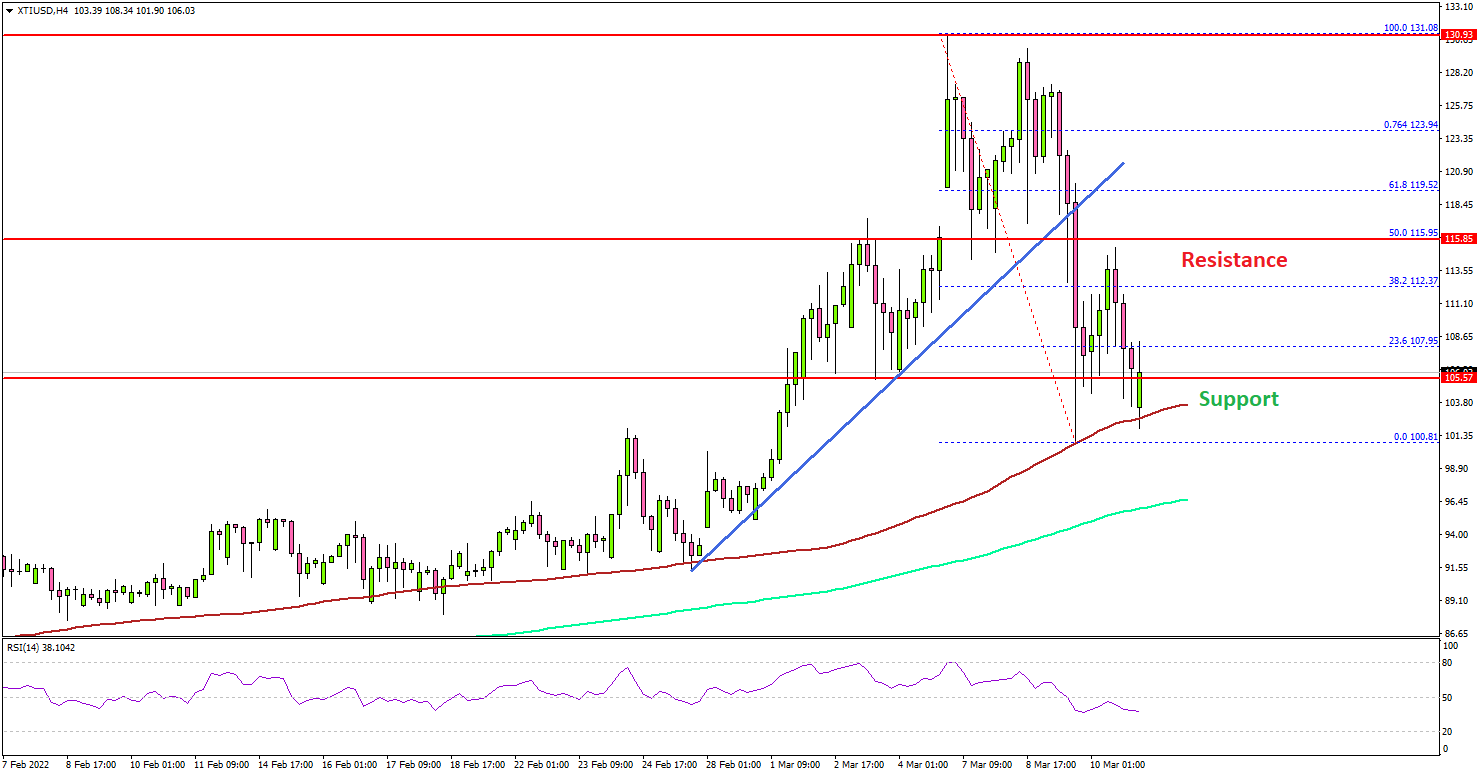
Looking at the monthly chart of XTI/USD, the price even surged towards $130.00. A multi-year high was formed near $131.08 and the price settled above the 100 simple moving average (red, 4-hours).
Recently, there was a sharp downside correction below the $120.00 level. The price even dived below $110.00. However, the bulls were active near the $100.00 level and the 100 simple moving average (red, 4-hours).
The price started a fresh increase and climbed above the $110.00 level. It is now facing resistance near the $115 zone. The next major resistance might be $120.00, above which oil price might revisit $130.00.
If not, there is a risk of a fresh move towards the $100.00 support level. Any more gains might call for a test of the $95.00 level and the 200 simple moving average (green, 4-hours).
Fundamentally, the US Consumer Price Index for Feb 2022 was released yesterday by the US Bureau of Labor Statistics. The market was looking for a 7.9% increase in the CPI compared with the same month a year ago.
The actual result was similar, as the US Consumer Price Index increased 7.9%. The monthly change was +0.8%, up from the last +0.6%.
Looking at EUR/USD, the pair started a decent recovery wave above 1.0950 and 1.1000. Besides, GBP/USD is still consolidating above 1.3100.
Economic Releases to Watch Today
- UK GDP for Jan 2022 (MoM) - Forecast +0.2%, versus -0.2% previous.
- German Consumer Price Index for Feb 2022 (YoY) – Forecast +5.1%, versus +5.1% previous.
- German Consumer Price Index for Feb 2022 (MoM) – Forecast +0.9%, versus +0.9% previous.
- Canada’s employment Change for Feb 2022 – Forecast 160K, versus -200.1K previous.
- Canada’s Unemployment Rate for Feb 2022 - Forecast 6.2%, versus 6.5% previous.
Elliott Wave View: USDCHF 5 Waves Rally Favors Upside
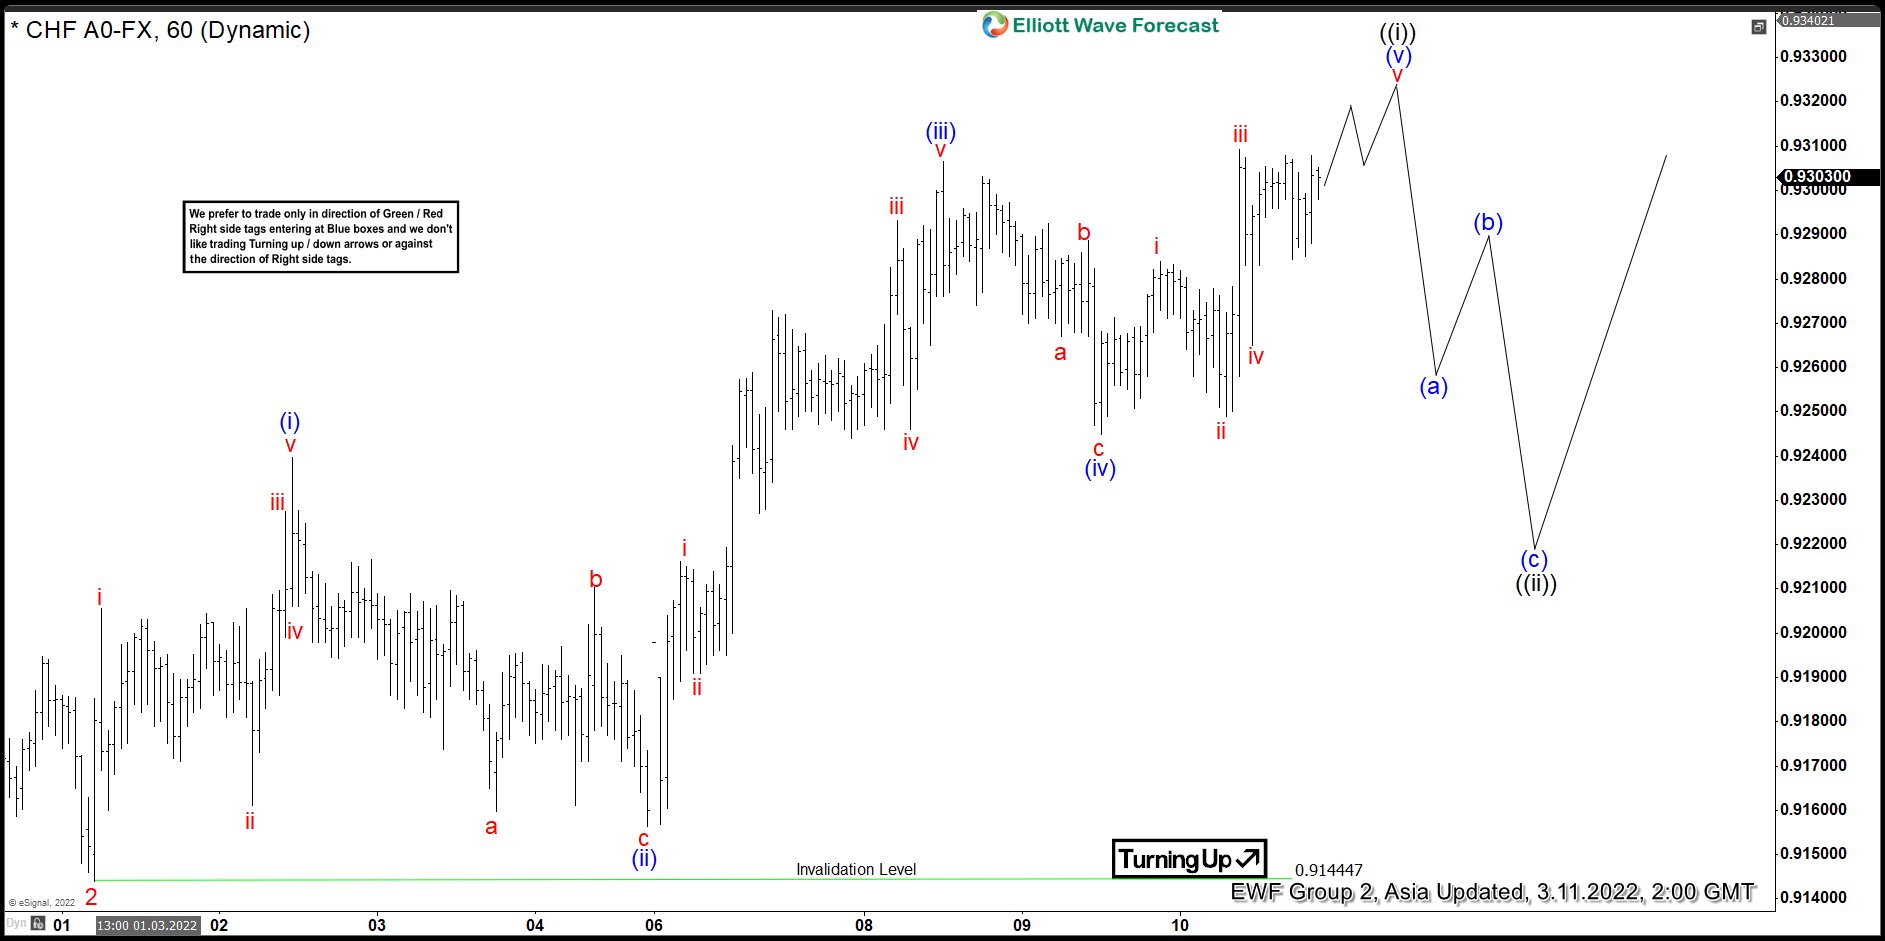
Short Term Elliott Wave View in USDCHF suggests the rally from January 13, 2022 low is unfolding as a 5 waves impulse. Up from January 13 low, wave 1 ended at 0.9343 and pullback in wave 2 ended at 0.9144. The 60 minutes chart below shows pair has turned higher again in wave 3. Internal subdivision of wave 3 is unfolding as another 5 waves in lesser degree. Up from wave 2, wave (i) ended at 0.9239 and dips in wave (ii) ended at 0.9156. Pair then resumes higher in wave (iii) towards 0.9306 and pullback in wave (iv) ended at 0.9245. Expect wave (v) to end soon which should also complete wave ((i)).
Pair should then pullback in wave ((ii)) to correct cycle from March 1 low before the next leg higher. Near term, as far as pivot at 0.914 low stays intact, expect pullback to find support in the sequence of 3, 7, or 11 swing for further upside in wave ((iii)). The bias to the upside will get further validation if pair can break above wave 1 on January 31, 2022 at 0.934. Break above wave 1 should create a higher high (bullish ) sequence from January 13, 2022 low confirming the upside bias.
USDCHF 60 Minutes Elliott Wave Chart