Sample Category Title
Will Yield Differential Shake Up Sterling?
The British pound continues to have a quiet week and is looking for direction. There is plenty of political uncertainty both in the UK and abroad, but the pound remains in calm waters. Tensions over a feared Russian invasion of Ukraine have not moved the pound, nor have developments at 10 Downing Street. Boris Johnson reshuffled his cabinet on Tuesday, but it remains to be seen if he can salvage his job after a report criticized lockdown parties which the Prime Minister attended.
The financial markets shrugged off last week’s BoE quarter-point hike, which raised the Bank Rate to 0.50%. The meeting was significant in that the vote was a tight 5-4 decision, with four members of the Monetary Policy Committee (MPC) voting to raise rates by 50 basis points. This points to deep divisions at the MPC and will complicate the BoE’s task of providing clear guidance to the markets, which could result in volatility for the pound. BoE Governor Bailey has a credibility problem after surprising the markets with his rate decisions late last year, and the 5-4 vote reveals significant dissension which won’t help Bailey.
A factor that could drive the pound is yield differentials between gilts and US Treasury bonds. US yields have been moving higher, with the 10-year rate rising up to 1.95% early in the week. The key 2.0% threshold, which has held since July 2019, appears within reach. UK yields are also on the move, with the 10-year gilt rising to 1.496% on Tuesday before retreating slightly. A prolonged change in the yield differential could shake up the sleepy sterling.
The US releases the January inflation report on Thursday, with the markets bracing for even higher inflation. The consensus for CPI stands at 7.3%, compared to 7.0% in December. A high reading could raise the likelihood of a 50 basis point hike next month, which currently has been priced in at 33%.
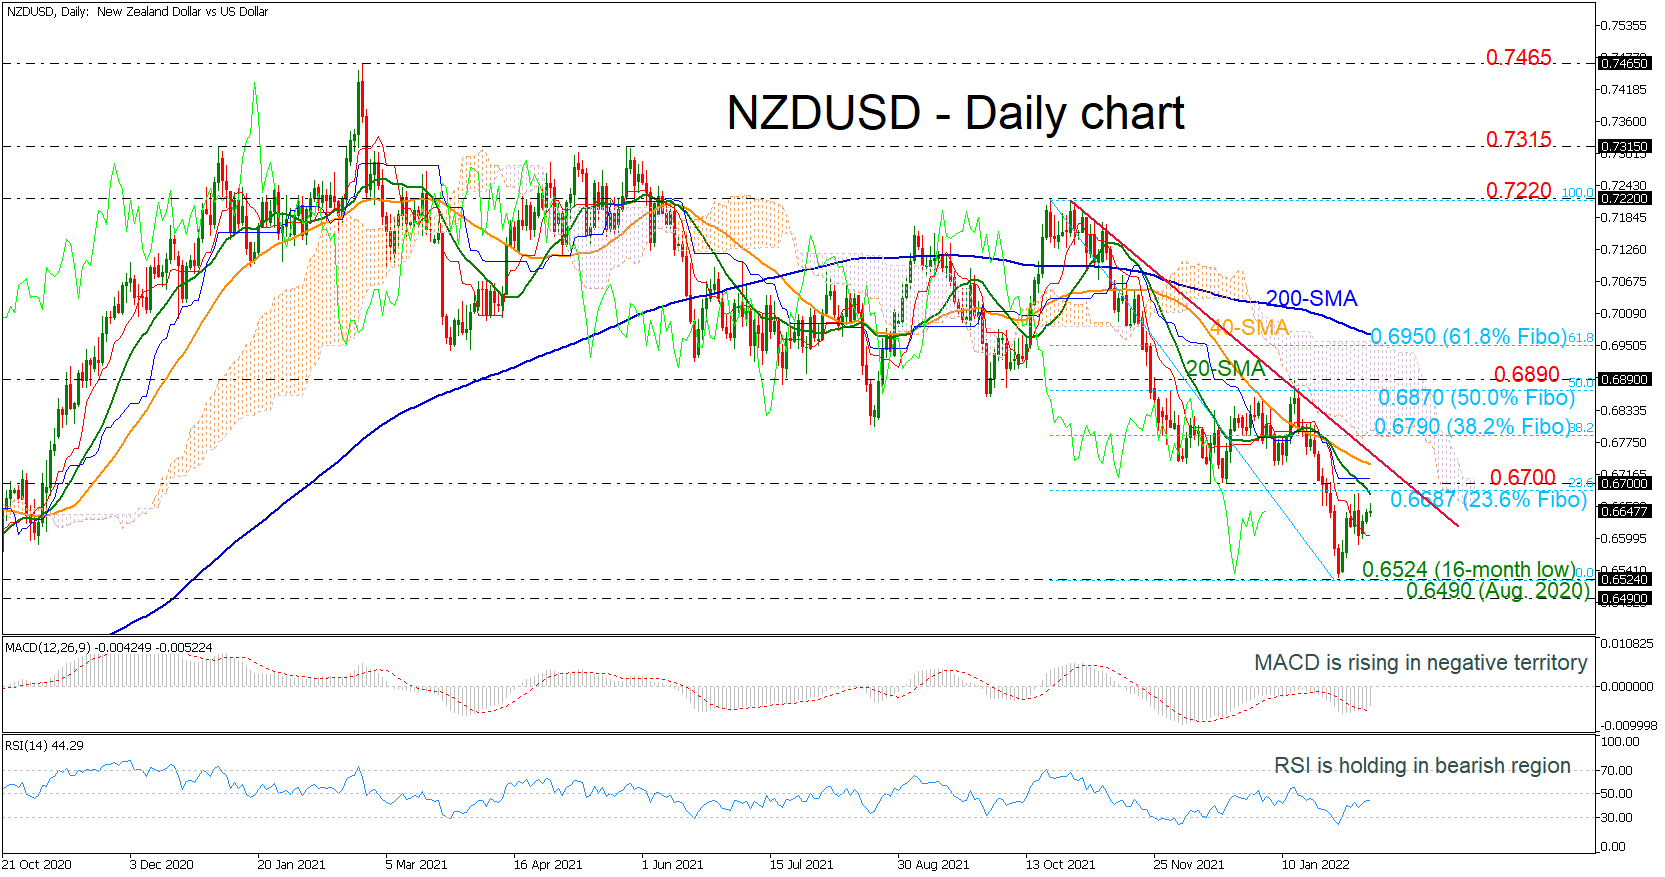
GBP/USD Technical Analysis
- GBP/USD faces resistance at 1.3642 and 1.3756
- There is support at 1.3400 and 1.3272
AUD/USD Outlook: Risk Appetite Lifts Aussie to Two-Week High
The Australian dollar extends advance into third straight day, lifted by fresh risk appetite that lifted stocks and reopening of Australia’s borders.
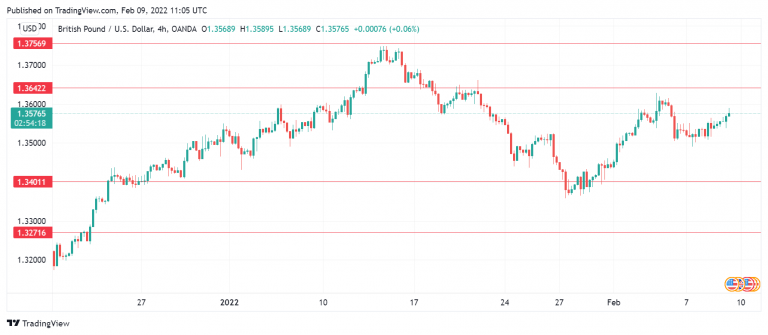
Bulls broke above last week’s high (0.7168) and pressure pivotal barriers at 0.7181/83 (Fibo 61.8% of 0.7314/0.6967 / base of thick daily cloud), break of which would open way for further advance and expose targets at 0.7232 (Fibo 76.4%) and 0.7248 (100DMA).
Broken daily Kijun-sen (0.7140) reverted to solid support which should ideally keep the downside protected.
Traders await US inflation data on Thursday for fresh signals.
Res: 0.7183; 0.7200; 0.7232; 0.7248.
Sup: 0.7161; 0.7140; 0.7101; 0.7065.
EUR/USD and AUD/USD Elliott Wave Analysis
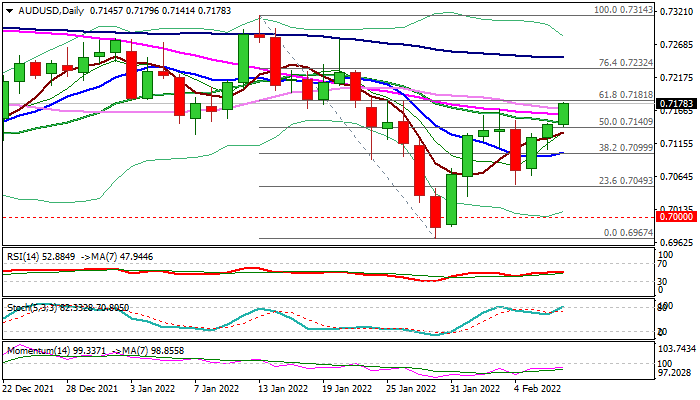
Markets are slow with US stocks trapped in range as everyone waiting on the US CPI tomorrow. As such, the buck is also mostly slow, moving sideways, but still looking corrective on intraday chart, so we think there can be more upside coming. Break above 1.1449 puts bulls in play.
EUR/USD 4h Elliott Wave analysis
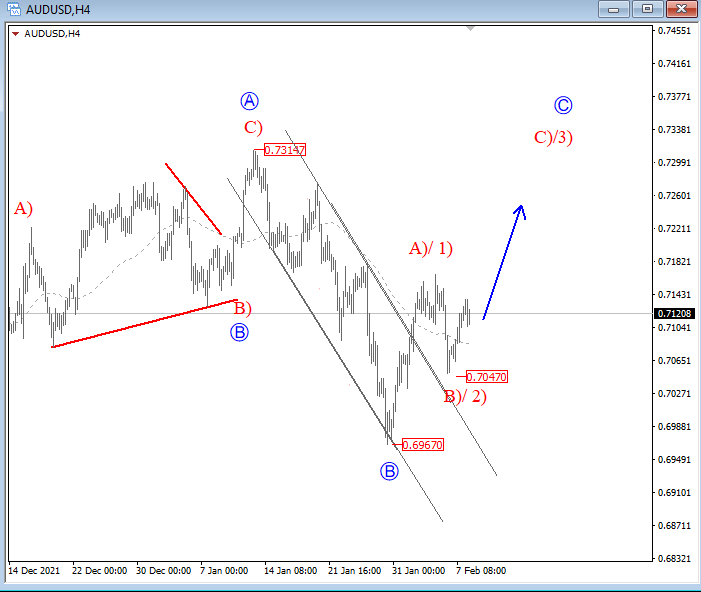
The latest recovery on Aussie is sharp and impulsive with price breaking the channel resistance line, so it appears that the market is bottoming. It can be only a temporary recovery as part of a wave C of a higher degree irregular correction, but even under this scenario there is room for more gains into subwave C)/3). Break above 0.7166 would make room for further strength this week.
AUD/USD 4h Elliott Wave analysis
https://www.youtube.com/watch?v=Picg00esApU
Bundesbank Nagel: ECB interest rates could rise this year
In a Die Zeit interview, new Bundesbank President Joachim Nagel said, "if the (inflation) picture does not change by March, I will advocate normalizing monetary policy." "The first step is to end net bond purchases during 2022," he said. "Then interest rates could rise this year."
Nagel also expects inflation in Germany to rise "significantly" above 4% in 2022. He warned that the economic costs of acting too late on inflation are significantly higher than acting early.
The Crypto Market Seems to be On Pause
On Tuesday, Bitcoin showed a growing momentum at the beginning of the day and reached five-week highs above $45,000. After a short-term rise above this level, a corrective decline began in the middle of the day. The benchmark cryptocurrency was losing more than $2,000 despite the rise in stock indices. There was a sharp rebound towards the end of the day and closed the day almost unchanged as a result.
Recovery in institutional demand for stocks late in the day on Tuesday helped Bitcoin stay above the 50-day moving average as well. Continued buying on the decline to this level will keep the technical picture bullish as upside momentum develops to $49-50K.
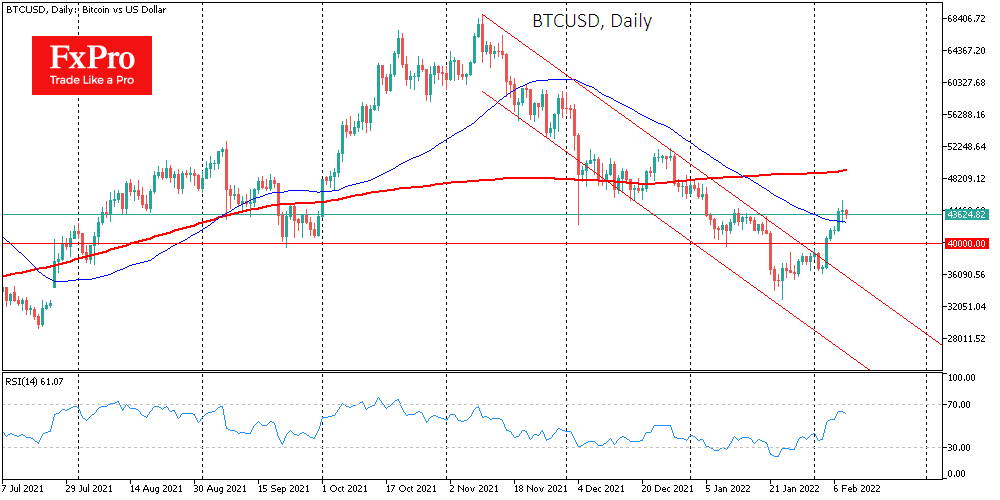
A sharp dip lower today or tomorrow will raise the issue of a false break and bring the sellers back into play, heading for $37-38K.
It became known that at the end of last week, the Canadian exchange fund Purpose Bitcoin ETF bought 1.75 thousand BTC in two days, which could lead to a sharp increase in prices. In addition, Valkyrie Investments has received approval from the SEC to launch an exchange-traded fund (ETF) based on the shares of companies that receive at least 50% of their profits through mining.
At the same time, the US authorities confiscated bitcoins stolen from the Bitfinex crypto exchange in 2016 for $3.6 billion and detained those involved in the hack. The Russian Federation government approved the concept of the Ministry of Finance for the regulation of cryptocurrencies: a joint bill should be ready by February 18.
Overall, Bitcoin gained 0.3% on Tuesday, ending the day around $44,200. Ethereum was down 1.3%, while the other leading altcoins in the top ten were mixed from a 5.7% decline (Binance Coin) to an increase of 5.4% (XRP).
GBPJPY Bullish But Loses Steam ahead of 157 Barrier
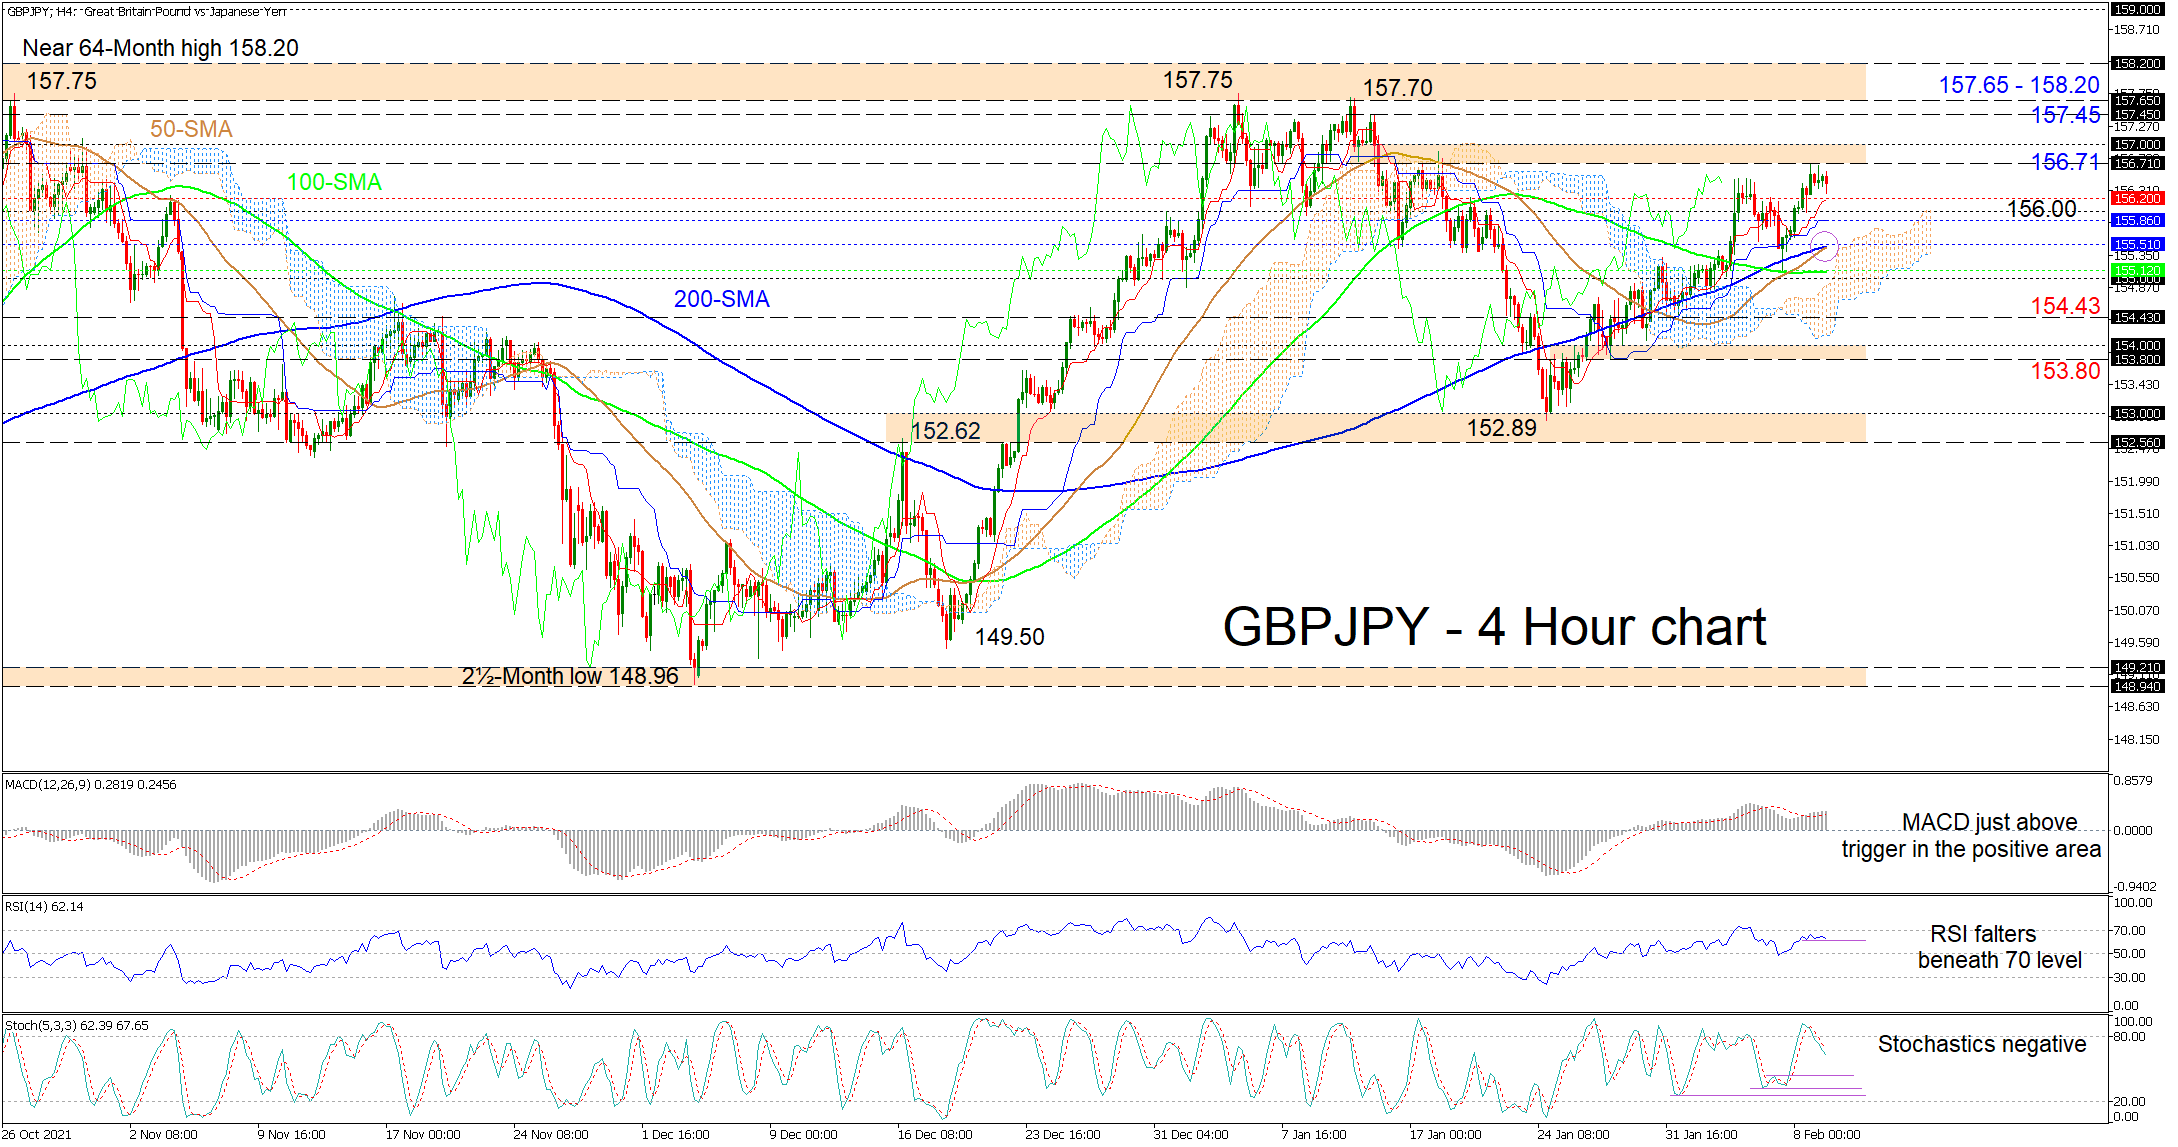
GBPJPY’s positive drive has become feeble after its two-week rally stretched to the 156.71 level, just shy of the 157.00 handle. The climbing 50-period simple moving average (SMA) and its near bullish crossover of the ascending longer-term 200-period SMA suggests the short-term rally may endure a while longer.
Currently, the Ichimoku lines are implying that upside forces are taking a breather, while the short-term oscillators are hinting of minor drawbacks in positive momentum. The MACD, in the positive region, is dipping marginally above its red signal line, while the RSI is struggling to keep a positive bearing ahead of the 70 level. The negatively charged stochastic oscillator is mirroring the pair’s preference to perform a minor pullback.
In the positive scenario, the immediate 156.71-157.00 resistance band may deter the rally from developing further. However, if additional advances unfold, the pair could then target the 157.45 barrier prior to challenging the adjacent 157.65-158.20 resistance section, which has been shaped by the multiple peaks stretching back to mid-October 2021. Triumphing over this barricade whose upper frontier is the more than five-year high, the price may then propel for the 159.00 hurdle.
Otherwise, if the price continues to run on fumes, the Ichimoku lines from 156.20 until 155.86, which surround the 156.00 mark, could act as an initial support area. Retreating further, the price may then meet the Ichimoku cloud’s upper band ahead of a tough section of support from the 200-period SMA at 155.51 until the 155.00 level. If selling interest persists, the near-term neutral-to-bullish picture may become vulnerable with the bears aiming for a test of the 154.43 low before sinking to the 153.80-154.00 support border.
Summarizing, GBPJPY’s neutral-to-bullish bearing is being questioned as upside pressures seem to be weak, currently lacking the ability to overstep the 156.71-157.00 impeding obstacle. That said, for negative tendencies to gain the upper hand, the price would need to glide beneath the 155.00-155.51 support zone.
Silver Crosses above 50-SMA as Positive Momentum Strengthens
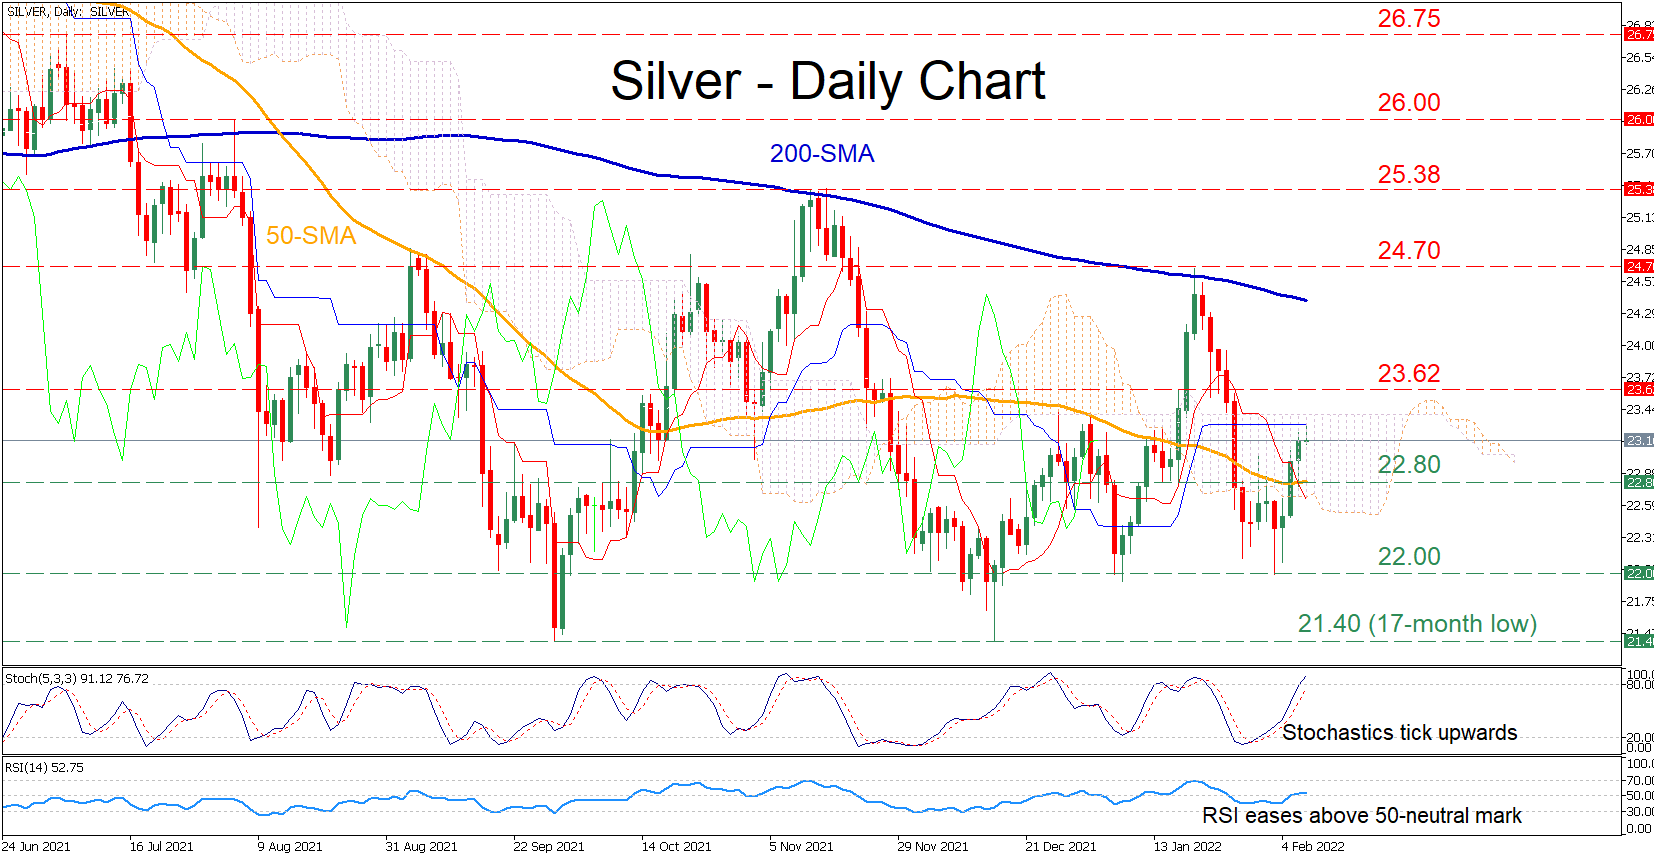
Silver has been trending downwards in the short term after its recent rebound was rejected by the 200-day simple moving average (SMA). However, in the last few daily sessions, the metal has gained traction, crossing above its 50-day SMA and recouping part of its losses.
The momentum indicators endorse the likelihood of a sustained recovery for the commodity. The stochastic oscillator is marching higher in the overbought area, while the RSI is hovering above its 50-neutral mark.
Should the positive momentum intensify, 23.62 might be the initial resistance point for the price. Crossing above this region, the bulls could target the January high of 24.70 before the price ascends towards the 25.38 barrier. Piercing through these resistance levels, the spotlight could turn to the 26.00 psychological mark.
On the flipside, if bearish forces regain the upper hand, the metal could encounter immediate resistance at its 50-day SMA, currently at 22.80. Further downside pressure may send the price to test the 22.00 psychological mark. Falling beneath this hurdle, the price decline could halt at the 17-month low of 21.40, which held strong twice in the last five months.
In brief, despite silver’s near-term rebound, its medium-term picture remains negative. For that bearish tone to reverse, the price needs to jump above the 25.38 region
BoJ Nakamura: Conditions not fallen into place for modifying monetary policy
BoJ board member Toyoaki Nakamura said, "I don't think conditions have fallen into place for Japan to modify monetary policy." He warned, "if we raise interest rates now or before wages pick up, we would be taking away from companies money that would otherwise have been used to raise pay."
He added, "we'll patiently maintain our ultra-easy monetary policy until wages begin to rise sustainably."
"For companies, what's most important is for currency rates to move stably. If the dollar/yen moves within the current range (of around 103-115), that will make it easier for companies to make business decisions," he added.
USDJPY Preserves Bullish Hopes Near Familiar Resistance
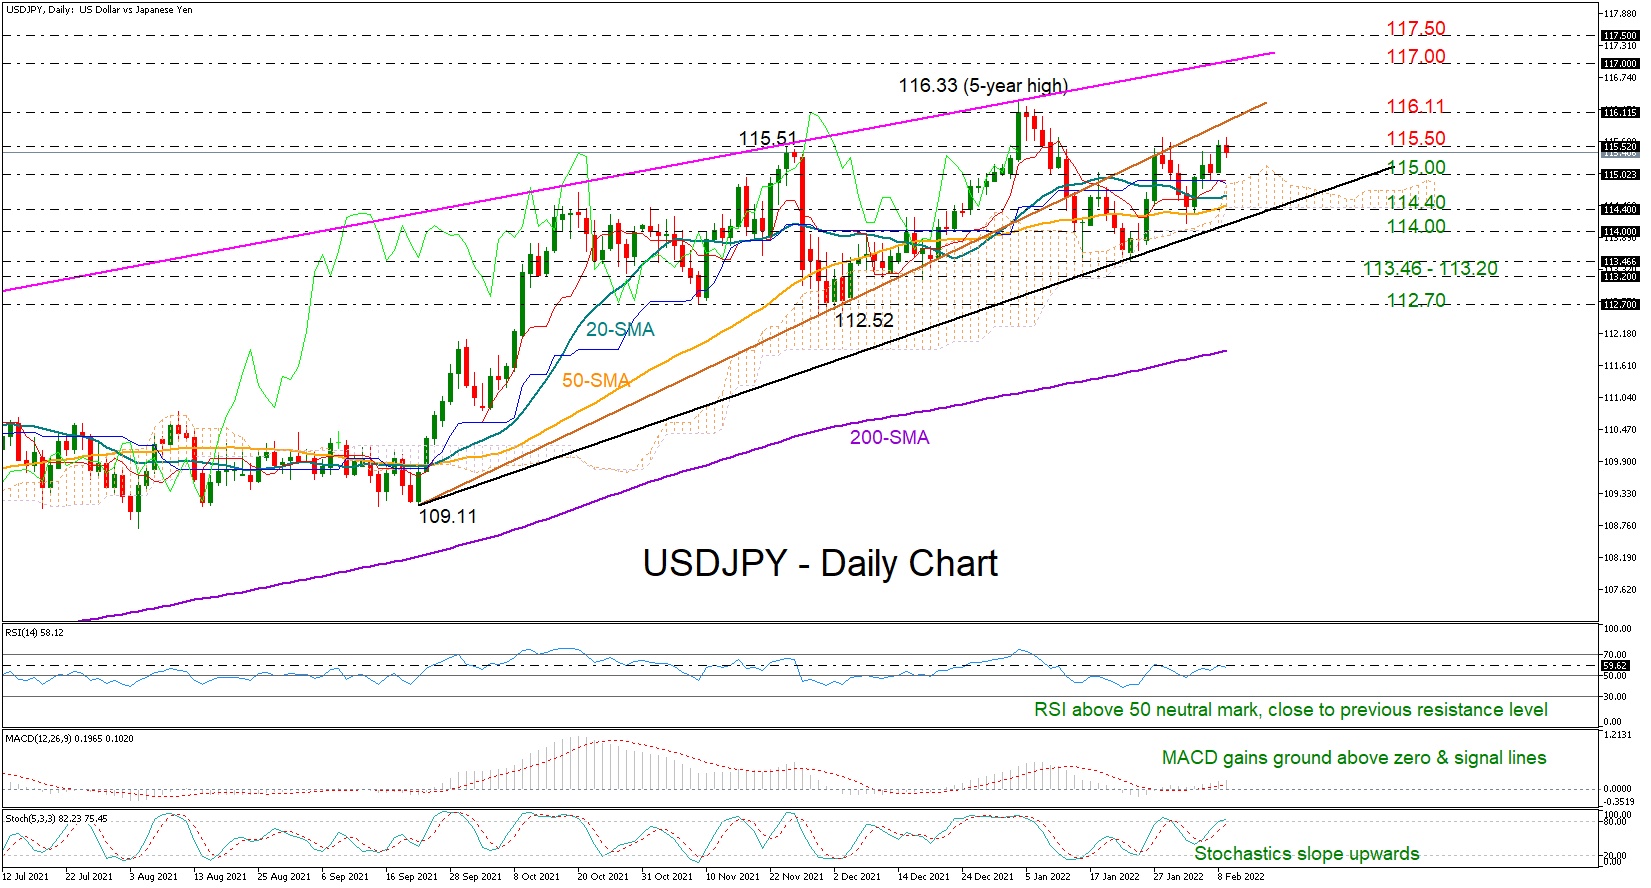
USDJPY revived its bullish momentum on Tuesday, but its efforts proved fruitless against the 115.50 border once again.
The bulls, however, may not give up the battle. With the MACD growing above its zero and signal lines and the RSI fluctuating comfortably above its 50 neutral mark, although close to its previous resistance territory, there is scope for further progress in the market. The Ichimoku lines endorse this view, as the red Tenkan-sen is set to cross above the blue Kijun-sen line.
As regards the market structure, the pair is still following a neutral trajectory in the short-term picture, though the new higher low at 114.14 registered earlier this month is an encouraging sign that buyers are gaining power.
A clear close above the 115.50 bar could see the price testing the key obstacle at 116.11, which the market was incapable of claiming in January despite touching a five-year high slightly above at 116.33. This is where the support-turned-resistance trendline from 109.11 is currently hovering. Hence, any step higher from here may add more fuel to the rally, likely bringing the 117.00 psychological mark and the 117.50 level last seen during the 2014 – 2016 period next in focus. The key resistance line, which joins all the highs from March 2021, could make this area more challenging.
On the downside, the 115.00 number could immediately come to the defense if sellers dominate. If it fails to hold, the decline could continue towards the 114.40 – 114.00 zone, where a tentative supportive trendline drawn from September’s lows is placed. Running lower, the pair may get congested within the 113.46 – 113.20 area before heading for the 112.70 handle.
In summary, USDJPY is preserving a bullish short-term bias despite facing a tough wall around the familiar 115.50 hurdle, making a move towards 116.11 possible.
NZDUSD looks bearish in medium-term; holds below downtrend line
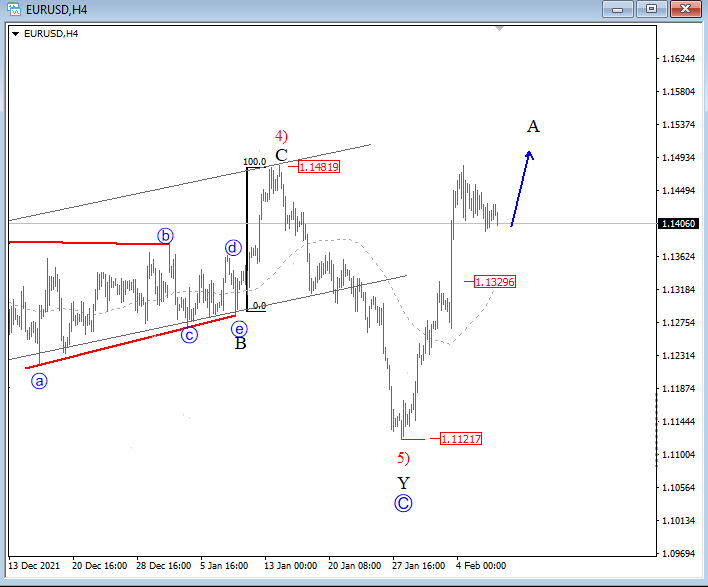
NZDUSD is struggling to gain strong positive momentum after its fast rebound from the 16-month low of 0.6524, stalling around the 20-day SMA, which overlaps with the 23.6% Fibonacci retracement level of the downward move from 0.7220 to 0.6524 at 0.6687 and within the 0.6700 psychological level.
The flattening mode in the RSI in the negative zone and the marginal positive move in the MACD below its zero level, justify the weak buying pressure keeping the short-term risk skewed to the downside.
Should selling forces strengthen, the 16-month low of 0.6524 will come under the spotlight. The low from August 2020 at 0.6490 could initially turn support to keep the bias on the positive side. Moving lower, the 0.6380 barrier could come next, registered in June 2020.
Alternatively, a close above the 0.6700 round number will brighten the broader outlook, pushing the price towards the 40-day SMA at 0.6735. Beyond that, the rally may gear up to the 38.2% Fibonacci of 0.6790 ahead of the 50.0% Fibonacci of 0.6870.
In brief, NZDUSD is facing a bearish bias, where a drop below the 16-month low of 0.6524 is expected to enhance selling interest.