
Sample Category Title
New Zealand BNZ manufacturing improves to 51.1, but momentum still modest
New Zealand’s BNZ Performance of Manufacturing Index edged up from 51.2 to 51.4 in November, remaining in expansionary territory but still below the long-run average of 52.4.
Production strengthened from 52.0 to 52.8, while employment rebounded sharply from contractionary 48.3 to 52.4, suggesting manufacturers are becoming more confident about staffing needs. That said, new orders softened notably, slipping from 54.5 to 51.9, highlighting lingering caution about the sustainability of demand beyond the seasonal boost.
Survey commentary was more encouraging. The share of negative comments fell to 45.6% from 54.1% in October and 60.2% in September. Respondents cited stronger Christmas-related demand, improving economic conditions, rising customer confidence, and a pickup in both domestic and overseas orders, alongside firmer construction activity and new product launches.
Cliff Notes: Price Pressures to Remain the Focus
Key insights from the week that was.
The RBA’s decision to leave the cash rate unchanged came as no surprise to the market, but the focus was always going to be on the RBA's take on the recent dataflow. In the event, the Monetary Policy Board conceded that part of the recent lift in underlying inflation “may be persistent”, but also that some was due to “temporary factors”. On activity, “private demand has strengthened, driven by both consumption and investment”, and, if it were to persist, would “likely add to capacity pressures”. Though the “risks to inflation have tilted to the upside” in the RBA's view, they do not appear to be in any rush to pre-emptively react to these risks, noting that “it will take a little longer to assess the persistence of inflationary pressures.”
Underlying the RBA’s assessment on the balance of risks is a somewhat more pessimistic view on supply capacity which, in the context of an economic upswing, begets a more hawkish tone around the inflation outlook. Our view on productivity, population and participation is more constructive, implying that the economy can handle a higher rate of growth without sparking excessive inflation. As temporary factors wash out, inflation should resume its trajectory toward the mid-point of the target range, providing scope to deliver two more rate cuts next year. If inflation dynamics take longer to normalise, the risk is that the cash rate could remain on hold for longer than our current base case.
Developments around the labour market will also be key for policy hence. The data continues to speak to a gradual softening as jobs growth across broad industry segments normalises. The November update revealed a decline in employment (–21.3k) which was ‘cushioned’ by an unexpected fall in the participation rate, resulting in the unemployment rate holding steady at 4.3%. We expect a bit more slack to open up over the next year, putting a lid on any upside risks to inflation stemming from the labour market.
Before moving offshore, a final note on business. The latest NAB business survey indicated that business conditions remained positive and generally steady around long-run average levels in November, notwithstanding a small decline. Business confidence was a little shakier in the month, but a more constructive picture around forward orders has allowed businesses to remain cautiously optimistic. As evidence of a sustained recovery continues to build, businesses will be able to expand capacity with a greater degree of confidence.
In the US, the FOMC cut the fed funds rate by 25bps to 3.625% at their December meeting but maintained its projection of only one further cut in 2026 and another in 2027, reaching a broadly neutral rate of 3.125% by end-2027. This cautious approach reflects expectations of above-trend growth through 2028, supported by real income gains and AI-driven infrastructure investment, seeing the unemployment rate ease back to 4.2%.
Inflation is only forecast to decline gradually from 3.0% in 2025 to 2.0% by 2028, implying moderately restrictive policy will achieve the dual mandate, eventually. We anticipate capacity constraints and persistent inflation risks will limit further easing by the FOMC to just one more cut, which is most likely to be seen in Q1 2026 before inflation proves more persistent than the Committee currently expects. The fed funds rate on hold at 3.375% with persistent inflation risks is likely to bias up long-term yields, particularly amid elevated fiscal uncertainty.
The Bank of Canada subsequently kept rates steady at 2.25%, maintaining an accommodative stance to support the economy as it navigates excess capacity and trade uncertainty. The Governing Council remain confident inflation will remain at target with the inflation rate having held close to their target of 2.0% for over a year and excess capacity and softer wage growth likely to offset any upside risk to consumer prices from trade. The labour market has strengthened in recent months but still remains weak compared to where it was prior to the pandemic.
In China meanwhile, consumer inflation accelerated to 0.7%yr in November as producer prices deflation became more even entrenched, with prices down 2.2%yr. The rise in consumer prices reflects increases in the cost of food and gold jewellery versus demand-led inflation which there is little-to-no evidence of. Further support centred on household consumption should broaden consumer inflation through 2026.
Producer prices are unlikely to sustainably grow until capacity tightens, however. This could be a long way off. 'Anti-involution' policies champion profitability, but this does not preclude new more productive supply being invested in to replace old ineffective capacity or to meet demand for new goods and services. Price declines and profitability can therefore co-exist sustainably.
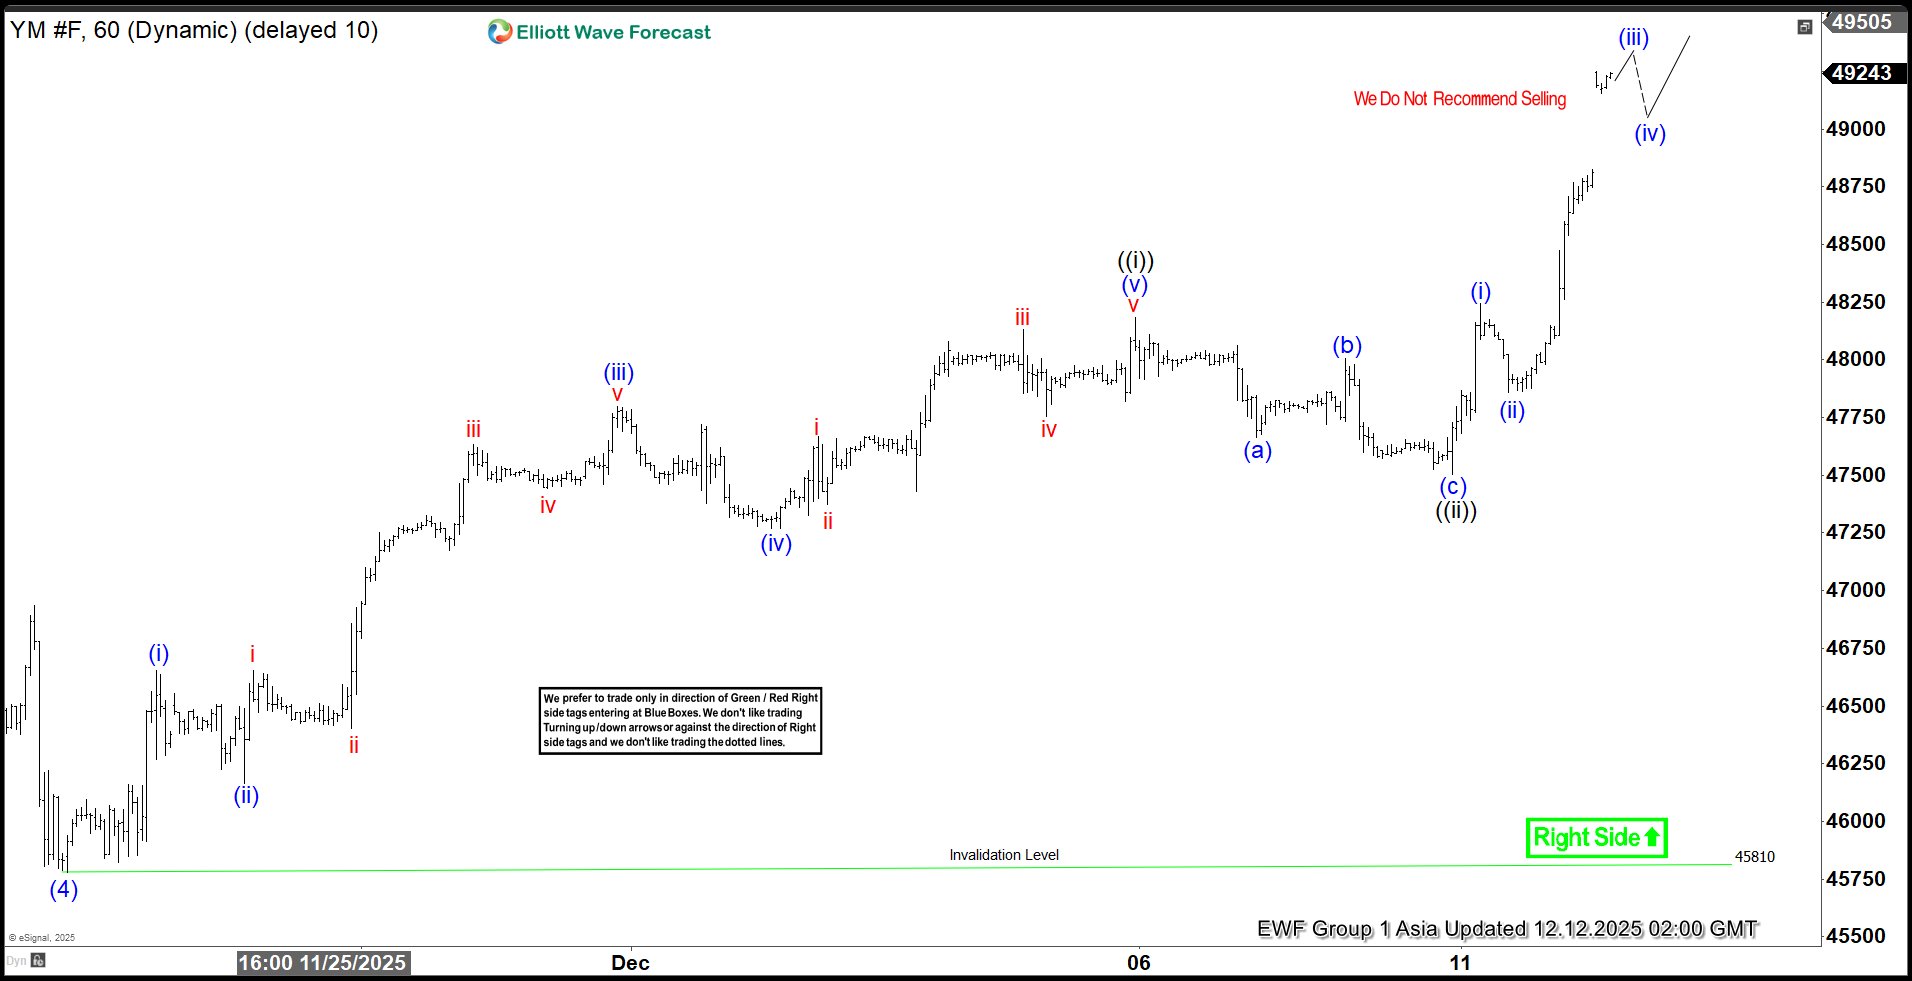
Dow Futures (YM) Bullish Path Projects 49,900 Level
The cycle from the April 2025 low in Dow Futures (YM) continues to unfold as a clear impulse. Within this structure, wave (4) concluded at 45,810, as illustrated by the one‑hour chart. Following that completion, wave (5) began to develop as another sequence of five waves of lesser degree. From the termination of wave (4), wave (i) advanced to 46,656, while the corrective pullback in wave (ii) reached 46,165. The Index then extended upward in wave (iii), achieving 47,796, before a modest retracement in wave (iv) ended at 47,270.
The final push in wave (v) carried prices to 48,184, thereby completing wave ((i)) of higher degree. Subsequent declines in wave ((ii)) unfolded in the form of a zigzag, consistent with Elliott Wave principles. From the peak of wave ((i)), wave (a) dropped to 47,663, followed by a rebound in wave (b) that reached 48,004. The final leg, wave (c), declined to 47,504, marking the completion of wave ((ii)) at the higher degree.
The Index has since resumed its upward trajectory in wave ((iii)). From the low of wave ((ii)), wave (i) advanced to 48,245, while the corrective wave (ii) ended at 47,859. In the near term, as long as the pivotal low at 45,810 remains intact, dips are expected to attract buyers. These corrective phases should unfold in the familiar 3, 7, or 11 swing sequences, supporting the continuation of the broader bullish cycle.
Dow Futures (YM) 60-Minute Elliott Wave Chart From 12.12.2025
YM Elliott Wave Video:
https://www.youtube.com/watch?v=mnZVSwMZypM
USD/JPY Signals Pullback—Is the Uptrend Finally Losing Steam?
Key Highlights
- USD/JPY failed to continue higher above 157.00 and corrected gains.
- It traded below a bullish trend line with support at 155.70 on the 4-hour chart.
- EUR/USD rallied above 1.1700 and 1.1720.
- GBP/USD regained momentum and cleared the 1.3380 resistance.
USD/JPY Technical Analysis
The US Dollar struggled to surpass 157.00 against the Japanese Yen. USD/JPY started a fresh decline below 156.50 and 156.00.
Looking at the 4-hour chart, the pair dipped below a bullish trend line with support at 155.70. The pair traded below the 50% Fib retracement level of the upward move from the 154.35 swing low to the 156.94 high.
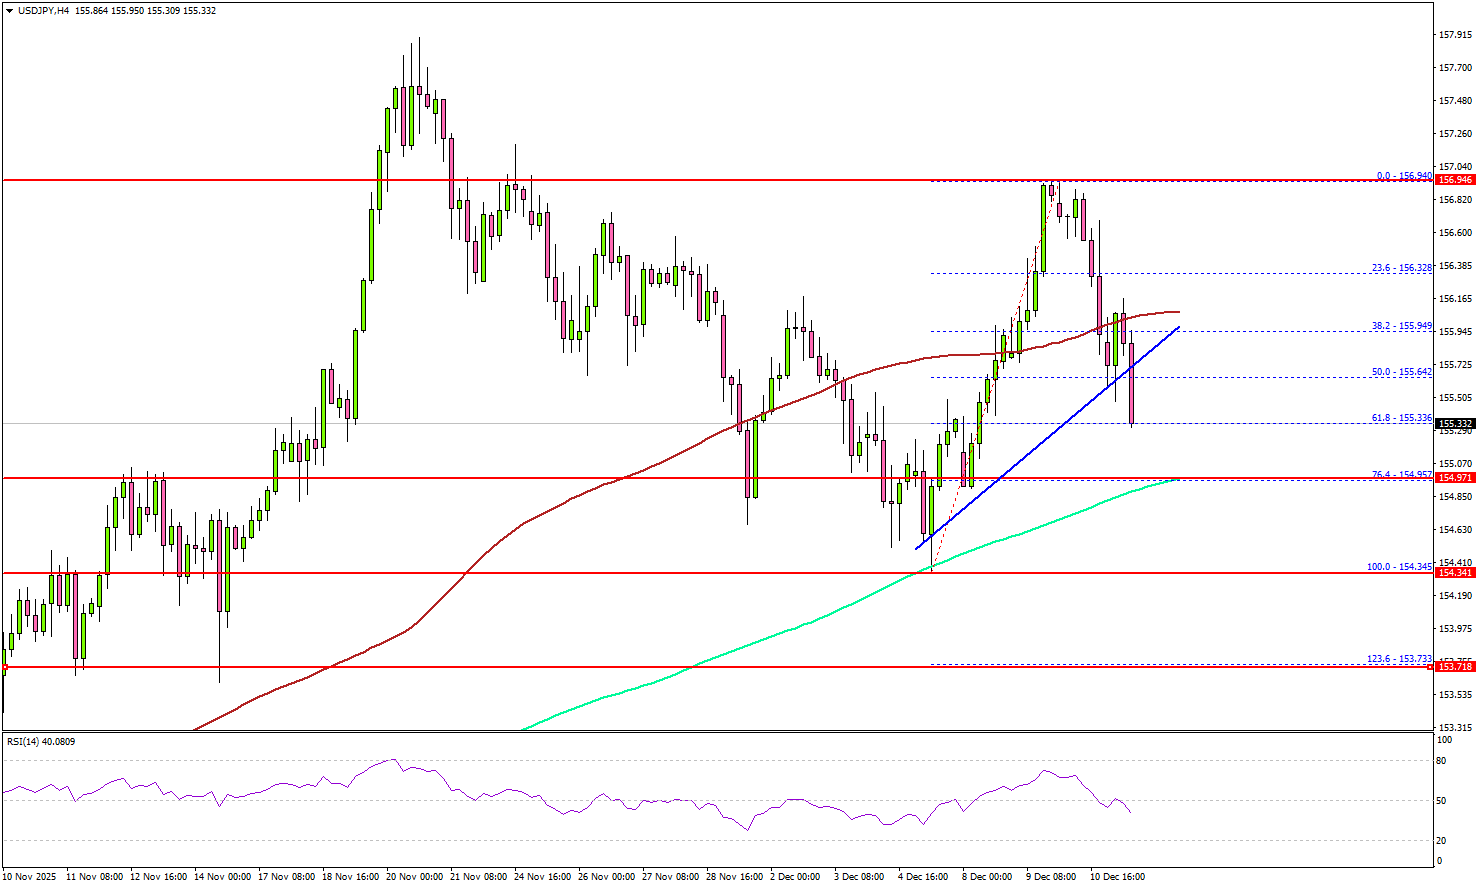
The pair settled below the 100 simple moving average (red, 4-hour). On the downside, there is key support at 154.95 and the 200 simple moving average (green, 4-hour). It coincides with the 76.4% Fib retracement level of the upward move from the 154.35 swing low to the 156.94 high.
The next support is 154.35. A close below 154.35 could open the doors for a test of 154.00. Any more losses might call for a drop to 152.50.
Immediate resistance sits near 156.00. The first key hurdle is seen near 156.30. A close above 156.30 could open the doors for a move toward 157.00. Any more gains could set the pace for a steady increase toward 158.00.
Looking at GBP/USD, the pair gained pace for a strong increase and was able to clear the 1.3380 resistance zone.
Upcoming Key Economic Events:
- Fed's Hammack speech.
- Fed's Goolsbee speech.
- Fed's Paulson speech.
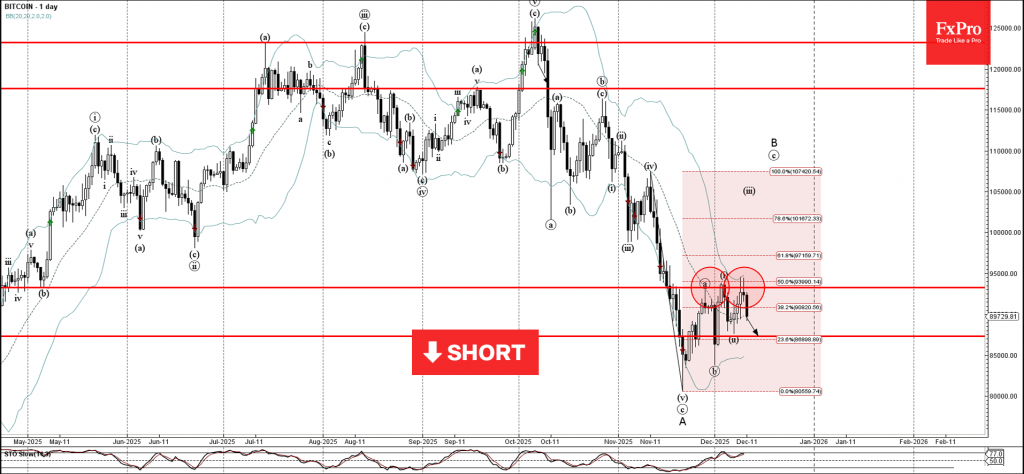
Bitcoin Wave Analysis
Bitcoin: ⬇️ Sell
- Bitcoin reversed from resistance area
- Likely to fall to support level 87330.00
Bitcoin cryptocurrency recently reversed down from the resistance area between the pivotal resistance level 93285.00 (which has been reversing the price from November) and the upper daily Bollinger Band.
This resistance area was further strengthened by the 50% Fibonacci correction of the downward impulse from last month.
Bitcoin cryptocurrency can be expected to fall to the next support level 87330.00 (which reversed the earlier wave ii).
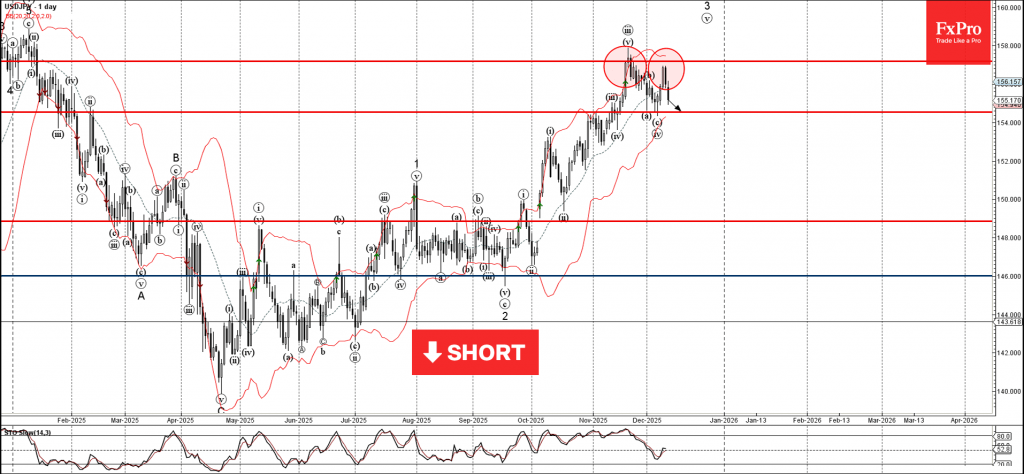
USDJPY Wave Analysis
USDJPY: ⬇️ Sell
- USDJPY reversed from resistance area
- Likely to fall to support level 154.50
USDJPY currency pair recently reversed down from the resistance area between the strong resistance level 157.20 (former monthly high from November) and the upper daily Bollinger Band.
The downward reversal from this resistance area created the daily Japanese candlesticks reversal pattern Bearish Engulfing.
Given the strongly bearish US dollar sentiment seen today, USDJPY currency pair can be expected to fall to the next support level 154.50 (low of the previous waves (a) and (c)).
ECB Preview: Hold On, We’re Not Hiking
- We expect the ECB to leave the deposit rate unchanged at 2.0% on Thursday 18 December in line with consensus and market pricing.
- • Data has come in stronger than expected by ECB staff, so we expect an upward revision to the growth forecasts amid inflation little changed.
- • We see the ECB holding rates steady at 2.0% in both 2026 and 2027 due to inflation undershooting in contrast to market expectations of 37 bp worth of hikes.
- We expect a muted market reaction as Lagarde will likely signal ECB being on hold for a while, reiterating the ‘good place’ assessment.
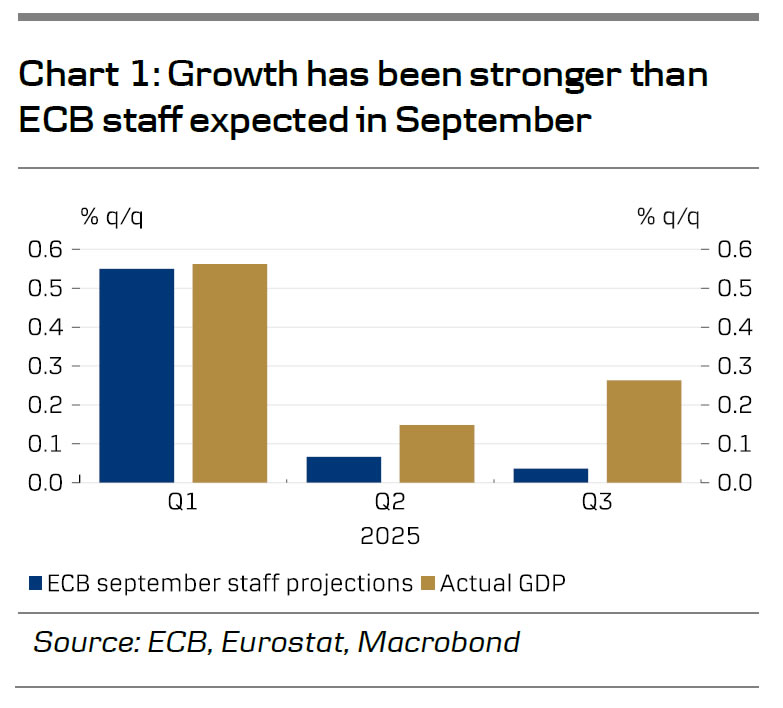
We expect the ECB to leave the deposit rate unchanged at 2.0% at the meeting on December 18, in line with consensus and market pricing. Since the last meeting both inflation, growth, and wages have come in stronger than expected by the ECB. The euro area economy grew 0.3% q/q in Q3 compared to 0.0% q/q projected (see chart 1), core inflation is set to average 2.4% y/y in Q4 compared to the 2.2% projection, and wage growth rose to 4.0% y/y in Q3 in contrast to an expected decline to 3.2% by the ECB staff. These positive data surprises combined with the decent PMIs in both October and November support the “good place” assessment of the ECB, thereby reducing the chances of further rate cuts.
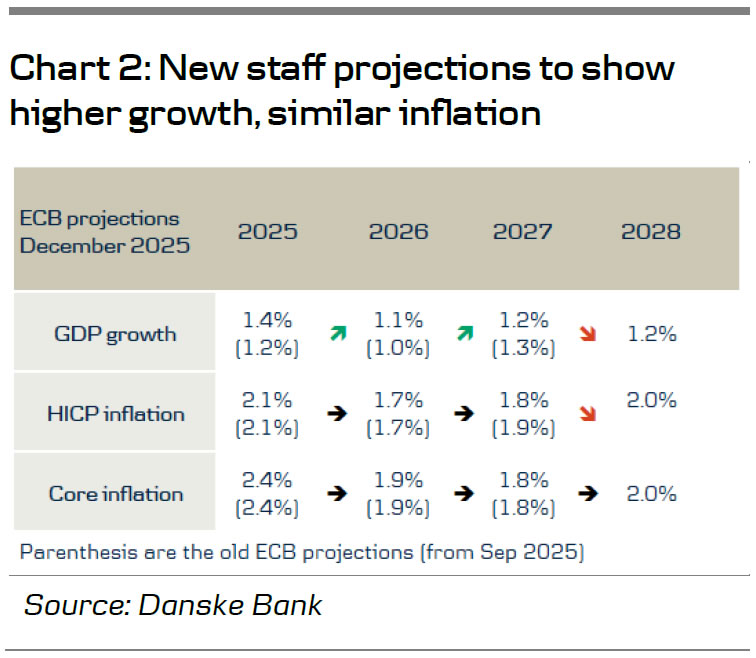
The meeting will also unveil new staff projections, including 2028 for the first time. We expect growth forecasts to rise to 1.4% y/y for 2025 (from 1.2%) and 1.1% y/y for 2026 (from 1.0%), with 1.2% for both 2027 and 2028. Inflation is likely to remain largely unchanged, except for a revision to 1.7% y/y for 2027 (from 1.8%) due to the delayed ETS2, with 2028 projected at 2.0% y/y (see chart 2). While growth is likely revised up headline and core inflation is at the same projected below target in both 2026 and 2027, which we believe limits the case for rate hikes by the ECB. We therefore see the ECB holding rates steady at 2.0% in both 2026 and 2027.
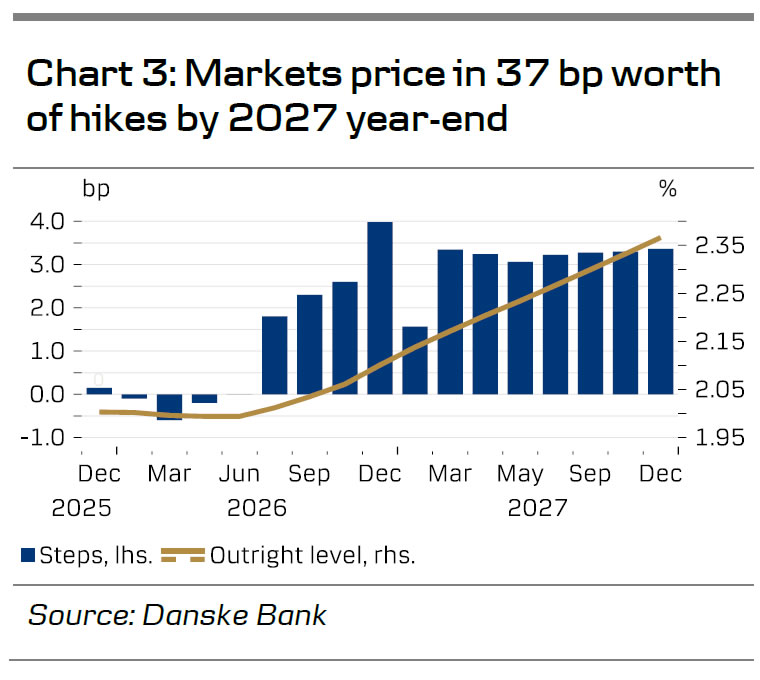
There is a growing disagreement within the ECB on the rate outlook where Schnabel sees inflation risks tilted to the upside and thereby is “comfortable” with market pricing that the next move will be a hike. This comment combined with stronger than expected wage growth has fueled a significant reprising of the outlook for the ECB, with expectations for cuts next year completely erased and markets now pricing 37bp worth of hikes before 2027 year-end (see chart 3). A push-back against Schnabel’s comments by Villeroy saying he sees “no reason to raise ECB rates soon” and Simkus expecting 2% “at further meetings” has done little to alleviate the pressure in the market.
While we have long had a paying bias in the short end of the euro swap curve, we cautiously believe that the magnitude of recent moves is overdone. Yet, we highlight the rise in real rates is due to the expectation of stronger growth and not lower inflation, which means that a pushback from the ECB is less pressing. On the back of this, we believe that Lagarde will signal that they will be on hold for a while, reiterating that the ECB is in a good place, data-dependent, and not pre-committing to a particular rate path. We therefore expect a limited market reaction.
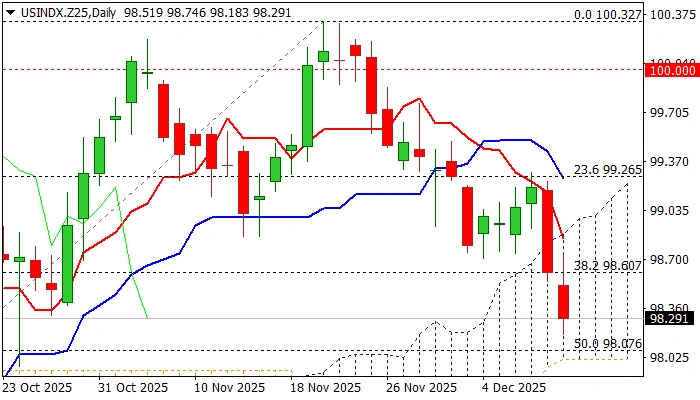
Dollar Index: Bears Accelerate After Fed, on Track for Third Consecutive Weekly Loss
The Dollar Index extends steep-post-Fed fall into second straight day, hitting the lowest in six weeks on Thursday.
Fed’s 25 basis points rate cut and relatively dovish Chair Powell’s comments deflated the dollar across the board, with 0.85% drop in past 24 hours, contributing to broader weakness and keeping the index on track for the third consecutive weekly loss.
Fresh acceleration lower penetrated into ascending and thickening daily Ichimoku cloud and broke below Fibo 38.2% of 95.82/100.32 rally, bringing in focus key supports at 98.07/01 (50% retracement/cloud base.
Violation of 98.00 zone would generate fresh bearish signal for extension towards 97.54 (Fibo 61.8%) and 97.10 (Oct 1 higher low).
Meanwhile, increased headwinds at cloud base should be anticipated, with consolidation / limited correction to be ideally capped by broken Fibo 38.2% (98.60) and limited upticks to stall under cloud top (98.87) to keep bears in play and offer better levels to re-enter bearish market.
Firmly bearish daily studies support scenario.
Res: 98.60; 98.87; 99.00; 99.30.
Sup: 98.01; 97.76; 97.54; 97.10.
Gold (XAU/USD) Forecast: $4250/oz Holds the Key for Bullish Continuation
Gold prices have fallen from a post FOMC high of $4250/oz to lows around $4206/oz in early US trade. Market participants are assessing the Federal Reserve’s (Fed) monetary policy outlook after the latest interest rate cut.
Mixed FOMC Keeps Markets Guessing
On Wednesday, the Federal Reserve (Fed) carried out another interest rate cut of 25 bps, which put the new target range for the policy rate at 3.50%-3.75%, exactly as expected.
The decision, however, was not unanimous, passing with a 9-3 vote; one member wanted a larger cut of 50 bps, while two others wanted to keep the rates unchanged. Despite the cut, the price of gold did not rise much because the Fed did not offer a strong or clear outlook for future rate decisions.
As discussed in the FOMC Preview article this week, the dot plot and forward guidance were always likely to hold more importance at the meeting. This certainly proved true looking at the reaction of the precious metal since.
Fed Chair Jerome Powell repeated that the central bank is "well-positioned to wait and see how the economy evolves." These comments confirmed that the Fed is taking a "wait-and-see" approach after cutting rates three times this year (a total of 75 basis points).
Nevertheless, since policymakers still disagree on whether more rate cuts will be needed in 2026, market participants are unsure about the future direction of policy, which is keeping the price of gold stuck in the same trading range it has been in for over a week.
Market expectations however, have not changed much. Looking at the latest data from LSEG and markets are still pricing in around 57 bps of rate cuts through December 2026.
Implied Rates for Federal Reserve
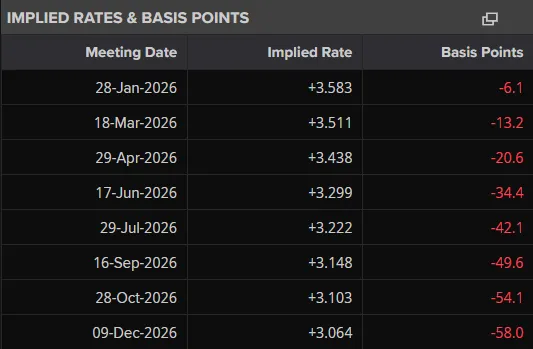
Source: LSEG
Ahead of the meeting markets were pricing in around 76 bps of cuts (including yesterday). This shows that there hasn't been much change and this could explain Gold's malaise today.
FOMC Impact on the US Dollar and Outlook
The FOMC meeting yesterday was likely the most significant event that could positively impact the markets before the end of the year.
Since that event has now passed, the US dollar might start to experience its typical seasonal weakness as the year concludes. This could cause the US Dollar Index (DXY) to gradually fall toward the 98.00 level and potentially lower.
Looking ahead at events that could spark some volatility in the US Dollar in the days and weeks before the January Fed meeting.
There is a large amount of new economic data scheduled for release. However, Fed Chair Powell cautioned that this data might be misleading or inaccurate because of technical problems caused by the government shutdown.
Market participants are now turning their attention to the upcoming November jobs report, which is due next Tuesday. Additionally, there are several other rate meetings scheduled by major central banks over the next ten days.
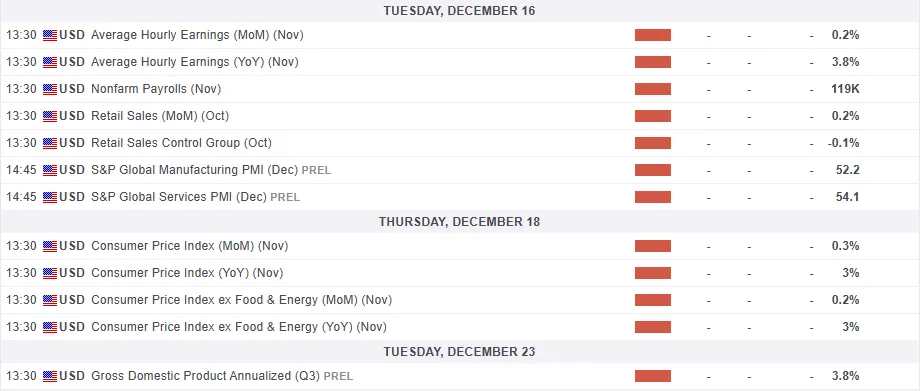
For all market-moving economic releases and events, see the MarketPulse Economic Calendar. (click to enlarge)
Geopolitical Risk
Another factor to keep in mind heading into the year-end is the ongoing US-Venezuela dynamic. Any escalations or fall of government could add to safe haven demand and thus aid Gold in its bullish rally.
This may prove to be a saving grace for those eyeing $4300/oz handle for the precious metal. Without such a catalyst, i am not sure Gold can sustain its current bullish momentum in the last three weeks of December. This could leave the precious metal in for a correction ahead of 2026.
Technical Outlook - Gold (XAU/USD)
Looking at the four-hour chart below, the technical picture is decent for bullish continuation.
The key is the most recent high near the key 4250 handle which has served as resistance before as well on December 5.
A four-hour candle close above this level will be needed if bulls are to seize the initiative.
The period-14 RSI remains above 50 which is a sign of bullish momentum.
A move above 4250 brings 4259 and 4275 into focus.
A pullback from here brings the 50-day MA into focus at 4209 before the 4190 and 100-day MA at 4166 into focus.
Gold (XAU/USD) Four-Hour Chart, December 11, 2025
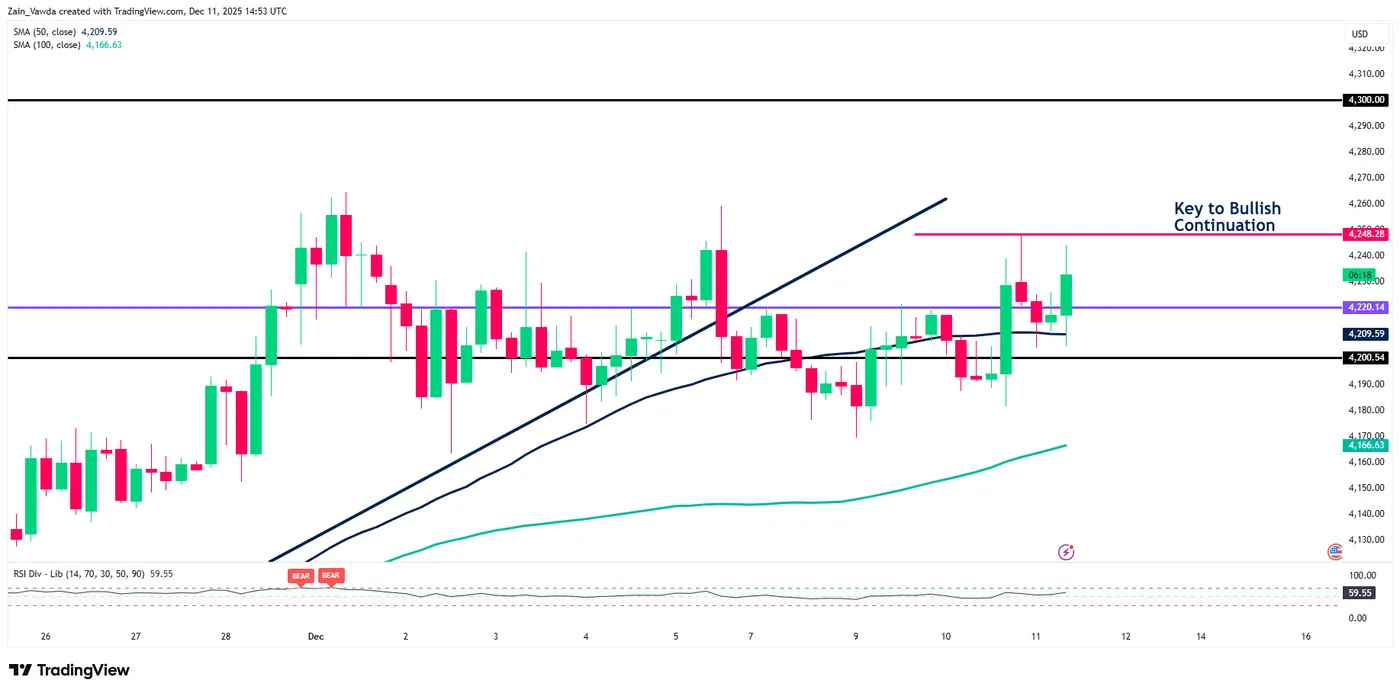
Source: TradingView (click to enlarge)