
Sample Category Title
China CPI hits 21-month high, but weak demand keeps PPI in deep negative
China’s November inflation data paint a picture of an economy showing modest signs of surface-level improvement while still grappling with entrenched deflationary pressures.
CPI accelerated from 0.2% yoy to 0.7% yoy, matching expectations and marking a 21-month high. The gain was driven primarily by food prices, which rose 0.2% yoy after a -2.9% yoy drop in October. Core inflation held steady at 1.2% yoy, while energy prices slid -3.4% yoy—an even deeper decline than the prior month.
On a monthly basis, CPI fell -0.1% mom after October’s 0.2% mom increase, contrary to expectations for another rise.
PPI slipped from –2.1% yoy to –2.2% yoy, extending China’s factory-gate deflation streak into a fourth year. Manufacturers continue to cut prices aggressively to clear excess supply, a sign that domestic and external demand remain too weak to absorb output.
Coal mining prices tumbled -11.8% yoy, while the oil and gas extraction sector saw a -10.3% yoy decline—deep drops that suggest little improvement in industrial profitability.
AUD/USD Pushes Higher—Is the Pair Targeting a Fresh Multi-Day Peak?
Key Highlights
- AUD/USD gained pace for a move above the 0.6600 resistance.
- A key bullish trend line is forming with support at 0.6620 on the 4-hour chart.
- EUR/USD failed to continue higher above 1.1680.
- USD/JPY started a fresh increase above the 156.00 resistance.
AUD/USD Technical Analybsis
The Aussie Dollar started a strong increase above 0.6550 against the US Dollar. AUD/USD even cleared the 0.6600 barrier to enter a positive zone.
Looking at the 4-hour chart, the pair settled above the 0.6600 level, the 100 simple moving average (red, 4-hour), and the 200 simple moving average (green, 4-hour). A high was formed at 0.6648, and the pair is now consolidating gains.
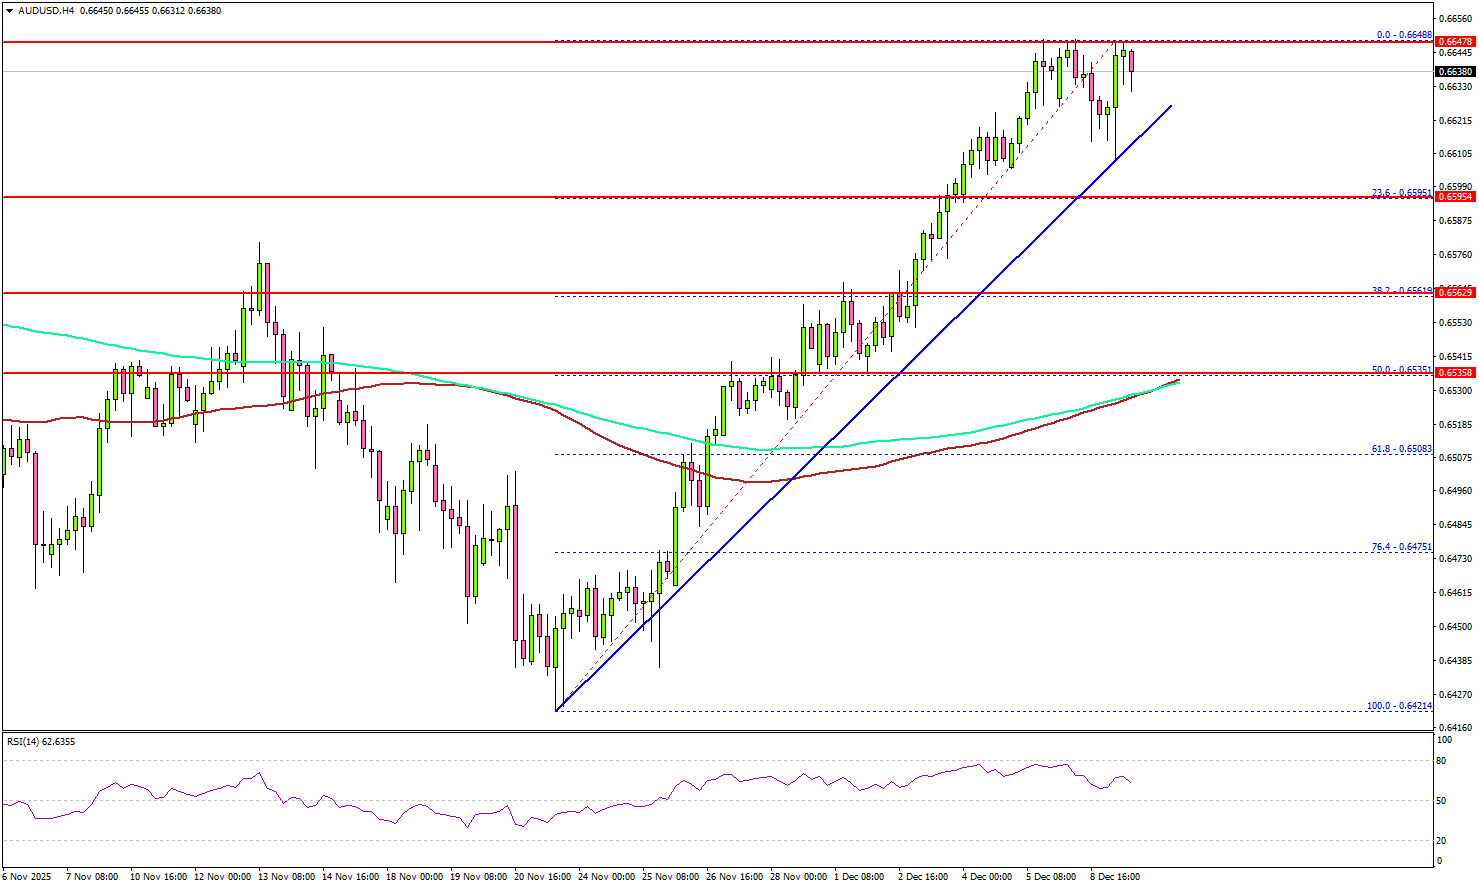
There is also a key bullish trend line forming with support at 0.6620. Immediate resistance sits near 0.6650. The first key hurdle is seen near 0.6665.
A close above 0.6665 could open the doors for a move toward 0.6700. Any more gains could set the pace for a steady increase toward 0.6740. On the downside, there is key support at 0.6620 and the trend line at 1.1620.
The next support is 0.6595 and the 23.6% Fib retracement level of the upward move from the 0.6421 swing low to the 0.6648 high. A close below 0.6595 could open the doors for a test of 0.6560.
The main support sits near the confluence zone at 0.6535, the 100 simple moving average (red, 4-hour), the 200 simple moving average (green, 4-hour), and the 50% Fib retracement level of the upward move from the 0.6421 swing low to the 0.6648 high.
Looking at EUR/USD, the pair failed to extend gains above 1.1680 and recently corrected lower.
Upcoming Key Economic Events:
- BoE's Governor Bailey speech.
- ECB's President Lagarde speech.
- BoC Interest Rate Decision – Forecast 2.25%, versus 2.25% previous.
US Curve Outlook: Why US Treasury Yields Surging Before Fed
We will now turn to a more technical look into the US curve, a 10-Year Bond chart to see what's going on behind the pricing for tomorrow's meeting, and provide a few more scenarios depending on the rate cut path.
More particularly, with the 25 bps cut being a quasi-certainty, we will provide potential scenarios on if the cut is hawkish or dovish and a few potential reactions.
A first move to signal in Markets, is the recent move higher in US treasuries across the curve.
Mentioned many times across our analyses on MarketPulse, the speech from NY Fed's Williams, a very influential speaker, affected Markets on a large scale:
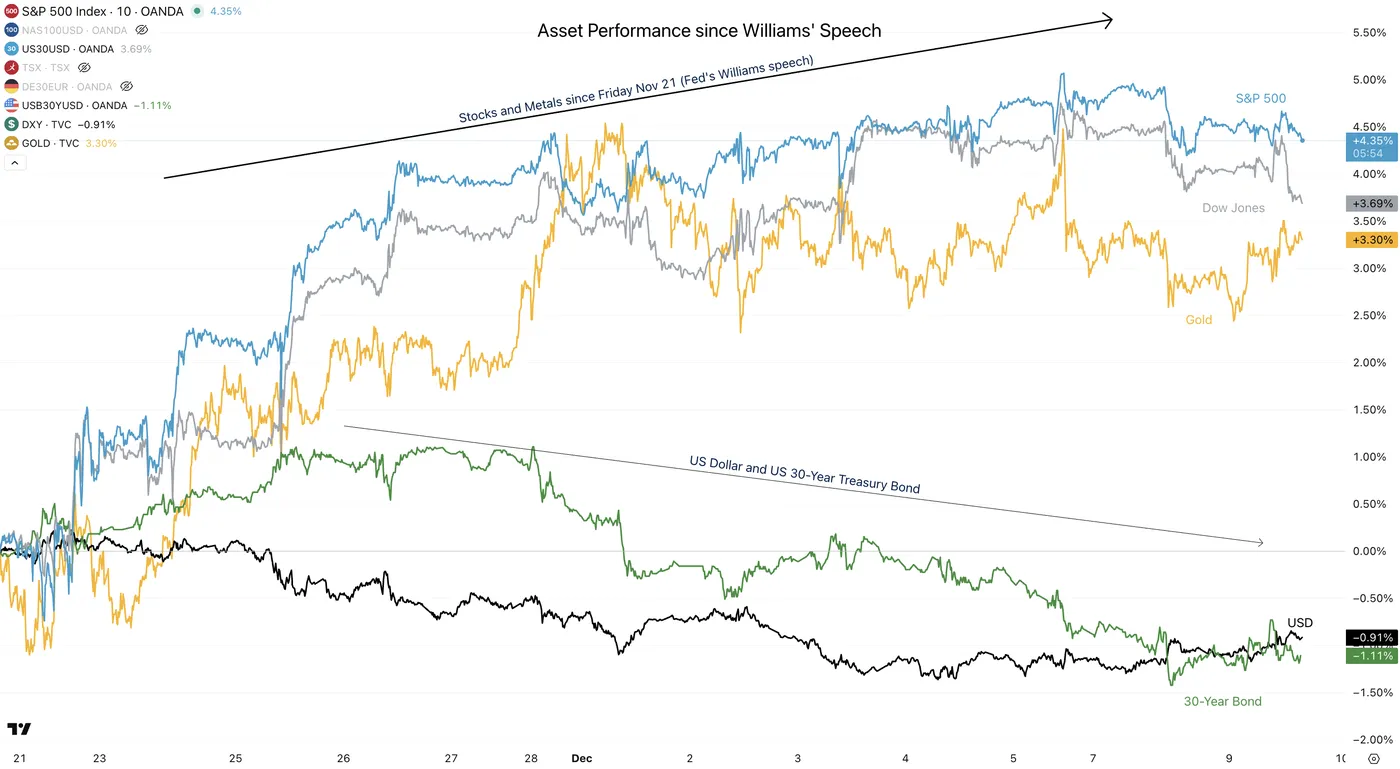
Asset Performance since Williams' Speech – Source: TradingView
Counter-intuitively, the speech that re-introduced possibilities of lower rates (which you can find right here) led a huge rebound in Stock Markets and Metals, but similarly preceded a move between +15 bps to +20 bps in US treasuries.
But why?
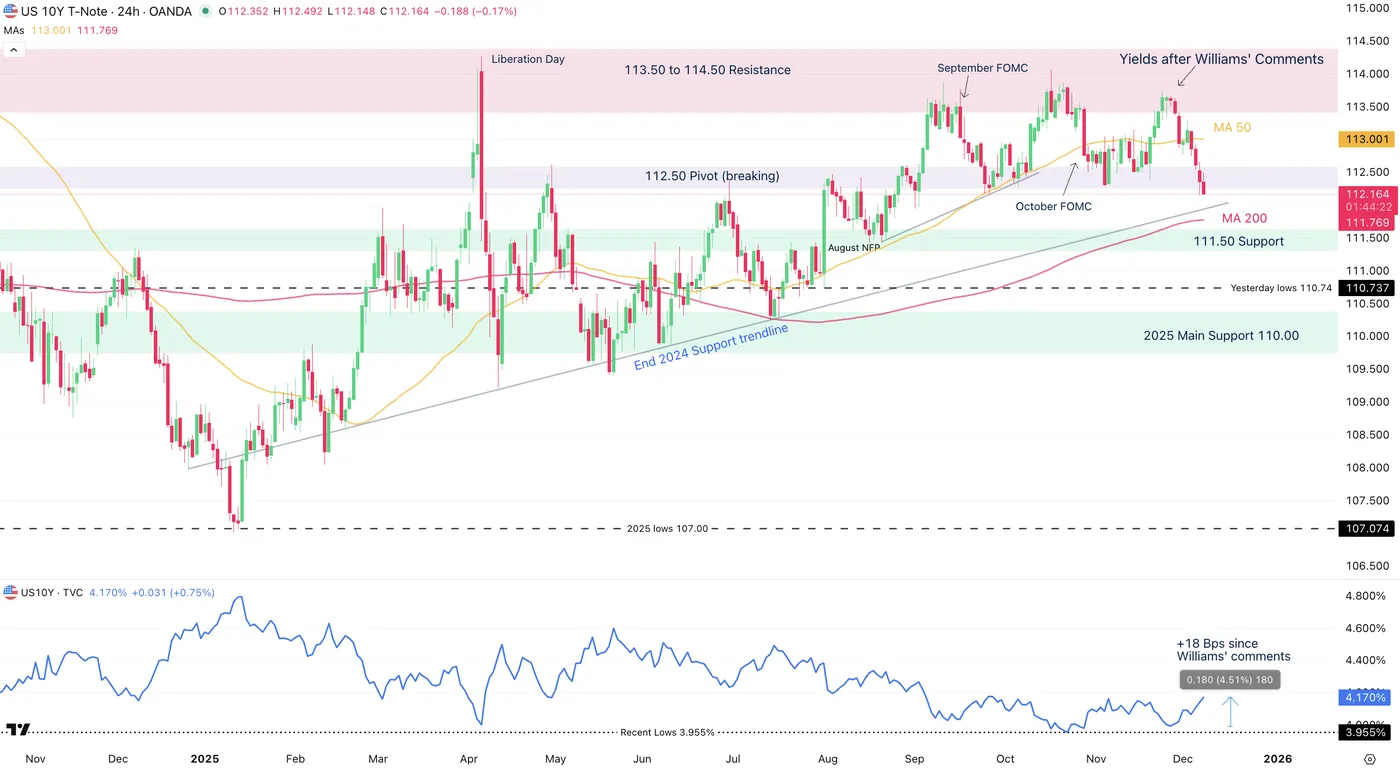
US 10-Year Bond with 10Y Yield underlay – December 9, 2025 – Source: TradingView
Never forget the sell-the-news effect – At least for the bonds!
The reasoning behind this move is a microcosm of the 2025 trend: A fear of an influenced Federal Reserve, which may fast-forward its rate-cut cycle at the cost of their data-dependency–or even their independence!
As explained in our recent pre-FOMC analysis, the 25-bps move could be one done with a blind eye – most of the data released throughout the past month is data dating back to September, such as the PPI and Retail Sales data (which corroborated a slowdown).
However, at the same time, more actual data also sent mixed signals, particularly regarding Labor – Weekly Jobless Claims came in at the lowest level since September 2022 just a week ago, while ADP Private Payrolls showed a regressing picture.
Until now, the Fed had been remarkably resilient about taking preemptive decisions without a clear consensus on why to hike or cut – and this shift in perspective also comes amid still uncertain tariff-led inflation outlooks.
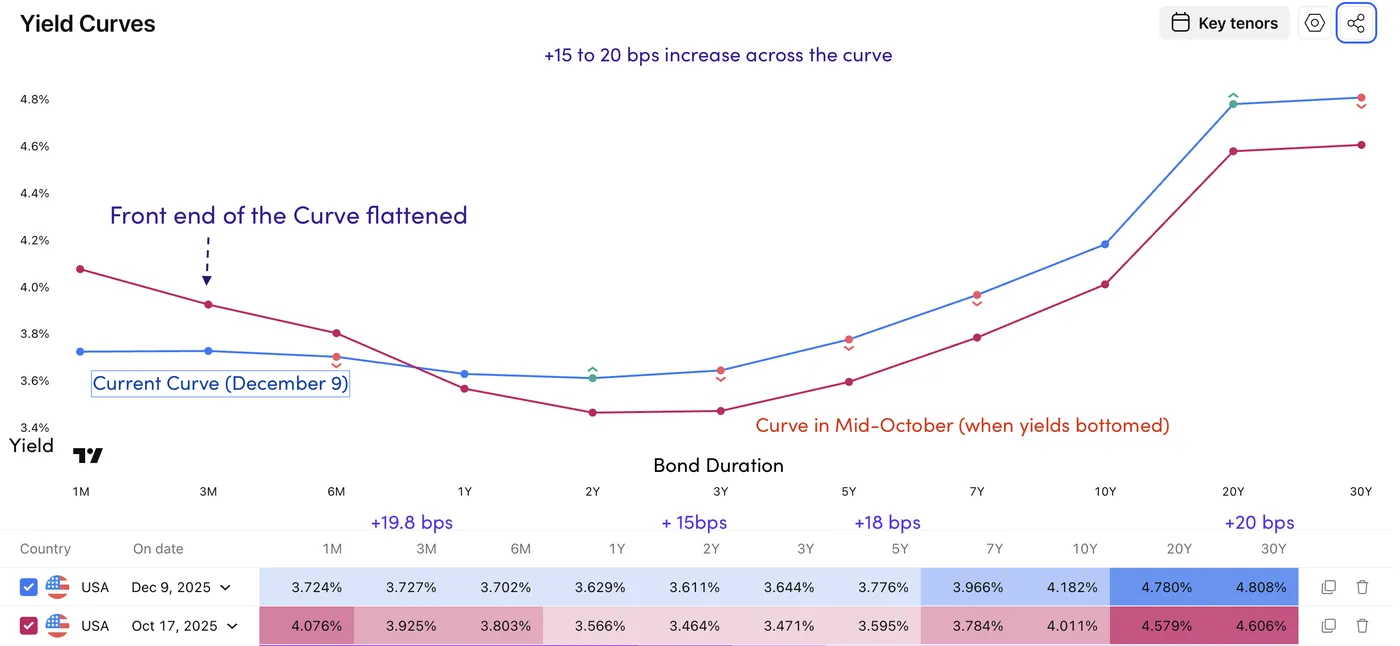
The US Curve: Mid-October vs Today – A 15 to 25 bps increase throughout all durations
The Greenback falling at the same time as yields rising indicates an increased premium for holding US debt.
Many words to describe the same phenomenon: The Debasement Trade.
If you haven't heard about this term, you can find a stellar definition right here. To summarize, it's a financial trend shifting away from fiat currencies and governmental assets to focus on finite assets, such as Stocks, Cryptocurrencies, and Metals.
Coming back to the curve picture from above, the front-end flattened quite aggressively, implying Rates staying put for a longer-while after this cut.
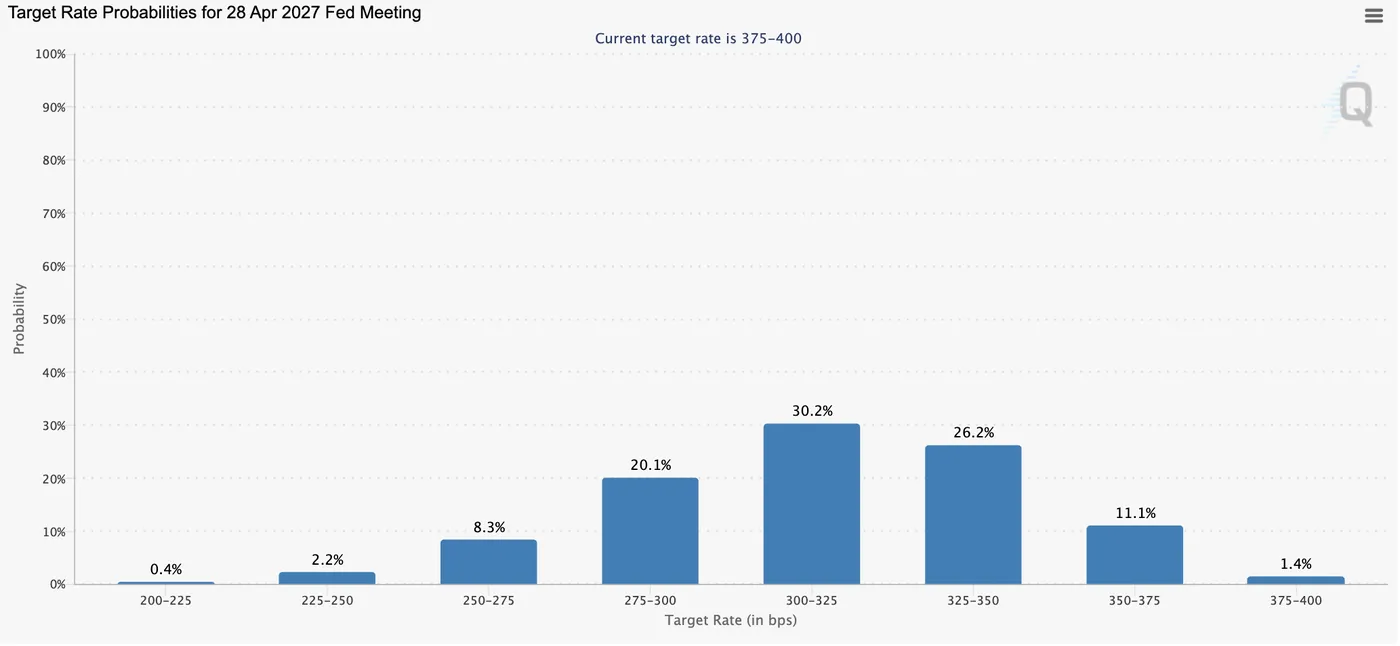
Mid-2026 Pricing: 50% odds of a 3% Neutral Rate – Source: TradingView
This takes us to our expectations for tomorrow:
Scenarios and probabilities:
A hawkish cut (70% chance)
This is the base case for tomorrow's decision (in my opinion).
Powell should indicate a risk-management move after the streak of negative private payrolls data combined with a not-aggravating inflationary picture.
To balance out these words, expect the Fed Chair to point out to a blinded Fed due to the Bureau of Labor Statistics closure and delayed data, particularly for NFP.
Reactions in Major assets
- Upcoming rate cut probabilities decrease to price a pause in the waiting for more data
- The US dollar maintains its ongoing consolidation range (between 99.00 to 100.00 on the Dollar Index)
- Stock Indexes correct due to their ecstatic post-Williams repricing
- Short-end yields shoot higher while long-end yields stay put (Harsh bear flattening)
- Metals correct slightly
A dovish cut (10% chance)
Jerome Powell folds and makes extensive mentions on the private labor market while reducing mentions of inflation.
Reactions in Major assets
- Rate cuts get front-loaded (moved forward) aggressively but leaves VERY volatile future pricings
- The US Dollar falls off a cliff and goes to retest the yearly lows
- Stock Indexes flash to new all-time highs but may find struggles as Fed Independence doubts rage back
- Short-end yields shoot lower while long-end yields shoot higher (Strong steepening)
- Metals explode to new all-time highs and keep running higher
A dovish pause (20%)
The Fed decides to hold their breath due to a lack of data but keep a strong option on rate cuts in the short-term.
This one is the most tricky.
Most participants expect a cut, but this would quickly shift the current pricing:
Reactions in Major assets
- 2026 Rate cuts get front-loaded on a smaller extent
- The US Dollar rallies to hold above/close to the 100.00 level.
- Stock Indexes see VERY volatile swings and form a large range
- The curve stays put, long-term yields go lower (small Bull flattening)
Metals correct slightly
This article wasn't the most common, but I hope it will be instructive.
Safe Trades!
Ethereum Wave Analysis
Ethereum: ⬆️ Buy
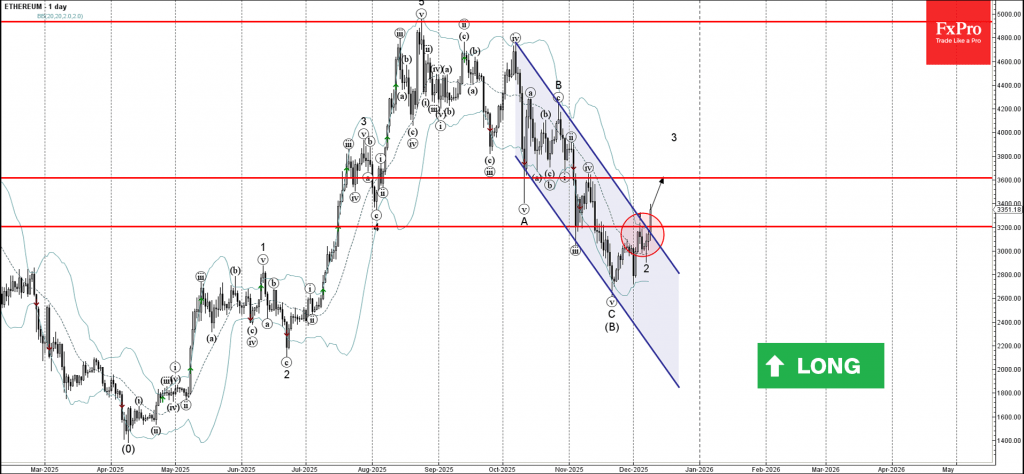
- Ethereum broke daily down channel
- Likely to rise to resistance level 3600.00
Ethereum cryptocurrency recently broke the resistance zone between the resistance level 3200.00 (which stopped the previous impulse wave 1) and the resistance trendline of the daily down channel from October.
The breakout of this resistance zone accelerated the active impulse wave 3 of the sharp intermediate impulse wave (C) from November.
Given the bullish sentiment seen across the crypto markets today, Ethereum cryptocurrency can be expected to rise to the next resistance level 3600.00.
EURJPY Wave Analysis
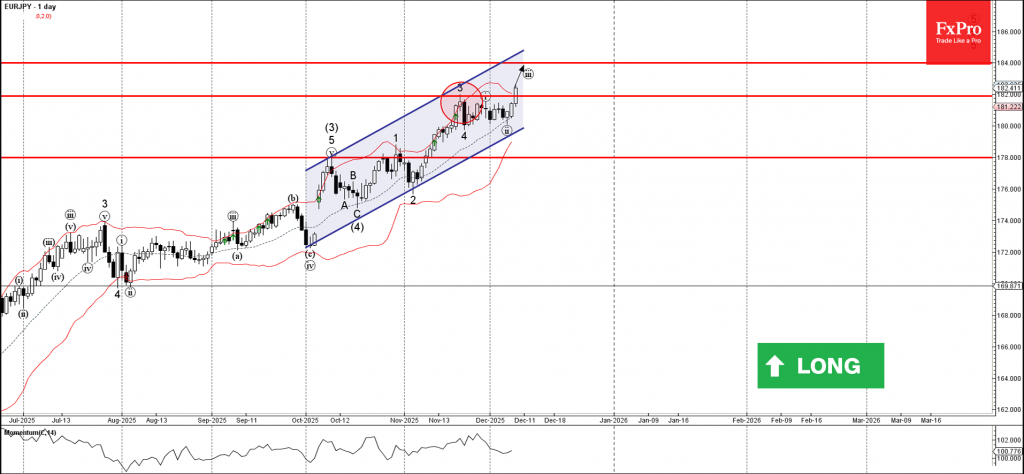
EURJPY: ⬆️ Buy
- EURJPY broke key resistance level 182.00
- Likely to rise to resistance level 184.00
EURJPY currency pair recently broke above the key resistance level 182.00 (which has been reversing the price from the middle of November stopping earlier waves 3 and i).
The breakout of the resistance level 182.00 accelerated the active impulse wave iii – which belongs to wave 3 of the intermediate impulse wave (5) from October.
Given the clear daily uptrend and strong yen sales seen today, EURJPY currency pair can be expected to rise to the next resistance level 184.00 (target price for the completion of the active impulse wave iii).
Market looks for BoC to validate long hold view, EUR/CAD targets 1.6, and then 1.58
Canadian Dollar is one of the month’s top performers as markets grow increasingly confident that the BoC has concluded its easing cycle and entered a prolonged pause. Expectations for a steady hold tomorrow are well-priced, and confirmation from Governor Tiff Macklem could open additional upside for Loonie, particularly in crosses.
The central bank is widely expected to leave rates unchanged after nine cuts over the past 17 months. Macklem signaled in late October that policymakers may be done reducing rates after lowering the policy rate to 2.25%. While the bank continues to stress that the economy is undergoing a “difficult transition” due to structural damage from the U.S. trade conflict, it has also noted that monetary policy has limited room to stimulate demand while keeping inflation anchored.
Incoming data since then have strengthened the case for a hold. Q3 GDP grew at a 2.6% annualized pace versus the BoC’s projection of 0.5%. Employment rose by 54k in November, extending the steady gains seen in September and October. Underlying inflation remains above the 2% target and risks proving stickier than the bank would prefer. These developments reinforce the conclusion that the easing cycle has run its course.
Markets will focus on whether Macklem explicitly affirms this long-pause stance in the statement and press conference. Clear communication on this front could further underpin CAD strength into early 2026.
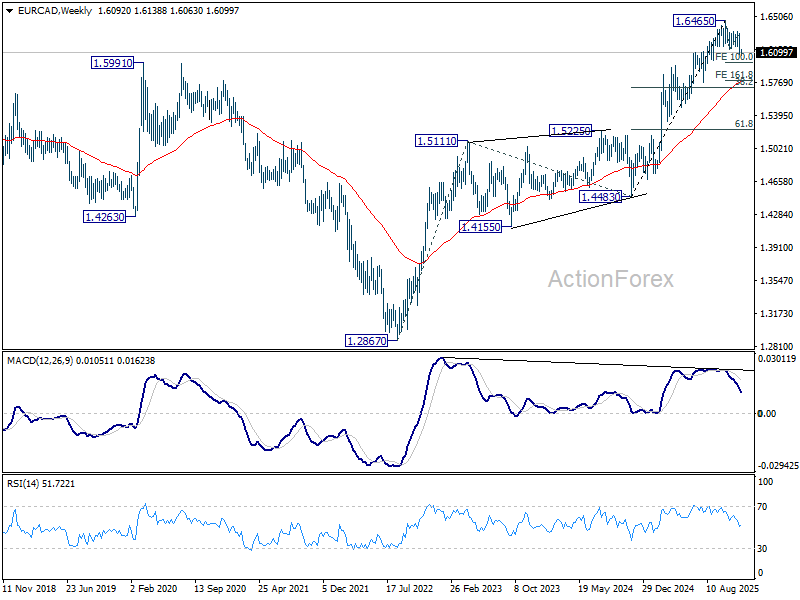
Technically, EUR/CAD's fall from 1.6456 resumed by breaking through 1.6138 support last week. Considering bearish divergence condition in D MACD, the decline is likely correcting the whole rise from 1.4483. Further fall is expected as long as 55 4H EMA (now at 1.6201) holds. Next target is 100% projection of 1.6465 to 1.6138 from 1.6317 at 1.5990.
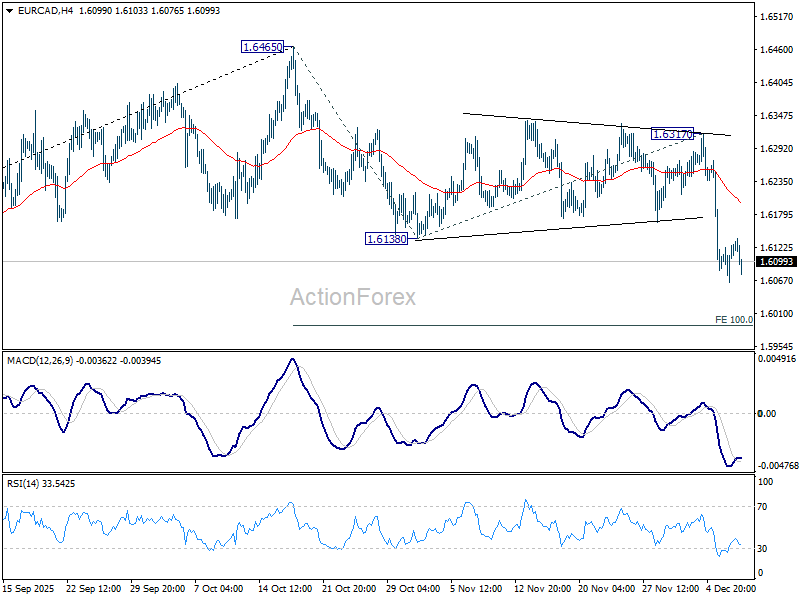
Decisive break there will solidify this near term bearish case and bring downside acceleration to 161.8% projection at 1.5788 next.
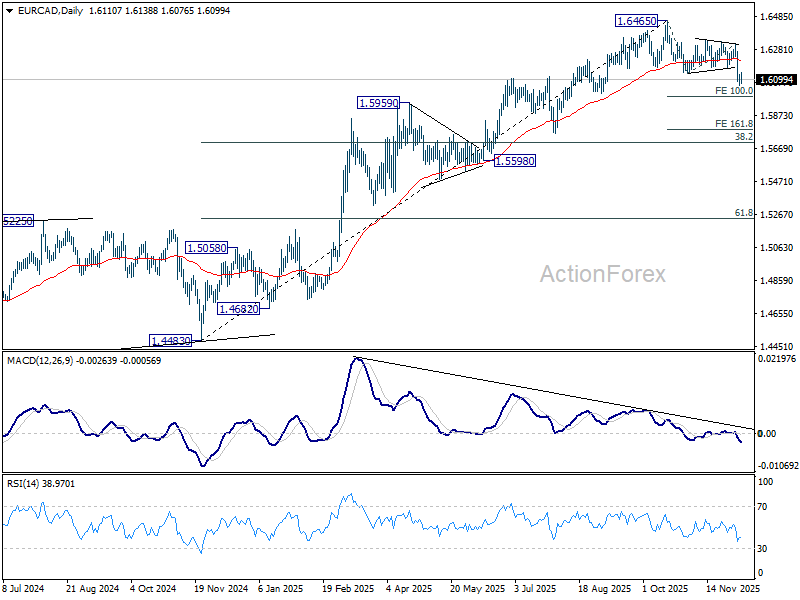
Nevertheless, in the picture, strong support is likely to be seen between 38.2% retracement of 1.4483 to 1.6465 at 1.5708 and 55 W EMA (now at 1.5780) to contain downside and bring rebound.
Yen Rout Continues: USD/JPY Surges to New Monthly Highs Despite Key Rate Decisions
The Japanese Yen rout shows no signs of abating, pushing the USD/JPY pair to yet another set of monthly highs despite tomorrow’s highly anticipated rate cut from the Federal Reserve, combined with expectations of another hike in Japan.
The decisive driver behind the Yen's continued weakness is the market's profound distrust of the Japanese monetary and fiscal coordination.
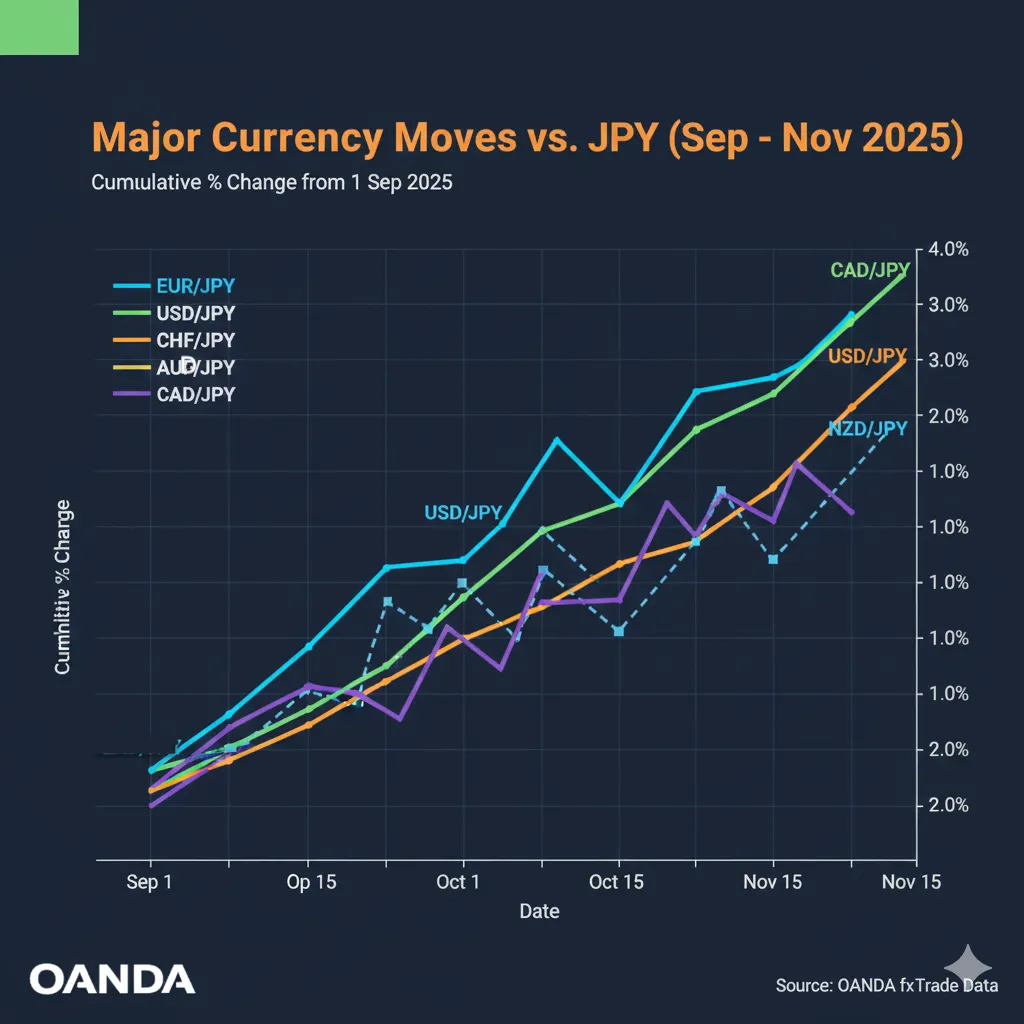
Japanese Yen against other major currencies – Generated with the help of Gemini
On one side, Prime Minister Sanae Takaichi’s government has pushed through gigantic stimulus with a stance the market deems fiscally reckless, leading to the original flash higher in USD/JPY – Reassuring words from the PM haven't had the best reception.
On the other side, Bank of Japan Governor Kazuo Ueda is desperately trying to signal a normalization shift.
In recent remarks, Ueda emphasized that the "certainty of the BoJ’s outlook materializing is increasing gradually," and that current policy remains "accommodative," even after previous minor adjustments.
Still, Traders deem the divergence in both policies not being sustainable and leading to a confidence extinction.
Even if the Bank of Japan hikes, how much can they really hike?
The Yen's safety will be contingent on not just a hike, but a more stable and decisive tightening cycle.
Also, keep a close eye on reactions to the Dollar tomorrow while Powell speaks!
USD/JPY Multi-Timeframe Analysis
Daily Chart
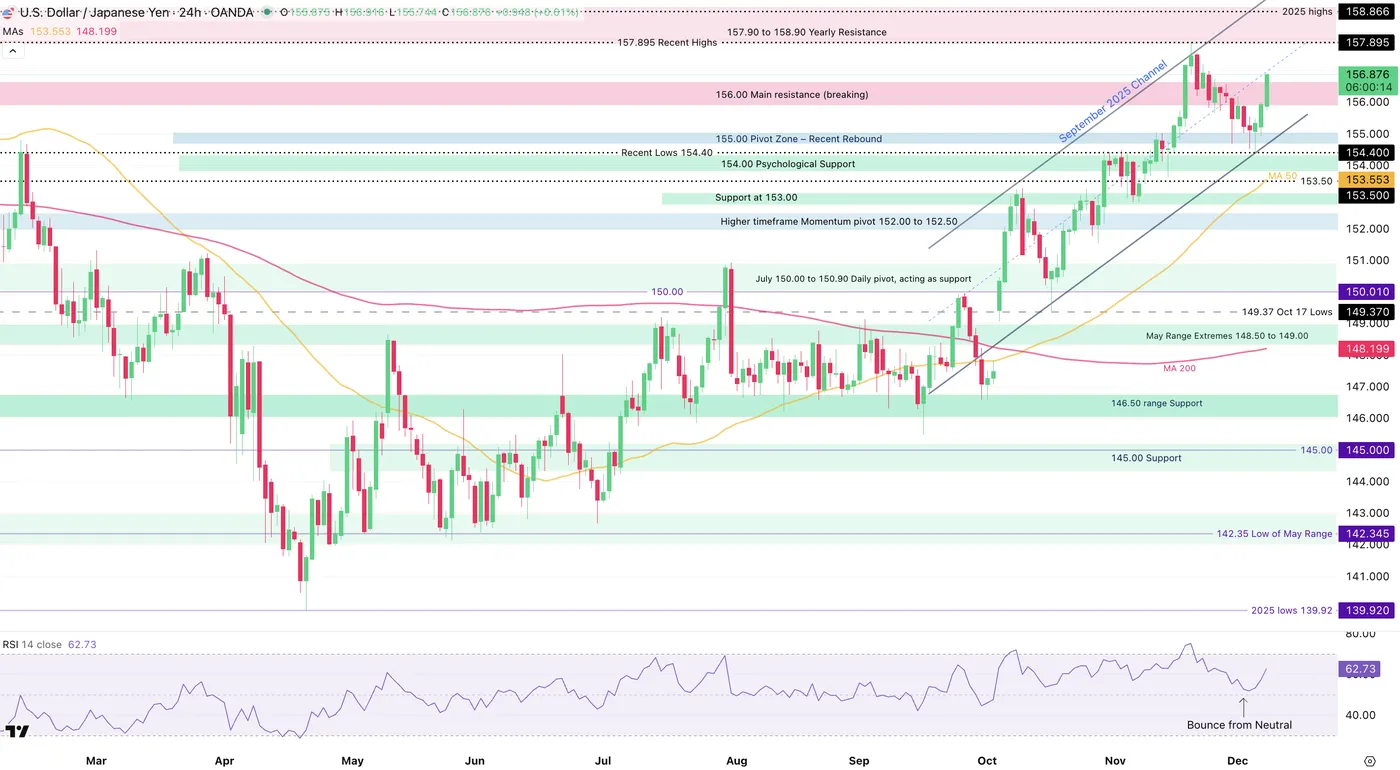
USD/JPY Daily Chart. December 9, 2025 – Source: TradingView
What was thought to have been a top in the currency pair now looks like a healthy pullback.
As the daily RSI went from overbought to neutral, bulls resurfaced strongly and are making a statement in the price action and are fully back in control.
The only way for bears to have a case here would be if a mean reversion move towards the close would bring the action back within the 156.00 to 156.750 Main resistance.
But things are not looking in this direction right now.
4H Chart and Technical Levels
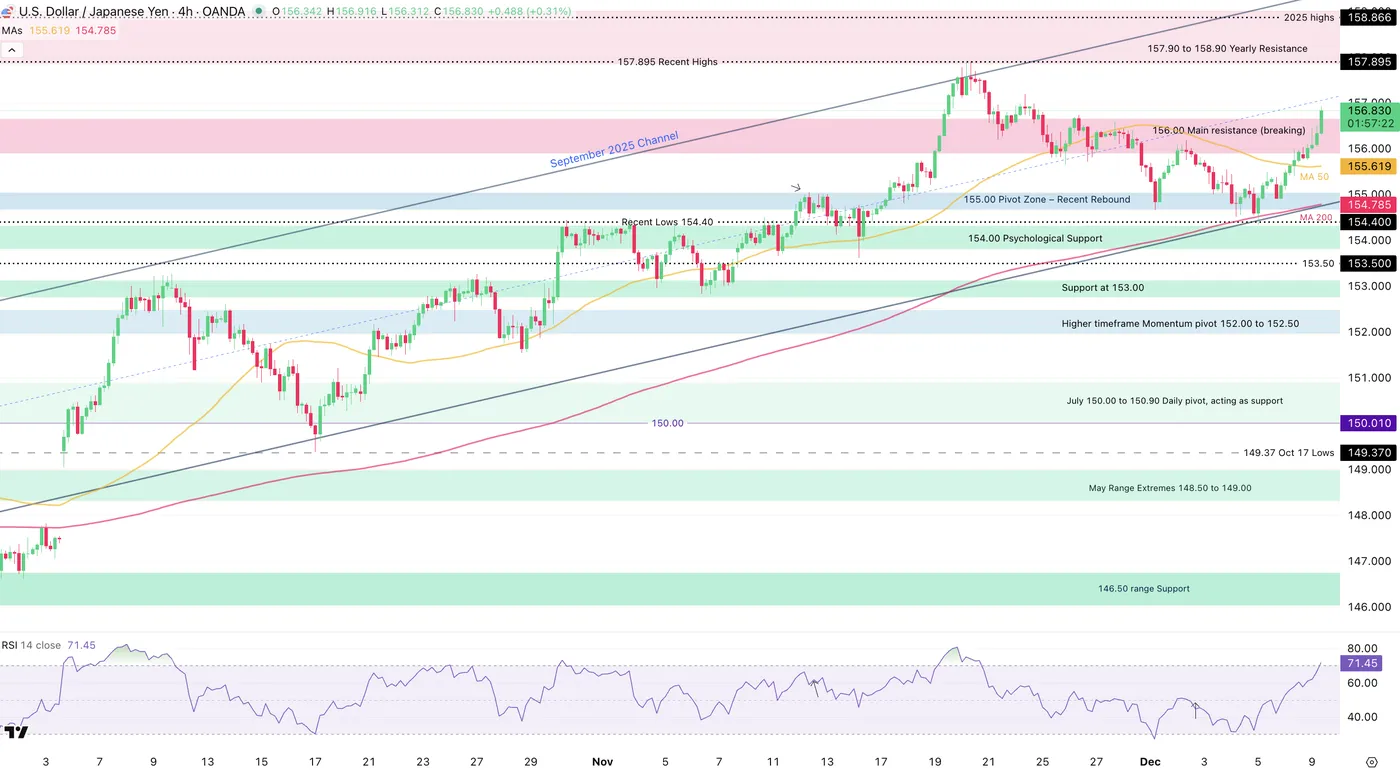
USD/JPY 4H Chart. December 9, 2025 – Source: TradingView
Look at how clean the September Channel got respected on the recent rebound.
USD/JPY technical levels of interest:
Support Levels:
- 155.00 Pivot Zone
- Recent Lows 154.40
- 154.00 Psychological Support
- 50-Day MA 153.00
- 150.00 Psychological Support and 50-Week MA
- 146.00 August Range Main Support
Resistance Levels:
- 156.00 to 156.750 Main resistance (breaking)
- 157.90 to 158.90 Yearly Resistance
- 157.895 Recent Highs
- 2025 Highs and April 2024 peaks 158.80 to 160.00
- 1990 and July 2024 Peak 161.00 to 162.00
1H Chart
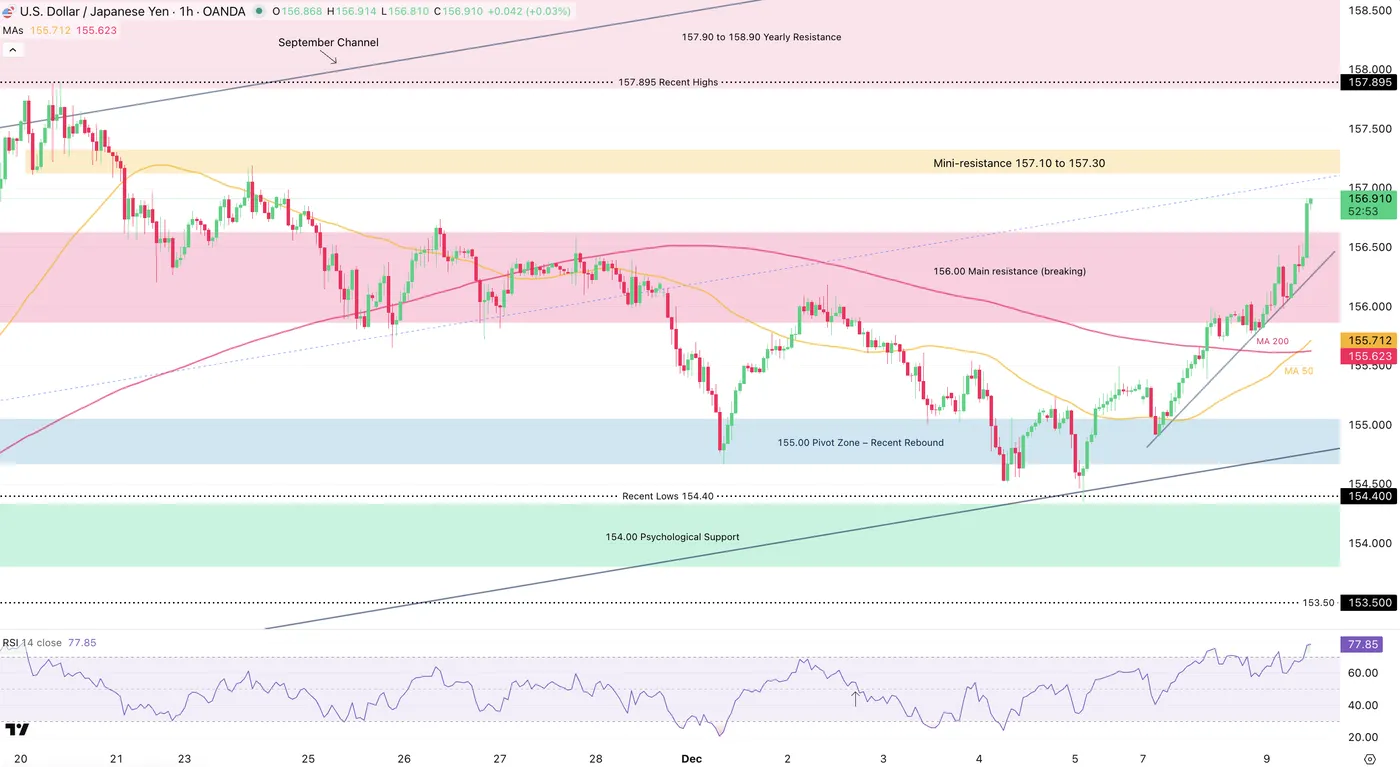
USD/JPY 1H Chart. December 9, 2025 – Source: TradingView
The current move does not look like it's about to stop.
- A mini-resistance is coming up right above 157.00 and will be one of the two final points for sellers to appear again.
- The other one naturally being 157.895, the recent highs.
Momentum is very overbought which may prompt some stoppage, but with buyers disregarding tomorrow's number, I wouldn't be surprised to see continuation here.
A big part of the longer-run outlook for the pair will be dependent on what happens at tomorrow's FOMC event.
The second most important event will be the Bank of Japan's meeting on December 19.
Don't just watch the rate decision, keep a close eye on communications from the Central Banks!
Safe Trades!
Will Gold (XAU/USD) and Silver (XAG/USD) reach new records with the FOMC?
Metals have completed yet another round of high-pace rally to new highs since the US government reopened and NY Fed’s Williams delivered his extra-dovish comments.
After hawkish fears failed to materialize into real corrections in the bullions, traders were eager to push for such squeezes yet again.
But with Gold failing to breach new all-time highs on this run, the attention is caught up in industrial metals, which have outperformed all precious peers (palladium, platinum, and gold).
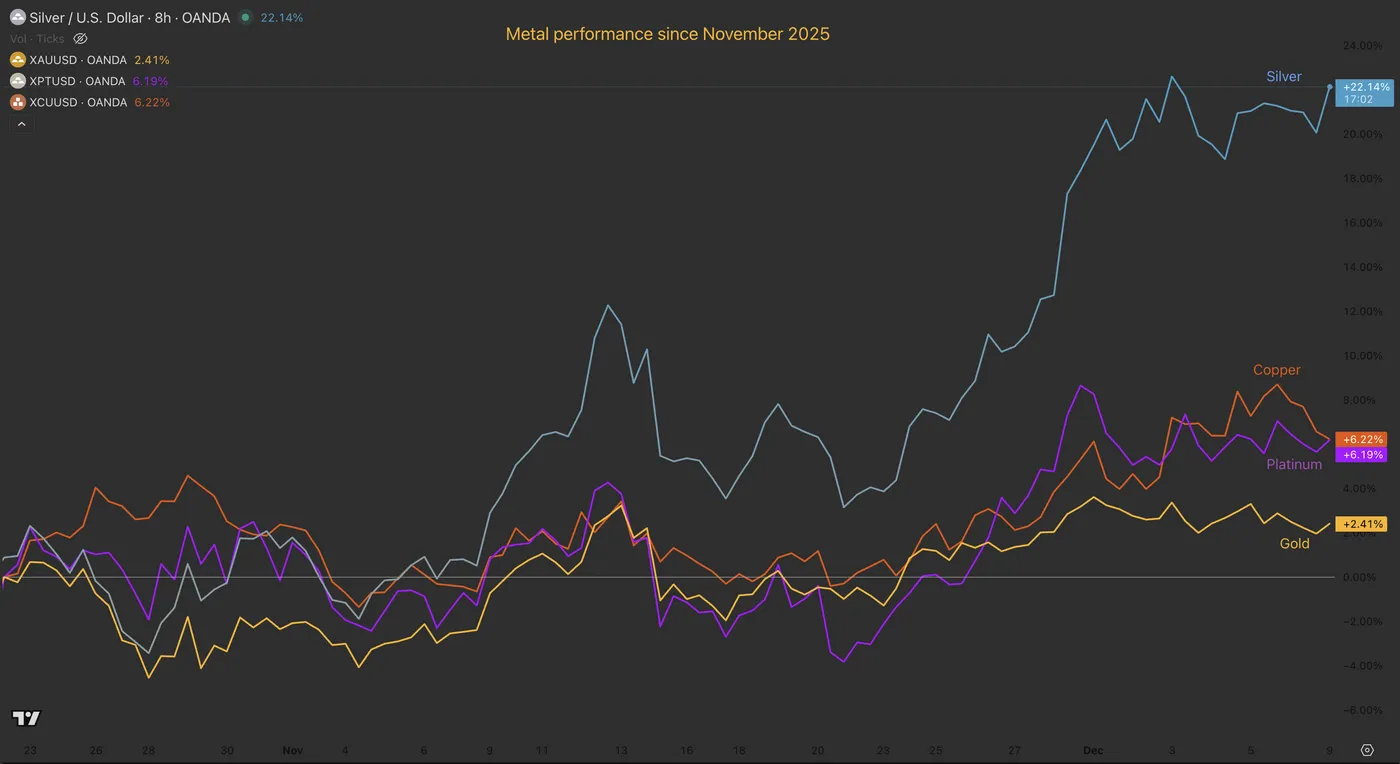
Metal Performance since Enc-October 2025. December 9, 2025 – Source: TradingView
The current leaders of the surge are Copper and Silver, which are heavily benefiting from their extreme necessity in the AI components creation and electrification megatrends.
Silver, in particular, has seen its price nearly double over the last twelve months and has recently surged to a record settlement of $59.14 an ounce.
The yellow metal is currently stuck in a narrow range and Silver keeps testing its highs. Both are awaiting tomorrow afternoon's FOMC decision before making their next definitive move. Gold’s direction will inevitably drag other metals with it.
Today's analysis will focus on a Silver intraday chart and take a look at Gold to see if the upcoming FOMC (particularly communications during the speech) has the potential to push prices higher, what could happen depending on hawkish and dovish tones, and what technical targets are now in play.
Silver (XAG/USD) 8H Chart and Technical Levels
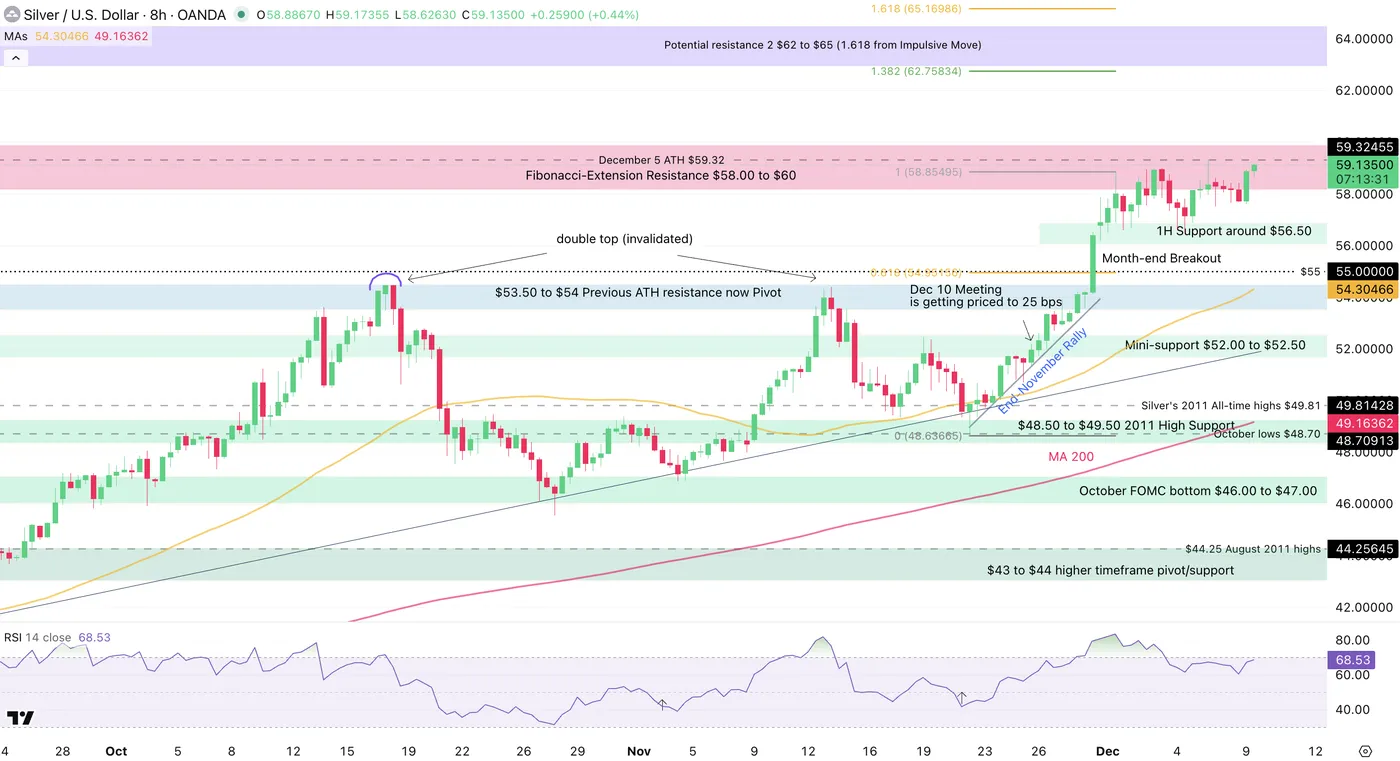
Silver (XAG/USD) 8H Chart. December 9, 2025 – Source: TradingView
Prospects for Silver were scary after last month's double-top formation.
But as seen throughout the year, when metals are racing higher while the US dollar heads lower, a general sign of currency balancing and risk-management perspectives from global Central Banks encourages the spread of further commodity demand.
Reaching some new highs last Monday, Silver has maintained its high-range consolidation throughout the entire week (between $56.60 to $58.50).
Ongoing sideways action at the highs allows overbought RSI levels to retreat while conserving higher chances of an upside breakout. Still, to keep an eye on the fundamental background, watch for these elements:
If Powell's speech (starting at 14:30 E.T. tomorrow) makes mentions of a stressed labor market picture and/or if he makes allusions to more work to be done on rates, new all-time highs can easily be expected – Silver could spike between $60–$62.
On the other hand, mentions of temporary readjustments in data, one-time reductions in labor, a "cut-and-see" approach, or anything of the sort will hurt metal demand quite harshly – a test of the previous all-time highs of $54 to $55 would make sense. If hawkish repricings see further strength, low $50s could also be visited.
Keep an eye on 2026 cuts: The more cuts, the more fuel for the "Everything rally", and vice versa.
Levels to watch for Silver (XAG) trading:
Resistance Levels:
- Fibonacci-Extension Resistance $58.00 to $60
- 2025 record $55.48
- $52 to $53 mini-resistance
- $51.18 session highs
- Potential resistance 1 $57.50 to $60 (1.382% from 2022 lows)
- Potential resistance 2 $62 to $65 (1.618 from Impulsive Move)
Support Levels:
- $48.30 to $49 support
- $47 low of potential daily channel
- $45.55 October 28 lows
- $43.00 to $45.00 Weekly pivot
- $39.50 to $40 higher timeframe support
- 2012 Highs Support around $37.50
Gold (XAU/USD) 8H Chart and technical levels
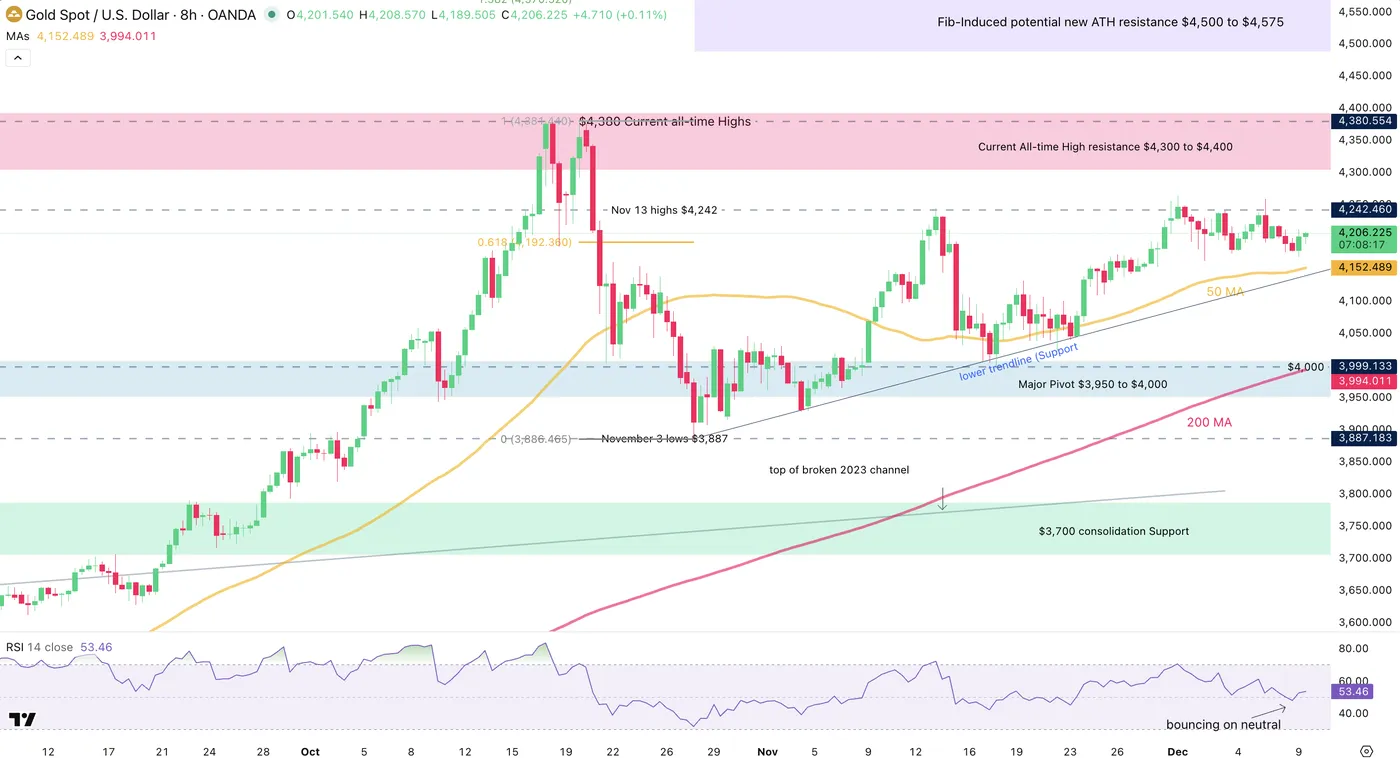
Gold (XAU/USD) 8H Chart. December 9, 2025 – Source: TradingView
Gold sacrificed some current momentum to hold a more balanced approach ahead of the FOMC.
Moving sideways since reaching some new highs in end-October, the yellow metal could be forming an ascending triangle, a very bullish pattern.
In the case of an upside break, take the leg of the triangle (its height – $250 in this pattern) and use it as a Measured Move target which could point to $4,550 in the Bullion.
Do not forget that patterns don't mean much before they play out, and for them to play out, traders will await tomorrow's meeting.
With RSI right back at neutral (and bouncing higher from there), there is space for breakouts; expect explosive price action!
Similarly to Silver (and same for all metals), the direction of the breakout will be highly dependent on Powell's tone tomorrow – The main catalyst for continuation (or reversal) for all Markets!
Levels to watch for Gold (XAU) trading:
Resistance Levels
- Current All-time High resistance $4,300 to $4,400
- Ascending triangle highs: $4,250 to $4,260
- $4,380 Current all-time Highs
- Fib-Induced potential new ATH resistance $4,500 to $4,575
Support Levels
- Support, 8H 50-period MA and Triangle bottom $4,140 to $4,150
- Major Pivot $3,950 to $4,000 (200-period MA)
- $3,700 consolidation Support
- $3,500 Major Support
Safe Trades!
US: Small Business Optimism Improves Slightly in November
The NFIB’s Small Business Optimism Index edged higher in November, rising to 99.0 from 98.2 in the previous month. Business uncertainty, meanwhile, increased modestly, with the uncertainty index rising by 3 points to 91— below the 12-month average of 94.
Of the ten subcomponents in the index, six rose during the month, one was unchanged, and three moved lower. Small businesses felt more pessimistic about the economy (-5 points) and future credit conditions (-2 points). Plans for capital outlays in the next six months also declined (-3 points). On the other hand, a greater share of businesses expected higher real sales (+9 points) and earnings (+2 points).
Labor market indicators showed a modest improvement on the month. The net share of businesses planning to increase employment rose by 4 points to 19%—the highest level since December 2024. However, actual hiring remained subdued, as the average change in employment per firm stayed negative for the sixth consecutive month. Meanwhile, the share of firms with unfilled job openings ticked up to 33% from 32% in the previous month, remaining within the range observed over the last five months and generally below its pre-pandemic average.
The net share of business owners raising average selling prices jumped by 13 points to 34%, marking the largest monthly increase in the survey’s history. Looking ahead, plans to raise prices in the next three months were unchanged. However, more businesses planned to raise workers’ compensation (+5 points to 24%).
Key Implications
Small business optimism remained relatively stable in November, despite notable improvement in the sales outlook. Labor market indicators have also shown modest progress. After taking a step back during the government shutdown, hiring intentions continued to move higher—a trend that has persisted since May—with more businesses planning to raise wages in the next three months. Still, job openings remain relatively low and have generally been on a downward trend since the start of the year, reinforcing the “low hire, low fire” theme.
Inflationary pressures intensified last month. While one month does not make a trend, the large jump in the share of businesses raising prices in November cannot be fully dismissed. Although inflation reports have been delayed by the government shutdown, prior data have shown that inflationary pressures were broadening across goods categories, and it looks like small businesses are more willing to pass those through to consumers.