Sample Category Title
How Long Can Nvidia’s Fuel Keep Market Engine Running?
I had no doubt that Nvidia was about to dump another set of impressive – and record-breaking – results. There was also very little doubt about its capacity to beat expectations. Indeed, Nvidia respected the fairly odd trend of beating the average revenue consensus by around $2bn by announcing $57bn in revenue – a 62% growth from the same time last year. Data-centre revenue surpassed the $50bn mark, and earnings per share came in higher than expected, as well.
But more impressively – yet perfectly consistent with his earlier comments – Jensen Huang said that “Blackwell sales are off the charts”. The company now expects revenue to grow to $65bn this quarter. That was higher than analysts expected, but still in line with Huang’s earlier claim that they have already sold around $500bn worth of Rubin and Blackwell chips for this year and next. In short, there was nothing in yesterday’s quarterly report that sounded off. Nvidia did what it has done best since 2023: it surprised to the upside.
And the bulls couldn’t resist. The share price jumped 5%. What might have made a difference in the market’s reaction is Huang saying that “we’ve entered the virtuous cycle of AI. The AI ecosystem is scaling fast – with more new foundation model makers, more AI startups, across more industries and in more countries. AI is going everywhere, doing everything, all at once.”
Translated into simpler terms: don’t worry about circularity; just look at the horizon.
So I believe it’s safe to say that Huang saved the day. Nasdaq futures are up nearly 2% as I write this morning, while Asian tech buddies are raving with joy: the Kospi is up around 2.5%, and the Japanese Topix is up around 2%. But SoftBank is having a hard time holding on to its gains: a reminder that not all clouds have dissipated. Anxiety about overinvestment in AI and concerns about AI-related debt keep ballooning – and for good reason. Bond issuance from Google, Amazon, Meta, Microsoft and Oracle has risen above the $100bn mark this year, at least 2.5 to 5 times previous years.
And while Nvidia sees revenues flowing in from big spenders, investors will still want to see the hyperscalers generate revenue from outside the AI circle. Let’s see how long Nvidia’s fuel keeps this market engine running.
Outside Nvidia, the news and expectations around the Federal Reserve (Fed) are not heading in the right direction – to say the least. One of yesterday’s biggest headlines was the BLS announcement that the October jobs report will not be released before the Fed’s December meeting – it will instead be published together with the November numbers, one week after the Fed’s verdict. The BLS says it wasn’t able to collect enough data due to the government shutdown – which is likely true – but if the delay also reflects numbers that look bad (a possibility, given the Trump-led drama around the BLS), then this certainly doesn’t serve the White House’s wish for lower rates.
The news that the BLS won’t publish the October jobs data – combined with uncertainty around when the October CPI will land – further smashed expectations of a 25bp cut from the Fed. Activity on Fed funds futures now suggests less than a 30% chance of a December cut. Ultimately, that’s not good for risk appetite as higher yields pull valuations down. And yields are rising. The US 2-year yield – which best captures Fed expectations – is consolidating above 3.60% this morning, while the 10-year sits near 4.14%.
The US dollar surged past its 200-DMA on the back of waning dovish Fed expectations and is extending gains in Asia today. And – though it will feel like a weather forecast from last month – September jobs data from the US will be worth watching. A Bloomberg consensus suggests the economy may have added 53k jobs in September, before the shutdown.
But a softer or stronger number is unlikely to reverse the “no-cut” expectation, as the FOMC minutes yesterday confirmed that “many” Fed members think it would be better to keep rates where they are in December. So expect further upside in US yields.
Speaking of yields, the sell-off in Japanese bonds continues at full speed. The 30-year JGB yield is testing 3.40% this morning, while the 10-year has hit 1.84%. Rising yields in Japan – which could encourage Japanese pension funds to repatriate funds – also pull the rug from under US Treasuries at a time when confidence and appetite for US government debt are already waning due to ballooning deficits and deteriorating US relations with the rest of the world. As Japanese yields rise, so does the risk of reverse carry trades. And I don’t need to tell you how bad a reverse carry is for global equities. It could trigger a 10–15% sell-off in the S&P 500 in a matter of weeks. This is one of the biggest risks to the year-end market rally.
Because we always want to go one step further: the vanishing yen carry trade, and the end of Japan’s era of free liquidity, could eventually be replaced by a newcomer. And that newcomer could be China.
What allowed Japan to print endless free money was its long battle against deflation. Now it’s China fighting deflation – along with an ageing population and a property crisis. And guess what: the Chinese 10-year yield has just dipped below the Japanese 10-year yield.
In other words, the world’s favourite funding currency may be quietly changing hands.
If China keeps easing while the rest of the world tightens or normalises, markets may soon discover a new source of “free liquidity”, rerouting capital flows and rewriting familiar carry-trade dynamics.
It’s early days, but the seeds of a China-funded carry era are clearly being planted — and investors are already watching for the first shoots.
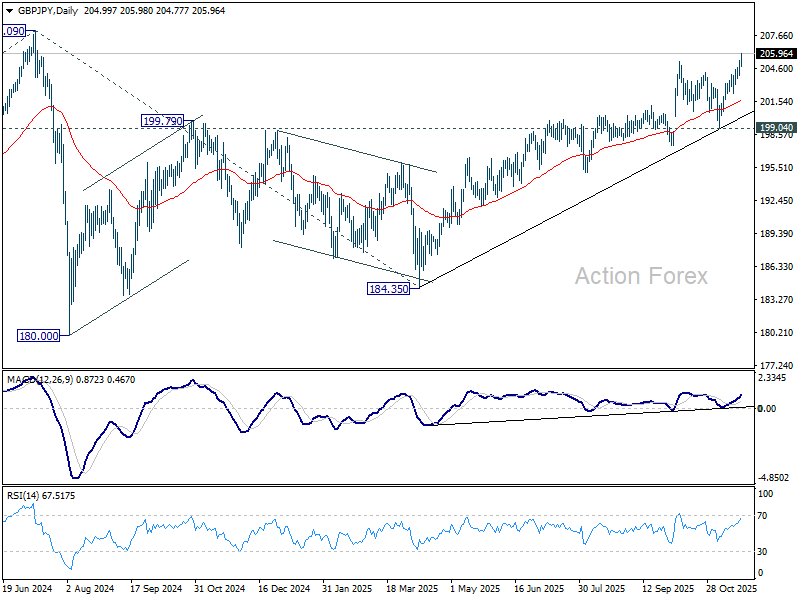
GBP/JPY Daily Outlook
Daily Pivots: (S1) 204.36; (P) 204.86; (R1) 205.75; More...
GBP/JPY's rise from 184.35 resumed by breaking through 205.30 and intraday bias stays on the upside for 208.09 high. Decisive break there will confirm long term up trend resumption. On the downside, below 204.70 minor support will turn intraday bias neutral and bring consolidations first, before staging another rally.
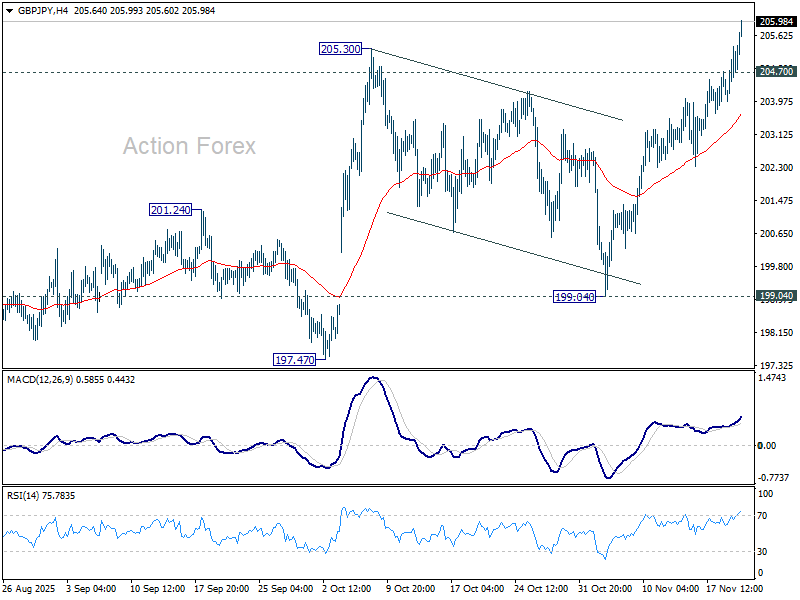
In the bigger picture, price actions from 208.09 (2024 high) are seen as a corrective pattern which might have completed at 184.35. Firm break of 208.09 high will resume the up trend from 123.94 (2020 low). Next target is 61.8% projection of 148.93 to 208.09 from 184.35 at 220.90. However, decisive break of 199.04 support will dampen this view and extend the corrective pattern with another fall.
EUR/JPY Daily Outlook
Daily Pivots: (S1) 180.29; (P) 180.82; (R1) 181.87; More...
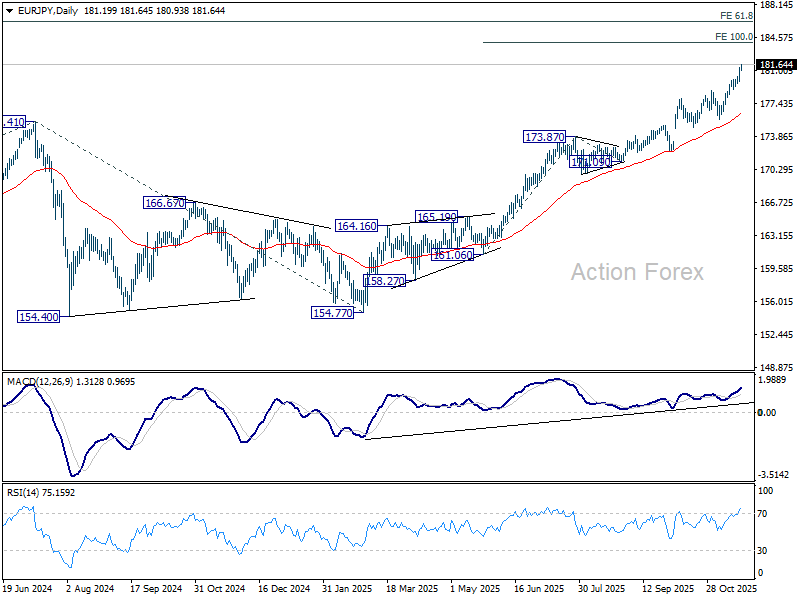
Intraday bias in EUR/JPY remains on the upside for the moment. Current up trend should target 100% projection of 161.06 to 173.87 from 171.09 at 183.90. Firm break there will target 186.31 projection level next. On the downside, below 180.26 minor support will turn bias neutral and bring consolidations first, before staging another rise.
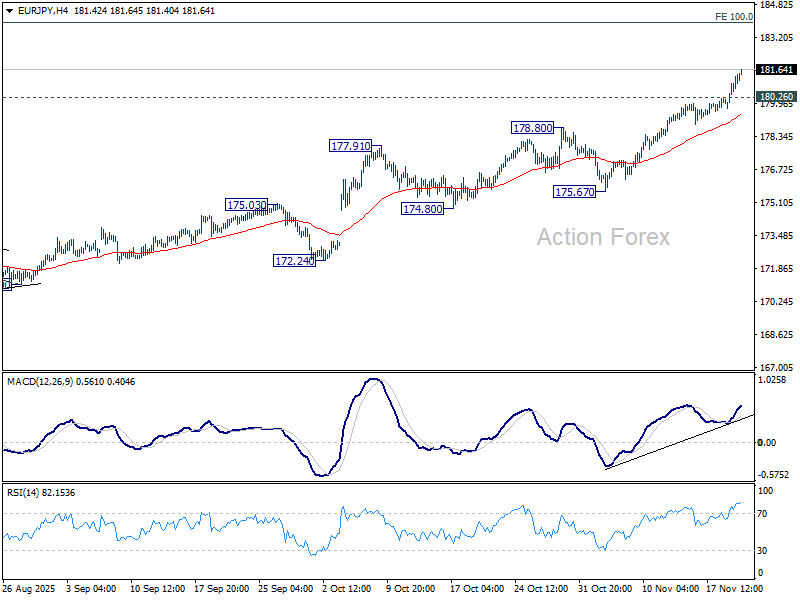
In the bigger picture, up trend from 114.42 (2020 low) is in progress and should target 61.8% projection of 124.37 to 175.41 from 154.77 at 186.31. Outlook will continue to stay bullish as long as 55 W EMA (now at 169.00) holds, even in case of deep pullback.
EUR/GBP Daily Outlook
Daily Pivots: (S1) 0.8812; (P) 0.8826; (R1) 0.8849; More…
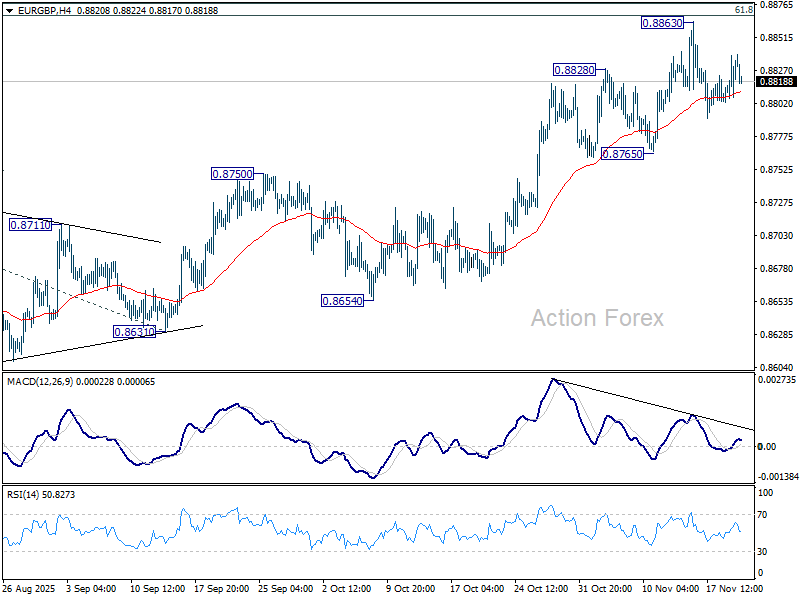
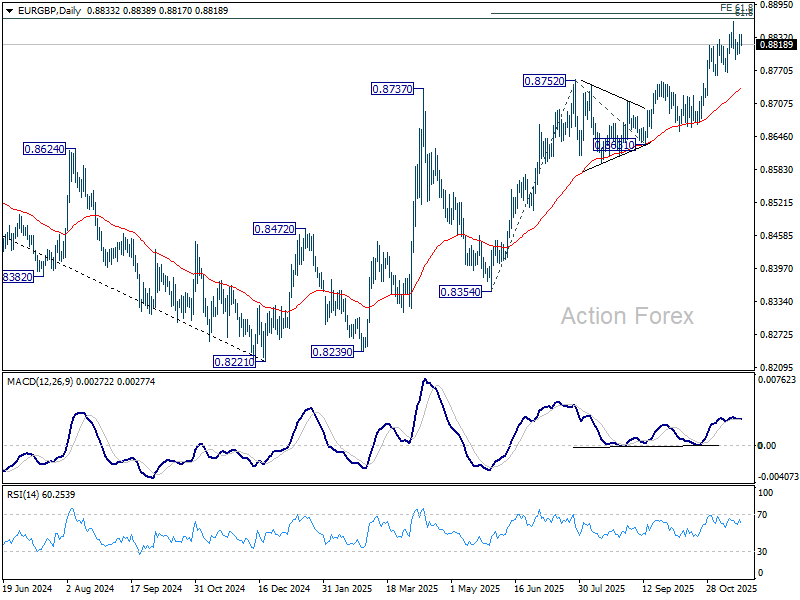
Range trading continues below 0.8863 and intraday bias stays neutral in EUR/GBP. Considering bearish divergence condition in 4H MACD, firm break of 0.8765 support will confirm short term topping. Deeper fall should then be seen back to 55 D EMA (now at 0.8737) even still as a correction. On the upside, however, sustained trading above 0.8867 fibonacci level will carry larger bullish implications. Next near term target will be 100% projection of 0.8354 to 0.8752 from 0.8631 at 0.9029.
In the bigger picture, rise from 0.8221 medium term bottom is still seen as a corrective move. Upside should be limited by 61.8% retracement of 0.9267 to 0.8221 at 0.8867. Sustained trading below 55 W EMA (now at 0.8589) should confirm that this corrective bounce has completed. However, decisive break of 0.8867 will suggest that EUR/GBP is already reversing whole decline from 0.9267 (2022 high). That should pave the way back to 0.9267.
EUR/AUD Daily Outlook
Daily Pivots: (S1) 1.7763; (P) 1.7824; (R1) 1.7865; More...
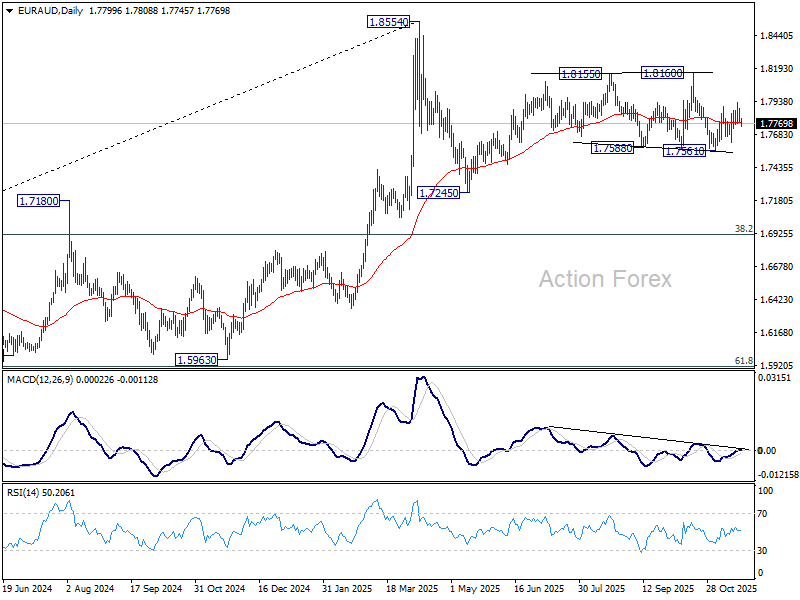
Intraday bias in EUR/AUD is turned neutral again with current retreat. On the upside, above 1.7934 will bring stronger rally towards 1.8160 resistance. On the downside, break of 1.7627 will turn bias back to the downside for 1.7561 support instead. Overall, EUR/AUD is extending a medium term corrective pattern and the next move will depend on the breakout from 1.7561/8160 range.
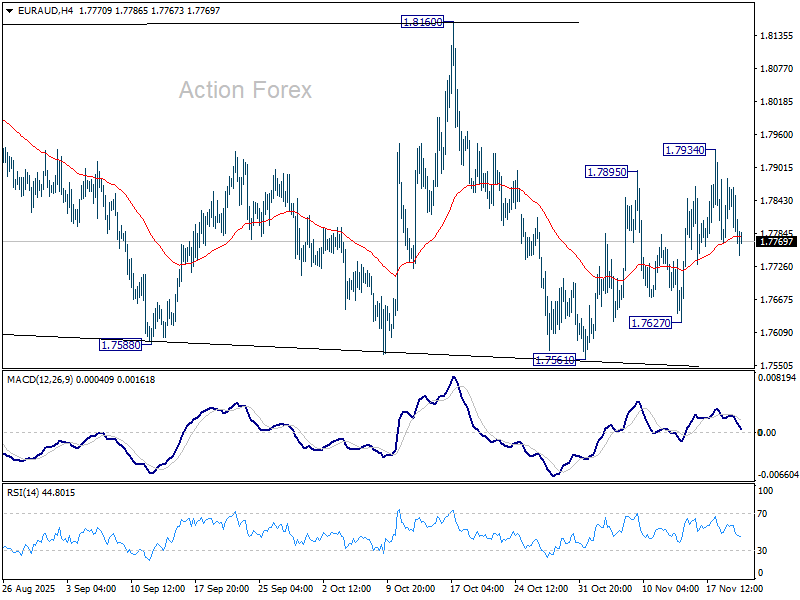
In the bigger picture, price actions from 1.8554 medium term top are seen as a corrective pattern. Sustained break of 55 W EMA (now at 1.7426) will suggest that it's correcting the whole rally from 1.4281 (2022 low). In this case, deeper decline would be seen to 38.2% retracement of 1.4281 to 1.8554 at 1.6922. Nevertheless, strong rebound from 55 W EMA will likely bring resumption of the up trend sooner.
EUR/CHF Daily Outlook
Daily Pivots: (S1) 0.9267; (P) 0.9281; (R1) 0.9310; More....
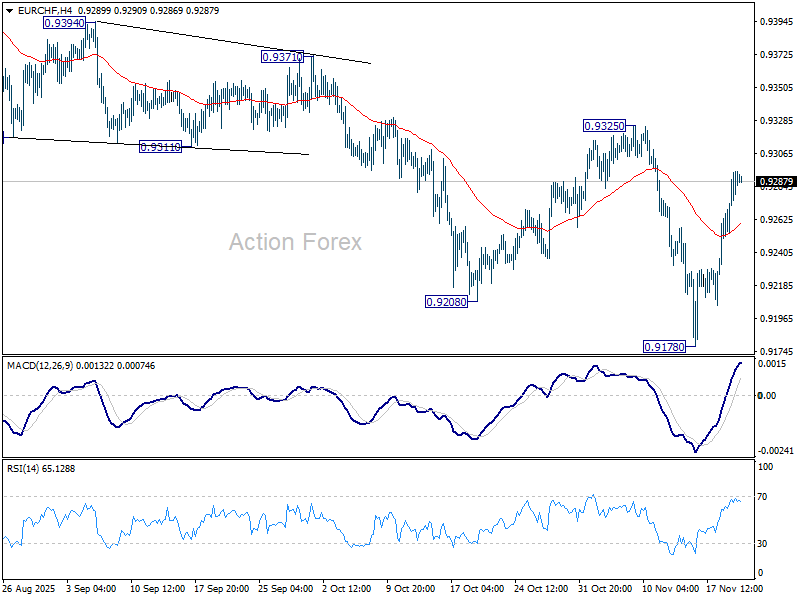
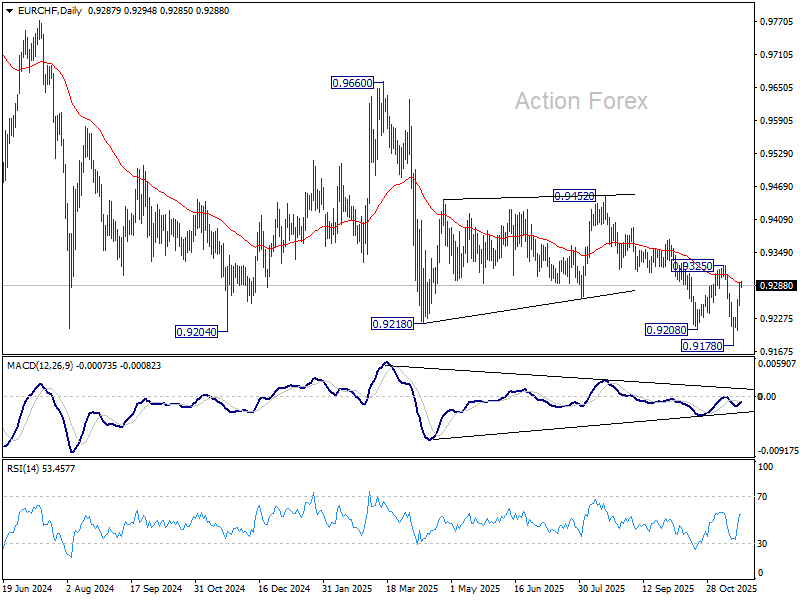
Intraday bias in EUR/CHF remains neutral first and more sideway trading could be seen. Still, outlook will remain bearish as long as 0.9325 resistance holds. Firm break of 0.9178 will resume larger down trend. However, break of 0.9325 will bring stronger rally back towards 0.9452 resistance.
In the bigger picture, outlook remains bearish with EUR/CHF staying well inside long term falling channel after multiple rejection by 55 W EMA (now at 0.9377). Next target is 61.8% projection of 1.1149 to 0.9407 from 0.9928 at 0.8851. Break of 0.9452 resistance is needed to be the first sign of medium term bottoming. Otherwise, outlook will stay bearish in case of strong rebound.
AUD/USD Daily Report
Daily Pivots: (S1) 0.6449; (P) 0.6481; (R1) 0.6511; More...
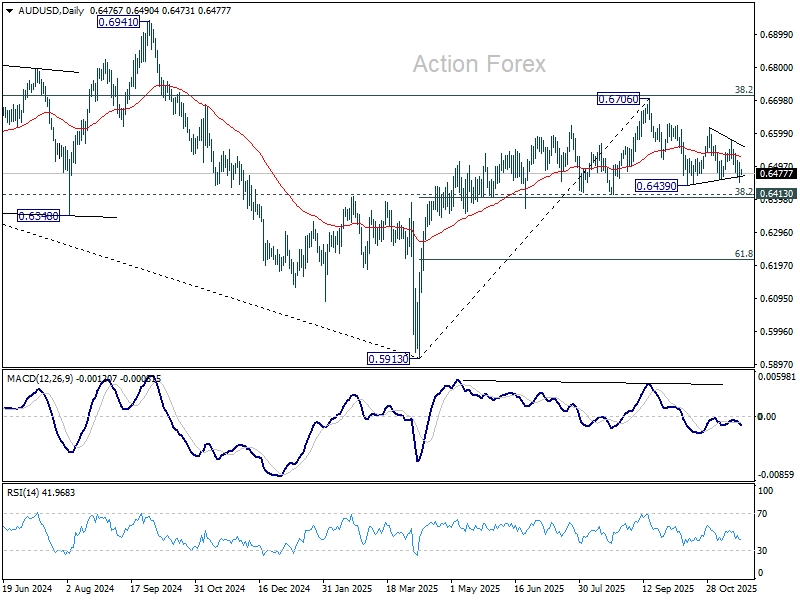
Intraday bias in AUD/USD is back on the downside with breach of 0.6457 support. Deeper fall would be seen to 0.6413 cluster (38.2% retracement of 0.5913 to 0.6706 at 0.6403). Decisive break there will carry larger bearish implications. On the upside, above 0.6517 minor resistance will turn intraday bias neutral again first.
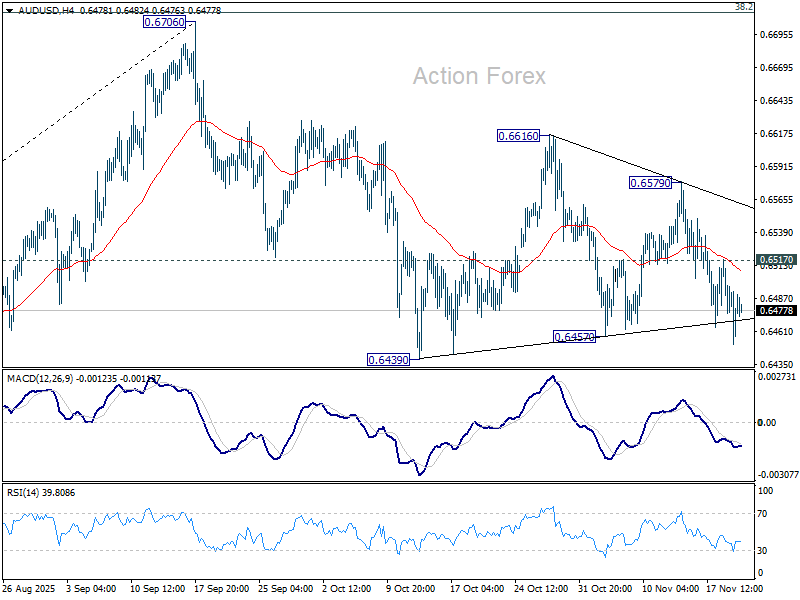
In the bigger picture, there is no clear sign that down trend from 0.8006 (2021 high) has completed. Rebound from 0.5913 is seen as a corrective move. Outlook will remain bearish as long as 38.2% retracement of 0.8006 to 0.5913 at 0.6713 holds. Break of 0.6413 support will suggest rejection by 0.6713 and solidify this bearish case. Nevertheless, considering bullish convergence condition in W MACD, sustained break of 0.6713 will be a strong sign of bullish trend reversal, and pave the way to 0.6941 structural resistance for confirmation.
USD/CAD Daily Outlook
Daily Pivots: (S1) 1.4000; (P) 1.4033; (R1) 1.4082; More...
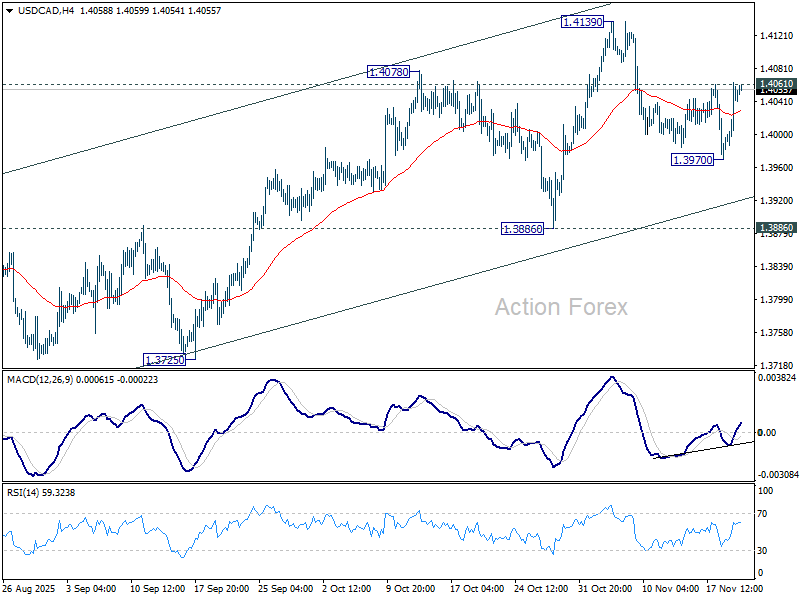
Intraday bias in USD/CAD is turned neutral again with current recovery. On the upside, firm break of 1.4061 resistance will indicate that pullback from 1.4139 has already completed, and bring stronger rally to retest this high. Nevertheless, break of 1.3970 will extend the pullback towards 1.3886 support. Strong rebound should be seen there to preserve the whole rally from 1.3538.
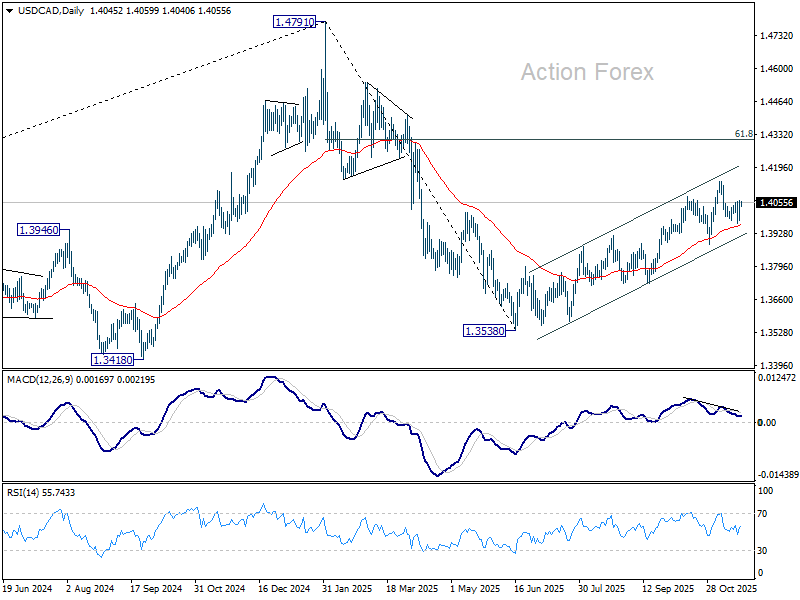
In the bigger picture, price actions from 1.4791 medium term top is likely just unfolding as a correction to up trend from 1.2005 (2021 low), with rise from 1.3538 as the second leg. A third leg should follow before up trend resumption. That is, range trading is set to extend for the medium term. For now, this will remain the favored case as long as 1.3886 support holds. However, firm break of 1.3886 will revive the case that fall from 1.4791 is indeed a larger scale correction.
EUR/USD Daily Outlook
Daily Pivots: (S1) 1.1505; (P) 1.1551; (R1) 1.1584; More…
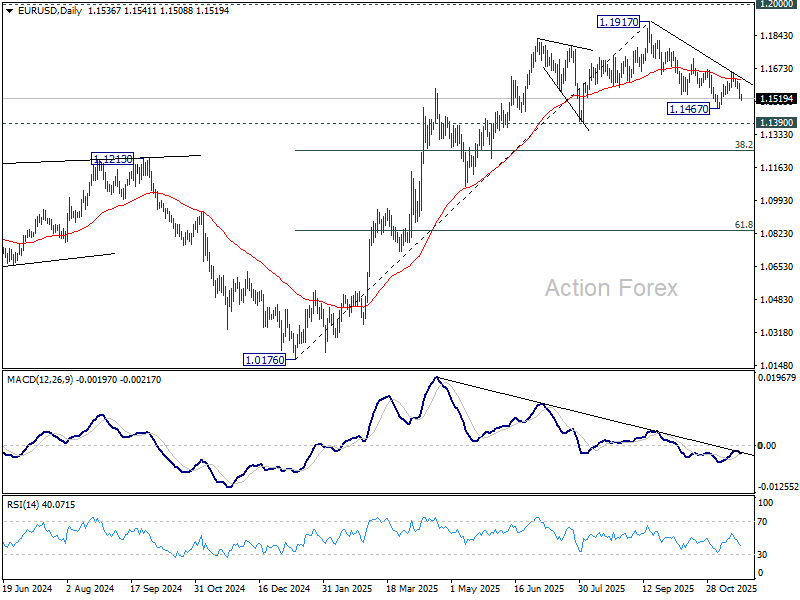
EUR/USD's break of 1.5610 support suggests that recovery from 1.1467 has completed at 1.1655. More importantly, fall from 1.1917 is still in progress. Intraday bias is back on the downside for 1.1467 first. Firm break there will target 1.1390, and then 38.2% retracement of 1.0176 to 1.1917 at 1.1252. For now, risk will stay on the downside as long as 1.1655 resistance holds, in case of recovery.
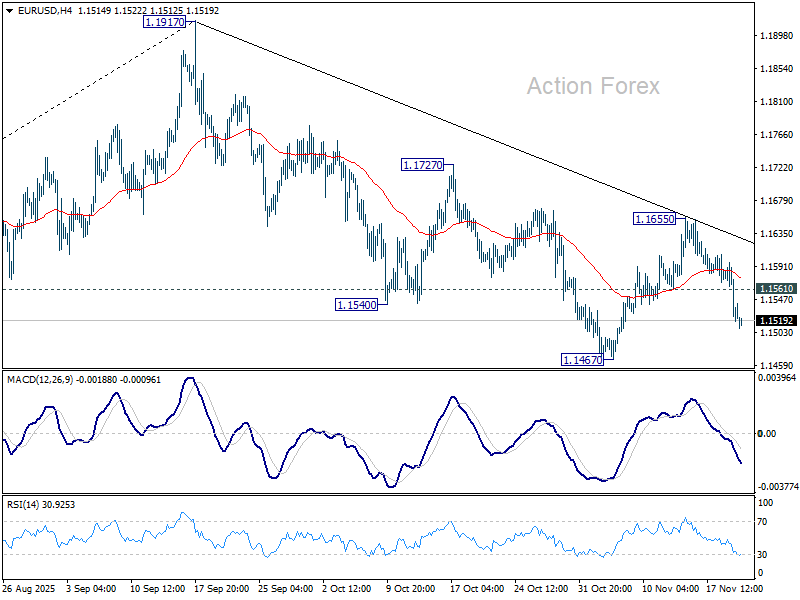
In the bigger picture, considering bearish divergence condition in D MACD, a medium term top is likely in place at 1.1917, just ahead of 1.2 key psychological level. As long as 55 W EMA (now at 1.1328) holds, the up trend from 0.9534 (2022 low) is still in favor to continue. Decisive break of 1.2000 will carry larger bullish implications. However, sustained trading below 55 W EMA will argue that rise from 0.9534 has completed as a three wave corrective bounce, and keep long term outlook bearish.
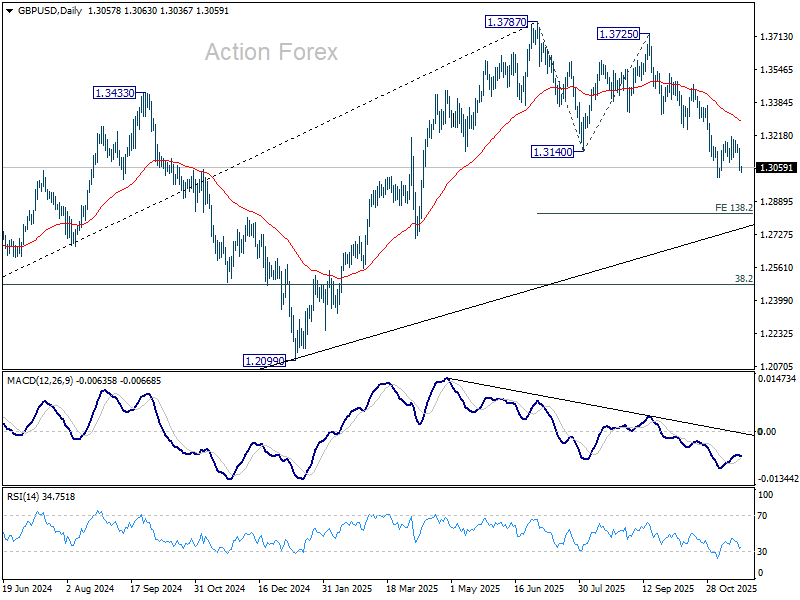
GBP/USD Daily Outlook
Daily Pivots: (S1) 1.3018; (P) 1.3087; (R1) 1.3129; More...
GBP/USD dips further today but it stays above 1.3008 support. Intraday bias remains neutral and outlook is unchanged. Further decline is expected as long as 1.3247 support turned resistance holds. Break of 1.3008 will resume the fall from 1.3787, and target 138.2% projection of 1.3787 to 1.3140 from 1.3725 at 1.2831. Nevertheless, firm break of 1.3247 will suggest that fall from 1.3787 has completed as a corrective move already.
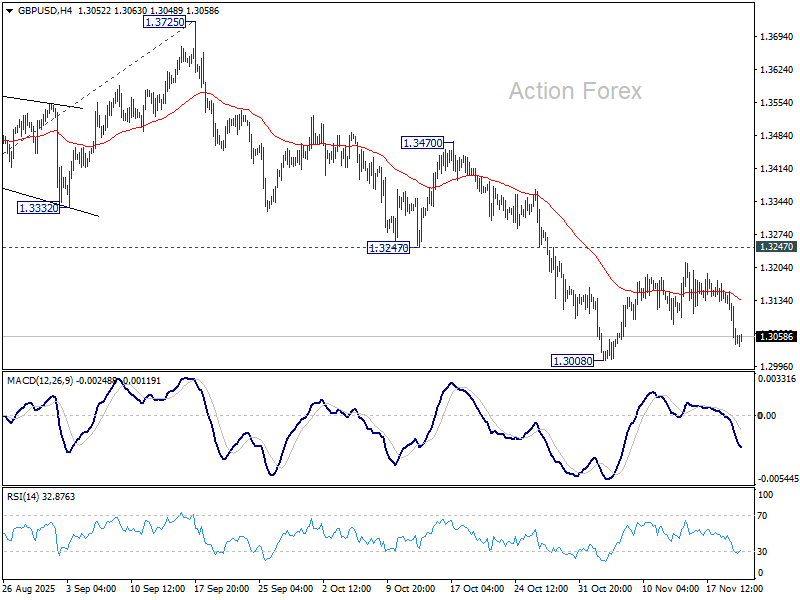
In the bigger picture, the break of 55 W EMA (now at 1.3182) is taken as the first sign that corrective rise from 1.0351 (2022 low) has completed. Decisive break of trend line support (now at 1.2824) will solidify this case and target 38.2% retracement of 1.0351 to 1.3787 at 1.2474 next. Meanwhile, in case of another rise, strong resistance should emerge below 1.4248 (2021 high) to cap upside to preserve the long term down trend.